
 Open Access Article
 This Open Access Article is licensed under a Creative Commons Attribution-Non Commercial 3.0 Unported Licence
Vesicle–micelle transitions driven by ROS, light and heat
Sai Nikhil
Subraveti
a,
Morine G.
Nader
a,
Pedram
AziziHariri
 b,
Vijay T.
John
b,
Narottam
Lamichhane
*c and
Srinivasa R.
Raghavan
*a
b,
Vijay T.
John
b,
Narottam
Lamichhane
*c and
Srinivasa R.
Raghavan
*a
aDepartment of Chemical & Biomolecular Engineering, University of Maryland, College Park, Maryland 20742, USA. E-mail: sraghava@umd.edu
bDepartment of Chemical & Biomolecular Engineering, Tulane University, New Orleans, LA 70118, USA
cDepartment of Radiation Oncology, University of Maryland School of Medicine, Baltimore, Maryland 21201, USA. E-mail: NaruLamichhane@umm.edu
First published on 29th August 2024
Abstract
Vesicles are self-assembled nanocontainers (size ∼100 nm) in which solutes such as drugs can be encapsulated. There is great interest in triggering vesicle–micelle transitions (VMTs) because such transitions will result in the release of encapsulated solute. Here, we focus on reactive oxygen species (ROS) as a trigger for VMTs. ROS arise in our body within cells, and ROS levels are known to be high near a tumor. Thus, ROS-responsive vesicles are of interest. We make such vesicles by combining the cationic amphiphile (4-phenylthiophenyl)diphenyl-sulfonium triflate (PDST), and the anionic surfactant sodium dodecylbenzene sulfonate (SDBS). By simply mixing these two commercially available molecules in water, we prepare ‘catanionic’ vesicles in an easy, low-cost, and scalable way. When exposed to ROS such as hydrogen peroxide (H2O2), the thioether in the PDST tail gets oxidized to a hydrophilic sulfoxide. As a result, the vesicles are transformed into spherical or short, cylindrical micelles. Evidence for the VMT comes from turbidity, light scattering, and cryo-TEM measurements. The same vesicles are also sensitive to other stimuli, specifically light and temperature: i.e., a VMT can also be induced by irradiation with UV light or heating above a critical temperature. We explain the origin of the VMT in each case based on changes in the driving forces for amphiphile assembly.
Introduction
The self-assembly of amphiphilic molecules (surfactants and lipids) in water can lead to different nanoscale structures.1,2 This paper is concerned with two such nanostructures, viz. vesicles and micelles (Fig. 1). Vesicles have sizes ∼100 nm with an aqueous core surrounded by a bilayer of the amphiphiles (∼5 nm thick). Micelles, specifically spherical micelles, have sizes ∼5 nm and have a hydrophobic core. Amphiphiles that form vesicles generally have a cylindrical geometry (Fig. 1A).1,2 The hydrophilic heads of the amphiphiles are in contact with water on either side of the bilayer, whereas the hydrophobic tails are all pointed towards the center of the bilayer. On the other hand, amphiphiles that form spherical micelles have a cone-shaped geometry (Fig. 1B).1,2 Their tails are directed towards the center of the micelle, which is why the micelle core is hydrophobic. The focus of this paper is on spontaneous vesicle–micelle transitions (VMTs). Vesicles can encapsulate solutes such as drugs, cosmetic agents, or agrochemicals in their aqueous core.3–5 If vesicles are converted to micelles, the solutes in their cores will be released in a burst. This ability to switch on the release of solute is why researchers are interested in VMTs.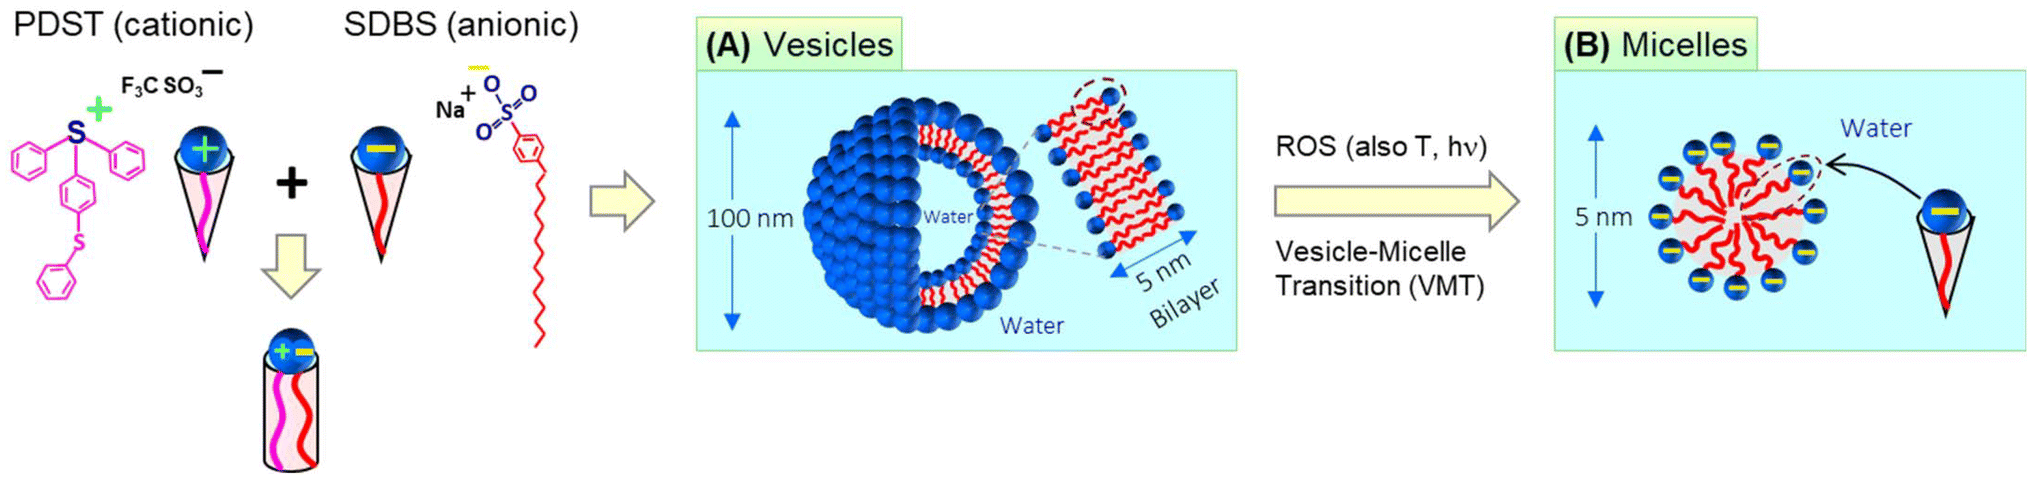 | ||
| Fig. 1 Concept behind this study: vesicle–micelle transitions (VMTs) induced by ROS, heat, and light. The cationic amphiphile PDST and the anionic surfactant SDBS are combined to produce the vesicles. Each molecule has a cone-like geometry, but their mixtures are cylinder-shaped (due to electrostatic binding of their heads). Self-assembly leads to “catanionic” vesicles with sizes ∼100 nm (A). Each vesicle has a 5 nm-thick bilayer membrane enclosing an aqueous core. When contacted with ROS, the vesicles undergo a VMT (B). The resulting micelles are ∼5 nm in size and have a hydrophobic core. A VMT can also be induced by heat as well as irradiation with UV light. | ||
Historically, VMTs have been shown to be induced by stimuli such as pH,6–8 temperature,9–12 and light.13,14 The underlying idea has been to use these stimuli to alter the geometry of the surfactant. If the surfactant is initially shaped like a cylinder and a stimulus changes this shape to a cone, then the surfactants will spontaneously rearrange from vesicles to micelles (see the schematics in Fig. 1).1,2 The focus of this paper is on an additional stimulus that is gaining importance, which is reactive oxygen species (ROS).15–18 ROS are species that contain oxygen in a reactive form and include the hydroxyl radical (˙OH), superoxide (O2−), and singlet oxygen (1O2). In living organisms, ROS are routinely generated at low levels in all cells. They mediate physiological processes including the pathways for cell-survival and cell-death (apoptosis).15,16 Increased levels of ROS are often observed locally in tumor microenvironments compared to normal tissues. Consequently, materials that respond to ROS could be useful for targeting tumors and thereby for cancer treatment.17,18 In the lab, ROS can be generated in solution by chemicals such as hydrogen peroxide (H2O2) or by irradiation of photosensitizers.
How to create ROS-responsive vesicles? To make molecules or structures responsive to ROS, researchers have exploited functional groups such as thioether, thioketal, and arylboronic ester, or heavy elements such as selenium and tellurium.17–24 For example, in a recent study, Guo et al.22 synthesized a selenium-bearing surfactant and used it to form vesicles. They were then able to induce a VMT upon contact with ROS. Only a few other articles have been published on ROS-responsive vesicles and all of them have custom-synthesized a surfactant, polymer, or porphyrin derivative.17–24 Such synthesis requires complex procedures and rigorous knowledge of organic chemistry. Instead, is it possible to create ROS-responsive vesicles in a simpler way using just molecules that are commercially available and quite inexpensive? That is the motivation behind this study.
Here, we combine two commercially available amphiphiles and show that they form vesicles that are responsive to ROS. The two molecules are the cationic amphiphile (4-phenylthiophenyl)diphenyl-sulfonium triflate (PDST) and the anionic surfactant sodium dodecyl benzene sulfonate (SDBS). PDST is used as a photoinitiator for some polymerizations of monomers (e.g., with epoxy or vinyl ether groups) induced by ultraviolet (UV) light.25 We noted from the structure of PDST (Fig. 1) that it is amphiphilic, i.e., that there is a distinct separation of its hydrophilic (sulfonium) head and hydrophobic part (connected aromatic rings). However, to our knowledge, PDST has not been employed in any studies as an amphiphile. On the other hand, SDBS is a common surfactant used in cleaning products and it also has been the subject of numerous academic studies.26–28 Our rationale in selecting PDST was that it has a thioether (sulfide) group, which is one of the most studied groups for ROS-sensitivity. We therefore hypothesized that, if vesicles could be formed from PDST, they would be responsive to ROS.
PDST and SDBS, being single-tailed amphiphiles, do not form vesicles on their own—they either remain insoluble or form micelles. To obtain vesicles, we exploit the idea that mixtures of single-tailed cationic and anionic amphiphiles can assemble into ‘catanionic vesicles’ when combined in certain ratios.26–28 While PDST and SDBS each have a cone shape, their combinations (e.g., 20/80 PDST/SDBS) can have a net cylindrical shape (Fig. 1) due to binding of the oppositely charged heads. The cylindrical shape leads to unilamellar vesicles, which are extremely stable for long times. We further show that these vesicles are indeed responsive to ROS (via H2O2)—they get transformed into small micelles (Fig. 1). The mechanism for this VMT is that the thioether in the PDST tail gets oxidized to a hydrophilic sulfoxide or sulfone; thus, the tail is no longer hydrophobic and PDST loses its amphiphilicity. Interestingly, the above vesicles are also responsive to light and temperature—i.e., a VMT can also be induced by irradiation with UV light or heating above a critical temperature. We will explain the origin of the VMT in each case based on changes in the driving forces for amphiphiles to assemble into nanostructures.
Results and discussion
Phase behavior of PDST–SDBS mixtures
We first assess the phases present in mixtures of PDST and SDBS at a total concentration of 1% by weight (Fig. 2). All samples are made in a phosphate buffer so that a stable pH of 7.4 is maintained. Photos of samples at different weight ratios of PDST![[thin space (1/6-em)]](https://www.rsc.org/images/entities/char_2009.gif) :SDBS are shown in Fig. 2A. Samples from 1:9 to 5:5 are bluish (turbid), which is indicative of light scattering from colloidal structures present (Tyndall effect).9,29 Above the 5:5 ratio, the samples are phase-separated: a white precipitate can be seen at the bottom of the vials and this coexists with a clear supernatant. The phase-separation occurs because PDST is a rather hydrophobic molecule (Fig. 1). PDST does not dissolve in water and it is not expected to form micelles on its own (for this reason, it is better to term PDST a ‘hydrotrope’30–33 rather than a ‘surfactant’). However, when PDST is added to water along with a surfactant like SDBS (with the SDBS fraction being 50% or greater), it does dissolve.33 This is why we see a single-phase up to 5:5 in Fig. 2A.
:SDBS are shown in Fig. 2A. Samples from 1:9 to 5:5 are bluish (turbid), which is indicative of light scattering from colloidal structures present (Tyndall effect).9,29 Above the 5:5 ratio, the samples are phase-separated: a white precipitate can be seen at the bottom of the vials and this coexists with a clear supernatant. The phase-separation occurs because PDST is a rather hydrophobic molecule (Fig. 1). PDST does not dissolve in water and it is not expected to form micelles on its own (for this reason, it is better to term PDST a ‘hydrotrope’30–33 rather than a ‘surfactant’). However, when PDST is added to water along with a surfactant like SDBS (with the SDBS fraction being 50% or greater), it does dissolve.33 This is why we see a single-phase up to 5:5 in Fig. 2A.
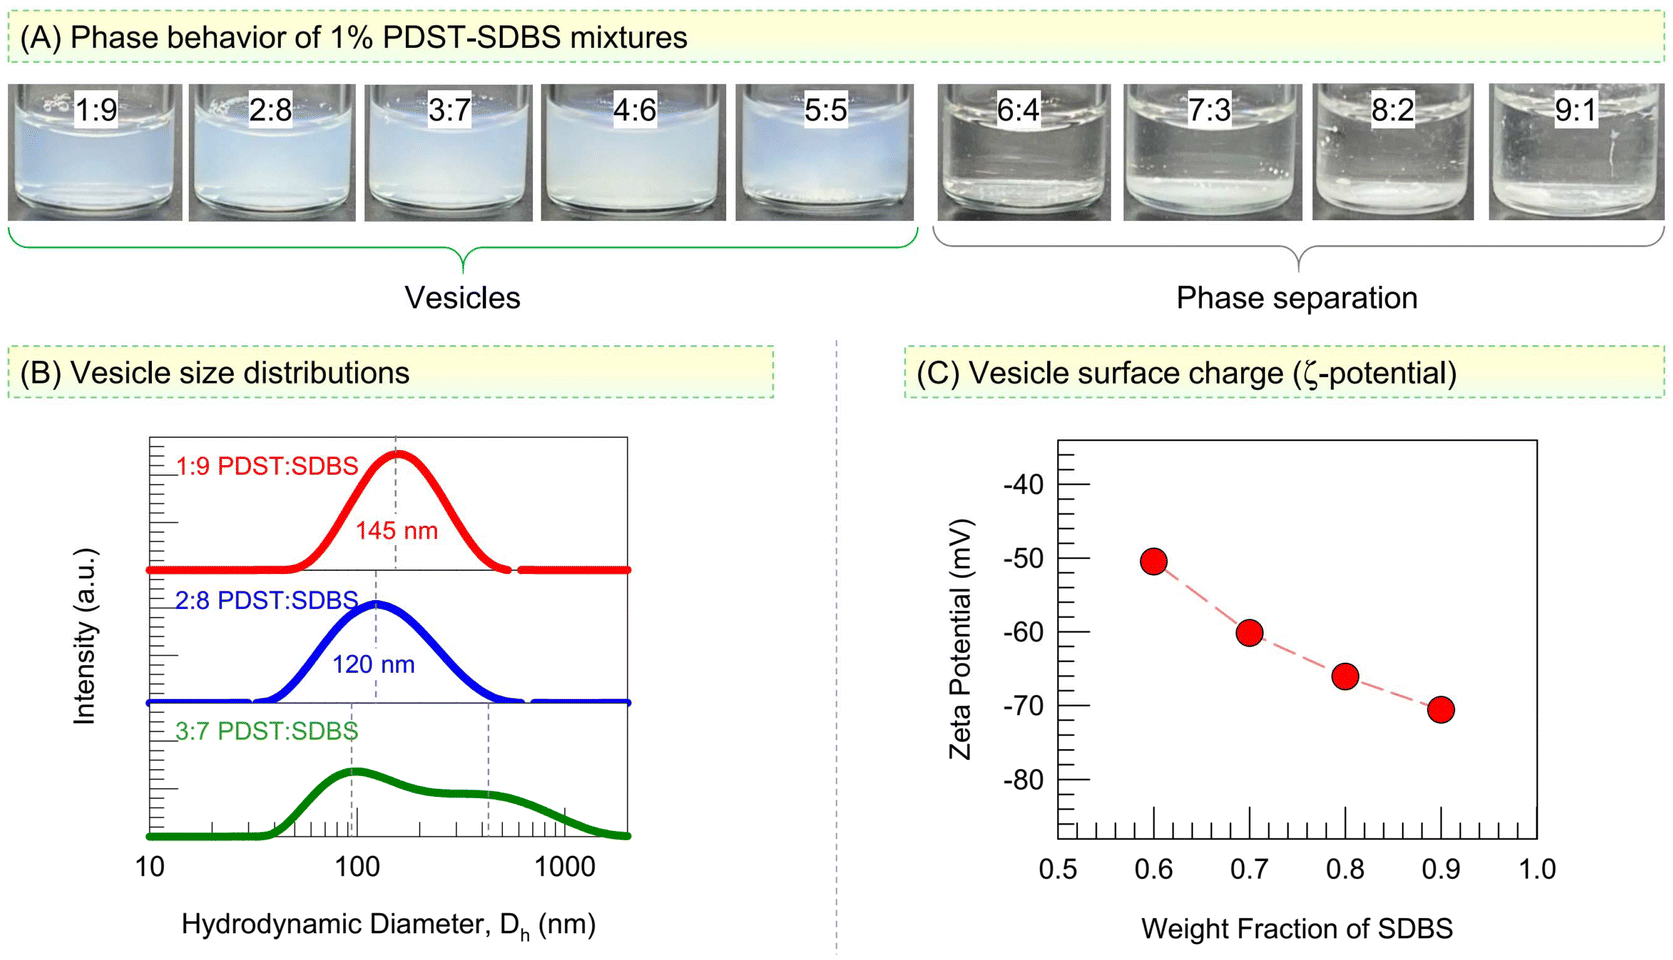 | ||
| Fig. 2 PDST–SDBS vesicles and their characterization. (A) Vial photos of 1% PDST–SDBS in phosphate buffer show that vesicles (bluish samples) form between 1:9 and 5:5 PDST:SDBS weight ratios. At higher PDST, phase separation occurs. (B) Size distributions from DLS give diameters around 120 to 150 nm for the vesicles. (C) The ζ-potential of the vesicles is plotted vs. the fraction of anionic SDBS. | ||
The bluish appearance of PDST:SDBS samples from 1:9 to 5:5 provides an initial indication for the presence of vesicles with sizes around 100 nm in these samples. We used Dynamic Light Scattering (DLS) to characterize these samples and the results are shown in Fig. 2B as size distributions for the hydrodynamic diameter Dh. The 1:9 and 2:8 samples both show a single peak in Dh with a low polydispersity (spread). The average Dh is 145 nm for the 1:9 sample and 120 nm for the 2:8 sample. Such Dh values are typical of spherical unilamellar vesicles, and their presence is further confirmed by cryo-TEM (see Fig. 4 below). The 3:7 sample, on the other hand, shows a bimodal Dh distribution with peaks around 100 and 450 nm. Such a broad Dh distribution was also seen with the 4:6 and 5:5 samples (data not shown). Thus, the high-SDBS samples contain polydisperse vesicles.
Fig. 2C shows the zeta potentials ζ of these vesicles as a function of their SDBS content. The vesicles are strongly anionic (|ζ| > 50 mV), and the magnitude of ζ increases as their SDBS content increases. Note that PDST has a cationic headgroup while SDBS has an anionic headgroup. When we account for their molecular weights, a 4:6 weight ratio of PDST:SDBS corresponds to a molar ratio around 1:2, i.e., there are twice as many SDBS molecules for every PDST. Thus, even a 4:6 sample is expected to be strongly anionic, consistent with the experimental findings.
For the rest of our studies, we focus on the PDST:SDBS vesicles at the 1:9 and 2:8 ratios (with the total PDST + SDBS = 1 wt%). These are the samples that exhibit low polydispersities in their sizes. We further analyzed these samples over a period of six months at room temperature and found that both the average vesicle size and the optical density remain stable over this time. Such long-term stability is rare for vesicles made from lipids (i.e., liposomes), which tend to destabilize unless they are maintained at a low temperature (e.g., 4 °C).3 However, excellent stability over time has been reported for catanionic vesicles.34–36 These are even referred to as ‘equilibrium vesicles’,34 implying that the vesicle state is thermodynamically favored in these mixtures. We believe the PDST–SDBS system falls in this category. As shown by the schematics in Fig. 1C (see also Fig. 6 later), we believe PDST and SDBS molecules will bind due to their opposite charge, thereby giving rise to a cylinder-like geometry for each pair. Note that the tail area of PDST is larger than for a single-tailed surfactant. However, to compensate for this, there is an excess of SDBS at the compositions that give rise to vesicles. Thus, overall, the mixture adopts the geometry needed for forming vesicles.
VMT induced by ROS
We now discuss the effect of ROS on PDST–SDBS vesicles. The thioether group in the tail of PDST is expected to be oxidized to hydrophilic sulfone or sulfoxide by ROS.15–18 A simple way to generate ROS in the lab is by using hydrogen peroxide (H2O2). We added H2O2 at different concentrations to vesicle samples at room temperature and monitored the samples both visually and by UV-Vis spectroscopy. Fig. 3A shows photos of 1:9 PDST:SDBS vesicles taken immediately after H2O2 addition. As the H2O2 concentration is increased, the turbidity (bluish tinge) decreases, and beyond 6% H2O2, the sample turns colorless and clear. This is indicative of a VMT: when vesicles (∼100 nm) are transformed into micelles (∼5 nm), the smaller structures will scatter light to a much lower extent, which is why the sample appears clear.9,29 To quantify the turbidity change, we measured the optical density (OD) at a wavelength of 500 nm by UV-Vis spectroscopy. Fig. 3B plots the OD of the 1:9 and 2:8 PDST–SDBS samples as a function of added H2O2 (all measurements were taken right after H2O2 addition). A sigmoidal decay in OD with H2O2 is seen for both samples. The 1:9 sample becomes clear (OD ∼ 0) at 6% H2O2 (see Photos B1 vs. B3), while the 2:8 sample requires a higher H2O2 concentration of 14% to become clear (see Photos B2 vs. B4).
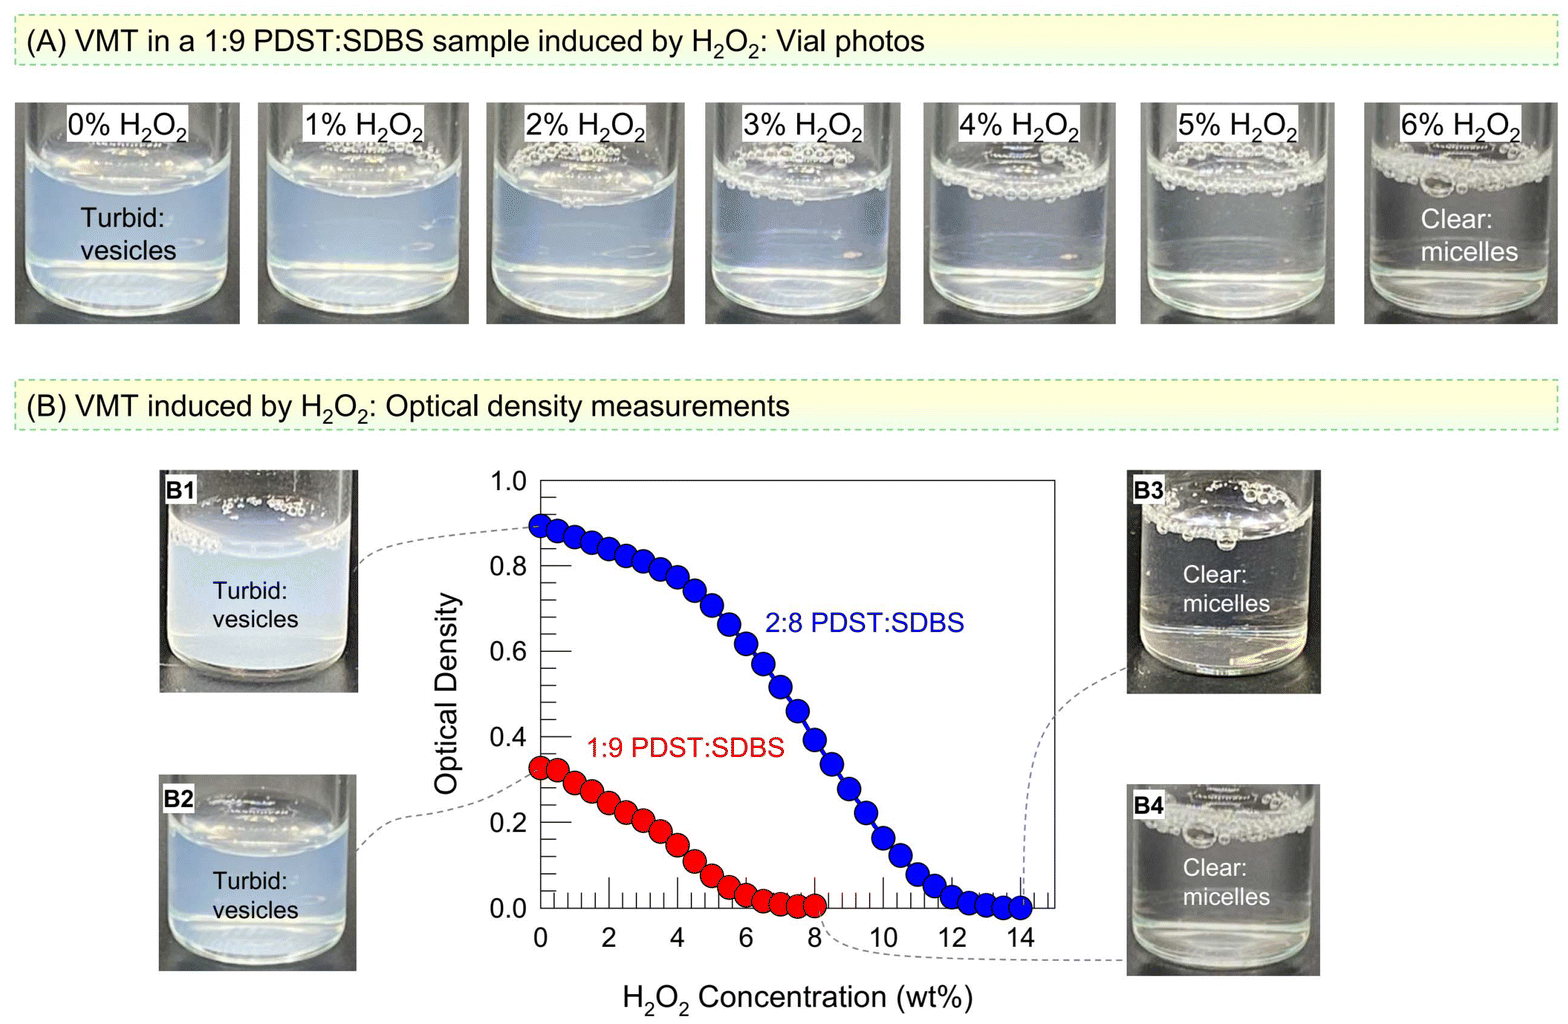 | ||
| Fig. 3 ROS-induced VMT in PDST–SDBS samples. (A) Photos of a 1:9 PDST–SDBS vesicle sample at various H2O2 concentrations. The sample turns from turbid to clear, indicating a VMT. (B) Optical density (OD, a measure of turbidity) as a function of H2O2 for 1:9 and 2:8 PDST:SDBS mixtures. In both cases, the turbidity decreases to zero, indicating VMTs. Photos of the end-points confirm the turbidity changes. | ||
We then used cryo-TEM to confirm the VMT.14,37Fig. 4A and B show cryo-TEM micrographs of the 1:9 and 2:8 samples before and after addition of 15% H2O2. Initially, the 1:9 sample (Image A1) shows unilamellar vesicles with sizes ranging from 100 to 200 nm. These sizes are consistent with the DLS data in Fig. 2B. The 2:8 sample (Image B1) also has mostly unilamellar vesicles, along with some bilamellar vesicles (i.e., vesicles with two concentric bilayers). Both samples were bluish at the outset, but upon exposure to H2O2, the samples became clear. Analysis of these clear samples by cryo-TEM confirms that vesicles are no longer present. In the case of the 1:9 sample, the final structures are small spherical or cylindrical micelles (dark dots or small lines in Image A2).14,37 In the case of the 2:8 sample, grey dots corresponding to spherical micelles are seen (Image B2). Micelle sizes are all around ∼5 to 10 nm, which are much smaller than the sizes of vesicles in Images A1 and B1. Thus, consistent with our expectations, we find evidence from cryo-TEM of a VMT induced by exposure to ROS.
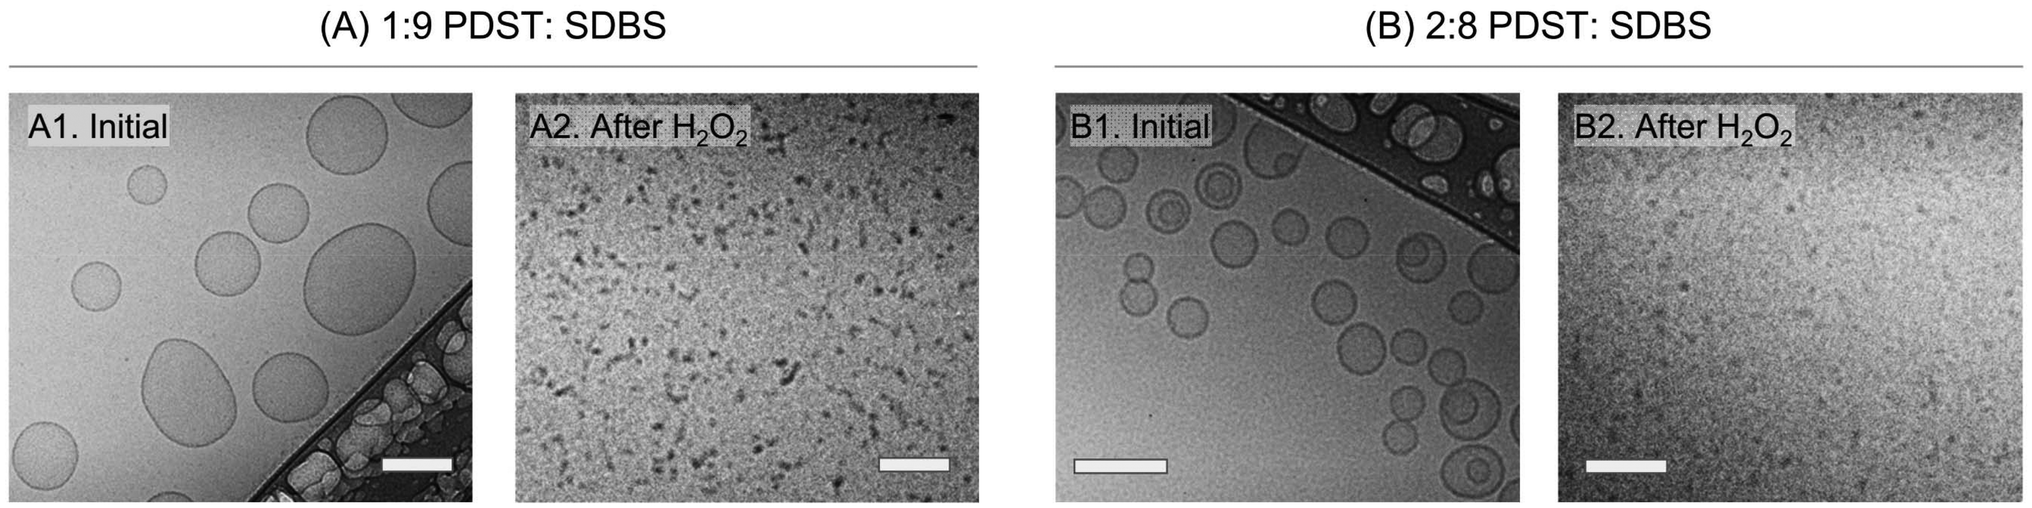 | ||
| Fig. 4 Cryo-TEM images confirming the ROS-induced VMT. The images are of (A) 1:9 and (B) 2:8 PDST:SDBS samples before and after the addition of 15% H2O2. Images A1 and B1 show that the initial samples mostly contain unilamellar vesicles with sizes of 100–200 nm. Images A2 and B2 show no vesicles and instead the presence of small spherical or cylindrical micelles (∼5–10 nm). Thus, the images confirm that ROS from H2O2 induce a VMT. Scale bars: 100 nm. | ||
Next, we studied the kinetics of the ROS-induced VMT at different H2O2 concentrations (Fig. 5). Previously, for the data in Fig. 3, we had measured the OD (turbidity) right after adding H2O2 (t = 0) However, for a given H2O2 addition, the turbidity changes over time t, which is now our focus. Turning first to the 1:9 sample (Fig. 5A), a plot of the OD vs. t is shown for 2% H2O2. The OD at t = 0 (right after addition) is lower than that of the baseline (0% H2O2)—i.e., the H2O2 has an immediate effect, albeit small. But as time progresses, the OD curve shows a sigmoidal decay down to an OD ∼ 0 in about 3 h. This means that just 2% H2O2 is enough to completely convert vesicles into micelles in this sample over 3 h. Next, the kinetics are shown for the 2:8 sample (Fig. 5B). In this case, with 2% H2O2, there is a small initial drop in OD but no further change. However, with 5% H2O2, we see a sigmoidal curve similar to that in Fig. 5A and the OD drops to ∼0 in ∼60 min. Increasing the H2O2 to 7.5% causes an immediate large decrease in OD and then a steep drop to OD ∼ 0 in 20 min.
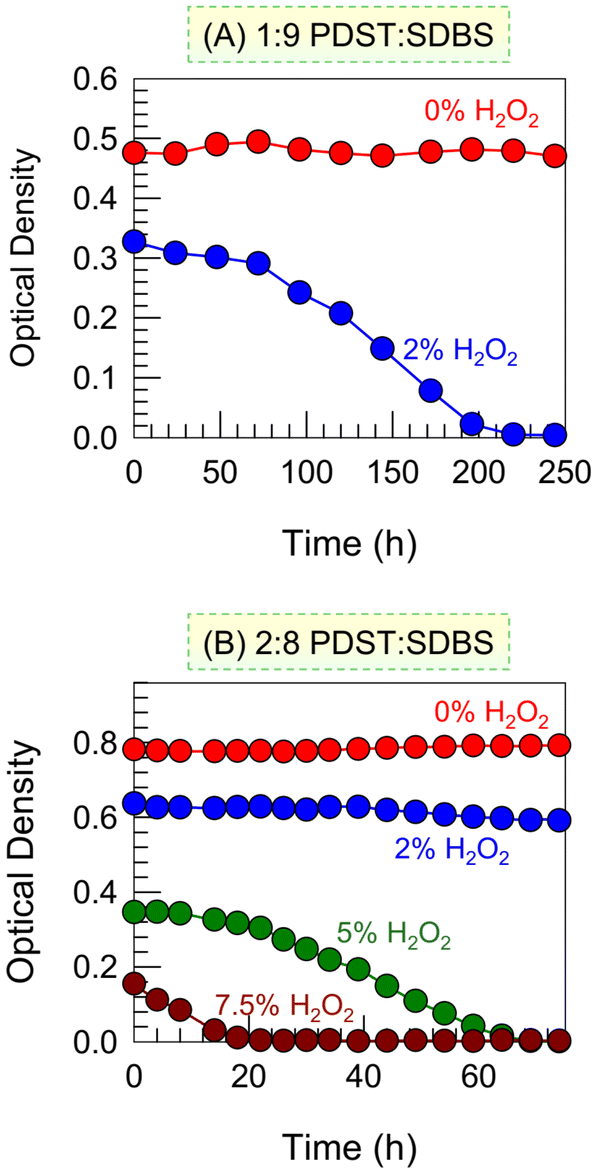 | ||
| Fig. 5 Kinetics of ROS-induced VMT. Optical density (OD) vs. time plots for (A) 1:9 PDST:SDBS and (B) 2:8 PDST:SDBS at different concentrations of H2O2. | ||
Based on the above results, we can outline a mechanism for the ROS-induced VMT in PDST–SDBS mixtures. For this, we invoke the critical packing parameter (CPP) for molecular self-assembly. The CPP = atail/ahg is the ratio of the tail area (atail) to the effective area of the head group (ahg) in the amphiphile.1,2 Note that ahg includes contributions from electrostatic and/or steric repulsions. A CPP ∼ 1/3 implies that the geometry of the amphiphile favors spherical micelles, whereas a CPP ∼ 1/2 implies cylindrical micelles and a CPP ∼ 1 results in vesicles or bilayers.1,2Fig. 6A shows the CPP values expected for PDST and SDBS as well as their mixtures. As was already noted under Fig. 1, we expect PDST to be a cone-shaped molecule (CPP ∼ 1/3) due to its cationic head. Likewise, SDBS is also cone-shaped (CPP ∼ 1/3) due to its anionic head. Note that the PDST tail of aromatic rings is very hydrophobic: the sulfur (S) in the tail (thioether functionality) is not bonded to other electronegative atoms. Because of its hydrophobic tail, PDST is insoluble in water (or buffer) at room temperature (see photo in Fig. 6A where PDST particles are seen to be suspended in the water). However, PDST does get solubilized in the presence of SDBS. When PDST and SDBS are combined, the molecules will pair up as shown in Fig. 6A—this will be mainly driven by the electrostatic affinity between the oppositely charged heads. A secondary interaction could arise from π–π stacking of the aromatic rings in the PDST and SDBS tails.33 All in all, the net amphiphile will have a cylinder-like geometry with CPP ∼ 1 (i.e., atail ≈ ahg), which will lead to ‘catanionic’ vesicles.26–28 Incidentally, a similar formation of vesicles by combining a cationic hydrotrope (benzylamine hydrochloride) and SDBS has been reported previously.33
 | ||
| Fig. 6 Mechanism for the ROS-induced VMT. (A) Initially, PDST and SDBS, each of which are cone-shaped (CPP ∼ 1/3) pair up to give a cylinder-shaped amphiphile, which forms vesicles. PDST on its own is insoluble in water, as shown by the photo. (B) ROS (H2O2) convert the thioether in the PDST tail to hydrophilic sulfoxide, and PDST hence becomes soluble. However, it is no longer an amphiphile and will simply exist as unimers in solution. This leaves SDBS to form micelles. The net result is a VMT, i.e., a transition from PDST–SDBS vesicles to SDBS micelles. | ||
Upon exposure to ROS, the thioether in the PDST tail gets oxidized to a hydrophilic sulfoxide (Fig. 6B). The presence of a hydrophilic group in the middle of the tail means that the PDST molecule will no longer have a distinct demarcation of hydrophilic (head) and hydrophobic (tail) regions. In other words, PDST will no longer be an amphiphile. Evidence that PDST is converted to a hydrophilic form by ROS comes from solubility studies: whereas PDST is initially insoluble in water (Fig. 6A), it is found to be completely soluble in 10% H2O2 (note the clear solution in the vial in Fig. 6B, compared to the turbid suspension in Fig. 6A). With regard to self-assembly, the non-amphiphilic PDST will no longer be able to assemble together with the SDBS—it will simply remain as discrete unimers in the aqueous solution. This leaves behind SDBS molecules (CPP ∼ 1/3), which will then form micelles (Fig. 6B). Thereby, we can explain why we observe a VMT due to ROS.
Further proof for the above mechanism comes from the experiments in Fig. 7. Here, we show that the ROS-induced VMT can be reversed by a reducing agent such as hydrazine. Hydrazine is known for its ability to reduce sulfoxides back to thioethers.15–18 For these experiments, we first made 1:9 and 2:8 PDST:SDBS vesicles, then converted them to micelles by adding 15% H2O2 (and allowing sufficient time for the thioethers to completely convert to sulfoxides). With the samples as clear micellar solutions (OD ∼ 0) as the starting point, we added hydrazine at different concentrations. Fig. 7 shows that the OD increases in a sigmoidal fashion for both samples until it reaches a plateau. Correspondingly, the samples revert from clear to bluish, indicating that the micelles have been converted back to vesicles due to the reduction of sulfoxides in the PDST tail back to thioethers (see structures in Fig. 6). The plateau in the OD indicates that this reduction proceeds to completion.
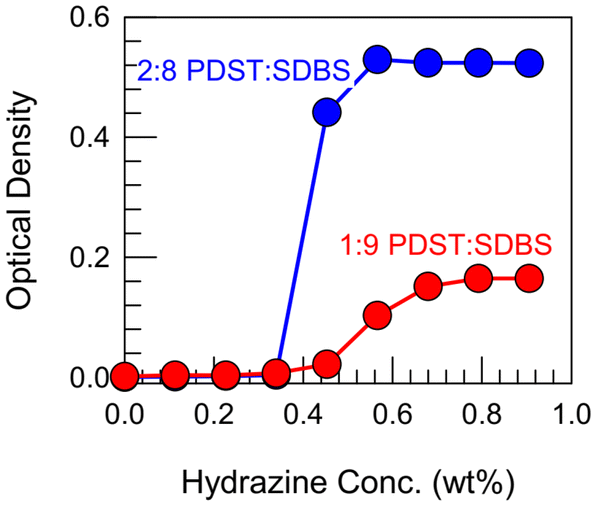 | ||
| Fig. 7 Reversal of VMT by a reducing agent. First, 1:9 and 2:8 PDST:SDBS vesicles are converted to micelles by adding 15% H2O2 and incubating for 2 days. Then the reducing agent, hydrazine is added at different concentrations and the optical density (OD) is measured. OD increases in a sigmoidal fashion, reflecting the re-formation of vesicles. | ||
VMT induced by UV light
PDST finds use as a photoinitiator and thus is known to be sensitive to UV light.38,39 The scheme in Fig. 8A shows that UV light photolyzes PDST into hydrophobic products and triflic acid. In turn, while the intact PDST has amphiphilic character, the products of UV photolysis will not have any capacity to self-assemble, whether into micelles or vesicles. We proceeded to examine if a VMT could be induced by irradiating the sample with UV light. Fig. 8B shows the results of UV irradiation on the OD of the 1:9 and 2:8 PDST:SDBS samples. Both samples are initially bluish (high OD), indicative of vesicles. Within 20 min of broadband UV irradiation (280–400 nm), the 1:9 sample becomes nearly clear (OD ∼ 0). Likewise, the 2:8 sample also transforms into clear over 2 h of such UV irradiation.
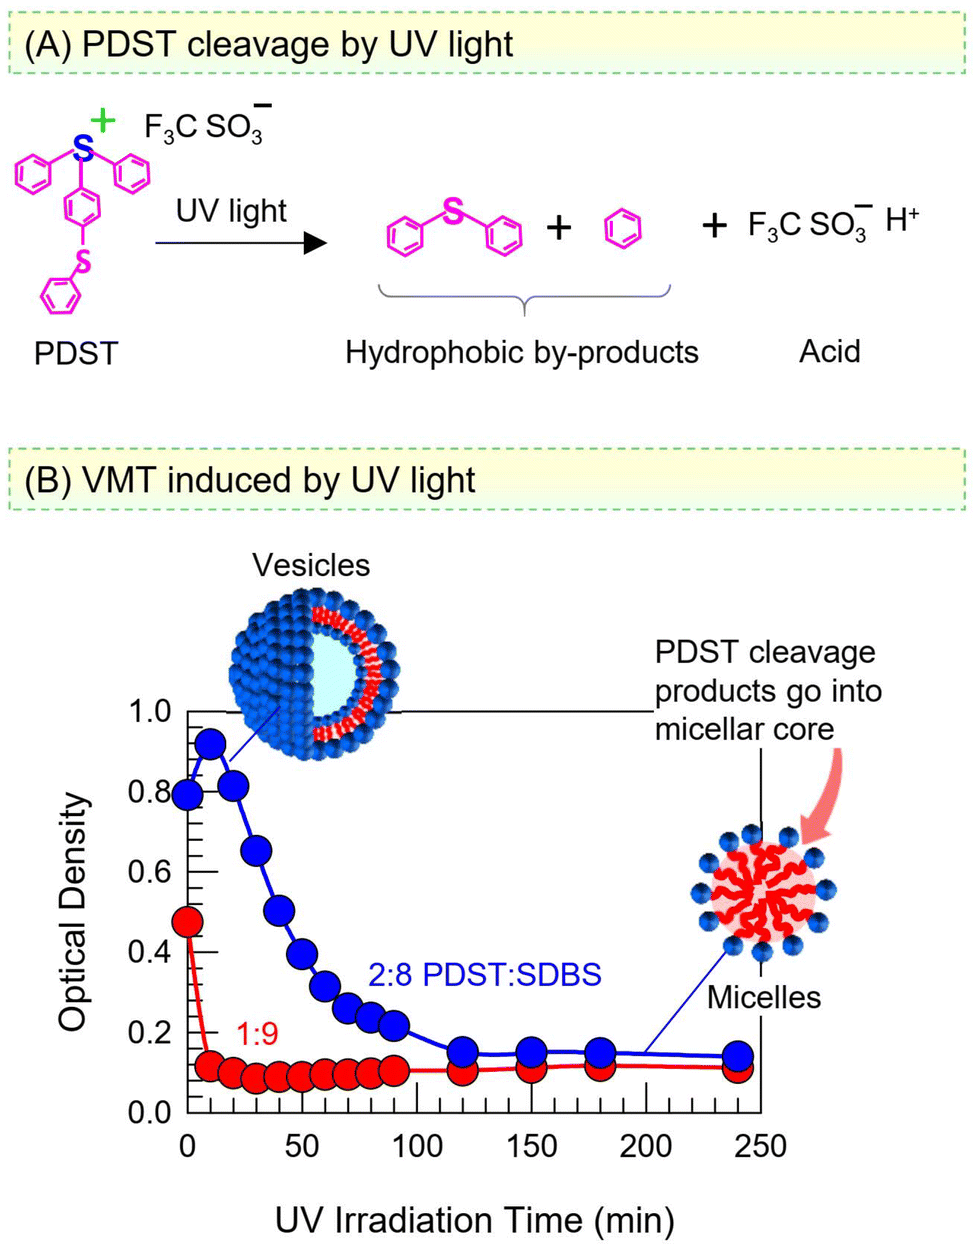 | ||
| Fig. 8 Light-induced VMT in PDST–SDBS samples. (A) UV light cleaves PDST into hydrophobic by-products and acid. Thus, PDST is no longer an amphiphile after this cleavage. (B) Optical density (OD) vs. UV irradiation time for 1:9 and 2:8 PDST:SDBS vesicles. The OD decays to zero, indicating a UV-induced VMT. | ||
Taking a closer look at the mechanism, once PDST is photolyzed, there is no amphiphile to complex with the anionic SDBS and form catanionic vesicles. Thus, the SDBS will simply form micelles on its own (as was the case earlier in Fig. 6B) and the net result will be a VMT. Note that the photolysis is a one-way transition and cannot be reversed by light at a different wavelength. The hydrophobic products of the photolysis are expected to be solubilized in the oily core of SDBS micelles. Alternatively, these molecules may get emulsified, i.e., exist as oily droplets that are stabilized by the SDBS. (The existence of such droplets may explain why the OD remains around 0.1 in the final state, rather than drop to zero.) Note also that the generation of acid does not alter the pH of the samples because they are prepared in phosphate buffer; thus, the pH remains constant at 7.4 before and after the UV irradiation.
VMT induced by heat
In addition to ROS and UV light, we have found that PDST–SDBS vesicles are also sensitive to temperature. Specifically, we report the effect of temperature T on the 1:9 and 2:8 PDST:SDBS samples in Fig. 9. Upon heating, the initial bluish samples both transform into clear solutions and in turn, the plots of OD vs. T show a sigmoidal decay to zero. These results imply a VMT in both samples as they are heated. The critical temperature Tc at which OD reaches zero is 38 °C for the 1:9 sample and 62 °C for the 2:8 sample. Subsequently, when cooled back to room temperature, the samples revert to their initial bluish state, indicating that the VMT is thermo-reversible.
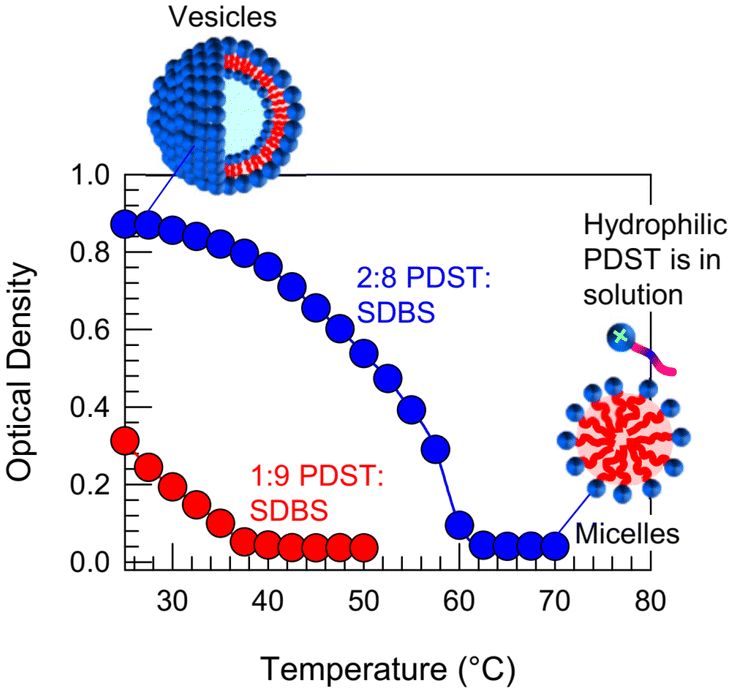 | ||
| Fig. 9 Heat-induced VMT in PDST–SDBS samples. Optical density (OD) vs. temperature for 1:9 and 2:8 PDST:SDBS vesicles. The OD decays to zero, indicating a VMT upon heating. The effect is reversible and the micelles revert to vesicles when cooled. | ||
To elucidate the mechanism for this VMT, we must discuss the effect of heating on the solubility of PDST in buffer. We find a similar pattern to how the solubility was influenced by ROS in Fig. 6. That is, while PDST is insoluble in buffer at low T (25 °C), it completely dissolves at high T (>60 °C). As PDST becomes more soluble, its interaction with the anionic SDBS seems to become weaker. This suggests that PDST binds to SDBS partly via π–π stacking of the aromatic rings in their two tails.40,41 Such aromatic interactions are well-known and can be sensitive to temperature.41 Thus, our hypothesis is that PDST unbinds from SDBS and thereby leaves the vesicle bilayers when heated beyond the critical temperature Tc. PDST will then simply remain as discrete molecules in solution, co-existing with SDBS micelles, as depicted in Fig. 9.
Dye release studies
Finally, the utility of VMTs is demonstrated through solute release studies. We selected a well-studied cationic dye, Rhodamine 6G,42 as a model solute. 1 mM of this dye was added to an SDBS-containing buffer solution, followed by the addition of PDST to form 2:8 PDST:SDBS vesicles. The cationic dye binds to the anionic SDBS molecules in the vesicle bilayers.42,43 The vesicles were then placed in dialysis bags with a 100 kDa cutoff. We placed one bag at 25 °C and the other at 60 °C. The rationale behind this experiment was that the vesicles undergo a heat-induced VMT, as shown by Fig. 9. So, this allows us to probe the release of solute in the vesicle state vs. the micelle state.
Fig. 10 plots the cumulative dye release (as a percentage of the total) vs. time t at the two temperatures. At 25 °C, only 5% of the dye is released from the dialysis bag over 18 h. This negligible release is because the dye remains electrostatically bound to the vesicles, which are too large (∼100 nm) to pass through the dialysis membrane, as indicated by the schematic. Conversely, at 60 °C, 95% of the dye is released from the dialysis bag over the same 18 h period. In this case, the VMT has occurred, and so the sample contains micelles of about 5 nm size. These are small enough to escape out of the pores in the dialysis membrane. The results prove that vesicles can keep solutes encapsulated for extended periods, while rapid release can be triggered by a transition to the micelle state, i.e., by a VMT. These findings show how a VMT could be exploited for the delivery of solutes such as drugs, agrochemicals or cosmetics.
 | ||
| Fig. 10 Switching on the release of solutes by exploiting a VMT. Cumulative release of the solute (a cationic dye) vs. time from dialysis bags containing 1% of 2:8 PDST–SDBS mixtures at 25 °C and 60 °C. At 25 °C, the dye is bound to vesicles, which are too large to pass through the bag. At 60 °C, a VMT occurs, i.e., the vesicles transform into micelles (with bound dye), which leak out of the bag. | ||
Conclusions
In this work, we have designed vesicles that are sensitive to ROS (and additionally to light and heat). Key points from our study are:1. Simple formulation: The vesicles are created by combining a commercially available cationic photoinitiator PDST with the anionic surfactant SDBS. The binding of their ionic headgroups leads to catanionic vesicles. Stable vesicles are obtained at PDST:SDBS ratios of 1:9 and 2:8.
2. Sensitivity to ROS: When exposed to ROS (H2O2), the thioether in the PDST tail is oxidized to a sulfoxide. In turn, the originally hydrophobic tail becomes partially hydrophilic and thus PDST ceases to be an amphiphile. The PDST then unbinds from the SDBS, leaving the SDBS to form small micelles. Thus, a vesicle to micelle transition (VMT) ensues in response to ROS. This can be reversed by a reducing agent.
3. Sensitivity to light and heat: A VMT is also observed when the sample is irradiated with UV light. In this case, the PDST is cleaved by UV to hydrophobic byproducts—thus, it again stops behaving as an amphiphile. A VMT also arises when the sample is heated. In this case, heat increases the solubility of PDST in water, which may allow it to unbind from the SDBS. This transition is reversible, i.e., the vesicles revert to micelles upon cooling.
4. Utility and outlook: Overall, ‘smart’ vesicles that respond to stimuli could be exploited for the delivery of solutes in many practical applications. We have shown how a VMT could enable the release of payloads to be triggered.
Experimental section
Materials
(4-Phenylthiophenyl)diphenylsulfonium triflate (PDST), cetyl trimethylammonium tosylate (CTAT), hydrogen peroxide (30 wt% in water), and hydrazine hydrate (50–60%) were purchased from Sigma-Aldrich. p-Octyloxydiphenyliodonium hexafluoroantimonate (ODPI) was from Gelest. Sodium dodecyl benzenesulfonate (SDBS) was from TCI and glacial acetic acid from Fisher Chemical. Sodium phosphate dibasic heptahydrate and sodium phosphate monobasic monohydrate were used to prepare phosphate buffer solutions and were purchased from Sigma-Aldrich. Ultrapure deionized (DI) water was used in all experiments. Spectra-Por Float-A-Lyzer G2 dialysis inserts (with a molecular weight cut-off or MWCO of 100 kDa) and Sephadex G-50 beads (fine) were purchased from Sigma-Aldrich.Sample preparation
Stock solutions of SDBS were prepared first in 50 mM phosphate buffer. Next, PDST powder and the above SDBS solution were mixed in appropriate ratios and stirred for 24 h at room temperature to ensure equilibration. The total concentration of PDST + SDBS was maintained at 1% by weight in all samples. Sample vials were stored in the dark at room temperature until use.Sample response to ROS
Known amounts of 30 wt% H2O2 solution were added to PDST–SDBS vesicles and mixed using a vortex mixer. Glacial acetic acid at 1% (w/v) was then added to enhance the rate of conversion of thioether to sulfoxide groups.44 Samples were analyzed for turbidity by UV-Vis spectroscopy.Sample response to light
1.5 mL of PDST–SDBS vesicles were placed in a polystyrene cuvette and irradiated with broadband UV light (280–400 nm) from an Oriel 200 W Mercury arc lamp, which incorporated a dichroic beam turner to emit light in the specified range. Note that PDST has a peak absorption at 300 nm.38 Samples were analyzed periodically for turbidity by UV-Vis spectroscopy.Sample response to temperature
PDST–SDBS vesicle samples were placed in a water bath equipped with a Julabo heater. Samples were analyzed at different temperatures for turbidity by UV-Vis spectroscopy. Measurements were done during both heating and cooling cycles.UV-Vis spectroscopy
A Varian Cary 50 UV-Vis spectrophotometer was used to determine the optical density (OD), i.e., the absorbance of the vesicle solutions over a 1 cm path length, at a wavelength of 500 nm. The OD is a measure of sample turbidity. For the OD measurements as a function of temperature, a Peltier-controlled cell was used to maintain the temperature.Dynamic light scattering (DLS) and zeta potential measurements
Vesicle sizes and zeta potentials were determined using a Malvern Zetasizer Nano ZS90 instrument. 1 mL of a given sample was loaded into a polystyrene cuvette for size measurements and into a disposable folded capillary cell (DTS1070, Malvern) for zeta-potential measurements. Samples were equilibrated at 25 °C before taking the measurements.Cryo-TEM
Samples were prepared using a FEI Vitrobot. 5 μL of a sample was pipetted onto the surface of a 200-mesh lacey carbon-coated copper grid (from Ted Pella, Inc). Excess solution was then removed by blotting the grid using a filter paper attached to the arms of the Vitrobot for 2 s, leaving behind a thin sample film. This film was then frozen quickly by plunging the grid into liquid ethane, followed by liquid nitrogen. The rapid cooling ensures that the water in the sample vitrifies instead of forming ice crystals. The vitrified specimen was then transferred onto a single-tilt cryo-specimen holder for imaging. All the images were taken below −170 °C with a FEI G2 F30 Tecnai TEM operated at 100 kV.Solute release experiments
2:8 PDST–SDBS vesicles were first loaded with 1 mM of the cationic dye Rhodamine 6G. The dye binds to the anionic vesicle bilayers by electrostatic interactions. This was confirmed by passing a vesicle–dye mixture through a size-exclusion chromatography (SEC) column packed with Sephadex G50 beads. Negligible separation was observed in the SEC column because most of the dye was bound to the vesicles. Release experiments with the above mixture were done as follows. First, 1.5 mL samples were injected into the dialysis inserts, which were then placed in two 200 mL beakers, each with 150 mL of 50 mM phosphate buffer. One beaker was maintained at 25 °C (below the VMT) and the other at 60 °C (above the VMT). The cut-off molecular weight (100 kDa) of the dialysis membranes was chosen such that micelles could leak out into the external solution, but not vesicles. As time progressed, 1 mL samples were taken periodically from the external solution and analyzed for dye concentration by UV-Vis spectroscopy (the samples were then returned to the external solution). Cumulative dye release (%) was calculated for Fig. 10 by normalizing the dye concentration with that in the solution after equilibration for 2 days at 60 °C.
Data availability
Data are available from the corresponding author upon reasonable request.Conflicts of interest
There are no conflicts to declare.Acknowledgements
We acknowledge funding from the FDA through M-CERSI. We thank the following lab members for their assistance with some of the experiments: Sebastian Peters, Faraz Burni, and Hema Choudhary.References
- J. N. Israelachvili, Intermolecular and Surface Forces, Academic Press, San Diego, 2011 Search PubMed.
- D. F. Evans and H. Wennerstrom, The Colloidal Domain: Where Physics, Chemistry, Biology, and Technology Meet, Wiley-VCH, New York, 2001 Search PubMed.
- A. Jesorka and O. Orwar, Liposomes: Technologies and analytical applications, Annu. Rev. Anal. Chem., 2008, 1, 801–832 CrossRef CAS PubMed.
- B. S. Pattni, V. V. Chupin and V. P. Torchilin, New developments in liposomal drug delivery, Chem. Rev., 2015, 115, 10938–10966 CrossRef CAS PubMed.
- N. Lamichhane, T. S. Udayakumar, W. D. D'Souza, C. B. Simone, S. R. Raghavan, J. Polf and J. Mahmood, Liposomes: Clinical applications and potential for image-guided drug delivery, Molecules, 2018, 23, 288 CrossRef PubMed.
- R. Ghosh and J. Dey, Vesicle-to-micelle transition in aqueous solutions of l-cysteine-derived carboxylate surfactants containing both hydrocarbon and poly(ethylene glycol) tails, Langmuir, 2017, 33, 543–552 CrossRef CAS PubMed.
- H. F. Xu, N. Du, Y. W. Song, S. E. Song and W. G. Hou, Spontaneous vesicle formation and vesicle-to-micelle transition of sodium 2-ketooctanate in water, J. Colloid Interface Sci., 2018, 509, 265–274 CrossRef CAS PubMed.
- Z. Jiang, K. L. Jia, X. Liu, J. F. Dong and X. F. Li, Multiple responsive fluids based on vesicle to wormlike micelle transitions by single-tailed pyrrolidone surfactants, Langmuir, 2015, 31, 11760–11768 CrossRef CAS PubMed.
- T. S. Davies, A. M. Ketner and S. R. Raghavan, Self-assembly of surfactant vesicles that transform into viscoelastic wormlike micelles upon heating, J. Am. Chem. Soc., 2006, 128, 6669–6675 CrossRef CAS PubMed.
- Y. Yang, L. Liu, X. Huang, X. Tan, T. Luo and W. Li, Temperature-induced vesicle to micelle transition in cationic/cationic mixed surfactant systems, Soft Matter, 2015, 11, 8848–8855 RSC.
- T. M. McCoy, J. B. Marlow, A. J. Armstrong, A. J. Clulow, C. J. Garvey, M. Manohar, T. A. Darwish, B. Boyd, A. F. Routh and R. F. Tabor, Spontaneous self-assembly of thermoresponsive vesicles using zwitterionic and an anionic surfactant, Biomacromolecules, 2020, 21, 4569–4576 CrossRef CAS PubMed.
- W. Li, Y. Yang, L. Liu, X. Tan, T. Luo and J. Shen, Dual stimuli-responsive self-assembly transition in zwitterionic/anionic surfactant systems, Soft Matter, 2015, 11, 4283–4289 RSC.
- D. Wang, R. H. Dong, P. F. Long and J. C. Hao, Photo-induced phase transition from multilamellar vesicles to wormlike micelles, Soft Matter, 2011, 7, 10713–10719 RSC.
- H. Oh, V. Javvaji, N. A. Yaraghi, L. Abezgauz, D. Danino and S. R. Raghavan, Light-induced transformation of vesicles to micelles and vesicle-gels to sols, Soft Matter, 2013, 9, 11576–11584 RSC.
- C. C. Winterbourn, Reconciling the chemistry and biology of reactive oxygen species, Nat. Chem. Biol., 2008, 4, 278–286 CrossRef PubMed.
- Z. Zhou, J. Song, L. Nie and X. Chen, Reactive oxygen species generating systems meeting challenges of photodynamic cancer therapy, Chem. Soc. Rev., 2016, 45, 6597–6626 RSC.
- S. H. Lee, M. K. Gupta, J. B. Bang, H. Bae and H.-J. Sung, Current progress in reactive oxygen species (ROS)-responsive materials for biomedical applications, Adv. Healthcare Mater., 2013, 2, 908–915 CrossRef CAS PubMed.
- G. Saravanakumar, J. Kim and W. J. Kim, Reactive-oxygen-species-responsive drug delivery systems: Promises and challenges, Adv. Sci., 2016, 4, 1600124 CrossRef PubMed.
- A. Napoli, M. Valentini, N. Tirelli, M. Müller and J. A. Hubbell, Oxidation-responsive polymeric vesicles, Nat. Mater., 2004, 3, 183–189 CrossRef CAS PubMed.
- W. Deng, W. Chen, S. Clement, A. Guller, Z. Zhao, A. Engel and E. M. Goldys, Controlled gene and drug release from a liposomal delivery platform triggered by X-ray radiation, Nat. Commun., 2018, 9, 2713 CrossRef PubMed.
- Y. Du, W. He, Q. Xia, W. Zhou, C. Yao and X. Li, Thioether phosphatidylcholine liposomes: A novel ROS-responsive platform for drug delivery, ACS Appl. Mater. Interfaces, 2019, 11, 37411–37420 CrossRef CAS PubMed.
- S. Guo, S. He, Z. Chen and Y. Zhang, Reactive oxygen species-responsive vesicle formed by selenium-containing cationic surfactant and SDS, J. Mol. Liq., 2019, 277, 672–680 CrossRef CAS.
- J. Zhou, Q. Tang, J. Zhong, Z. Lei, H. Luo, Z. Tong, G. Jiang and X. Liu, Construction of glucose and H2O2 dual stimuli-responsive polymeric vesicles and their application in controlled drug delivery, J. Mater. Sci., 2018, 53, 14063–14074 CrossRef CAS.
- S. Li, X. Chu, A. Hao, N. Shang and C. Wang, A triply-responsive supramolecular vesicle fabricated by α-cyclodextrin based host–guest recognition and double dynamic covalent bonds, Soft Matter, 2018, 14, 9923–9927 RSC.
- B. Monney, A. E. Hess-Dunning, P. Gloth, J. R. Capadona and C. Weder, Mechanically adaptive implants fabricated with poly(2-hydroxyethyl methacrylate)-based negative photoresists, J. Mater. Chem. B, 2020, 8, 6357–6365 RSC.
- E. W. Kaler, A. K. Murthy, B. E. Rodriguez and J. A. N. Zasadzinski, Spontaneous vesicle formation in aqueous mixtures of single-tailed surfactants, Science, 1989, 245, 1371–1374 CrossRef CAS PubMed.
- A.-T. Kuo and C.-H. Chang, Recent strategies in the development of catanionic vesicles, J. Oleo Sci., 2016, 65, 377–384 CrossRef CAS PubMed.
- D. Domazet Jurašin, S. Šegota, V. Strasser, A. Selmani and M. Dutour Sikirić, Recent advances in catanionic mixtures, in Application and Characterization of Surfactants, IntechOpen, 2017 Search PubMed.
- A. N. Wang, C. C. Miller and J. W. Szostak, Core-shell modeling of light scattering by vesicles: Effect of size, contents, and lamellarity, Biophys. J., 2019, 116, 659–669 CrossRef CAS PubMed.
- W. Kunz, K. Holmberg and T. Zemb, Hydrotropes, Curr. Opin. Colloid Interface Sci., 2016, 22, 99–107 CrossRef CAS.
- V. Srinivas, G. A. Rodley, K. Ravikumar, W. T. Robinson, M. M. Turnbull and D. Balasubramanian, Molecular organization in hydrotrope assemblies, Langmuir, 1997, 13, 3235–3239 CrossRef CAS.
- M. H. Hatzopoulos, J. Eastoe, P. J. Dowding, S. E. Rogers, R. Heenan and R. Dyer, Are hydrotropes distinct from surfactants?, Langmuir, 2011, 27, 12346–12353 CrossRef PubMed.
- Y. Y. Lin, Y. Qiao, X. H. Cheng, Y. Yan, Z. B. Li and J. B. Huang, Hydrotropic salt promotes anionic surfactant self-assembly into vesicles and ultralong fibers, J. Colloid Interface Sci., 2012, 369, 238–244 CrossRef CAS PubMed.
- R. G. Laughlin, Equilibrium vesicles: fact or fiction?, Colloids Surf., A, 1997, 128, 27–38 CrossRef CAS.
- E. F. Marques, Size and stability of catanionic vesicles: Effects of formation path, sonication, and aging, Langmuir, 2000, 16, 4798–4807 CrossRef CAS.
- H. T. Jung, B. Coldren, J. A. Zasadzinski, D. J. Iampietro and E. W. Kaler, The origins of stability of spontaneous vesicles, Proc. Natl. Acad. Sci. U. S. A., 2001, 98, 1353–1357 CrossRef CAS PubMed.
- D. Danino, Cryo-TEM of soft molecular assemblies, Curr. Opin. Colloid Interface Sci., 2012, 17, 316–329 CrossRef CAS.
- J. L. Dektar and N. P. Hacker, Photochemistry of triarylsulfonium salts, J. Am. Chem. Soc., 1990, 112, 6004–6015 CrossRef CAS.
- M. Höfer and R. Liska, Photochemistry and initiation behavior of phenylethynyl onium salts as cationic photoinitiators, J. Polym. Sci., Part A: Polym. Chem., 2009, 47, 3419–3430 CrossRef.
- S. E. Wheeler and J. W. G. Bloom, Toward a more complete understanding of noncovalent interactions involving aromatic rings, J. Phys. Chem. A, 2014, 118, 6133–6147 CrossRef CAS PubMed.
- O. Munkhbat, M. Garzoni, K. R. Raghupathi, G. M. Pavan and S. Thayumanavan, Role of aromatic interactions in temperature-sensitive amphiphilic supramolecular assemblies, Langmuir, 2016, 32, 2874–2881 CrossRef CAS PubMed.
- E. J. Danoff, X. Wang, S.-H. Tung, N. A. Sinkov, A. M. Kemme, S. R. Raghavan and D. S. English, Surfactant vesicles for high-efficiency capture and separation of charged organic solutes, Langmuir, 2007, 23, 8965–8971 CrossRef CAS PubMed.
- X. Wang, E. J. Danoff, N. A. Sinkov, J.-H. Lee, S. R. Raghavan and D. S. English, Highly efficient capture and long-term encapsulation of dye by catanionic surfactant vesicles, Langmuir, 2006, 22, 6461–6464 CrossRef CAS PubMed.
- H. Golchoubian and F. Hosseinpoor, Effective oxidation of sulfides to sulfoxides with hydrogen peroxide under transition-metal-free conditions, Molecules, 2007, 12, 304–311 CrossRef CAS PubMed.
| This journal is © The Royal Society of Chemistry 2024 |