
Ultrathin MOF nanosheets and their mixed-matrix membranes for ammonia and aliphatic amine sensing in water†
Ritu
Ladhi
,
Arshminder Kaur
Dhillon
and
Monika
Singh
 *
*
Institute of Nano Science and Technology, Knowledge City, Sector-81, Mohali-140306, Punjab, India. E-mail: monika@inst.ac.in
First published on 8th April 2024
Abstract
Ultrathin 2D metal–organic frameworks (MOFs) exhibit a myriad of unparalleled properties, rendering them extensively applicable across various fields. Despite this, developing a 2D MOF sensor for detecting hazardous amines in water remains a formidable challenge. To address this issue, we synthesized Ni-btc MOF ultrathin nanosheets with a thickness of approximately 4.15 nm for the detection of amines in water. These nanosheets demonstrated a notable “turn-on” fluorescence response in the presence of ammonia and aliphatic amines. The detection limit for aliphatic amines ranged from 297 to 424 nM, while for ammonia, it reached an impressive low limit of around 42 nM, which is an excellent value compared to other reported MOFs for ammonia sensing in water. Density functional theory calculations elucidated the mechanism underlying fluorescence enhancement. Additionally, a mixed matrix membrane based on MOF nanosheets was fabricated for real-time sensing that exhibits an immediate color change in the presence of ammonia and aliphatic amines.
Introduction
With industries witnessing substantial growth, the corresponding rise in the generation of toxic and hazardous substances poses an escalating threat to human safety, emphasizing the need for precise sensors.1 Ammonia (NH3) and aliphatic amines are inherently toxic and corrosive and are widely dispersed in the environment. They have extensive applications as raw materials or intermediate products in many chemical, fertilizer and food industries.2,3 Aliphatic amines (mainly secondary and tertiary amines) can be easily oxidized to several N-nitrosamines in water, which pose even greater hazards.3,4 Direct exposure to amines can cause severe respiratory irritation and skin burns. For NH3, the Occupational Safety and Health Administration (OSHA) has established a threshold limit value of 50 ppm at the workplace.5 Exceeding this concentration can lead to serious and potentially fatal health conditions.1 Therefore, the detection of ammonia and aliphatic amines in any form, vapor or liquid, at high as well as low concentrations becomes imperative for the effective monitoring of its release in water and the environment.So far, various analytical techniques, including mass spectrometry,6 electrosensing,7 high-performance liquid chromatography,8 gas chromatography,9 and capillary electrophoresis10 have been employed for the analysis and quantification of amines.11–13 However, numerous existing methodologies involve expensive and bulky equipment, intricate procedures, and long hours of testing times, rendering them unsuitable for rapid and efficient analysis.14 In contrast, optical sensing offers rapid and real-time analytical capability based on changes in fluorescence intensity. For any sensor to be viable for real-time application, along with rapid and high sensitivity, hydrolytic and thermal stability are crucial parameters.15–22 Metal–organic frameworks (MOFs) have emerged as the most suitable choice for such sensing applications.23
Metal–organic frameworks (MOFs) are porous inorganic and organic hybrid solids. Currently, 2D MOF nanosheets are gaining more popularity compared to their 3D bulk counterparts. 2D MOFs offer numerous exposed active sites, ultrahigh surface-to-volume atomic ratios, and larger specific surface area, which are advantageous for performance enhancement in various applications such as sensing, catalysis, gas separation, and storage.24 Therefore, 2D MOFs are the ultimate package with MOF and 2D nanomaterial properties. Some studies have emphasized the remarkable potential of 2D MOF nanosheets in the fabrication of fluorescent sensors.25–27 Recently, Guo and his co-workers employed the ‘top-down’ ultrasonic exfoliation method to synthesize nanosheets of Cd MOF using 4,4′-((2,5-dimethoxy-1,4-phenylene)bis(ethene-2,1-diyl))dibenzoic acid as the organic linker. They showcased the significant enhancement of sensing and fluorescence properties in MOF nanosheets compared to those in bulk materials for the detection of glyphosate (Glyph) with fast response and low detection limit in water.28 Using a self-assembly strategy, Wong and co-workers synthesized Zn–BTC MOF nanosheets for colorimetric and fluorometric sensing of ammonia. They incorporated ZnQ to tune the properties of Zn–BTC nanosheets, which enhanced ammonia detection with a limit of detection value of 0.27 ppm in the gaseous phase and 60.8 nm in the liquid phase.29 However, reports on the utilization of 2D nanostructured MOF for amines sensing in water are relatively scarce.
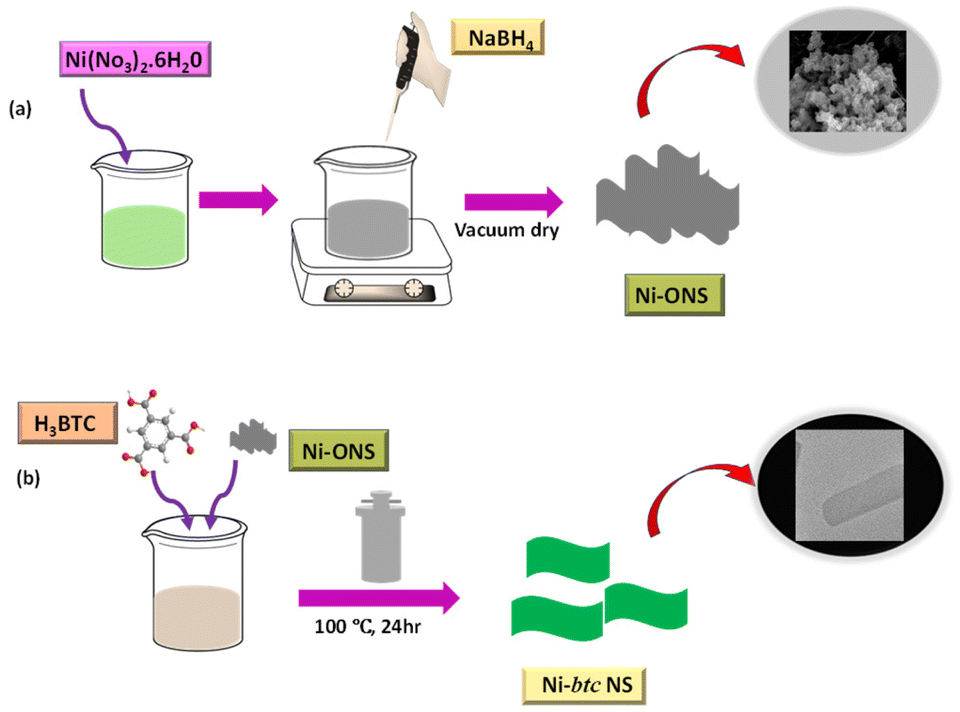
Herein, we employed a surfactant-free approach for the synthesis of ultrathin MOF nanosheets (NS) for ammonia and aliphatic amines sensing in water. At present, diverse methods are being utilized including surfactant-assisted techniques,30 ultrasonication exfoliation,31 interfacial synthesis,32 and modulated technique33 for MOF NS synthesis. However, each of these approaches possesses certain limitations such as the involvement of complex synthesis processes that are more time-consuming, and the possibility of structural deterioration. Therefore, using a surfactant-free method involving a 2D oxide sacrifice approach (2dOSA) for synthesizing ultrathin MOF nanosheets is more beneficial compared to other methods. In this approach, amorphous NiO NS were initially synthesized, which serve as sacrificial templates that facilitated the formation of Ni MOF NS through coordination with the 1,3,5-benzene tricarboxylic acid (BTC) ligand. These MOF NS exhibited remarkable “turn-on” fluorescence in the presence of ammonia and aliphatic amines and can detect as low as 41.8 nM concentration of ammonia.
To enhance the practical usability of Ni-btc NS, we also synthesized MOF-based flexible and recyclable mixed matrix membranes (MMMs), demonstrating their vapochromic sensing capabilities. This underscores the excellent ability of our MOF's NS to sense amines in both solution and vapor states, presenting the potential for utilizing 2D MOF NS as an effective device for real-time ammonia and aliphatic amines detection.
Results and discussion
Structure and morphology characterization
The synthesis of Ni-btc NS was performed via the 2D oxide sacrifice approach (2dOSA), as depicted in Scheme 1 (details in ESI†).34 Initially, NiO NS were produced through a reduction method and subsequently subjected to a hydrothermal reaction with the btc ligand, resulting in the formation of ultrathin 2D MOF NS. The surface morphology was investigated through FESEM and TEM, showing that NiO NS were agglomerated to form a nanoflower morphology (Fig. 1a and b), that transformed into a flat nanosheet morphology for Ni-btc NS (Fig. 1c and d) upon reaction with the H3btc ligand. Further characterization through AFM studies confirmed the ultrathin nature of these nanosheets, with a thickness of approximately 4.15 nm (Fig. S1†). The PXRD pattern of NiO NS revealed major peaks corresponding to (111), (200), and (220) planes (Fig. S2a†).35 While, Ni-btc NS (Fig. S2b†) displayed strong diffraction peaks attributed to the (220), (111), (20![[2 with combining macron]](https://www.rsc.org/images/entities/char_0032_0304.gif) ), and (31) planes of the Ni-btc MOF structure.34 The presence of key functional groups in MOF NS was confirmed through FT-IR spectroscopy (Fig. S3a†), where bands around 3431–3106 cm−1 are the stretching vibration of the O–H group of H2O molecules. Peaks around 1606–1514 cm−1 and 1424–1351 cm−1 correspond to the asymmetric and symmetric stretching vibrations of COO−. Vibrational bands at 1108 cm−1 indicated in-plane C–C stretching, while those between 810–712 cm−1 signified the C–H aromatic groups (out of plane) stretching vibrations.36
), and (31) planes of the Ni-btc MOF structure.34 The presence of key functional groups in MOF NS was confirmed through FT-IR spectroscopy (Fig. S3a†), where bands around 3431–3106 cm−1 are the stretching vibration of the O–H group of H2O molecules. Peaks around 1606–1514 cm−1 and 1424–1351 cm−1 correspond to the asymmetric and symmetric stretching vibrations of COO−. Vibrational bands at 1108 cm−1 indicated in-plane C–C stretching, while those between 810–712 cm−1 signified the C–H aromatic groups (out of plane) stretching vibrations.36
 | ||
| Scheme 1 (a and b) Schematic illustration of the preparation of Ni-btc NS. | ||
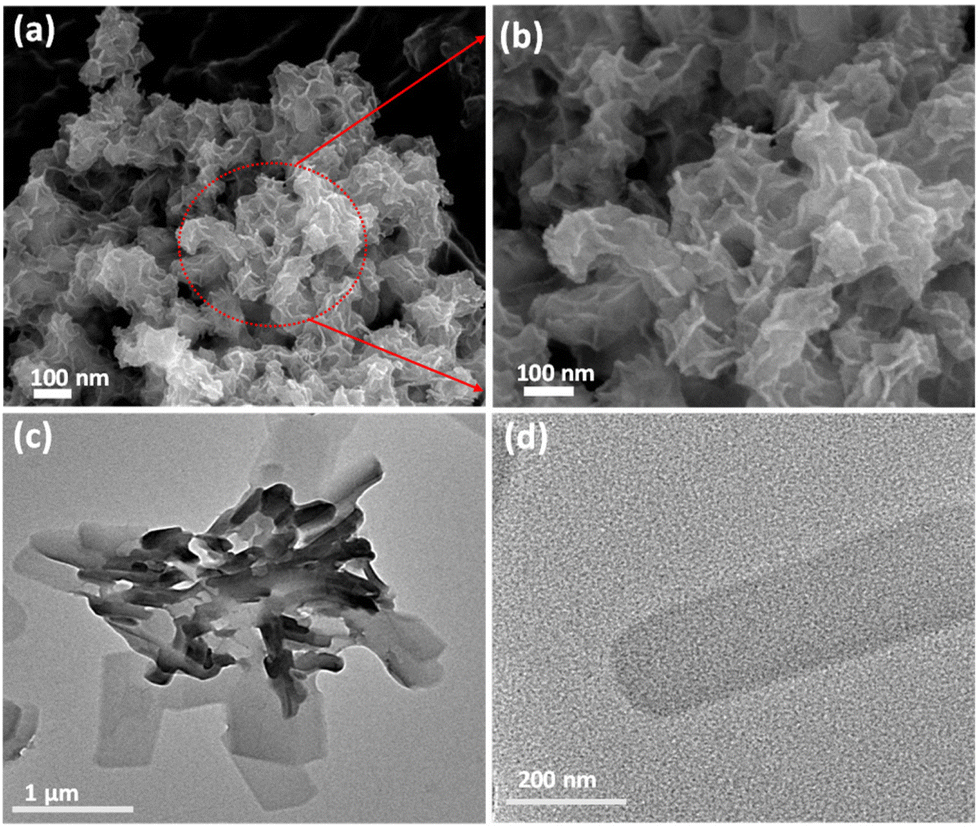 | ||
| Fig. 1 (a) FESEM image of NiO NS showing nanosheets agglomerated to form nanoflower morphology. (b) Magnified FESEM image of NiO NS. (c) TEM image of Ni-btc NS showing aggregated nanosheets and (d) TEM image of the single nanosheet of Ni-btc NS at a higher magnification. | ||
UV-Vis spectra (Fig. S3b†) exhibited an absorbance band between 230–295 nm, attributed to n–π* and π–π* intra-ligand transitions of the btc ligand. Additionally, a broad absorbance peak around 400 nm and 550 nm was observed, indicating Ni d–d transitions.37 Fig. S4† displays the nitrogen sorption isotherm of Ni-btc NS with a Brunauer–Emmett–Teller (BET) surface area of 39 m2 g−1. Thermal stability analysis using TGA (Fig. S5†) unveiled a two-step decomposition process of the MOF NS. During the initial phase, between 100 °C and 250 °C, the crystallized water molecules evaporate. Subsequently, in the second step between 250 °C and 400 °C, the organic ligand decomposes.38
X-ray photoelectron spectroscopy (XPS) and energy-dispersive X-ray spectroscopy (EDS) mapping were also employed to further confirm the successful formation of Ni-btc NS. The XPS survey spectrum showed the presence of C 1s, O 1s, and Ni 2p elements, with binding energies at 284.8, 532.08, and 855.98 eV, respectively (Fig. S6a†). The deconvoluted C 1s spectrum of Ni-btc NS (Fig. S6b†) featured peaks at 289.58, 288.33, 285.19, and 284.51 eV, assigned to O–C![[double bond, length as m-dash]](https://www.rsc.org/images/entities/char_e001.gif) O, CO, C–OH, and C–C peaks, respectively. The deconvoluted O 1s spectrum (Fig. S6c†) showed binding energies at 533.65, 532.94, 531.76, and 531.20 eV corresponding to O–H, O–CO, CO, and C–OH species, respectively. Furthermore, the Ni 2p deconvoluted spectrum (Fig. S6d†) indicated the presence of Ni+2 with peaks at 874.02 eV and 856.5 eV, along with two satellite peaks at 879.02 and 860.9 eV.36 The EDS mapping also indicates the presence of Ni and O elements in NiO NS (Fig. S7†) and Ni, O, and C elements in Ni-btc NS (Fig. S8†).
O, CO, C–OH, and C–C peaks, respectively. The deconvoluted O 1s spectrum (Fig. S6c†) showed binding energies at 533.65, 532.94, 531.76, and 531.20 eV corresponding to O–H, O–CO, CO, and C–OH species, respectively. Furthermore, the Ni 2p deconvoluted spectrum (Fig. S6d†) indicated the presence of Ni+2 with peaks at 874.02 eV and 856.5 eV, along with two satellite peaks at 879.02 and 860.9 eV.36 The EDS mapping also indicates the presence of Ni and O elements in NiO NS (Fig. S7†) and Ni, O, and C elements in Ni-btc NS (Fig. S8†).
Photoluminescence studies
The emission spectra of Ni-btc MOF and the btc ligand were recorded at room temperature using an excitation wavelength of 310 nm. The emission peak for the btc ligand was observed at 350 nm due to intraligand fluorescence emission. In contrast, Ni-btc exhibited red-shifted emission spectra (Fig. S9†), indicating enhanced conjugation after metal–ligand interaction. Ni-btc displayed a similar emission pattern as that of the btc ligand suggesting ligand-driven photoluminescence.Thereafter, we examined fluorescence sensing of MOF NS towards amines, namely, ammonia (NH3), methylamine (MA), triethylamine (TEA), and di-isopropylamine (DIPA) in aqueous medium. Initially, MOF NS suspensions were prepared in water (2 mg in 2 mL), then for fluorescence studies, 100 μM of each amine (5 mM) was added in an incremental fashion to the above suspension (500 μL). A dramatic increase in fluorescence intensity of Ni-btc NS was observed with the addition of amines (Fig. S10a, S11a and S12a†). These results were even more pronounced with ammonia, which showed a remarkable turn-on effect even with the addition of 2 μM concentration (Fig. 2a). The limit of detection was measured using the equation 3σ/m, where σ is the deviation from the standard values calculated for five blank emission intensities of MOF NS, and m represents the slope derived from the linear regression curve fitting of the intensity against concentration. The LODs were found to be 297 nM for MA, 424 nM for TEA, and 330 nM for DIPA (Fig. S10b, S11b and S12b,† respectively), which are exceptionally low from most of the other reported values (Table S4†). NH3 exhibited a LOD value of 41.8 nM (Fig. 2b), which is the lowest among other reports for aqueous ammonia detection (Table S3†). There are limited reports in the literature on the detection of ammonia and aliphatic amines in an aqueous medium, and to the best of our knowledge, there is no previous report on using MOF NS as a sensor material for “turn-on” ammonia and aliphatic amines sensing in aqueous medium.
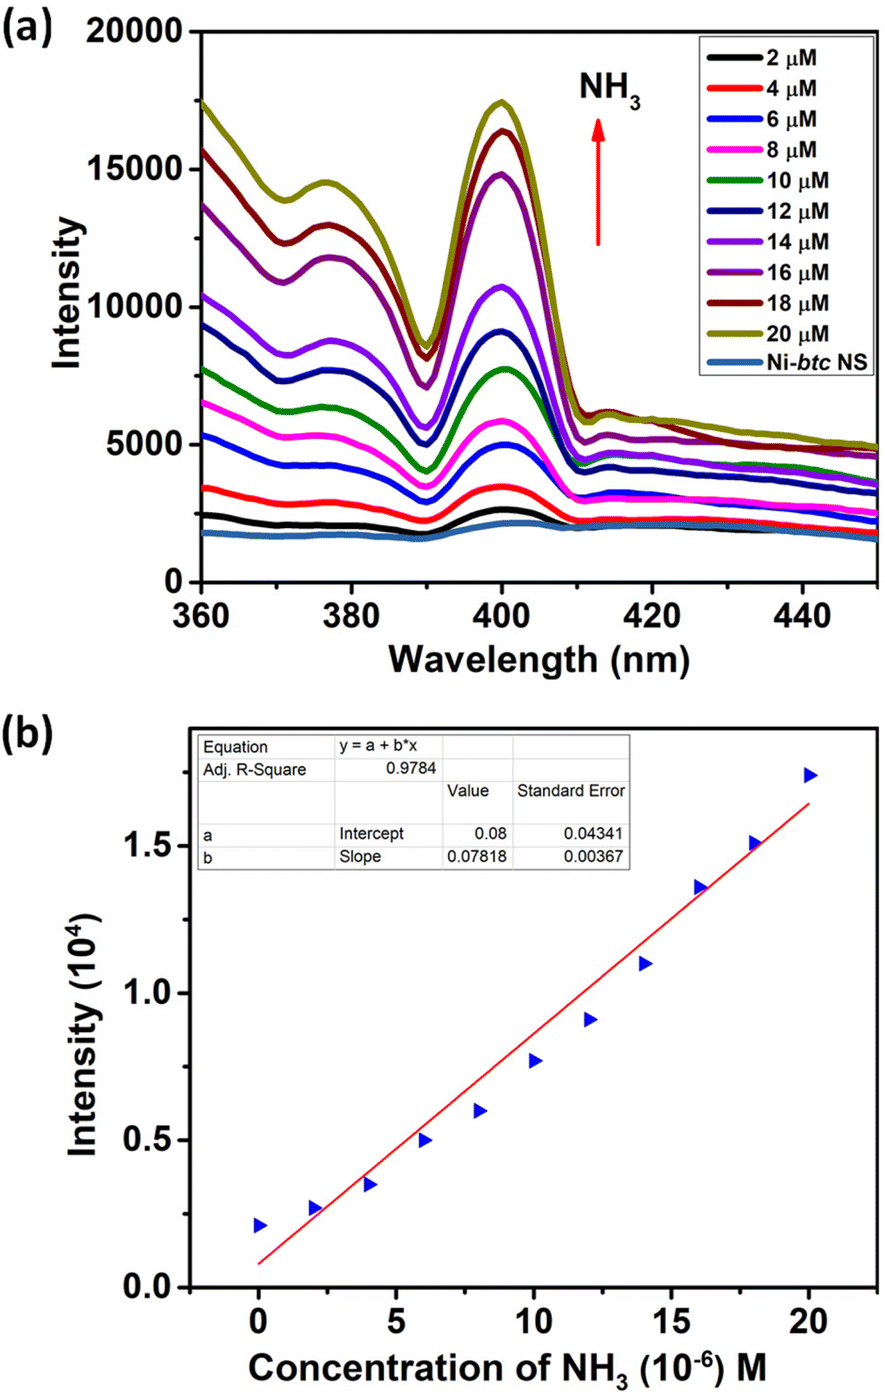 | ||
| Fig. 2 (a) Emission spectrum of Ni-btc NS dispersed in water showing increase in intensity upon gradual addition of ammonia solution. (b) Determination of LOD via linear fitting of the fluorescence intensity of Ni-btc NS upon adding different concentrations of ammonia solution at λemi = 400 nm (upon λexc = 310 nm). | ||
Framework stability and multicyclic detection
Additionally, to assess the stability of MOF NS in amines and ammonia solutions, they were immersed in 5 mM solutions of each aliphatic amine and ammonia for 24 hours. Then, PXRD analysis was conducted, revealing that the MOF NS retained their main peaks, that is they are highly stable in aqueous amines and ammonia solutions (Fig. 3). To check the multicyclic detection ability of MOF NS, after each experiment, we retrieved the material through centrifugation, then rinsed it with distilled water, and air-dried. Subsequently, the recovered material showed almost similar enhancement in fluorescence across five sensing-recovery cycles (Fig. S15†), demonstrating that these Ni-btc NS can be reused without any loss of their sensing ability.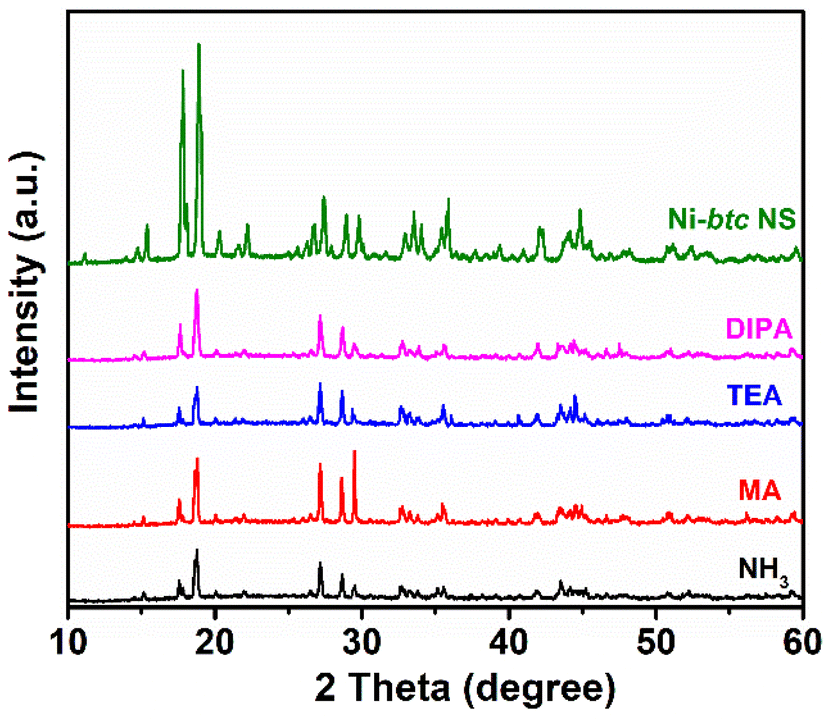 | ||
| Fig. 3 PXRD patterns of Ni-btc NS before and after immersing in amines and ammonia solution for 24 h. | ||
The fluorescence lifetime of MOF NS, after the addition of various analytes, was recorded and it showed no significant change in lifetime (Fig. S14 and Table S1†).
Mechanistic insight into the sensing
To unravel the mechanism (depicted in Scheme 2) behind the ‘turn-on’ fluorescence behavior, we conducted density functional theory (DFT) calculations in conjunction with the experimental results. The computational analysis yielded the highest occupied molecular orbital (HOMO) and lowest unoccupied molecular orbital (LUMO) energy levels for NH3, MA, TEA, and DIPA (see Table S2†). In parallel, cyclic voltammetry studies were performed for MOF NS (in Fig. S16†), yielding EHOMO = −5.54 eV and ELUMO = −3.35 eV values.39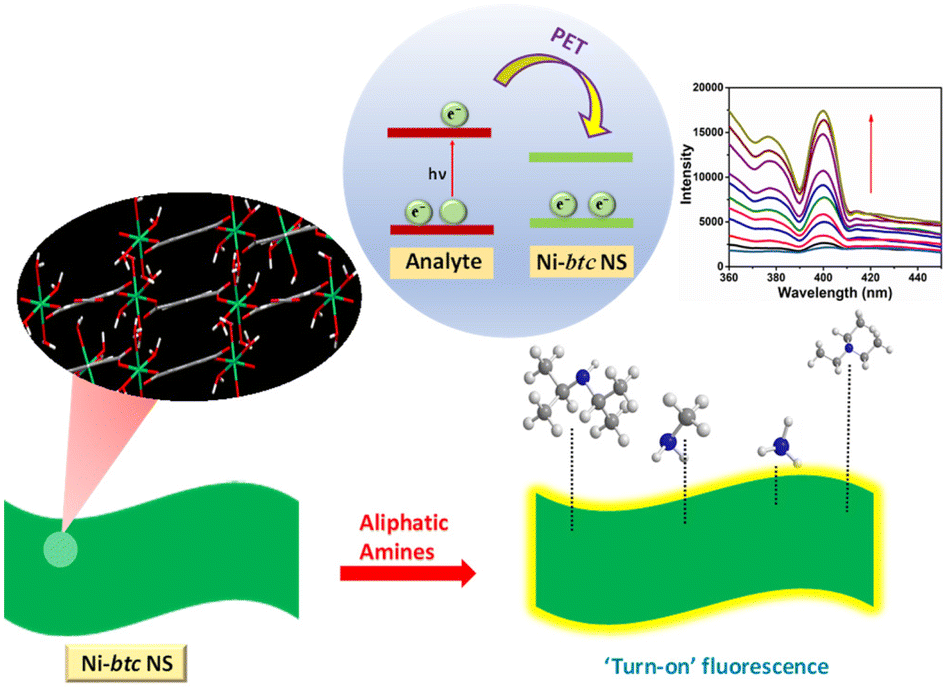 | ||
| Scheme 2 Schematic illustration of the aliphatic amine sensing by Ni-btc NS. | ||
The phenomenon of fluorescence enhancement is completely opposite to fluorescence quenching. Previous studies suggest that in the case of electron-deficient analytes, the electrons from the LUMO/conduction band of the MOF are transferred to the LUMO of the analyte, which results in fluorescence quenching. Conversely, for electron-rich analytes, the excited electrons shift from the LUMO of the analyte to the conduction band (CB) of the MOF, leading to enhanced radiative emission.40 In our case, the analytes are electron-rich amines and upon comparing the LUMOs of amines and Ni-btc NS, the amines (Fig. S17†) exhibited a higher LUMO energy level than that of the MOF. Consequently, upon photoexcitation, electrons would migrate from the LUMO of the amines to the LUMO of the MOF, making it more populated, and hence resulting in fluorescence enhancement.
The expected order of fluorescence enhancement in general, is correlated with the lower LUMO of the amine, i.e. amine with the lower LUMO will be able to transfer more electrons to MOF and should show more enhancement in fluorescence. However, our findings deviate from this trend of LUMO energies, with the order of fluorescence enhancement being NH3 (67.1%) > MA (44.6%) > DIPA (40.4%) > TEA (33.1%) (Fig. S13†). This deviation indicates the influence of other factors, such as dipole–dipole interactions and hydrogen bonding between the amines and the MOF.26 As our MOF NS are not highly porous (Fig. S4†), only surface interactions are possible. Therefore, electron-rich analytes can undergo dipole–dipole interactions with the MOF ligand, which leads to the phenomenon of electron transfer. Each amine has a different extent of interaction with Ni-btc NS depending upon its size and dipole moment. The calculated dipole moments of different amines (Fig. S18†) are in correlation with the order of fluorescence enhancement, i.e. more dipole moment leads to more interaction with Ni-btc NS and hence, more increase in fluorescence. Among all, NH3 has the maximum dipole moment, therefore, it has the highest fluorescence enhancement and this aligns well with the experimental results.
Mixed matrix membrane
For practical sensing application purposes, we fabricated a Mixed Matrix Membrane (MMM) based on Ni-btc NS. The MMM incorporates MOF particles as inorganic fillers, preserving the porosity and chemical functionality of the MOF while providing a stable and flexible membrane. This integration combines the advantageous properties of both components in the MOF–MMM.27,41 The membrane was created by blending MOF NS into a DMF solution of PVDF (polyvinylidene fluoride), after 15 minutes of stirring, the slurry was drop-cast onto a glass substrate followed by immersion in deionized water and air-dried. A flexible and foldable Ni-btc NS MMM was obtained as shown in Fig. 4a and b. From FESEM, the morphology of the pure PVDF membrane (Fig. 4c–e) was found to display a smooth surface, while the Ni-btc NS MMM (Fig. 4f–h) showed that MOF NS particles were distributed throughout the membrane. Fig. S19† is the EDS mapping of the cross-section of the membrane, illustrating Ni's presence in the membrane. The PXRD analysis of Ni-btc NS MMM and pure PVDF is presented in Fig. 5, showcasing the presence of characteristic peaks from both pure PVDF and Ni-btc NS in the membrane. This indicates the well-preserved structural integrity of MOF NS within the PVDF membrane. | ||
| Fig. 4 (a and b) Elucidating the flexibility of membrane; (c) and (d) FESEM images of the PVDF membrane indicating smooth surface; (e) FESEM image of the cross-section of PVDF membrane; (f and g) FESEM images of Ni-btc NS MMM showing MOF NS embedded in membrane and (h) FESEM image of the cross-section of Ni-btc NS MMM. | ||
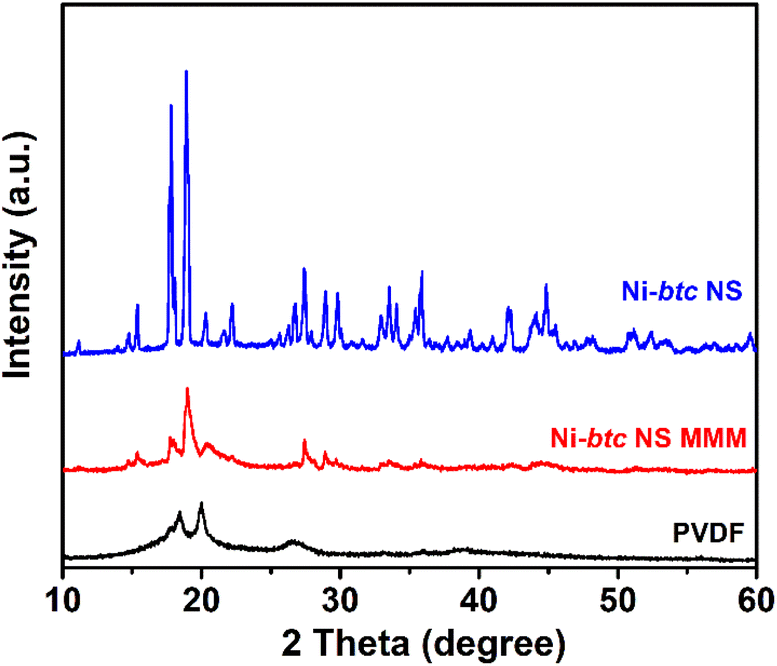 | ||
| Fig. 5 PXRD of Ni-btc NS, Ni-btc NS MMM, and PVDF. | ||
On-site detection
To illustrate the membrane's sensing capability, it was exposed to NH3 vapors emanating from ammonia solution, and within minutes, the membrane underwent a noticeable color shift from green to blue (Fig. 6a). In the case of aliphatic amines, MA induced a prominent color change, turning the membrane to dark green (Fig. 6b), while a slight color change was observed for DIPA and no color change was seen in the case of TEA when the membrane was exposed to the respective amine's vapors (Fig. 6c and d). This underscores the membrane's selectivity for aliphatic amines. The membrane was also tested for water vapors (Fig. S20†), and it was found to have no impact on the color of the membrane.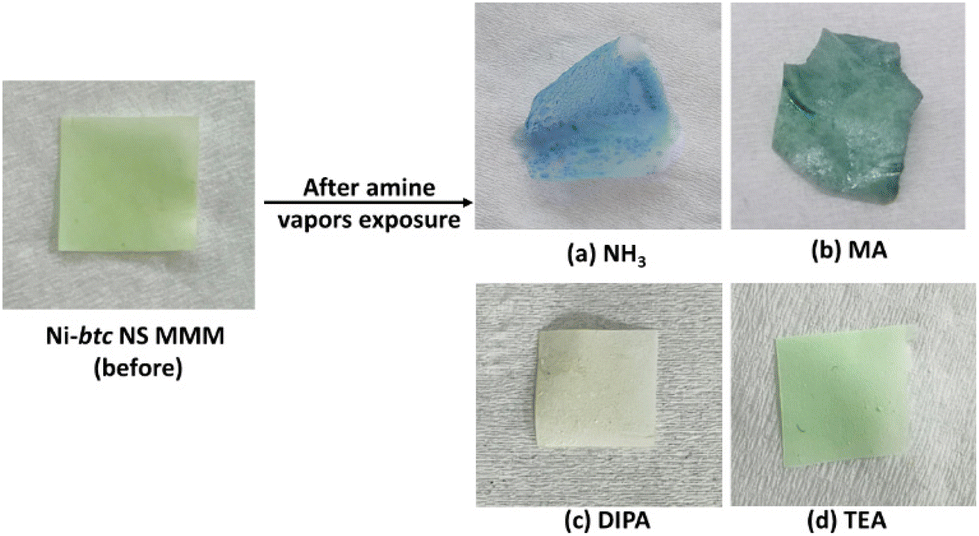 | ||
| Fig. 6 Visible color change in Ni-btc NS MMM upon exposure to different amine vapors. | ||
To assess the membrane's recyclability towards NH3, five consecutive exposure and regeneration experiments were conducted, followed by post-PXRD and FESEM analyses. Fig. S21† demonstrates the membrane's consistent colorimetric sensing across the five cycles, highlighting its remarkable recyclability. Post-exposure PXRD analysis after five cycles, showed peak broadening and decrease in peak intensity, indicating a gradual loss of MOF NS crystallinity over time. However, notably, no additional peaks were observed, signifying the stability of the Ni-btc NS MMM even after prolonged (Fig. S22†). We have also examined the morphology of the membrane (Fig. S23†), revealing an increase in surface roughness, that was also observed in PXRD studies.
Furthermore, we conducted on-site ammonia detection using the well-known reaction between ammonium chloride and sodium hydroxide, which releases ammonia along with water and sodium chloride. The membrane was placed inside a round-bottom flask containing ammonium chloride and sodium hydroxide reactants. As the reaction progressed, the membrane exhibited a distinct color change within a few minutes (Fig. S24†). This straightforward organic reaction validates the ability of Ni-btc NS to sense ammonia under real-time conditions.
To test the real-life sensing applicability of Ni-btc NS, we performed an experiment with a model of contaminated wastewater.15 Fig. S25† demonstrates a relative increase in fluorescence of Ni-btc NS in wastewater, upon the addition of different concentrations of NH3, highlighting the material's good sensitivity towards NH3 even in the presence of other ions in the wastewater, with the high recovery percentage (see Table S5†).
Conclusions
Highly water-stable ultrathin Ni-btc NS with a thickness of approximately 4.15 nm were successfully synthesized, using the 2D oxide sacrifice approach (2dOSA). These MOF NS exhibited excellent sensitivity in detecting aliphatic amines and ammonia in an aqueous medium through a “turn-on” fluorescence process, which is rare in itself. Density functional theory (DFT) calculations elucidated the electron transfer mechanism responsible for fluorescence enhancement. Also, discriminated dipole–dipole interactions between Ni-btc NS and analytes, resulted in different fluorescence behaviours among amines, with fluorescence enhancement in order NH3 > MA > DIPA > TEA. To assess the real-time application of MOF NS, a flexible Mixed Matrix Membrane (MMM) was fabricated that demonstrated a visible color change in the presence of ammonia and aliphatic amines vapors. Hence, this work opens avenues for exploring more 2D MOF materials for different environmental applications.Author contributions
All authors have given approval to the final version of the manuscript.Conflicts of interest
There are no conflicts to declare.Acknowledgements
MS, RL, and AKD acknowledge INST for Ph.D. fellowships. MS thanks INST for financial and infrastructural support. MS also acknowledges SERB-DST project EEQ/2022/000149 for funding.References
- A. E. Yuzbasıoglu, C. Avsar and A. O. Gezerman, Curr. Res. Green Sustainable Chem., 2022, 5, 100307 CrossRef.
- X. Liang, Z. Chen, H. Wu, L. Guo, C. He, B. Wang and Y. Wu, Carbon, 2014, 80, 268–278 CrossRef CAS.
- A. Fekete, A. K. Malik, A. Kumar and P. Schmitt-Kopplin, Crit. Rev. Anal. Chem., 2010, 40, 102–121 CrossRef CAS.
- W. Wang, S. Ren, H. Zhang, J. Yu, W. An, J. Hu and M. Yang, Water Res., 2011, 45, 4930–4938 CrossRef CAS PubMed.
- Y. P. Li, S. N. Li, Y. C. Jiang, M. C. Hu and Q. G. Zhai, Chem. Commun., 2018, 54, 9789–9792 RSC.
- F. P. M. Jjunju, S. Maher, D. E. Damon, R. M. Barrett, S. U. Syed, R. M. A. Heeren, S. Taylor and A. K. Badu-Tawiah, Anal. Chem., 2016, 88, 1391–1400 CrossRef CAS PubMed.
- N. A. Travlou, K. Singh, E. Rodriguez-Castellon and T. J. Bandosz, J. Mater. Chem. A, 2015, 3, 11417–11429 RSC.
- F. Kamarei, H. Ebrahimzadeh and A. A. Asgharinezhad, J. Sep. Sci., 2011, 34, 2719–2725 CrossRef CAS PubMed.
- F. Kamarei, H. Ebrahimzadeh and Y. Yamini, J. Hazard. Mater., 2010, 178, 747–752 CrossRef CAS PubMed.
- Yu. Malinina, M. Ya. Kamentsev, I. I. Timofeeva, L. N. Moskvin, N. M. Yakimova and I. D. Kuchumova, J. Anal. Chem., 2019, 74, 27–31 CrossRef CAS.
- T. Wang, Z. Sun, D. Huang, Z. Yang, Q. Ji, N. Hu, G. Yin, D. He, H. Wei and Y. Zhang, Sens. Actuators, B, 2017, 252, 284–294 CrossRef CAS.
- Y. Han, Y. Liu, C. Su, S. Wang, H. Li, M. Zeng, N. Hu, Y. Su, Z. Zhou, H. Wei and Z. Yang, Sens. Actuators, B, 2019, 296, 126666 CrossRef CAS.
- H. Luo, J. Shi, C. Liu, X. Chen, W. Lv, Y. Zhou, M. Zeng, J. Yang, H. Wei, Z. Zhou, Y. Su, N. Hu and Z. Yang, Nanotechnology, 2021, 32, 445502 CrossRef CAS PubMed.
- R. Ladhi, D. Rani and M. Singh, New J. Chem., 2023, 47, 9714–9720 RSC.
- D. I. Pavlov, T. S. Sukhikh, A. A. Ryadun, V. V. Matveevskaya, K. A. Kovalenko, E. Benassi, V. P. Fedin and A. S. Potapov, J. Mater. Chem. C, 2022, 10, 5567–5575 RSC.
- C. Hou, G. Tai, Y. Liu and X. Liu, Nano Res., 2022, 15, 2537–2544 CrossRef CAS.
- C. Hou, G. Tai, B. Liu, Z. Wu and Y. Yin, Nano Res., 2021, 14, 2337–2344 CrossRef CAS.
- C. Hou, G. Tai, Y. Liu, R. Liu, X. Liang, Z. Wu and Z. Wu, Nano Energy, 2022, 97, 107189 CrossRef CAS.
- C. Hou, G. Tai, Y. Liu, Z. Wu, Z. Wu and X. Liang, J. Mater. Chem. A, 2021, 9, 13100–13108 RSC.
- Z. Wu, G. Tai, R. Liu, W. Shao, C. Hou and X. Liang, J. Mater. Chem. A, 2022, 10, 8218–8226 RSC.
- X. Liu, C. Hou, Y. Liu, S. Chen, Z. Wu, X. Liang and G. Tai, J. Mater. Chem. A, 2023, 11, 24789–24799 RSC.
- C. Hou, G. Tai, Y. Liu, Z. Wu, X. Liang and X. Liu, Nano Res. Energy, 2023, 2, e9120051 CrossRef.
- M. K. Goshisht and N. Tripathi, J. Mater. Chem. C, 2021, 9, 9820–9850 RSC.
- T. He, B. Ni, S. Zhang, Y. Gong, H. Wang, L. Gu, J. Zhuang, W. Hu and X. Wang, Small, 2018, 14, 1703929 CrossRef PubMed.
- V. K. Maka, A. Mukhopadhyay, G. Savitha and J. N. Moorthy, Nanoscale, 2018, 10, 22389–22399 RSC.
- L. Cao, Z. Lin, W. Shi, Z. Wang, C. Zhang, X. Hu, C. Wang and W. Lin, J. Am. Chem. Soc., 2017, 139, 7020–7029 CrossRef CAS PubMed.
- H. Xu, F. Zhong, F. Chen, T.-X. Luan, P. Li, S. Xu and J. Gao, J. Mater. Chem. C, 2022, 10, 7469–7475 RSC.
- Q. Guo, X. Zhang, Y. Kang and Y. Ni, Inorg. Chem., 2024, 63, 2977–2986 CrossRef CAS PubMed.
- D. Wong, A. Phani, S. Homayoonnia, S. S. Park, S. Kim and O. Abuzalat, Adv. Mater. Interfaces, 2022, 9, 2102086 CrossRef CAS.
- Z. Wang, G. Wang, H. Qi, M. Wang, M. Wang, S. Park, H. Wang, M. Yu, U. Kaiser, A. Fery, S. Zhou, R. Dong and X. Feng, Chem. Sci., 2020, 11, 7665–7671 RSC.
- Y. Peng, Y. Li, Y. Ban, H. Jin, W. Jiao, X. Liu and W. Yang, Science, 2014, 346, 1356–1359 CrossRef CAS PubMed.
- T. Kambe, R. Sakamoto, K. Hoshiko, K. Takada, M. Miyachi, J. H. Ryu, S. Sasaki, J. Kim, K. Nakazato, M. Takata and H. Nishihara, J. Am. Chem. Soc., 2013, 135, 2462–2465 CrossRef CAS PubMed.
- A. Pustovarenko, M. G. Goesten, S. Sachdeva, M. Shan, Z. Amghouz, Y. Belmabkhout, A. Dikhtiarenko, T. Rodenas, D. Keskin, I. K. Voets, B. M. Weckhuysen, M. Eddaoudi, L. C. P. M. De Smet, E. J. R. Sudholter, F. Kapteijn, B. Seoane and J. Gascon, Adv. Mater., 2018, 30, 1707234 CrossRef PubMed.
- L. Zhuang, L. Ge, H. Liu, Z. Jiang, Y. Jia, Z. Li, D. Yang, R. K. Hocking, M. Li, L. Zhang, X. Wang, X. Yao and Z. Zhu, Angew. Chem., 2019, 131, 13699–13706 CrossRef.
- H. Yan, D. Zhang, J. Xu, Y. Lu, Y. Liu, K. Qiu, Y. Zhang and Y. Luo, Nanoscale Res. Lett., 2014, 9, 424 CrossRef PubMed.
- S. Chowdhury, N. L. Torad, A. Ashok, G. Gumilar, W. Chaikittisilp, R. Xin, P. Cheng, M. I. Ul Hoque, M. A. Wahab, M. R. Karim, B. Yuliarto, M. S. Hossain, Y. Yamauchi and Y. V. Kaneti, Chem. Eng. J., 2022, 450, 138065 CrossRef CAS.
- D. Rani, A. Singh, R. Ladhi, L. Singla, A. R. Choudhury, K. K. Bhasin, C. Bera and M. Singh, ACS Sustainable Chem. Eng., 2022, 10, 6981–6987 CrossRef CAS.
- R. Zhang, C. A. Tao, R. Chen, L. Wu, X. Zou and J. Wang, Nanomaterials, 2018, 8, 1067 CrossRef PubMed.
- T. Leelasree, M. Dixit and H. Aggarwal, Chem. Mater., 2023, 35, 416–423 CrossRef CAS.
- Z. Hu, B. J. Deibert and J. Li, Chem. Soc. Rev., 2014, 43, 5815–5840 RSC.
- T. Kitao, Y. Zhang, S. Kitagawa, B. Wang and T. Uemura, Chem. Soc. Rev., 2017, 46, 3108–3133 RSC.
Footnote |
| † Electronic supplementary information (ESI) available: PXRD, TGA spectra, SEM images, PL spectra of MOF and MMM etc. See DOI: https://doi.org/10.1039/d4nr00546e |
| This journal is © The Royal Society of Chemistry 2024 |