 Open Access Article
Experimental and theoretical exploration of the new stilbazolium-family single crystal grown by the integration of a novel anion for optical limiting and optoelectronic applications†
Sekar
Anand
and
Muthurakku
Usha Rani
 *
*
School of Advanced Sciences, Vellore Institute of Technology, Vellore 632 014, India. E-mail: usharani.m@vit.ac.in
First published on 1st February 2024
Abstract
Recently, laser-oriented devices have emerged as an essential component of modern technology. These high-intensity devices also adversely affect the human eyes and skin. To avoid such scenarios, the development of materials capable of cutting off high-intensity laser light is an active area of research. The current work aims to develop novel optical limiting single crystals capable of restricting the intensity of laser light. In order to achieve this, a novel third-order-active single crystal of 4-[2-(4-dimethylamino-phenyl)-vinyl]-1-methyl-pyridinium 4-aminoazobenzene-4′-sulfonate (DMMA) was efficaciously grown through a slow evaporation technique. The structure of this new ionic crystal was confirmed via single-crystal X-ray analysis (SCXRD). The characteristic peaks of each of the functional groups in the DMMA crystal were explored via Fourier transform infrared (FTIR) spectroscopy. The linear optical characteristics of the DMMA crystal were evaluated through ultraviolet-visible-infrared (UV-VIS-NIR) spectroscopy and photoluminescence analysis. The calculated optical constants and emission wavelength (610 nm) indicate that the grown crystal can be employed in optoelectronic applications. Computational analysis was carried out to probe the inter- and intra-molecular interactions occurring within the crystal. The third-order susceptibility (χ3) value of the novel ionic crystal shows the suitability of the title compound for optical limiting applications.
Introduction
The inevitable rise in laser-driven technology has led to a demand for materials capable of protecting both human operators and sensitive instruments from the damage caused by these high energy beams. In particular, in the defence sector, laser light pointed towards a tank or fighter aircraft can lead to flash blindness in the operator, which may result in a huge catastrophe.1 In order to avoid such scenarios, devices capable of converting or restricting these high-intensity light beams into low-intensity beams before they reach the eyes of the operator or optical sensors are needed.2,3 Optical limiters are devices that can potentially suppress undesired radiation above the threshold fluence without altering the input energy of the laser light irradiance. A pressing priority has been assigned to constructing optical limiting devices that could be used in daily life.4 In order to use a material in an optical limiting application, it should possess a high nonlinear absorption property. An extensive survey of the literature indicates that various materials, such as fullerene and its derivatives, carbon nanotubes, carbon black suspensions, organic dyes, organometallics, semiconductors, chalcogenides, etc., have been used as optical limiters.2 Despite the development of these many different materials, the quest for an ideal optical limiter is still ongoing. This is mainly due to the limitations associated with each of the above-mentioned materials. In the case of semiconductors, chalcogenides, fullerene and organic dyes, the operating wavelength range is only in the IR regime; this narrow operating wavelength restricts its usage in real-life applications.2 The breakage of carbon particles during long-term use limits the practical usage of carbon black suspensions. Carbon nanotubes exhibit high optical limiting properties, but they are effective only when the source is a nano-pulsed laser. These constraints have led the research community to look beyond the existing materials. In general, nonlinear materials have substantial applications across multiple domains, such as deep UV lasers, optical data storage, optical switches, photodynamic therapy, and optical limiting devices, among many others.5–8 Their inbuilt higher nonlinearity and the ease of tuning their structure based on the requirements have made organic NLO materials the frontrunners over their inorganic counterparts.9 These versatile features of the organic NLO materials have inspired many researchers to concentrate on organic materials, and as a consequence, many novel organic NLO materials have been reported in the recent past.10According to the existing reports, organic stilbazolium derivative NLO materials have exhibited high nonlinearities. Many research works based on varying the constituent parts (cation and anion) of already reported derivatives are currently in progress.11–13 The present work aims to develop a new optical limiting material based on a stilbazolium derivative by adapting the strategy of integrating a novel anion into the prevailing stilbazolium derivative structure. The inclusion of this new anion will have a direct impact on the crystal stacking and the nonlinear response of the material. A vast survey of the literature was carried out to choose a new ideal anion, which helps in aligning the crystal in a centrosymmetric fashion to exhibit third-order NLO properties. As a result of this quest, a new optimal anion material, namely, 4-aminoazobenzene-4′-sulfonate, was identified and utilized in the present work. Azobenzene and its related compounds have attracted huge attention owing to their wide range of applications across diverse sectors such as photonics, imaging, storage, liquid crystals and NLO applications.14 Their ability to switching between trans (E) and cis (Z) isomers and the existence of particular electronic structures within the molecules are the rationale behind the wide usage of the azo group and its derivatives. This switching between the cis and trans configurations can prompt various molecular movements within the material, which leads to large and stable optical anisotropy.15 The N![[double bond, length as m-dash]](https://www.rsc.org/images/entities/char_e001.gif) N double bond affixed to the two phenyl rings will also serve as a pathway for the motion of π-electrons within the azo compound from the donor to the acceptor moiety. Due to this charge transfer process (D–π–A), the nonlinearity exhibited by these derivative materials is comparatively high. Additionally, the non-covalent interactions between the organic stilbazolium cation and the azobenzene sulfonate anion may also boost the nonlinearity of the title crystal.16 Crystals of the newly developed 4-[2-(4-dimethylamino-phenyl)-vinyl]-1-methyl-pyridinium 4-aminoazobenzene-4′-sulfonate (DMMA) were cultivated via a slow evaporation solution growth technique. The main aspiration of this work is to inspect the structural, linear, nonlinear optical and optical limiting characteristics of the newly developed stilbazolium cation and azo anion mixture, which is reported for the very first time in this work. All the parameters derived from various characterization techniques indicate that the DMMA crystals are a potential contender for optoelectronic and optical limiting applications.
N double bond affixed to the two phenyl rings will also serve as a pathway for the motion of π-electrons within the azo compound from the donor to the acceptor moiety. Due to this charge transfer process (D–π–A), the nonlinearity exhibited by these derivative materials is comparatively high. Additionally, the non-covalent interactions between the organic stilbazolium cation and the azobenzene sulfonate anion may also boost the nonlinearity of the title crystal.16 Crystals of the newly developed 4-[2-(4-dimethylamino-phenyl)-vinyl]-1-methyl-pyridinium 4-aminoazobenzene-4′-sulfonate (DMMA) were cultivated via a slow evaporation solution growth technique. The main aspiration of this work is to inspect the structural, linear, nonlinear optical and optical limiting characteristics of the newly developed stilbazolium cation and azo anion mixture, which is reported for the very first time in this work. All the parameters derived from various characterization techniques indicate that the DMMA crystals are a potential contender for optoelectronic and optical limiting applications.
Single-crystal XRD
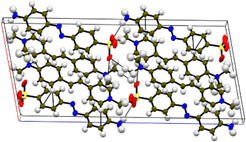
Single-crystal X-ray diffraction (SCXRD) was chosen as a suitable analysis technique to confirm the formation of the samples. In addition, it provides crystallographic details that give insight into the crystal system, space group, the different bonds and their corresponding angles and the intermolecular interactions responsible for the stabilization of the material. A crystal with dimensions of 0.270 × 0.250 × 0.080 mm3 was placed in a D8 QUEST BRUKER instrument for the analysis. The ShelX package in the Apex 4 software was utilized to simulate the non-hydrogen bonds in the compound.17 All the calculated crystallographic data derived from the SCXRD technique are presented in Table 1, and the CIF file for the DMMA crystal is deposited in the CCDC data repository (2233751†). The centrosymmetric arrangement was confirmed by the P21/c space group, and the lattice parameter values indicate that the titular crystal crystallized in the monoclinic crystal system (a = 12.3295(9) Å, b = 7.5517(5) Å, c = 27.4700(19) Å and α = 90°, β = 100.665(2)°, γ = 90°). The crystal structure and packing image of the DMMA crystal, along with the important intermolecular interactions, are depicted in Fig. 1. The various bond lengths and angles involved in the crystal structure are tabulated in Tables S1 and S2 in the ESI.† The overall crystal structure is divided into two halves, namely, the positive cation (stilbazolium) and negative anion (amino-azo). The olefinic bond (C![[double bond, length as m-dash]](https://www.rsc.org/images/entities/char_e001.gif) C) present in the stilbazolium cation is arranged in the trans configuration, and its torsional angle (C16–C19
C) present in the stilbazolium cation is arranged in the trans configuration, and its torsional angle (C16–C19![[double bond, length as m-dash]](https://www.rsc.org/images/entities/char_e001.gif) C20–C21) is 179.89°.18 The coplanarity of the two methyl groups (dimethyl) attached to the nitrogen atom of the amino group in the cation section was measured with respect to the aromatic ring through the torsional angles, which were found to be C25–C24–N4–C28 (−16.7°) and C23–C24–N4–C27 (9.8°). The differences observed in the torsional angles clearly show that there is a deviation in the coplanarity. The novel amino azo counter anion comprises SO3 and NH2 moieties. The sulfonate (S) atom in the anion section is attached to three oxygen atoms via single bonds (S–O); the lengths and angles of these bonds range from 1.355 to 1.588 Å and 107 to 121°. In the case of NH2, the bonds that link the nitrogen and hydrogen atoms have lengths in the range of 0.806 and 0.869 Å with a bond angle of 125°. The bond length of the characteristic bond of the azo (N
C20–C21) is 179.89°.18 The coplanarity of the two methyl groups (dimethyl) attached to the nitrogen atom of the amino group in the cation section was measured with respect to the aromatic ring through the torsional angles, which were found to be C25–C24–N4–C28 (−16.7°) and C23–C24–N4–C27 (9.8°). The differences observed in the torsional angles clearly show that there is a deviation in the coplanarity. The novel amino azo counter anion comprises SO3 and NH2 moieties. The sulfonate (S) atom in the anion section is attached to three oxygen atoms via single bonds (S–O); the lengths and angles of these bonds range from 1.355 to 1.588 Å and 107 to 121°. In the case of NH2, the bonds that link the nitrogen and hydrogen atoms have lengths in the range of 0.806 and 0.869 Å with a bond angle of 125°. The bond length of the characteristic bond of the azo (N![[double bond, length as m-dash]](https://www.rsc.org/images/entities/char_e001.gif) N) moiety is 1.232 Å. The torsional angle of the (N
N) moiety is 1.232 Å. The torsional angle of the (N![[double bond, length as m-dash]](https://www.rsc.org/images/entities/char_e001.gif) N) is 178.3(2)°. The 3-D crystal network of the DMMA crystal is constructed by the continuous perpendicular arrangement of the stilbazolium cation with respect to the azo anion.
N) is 178.3(2)°. The 3-D crystal network of the DMMA crystal is constructed by the continuous perpendicular arrangement of the stilbazolium cation with respect to the azo anion.
| Identification code | DMMA |
| Empirical formula | C28H29N5O3S |
| Formula weight | 515.62 |
| Temperature | 299(2) K |
| Wavelength | 0.71073 Å |
| Crystal system | Monoclinic |
| Space group | P21/c |
| Unit cell dimensions | a = 12.3295(9) Å |
| b = 7.5517(5) Å | |
| c = 27.4700(19) Å | |
| α = 90° | |
| β = 100.665(2)° | |
| ν = 90° | |
| Volume | 2513.5(3) Å3 |
| Z | 4 |
| Density (calculated) | 1.363 Mg m−3 |
| Absorption coefficient | 0.170 mm−1 |
| F(000) | 1088 |
| Crystal size | 0.270 × 0.250 × 0.080 mm3 |
| Theta range for data collection | 2.040 to 26.377° |
| Index ranges | −15 ≤ h ≤ 15 |
| −9 ≤ k ≤ 9 | |
| −34 ≤ l ≤ 34 | |
| Reflections collected | 62![[thin space (1/6-em)]](https://www.rsc.org/images/entities/char_2009.gif) 873 873 |
| Independent reflections | 5127 [R(int) = 0.0539] |
| Completeness to theta = 25.242° | 99.6% |
| Absorption correction | Semi-empirical from equivalents |
| Max. and min. transmission | 0.7454 and 0.7026 |
| Refinement method | Full-matrix least-squares on F2 |
| Data/restraints/parameters | 5127/23/373 |
| Goodness-of-fit on F2 | 1.056 |
| Final R indices [I > 2sigma(I)] | R 1 = 0.0491, wR2 = 0.1118 |
| R indices (all data) | R 1 = 0.0750, wR2 = 0.1326 |
| Extinction coefficient | n/a |
| Largest diff. peak and hole | 0.568 and −0.424 e Å−3 |
Morphology
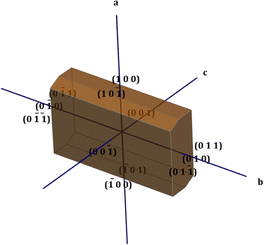
The physiochemical properties of the crystal differ along each growth plane due to the anisotropic behaviour exhibited by the crystal structure. In order to obtain a clear picture of these planes, the morphology of the crystal is very pivotal. The winXMorph software was used to generate the various crystallographic planes involved in the formation of crystal structure, and the simulated morphology diagram is shown in Fig. 2.19 In this particular work, the Bravais–Friedel–Donnay–Harker (BFDH) law was employed to predict the morphologically important growth faces.20These are the faces that have a larger interplanar spacing with the nearby faces and possess maximum density.21 In the DMMA crystal, overall, twelve crystal faces ((00![[1 with combining macron]](https://www.rsc.org/images/entities/char_0031_0304.gif) ), (001), (
), (001), (![[1 with combining macron]](https://www.rsc.org/images/entities/char_0031_0304.gif) 00), (100), (
00), (100), (![[1 with combining macron]](https://www.rsc.org/images/entities/char_0031_0304.gif) 01), (10
01), (10![[1 with combining macron]](https://www.rsc.org/images/entities/char_0031_0304.gif) ), (0
), (0![[1 with combining macron]](https://www.rsc.org/images/entities/char_0031_0304.gif) 0), (010), (0
0), (010), (0![[1 with combining macron]](https://www.rsc.org/images/entities/char_0031_0304.gif) 1), (011)) were observed. The calculated growth rates and morphologically important planes are depicted in Table S3 in the ESI.† As per the BFDH law, the growth rate is predominant in the short axis; the same is observed in the case of the DMMA crystal. From the table, it is obvious that the (0
1), (011)) were observed. The calculated growth rates and morphologically important planes are depicted in Table S3 in the ESI.† As per the BFDH law, the growth rate is predominant in the short axis; the same is observed in the case of the DMMA crystal. From the table, it is obvious that the (0![[1 with combining macron]](https://www.rsc.org/images/entities/char_0031_0304.gif) 1) and (011) faces, which belong to the short axis (b), have the highest growth rate (3.709).22
1) and (011) faces, which belong to the short axis (b), have the highest growth rate (3.709).22
Fourier transform infrared spectroscopy
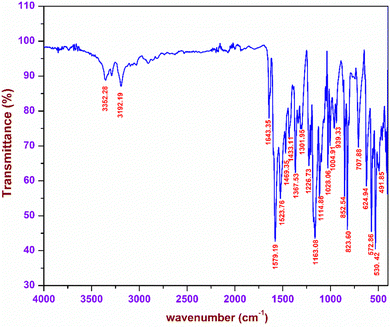
The characteristic vibrations arising due to the existence of various functional groups in the DMMA crystal were analysed with the aid of FTIR spectroscopy. These vibrations were used to affirm the formation of the novel material. In order to carry out the investigation, the KBr pellet of the title sample was placed in a SHIMADZU FTIR instrument, and the resultant spectrum was obtained in the range between 4000–400 cm−1 (Fig. 3). The titular crystal possesses two sections, namely, the stilbazolium cation and the newly incorporated aminoazo benzene sulfonate anion.The presence of the C![[double bond, length as m-dash]](https://www.rsc.org/images/entities/char_e001.gif) C bond in the styryl pyridinium bridge gives rise to a distinctive peak at 1643 cm−1.23 Typical vibrations corresponding to the CH3 functional group were observed due to the existence of a methyl group at both the ends of the stilbazolium cation. The peaks at 1469, 1367 and 1028 cm−1 correspond to the asymmetrical, symmetrical and rocking mode vibrations of the methyl group, respectively.24 The presence of a phenyl ring in the cation was confirmed by the characteristic peaks of the in plane and out-of-plane bending C–H vibrations. The peaks visible at 1301 and 1226 cm−1 are attributed to the in-plane C–H bending; similarly, the peaks raised at 939 and 707 cm−1 are the peaks of the out-of-plane C–H bending.25 In the case of the anion, the main vibrations were detected from the three oxygen atoms surrounding the sulphur atom. The symmetric and asymmetric vibrations of the SO2 functional group are present at 1163 and 1028 cm−1. The peak at 530 cm−1 implies the existence of SO3 scissoring vibrations.30 The other part of the counter anion consists of the azo and amino groups. The NH2 vibrations are responsible for the peaks at 3352 and 3192 cm−1. The wagging of the amino (NH2) group is confirmed by the peak at 707 cm−1. The characteristic peak of the azo (N
C bond in the styryl pyridinium bridge gives rise to a distinctive peak at 1643 cm−1.23 Typical vibrations corresponding to the CH3 functional group were observed due to the existence of a methyl group at both the ends of the stilbazolium cation. The peaks at 1469, 1367 and 1028 cm−1 correspond to the asymmetrical, symmetrical and rocking mode vibrations of the methyl group, respectively.24 The presence of a phenyl ring in the cation was confirmed by the characteristic peaks of the in plane and out-of-plane bending C–H vibrations. The peaks visible at 1301 and 1226 cm−1 are attributed to the in-plane C–H bending; similarly, the peaks raised at 939 and 707 cm−1 are the peaks of the out-of-plane C–H bending.25 In the case of the anion, the main vibrations were detected from the three oxygen atoms surrounding the sulphur atom. The symmetric and asymmetric vibrations of the SO2 functional group are present at 1163 and 1028 cm−1. The peak at 530 cm−1 implies the existence of SO3 scissoring vibrations.30 The other part of the counter anion consists of the azo and amino groups. The NH2 vibrations are responsible for the peaks at 3352 and 3192 cm−1. The wagging of the amino (NH2) group is confirmed by the peak at 707 cm−1. The characteristic peak of the azo (N![[double bond, length as m-dash]](https://www.rsc.org/images/entities/char_e001.gif) N) functional group is observed at 1523 cm−1.31 All the observed vibrations confirm the formation of the titular DMMA crystal.
N) functional group is observed at 1523 cm−1.31 All the observed vibrations confirm the formation of the titular DMMA crystal.
Ultraviolet visible near-infrared analysis
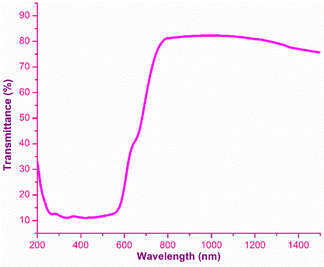
The analysis of the interaction of light with the grown material is of great importance, as it provides an vital information regarding where and how the synthesized material can be used in the context of photonics and optoelectronic applications.32 To effectually understand these interactions, UV-Vis-NIR spectroscopy was carried out using the Analytik Jena Specord 210 Plus instrument at room temperature over the UV (200 nm) to NIR (1500 nm) regions. The energy associated with the electronic transitions absorbance behaviour with respect to the wavelength and transparent regime can be obtained from this analysis.33 Other optical constants, such as the extinction coefficient, electrical and optical conductivity and the Urbach energy were determined to obtain insight into the optical characteristics of the DMMA crystal. The variation in the transmittance of the DMMA material with respect to wavelength is shown in Fig. 4. In the transmittance graph, the increase in transmittance (cut-off edge) is observed at 430 nm, which confirms the transitions of electrons from bonding (π) to nonbonding (π*) orbitals. The structural factor accountable for this π-to-π* transition in the novel title crystal is the presence of unsaturated compounds in both the stilbazolium cation (C![[double bond, length as m-dash]](https://www.rsc.org/images/entities/char_e001.gif) C) and azo (N
C) and azo (N![[double bond, length as m-dash]](https://www.rsc.org/images/entities/char_e001.gif) N) anion, as well as the occurrence of aromatic rings.
N) anion, as well as the occurrence of aromatic rings.
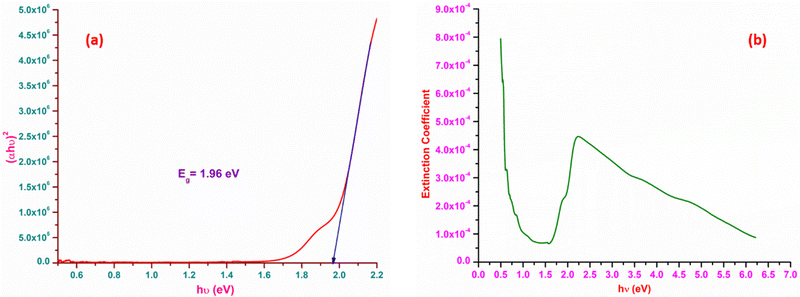
The most suitable materials for practical applications are those which possess a broad light transmission band. For the title ionic crystal, the transmittance window lies in the regime between the visible (430 nm) and NIR (1500 nm). This feature of the DMMA crystal suggests that the grown material can be used not only for NLO applications, but also for optoelectronic applications. The bandgap energy of the title compound was derived using the well-established Tauc equation.34 The plot of the photon energy vs. (αhν)2 is shown in Fig. 5(a). The direct bandgap of DMMA can be calculated directly by extrapolating the linear part of the curve, and it was ascertained to be 1.96 eV. The value of the bandgap indicates that the grown crystal falls into the semiconductor category.35 The obtained cut-off edge and bandgap value of the grown DMMA crystal were compared with those of several other stilbazolium derivative crystals and are tabulated in Table 2.
The loss arising from the scattering and absorption of electromagnetic waves within a material can be determined using the extinction coefficient (K). The calculated coefficient of absorption was used in eqn (1) below to determine the K value of the DMMA material.
 | (1) |
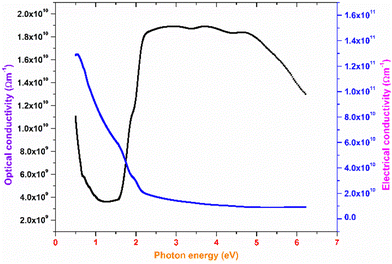
The plot of the extinction coefficient vs. photon energy is presented in Fig. 5(b). The inference from the graph indicates minimal loss (K = 10−4) in the crystal. In general, materials with a low K value are preferred for various computer processing applications.36 The optical conductivity value (σopt) provides details about the response of a material to incident photon energy. The following expression is used to estimate the optical conductivity.
 | (2) |
 | (3) |
The electrical conductivity of the title ionic crystal reaches the saturation region (1 × 10¹⁰ Ω m−1) at higher photon energy. The semiconducting behaviour of the material was indicated by the high σelc value at low photon energy and low value of σelc at higher energy.37
Urbach energy
In the bandgap regime, disorientation of the lattice planes or the inclusion of foreign particles might result in the formation of a weak absorption band. Details regarding impurities in the crystal can be obtained by determining the width of the absorption band.38 The width of the tail is the Urbach energy (Eu), which gives a clear picture of the level of defects in the crystal structure. The calculated linear absorption coefficient (α) is used to derive the Urbach energy value through the following equation.39 | (4) |
A graph of ln (α) vs. photon energy (Fig. S3 in the ESI†) was plotted to calculate the Urbach energy by taking the slope of the linear part of the curve. The reciprocal value of the slope is the value of the Urbach energy, which was estimated to be 0.29 eV. This low value suggests that the DMMA crystal has very few lattice plane disorientations or defects and high crystalline perfection.40
Refractive index dispersion
In order to explore the dissipation of the refractive index below the energy band gap, the Wemple and DiDomenico single oscillator model is employed. This model gives information about the inter-band electronic transition as a single oscillator.41 Information about the dependence of the refractive index on photon energy (below the bandgap) is highly crucial for nonlinear applications.42Fig. 7 presents a plot of the dispersion of the refractive index vs. photon energy in the below-band-gap regime. All the essential parameters, such as the dispersion energy (Ed), single oscillator energy (Eo) and the moment of the oscillator model (M−1 and M−3) were calculated by linear fitting of the obtained experimental data. The Eo and Ed values were deduced by incorporating the intercept and slope values of the straight line in the below expressions:43 | (5) |
| Eo = Ed × Intercept | (6) |
The Eo value represents the distance between the centres of gravity of the conduction and valence band, whereas Ed stands for the average inter-band optical transition strength. Along with these parameters, the moments of the single oscillator were also derived with the aid of following equations:
 | (7) |
Other dispersive parameters, such as oscillator strength (f) and static refractive index (no), were calculated using the following formulae.
 | (8) |
| f = EoEd | (9) |
All the calculated dispersion parameters are tabulated in Table S4 in the ESI.† The single oscillator strength (Eo) value gives insight into the average bond strength of the sample. In general, the lower the Eo value, the higher the nonlinear response of the material.44 In the case of DMMA, it is 1.9875 eV; this comparatively low Eo indicates that the grown crystal exhibits high nonlinearity.45
The grown DMMA crystal crystallized in the monoclinic crystal system, so its refractive index has three different components and can be evaluated using the below expressions:
 | (10) |
 | (11) |
 | (12) |
The calculated nx, ny and nz values are 1.474118, 1.424109 and 1.4113, respectively. The decreasing values of the refractive index from nx to nz indicate that the DMMA crystal belongs to the positive biaxial crystal class.46
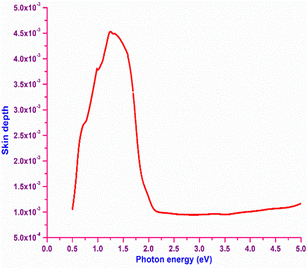
In order to obtain information about the portion of electromagnetic radiation penetrating inside a material, the skin depth (δ) of the material is calculated with respect to the photon energy. Numerically, it is defined as δ = 1/α, where α is the absorption coefficient. The plot of skin depth vs. photon energy is depicted in Fig. 8. It is obvious from the graph that the skin depth decreases at higher photon energy. Initially, increasing skin depth is observed until the photon energy reaches the bandgap (2 eV); beyond that point, the skin depth reaches saturation. The increase in the skin depth before the bandgap region is attributed by the absorption behaviour of the material, which implies that the skin depth is dependent on the transmittance (T).47
Sellmeier dispersion relation
The refractive index dispersion in the longer wavelength region can be deduced with the aid of the Sellmeier dispersion relation, whose governing equation is: | (13) |
 | (14) |
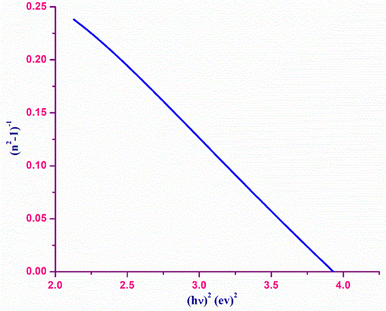
The term So represents the average oscillator strength, which is given by So = (no2 − 1)/λo2. The parameters no and λo, which are crucial to derive the So value, were obtained by calculating the slope and intercept values of the plot of (n2 − 1)−1versus λ−2 (Fig. S4 in the ESI†). The comparatively low So value implies that the bond energies drop until all the available valences are occupied.48 Overall, the linear optical properties analysis demonstrates the suitability of the grown DMMA crystal for various nonlinear optical and optoelectronic applications.
Photoluminescence analysis
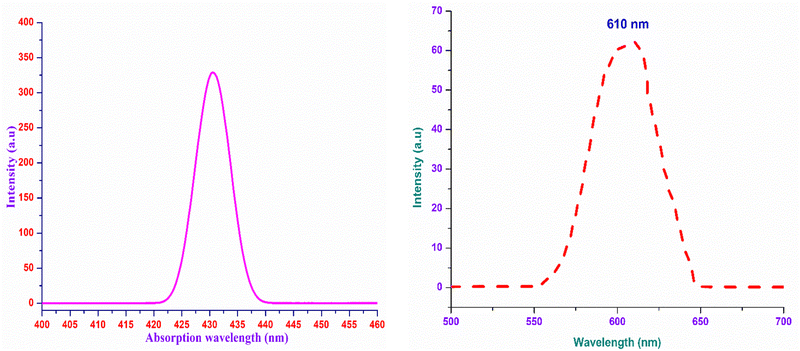
The use of the DMMA crystals in optoelectronics stream applications requires fundamental information regarding the behaviour of the material under the influence of visible light. In order to explore this, a non-destructive analysis, namely, the photoluminescence technique, was carried out. Since there is a direct relation between the emission and the temperature, the charge transfer mechanism and the level of defects, knowledge of these parameters is significant.49,50This analysis provides insight into whether the transitions occurring in the bandgap regime are due to the existence of discrete energy levels or the occurrence of impurities. A liquid sample of DMMA (solvent:methanol) was analysed using an F7000 FL spectrophotometer at room temperature to acquire its PL spectrum over the range of 500–700 nm. Under 430-nm excitation, only one peak emerged, which indicates that there is no foreign particle inclusion in the DMMA sample. The maximum of the single peak lies at 610 nm (Fig. 9(b)), which confirms the red-light radiative transition of the title compound. This visible emission is attributed to the existence of the chromophores in the cation. In addition, the transfer of charges within and among the cation and anion also contributes to the red shift.50,51 The difference in wavelength between the absorption maximum (Fig. 9(a)) and emission maximum in the same electronic transition gives rise to either a Stokes shift or anti-Stokes shift. If the emitted photon energy is less than the absorbed photon energy, then it is attributes to a Stokes shift.52 Similarly, the inverse phenomenon gives rise to an anti-Stokes shift. In the case of the DMMA crystal, the emitted photon energy is 2.0325 eV and absorbed photon energy is 2.883 eV, which clearly indicates that the DMMA crystal displays a Stokes shift (0.8505 eV). In general, vibrational energy relaxation is the phenomenon responsible for the Stokes shift in a material. Under the influence of electromagnetic radiation, the relaxation of the molecules usually occurs due to interaction with the surrounding lattice. The energy of the vibrational relaxer is annihilated by the continuous intermolecular motion of the lattice, which results in excitation of the lattice motion at higher-level energy states.52
Colour analysis
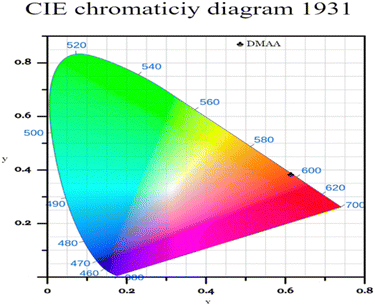
The Commission International de l’Eclairage (CIE) chromaticity plot for the luminous DMMA material was simulated and the output CIE plot is depicted in Fig. 10.This is a conventional method adopted around the world to recognize the emission colour. The X and Y coordinates of the DMMA sample are 0.612 and 0.383, which indicate red-light emission. These colour coordinates (X and Y) were used to detect the colour temperature (CCT) and colour purity of the material. The following equation was used to deduce the CCT:
| CCT = −449n3 + 3525n2 – 6823n + 5520.33 | (15) |
The term ‘n’ is the ratio between the inverse of the slope of the line and the chromaticity epicentre obtained from McCany's relation
 | (16) |
Eqn (17) was used to estimate the colour purity (CP):
 | (17) |
Frontier molecular orbital analysis
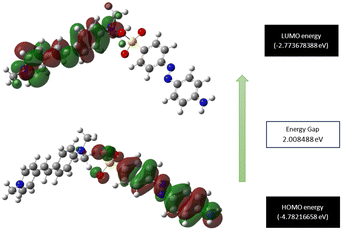
Exploration of the molecular orbital behaviour of the grown material is pivotal, as it provides valuable insights into the different electronic transitions involved, as well as the chemical reactivity and stability.54 The Gaussian 16 software package was used to assess the molecular orbital parameters. The theoretically predicted HOMO and LUMO energy levels of the DMMA crystal, along with the calculated excitation energy, are depicted in Fig. 11. In the HOMO region, all the electrons are delocalized around the stilbazolium cation; for the LUMO, the delocalization of electrons occurs in the counter anion. This charge distribution in the cation (HOMO) and anion (LUMO) indicates the transfer of electron density between them.55 The HOMO–LUMO examination provides conclusive evidence that intra-molecular charge transfer (ICT) occurs between the end-capping electron-donating (dimethyl moiety) to the competent electron-accepting moiety (pyridinium). The small energy difference between the HOMO and LUMO (2 eV) suggests the high polarizability of the material.56 This ICT and high-polarizability imply the strong nonlinear activity of the title ionic crystal.57The calculated energy gap between the HOMO and LUMO paves the way for the estimation of quantum descriptors. These parameters give us a comprehensive idea of the hardness and readiness of the synthesized material to react with the surrounding molecules (chemical reactivity). The lower the difference, the softer the material and higher its reactivity with its surroundings, and vice versa.58 The small energy difference (2 eV) affirms that the DMMA crystal falls into the soft material category and also possesses high reactivity. The calculated quantum descriptors of chemical hardness (η = 1.004245 eV) and chemical softness (σ = 0.995773 eV−1) also reaffirm the high responsiveness and softness of the crystal. The calculated electronegativity (χ) and chemical potential values (μ) are 3.777 eV and −3.777 eV, respectively. The high biological activity of the crystal structure is indicated by its high electrophilic index (ω = 7.1666 eV) and low nucleophilic index (N = 0.1395 eV−1) values.59 In the grown crystal, the value of ionization potential (I = 4.782 eV) is higher than the value of electron affinity (A = 2. 77 eV).
This emphasizes that the electron-donating nature is more predominant in the title ionic crystal than its electron-accepting capability. All the derived quantum receptors suggest that the title crystal possesses high chemical reactivity, biological activity and electron-donating ability.
Molecular electrostatic potential analysis
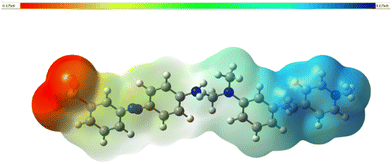
The molecular electrostatic potential (MEP) map is a 3-dimensional pictorial representation that demonstrates the first-order interaction between the positive unit charge and the distributed charge density arising from the nuclei and electrons. It is also a vital tool for assessing the various types of geometric interactions responsible for the initiation of nucleation during crystal growth.60 This can be studied by determining the reactive sites in the molecule and the particular regions in the molecule where the probability of electrophilic and nucleophilic attacks is more likely. To locate these sites, the 3D MEP was simulated with the aid of Gaussian 16 software. The resultant MEP image is depicted in Fig. 12. As per the colour grading index, the spots most vulnerable to electrophilic attack are indicated in red.Likewise, the preferred sites for nucleophilic attack are shaded blue.61 The isosurface value of the created MEP surface ranges from −0.175 (dark red) to 0.175 (dark blue). This surface provides valuable information regarding the charge density and the active sites in the molecules, where the nucleation and crystal growth process begin.
In the azo anion, the region over the SO3 atoms is entirely red (electrophilic), implying the high tendency of these atoms to accept hydrogen bonds. The nucleophilic reactive site (blue) can be seen in the stilbazolium cation, which indicates the hydrogen-donating nature of the cation (pyridine group).62
Mulliken charge analysis
An investigation of the quantum mechanical calculations requires information about the charges of the various atoms in the molecule. These charges were estimated using the electron population of the individual atoms, which can be computed using the Mulliken atomic charges. Atomic charges directly impact the molecular structure, polarization, dipole moment and electronic structure.63 The distribution of atomic charges indexed by the Mulliken population is depicted in Fig. S5 in the ESI.† The positive and negative charges are distributed throughout the molecule (cation and anion). The following are the atoms that possess a positive charge: all hydrogen atoms, carbon atoms (C1, C6, C11, C34, C38, C41, C47 and C52) and sulphur atoms (S). Among these positive charges, the sulphur atom has the largest positive charge (1.2583), followed by the carbon atom (C52) attached to the dimethyl group in the cation and the C6 atom in the anion connected to the aniline group. The nitrogen, oxygen, and remaining carbon atoms have a negative charge. The nitrogen (N23) atom in the anion section has the largest negative charge (0.8122). The three oxygen atoms (O25, O26 and O40) surrounding the positive sulphur atoms have the next highest negative charges. This charge distribution suggests hydrogen bonding interactions within and among the cation and anion through the nitrogen/oxygen (negative) and hydrogen/sulphur/carbon (positive) atoms.64Natural bond orbital (NBO) analysis
The interactions between all the donor (filled) Lewis-type natural bond orbitals and acceptor (empty) non-Lewis type natural bond orbitals were explored via natural bond orbital (NBO) analysis using the inbuilt NBO program in Gaussian 16 package.65 The electronic charge transfer between the filled and vacant orbitals gives valuable information about the strength of the intramolecular interactions occurring within the system.66 The greater the electron delocalization, the higher the stabilization energy. The stabilization energy related to each donor (i) and acceptor (j) orbital associated with delocalization from i to j can be derived explicitly with the equation.67 | (18) |
The presence of an intermolecular hydrogen bond (C61–H64⋯O24) in the grown DMMA crystal is affirmed by the electron transition between the lone pair oxygen (O24) and π* (C61–H64). The maximum contribution towards the stabilization of the compound is from the π* (C38–H43) to π* (C45–H47) transition, with a value of 140.21 kcal mol−1. All the other major contributions are depicted in Table S5 in the ESI.† All the results from the NBO analysis imply the existence of hydrogen interactions and inter- and intramolecular charge transfer processes across the conjugated pathway, which contribute to the NLO behaviour of the title crystal.68
Hirshfeld analysis
The Hirshfeld surface is a theoretical surface created over the molecular structure. It is computed by the summation of the density of the electrons in the system and is used to evaluate the various interactions happening inside the structure.69,70 Crystal Explorer 17 was employed to generate the surface over the DMMA molecule.71 The mapping of dnorm was calculated as a function of di and de, which are the distances from the interior and exterior of the Hirshfeld surface to the nearest atom. Red regions are observed over the dnorm surface (Fig. 13(a)), which indicate donor–acceptor sites.72 The bright red spot at the centre over the oxygen atom of the anion represents the hydrogen bond interaction (C–H⋯O) between the sulfonate anion and stilbazolium cation in the DMMA structure. The impact of the π–π stacking interaction on the molecular structure was assessed by calculating the curvature measures, such as shape index and curvedness. The dominance of the flat green colour with minimal blue edges in the curvedness plot (Fig. 13(c)) and the occurrence of vicinal red and blue speckles in the shape index curve (Fig. 13(b)) confirm the existence of π–π stacking interactions. A fingerprint 2D plot was generated for the DMMA crystal to delineate the various interatomic contacts that are responsible for the packing of the crystal. The percentage contributions of the different intermolecular interactions are depicted in Fig. 13(d). The major contribution (37.80%) towards crystal stability arises from the H⋯H interactions as a result of the occurrence of hydrogen atoms in the organic compound. The next major contributor towards the stability is attributed to the C⋯H/H⋯C intermolecular interactions, with contribution of 19.50 and 16%, respectively. The O⋯H/H⋯O interactions, which are due to the C–H⋯O hydrogen bonding interactions, have 9.20 and 8.60% contributions.73 The Hirshfeld surface analysis thus provides a complete overview of the intermolecular interactions occurring in the DMMA crystal.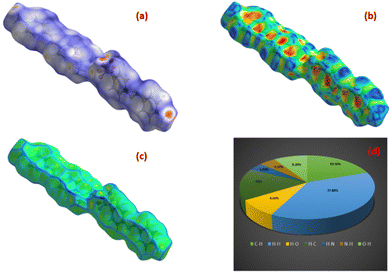 | ||
| Fig. 13 Hirshfeld surface of DMMA crystal: (a) dnorm, (b) shape index, (c) curvedness index and (d) 2D fingerprint plot. | ||
Nonlinear optical studies – Z scan
The outcome of the SCXRD analysis indicated the existence of inversion symmetry in the DMMA crystal structure. Neuman's principle states that the minimum nonlinearity exhibited by a centrosymmetric material is the χ3 effect, which means the second-order susceptibility χ2 value is zero.74 In order to probe the third-order nonlinear behaviour of the DMMA crystal, Z scan experimental analysis was executed. The main advantage of this technique over the other methods is that the values of the nonlinear refraction (n2) and nonlinear coefficient of absorption (β) can be collected directly through closed-aperture (CA) and open-aperture (OA) modes. To estimate the nonlinear refractive index (NLRI), a small aperture (closed-aperture mode) is placed in front of the detector. The nonlinear material behaves like a variable lens with respect to the incident intensity in this mode. In order to measure the nonlinear absorption coefficient, open-aperture mode is used; in this case all the transmitted light beam falls on the detector without aperture. A diode-pumped solid state laser (continuous wave) with green light (532 nm) emission is employed as the fundamental source for the Z-scan analysis. The sample is glided along the Z direction under a tightly focused Gaussian beam. The nonlinear response of the material is examined as a function of the output transmittance at a given position (Z). The sample is translated from the far field (−25 Z) to the focus (Z = 0) and then to the other end (+25 Z). Based on the disparity in the transmitted output, the nonlinear property of the sample was measured.Closed-aperture
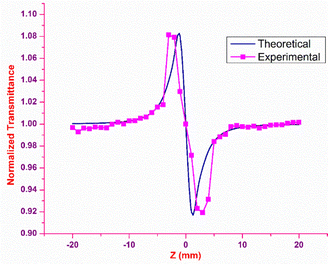
In closed-aperture mode, the transmitted light from the sample is permitted to fall on the detector after passing through an aperture. This transmitted light provides information about the variation of the nonlinear refractive index with respect to the input intensity. The intensity at the far field (away from the focus) is not sufficient to stimulate high nonlinear refraction (negligible amount), so only nominal changes are noticed at the verge. As the sample approaches the focus (Z = 0), the nonlinearity in the material starts to dominate, causing the sample to behave as a lens with a variable focal length, and the nonlinear refraction is the origin for this lens-like behaviour of the material. In the case of the DMMA crystal, an increase in transmitted light is observed before the focus (peak), which is followed by a decrease in the light transmittance (valley) beyond the focus. This peak-to-valley formation indicates the negative lens (self-defocusing) feature of the DMMA crystal. The use of the continuous wave laser as the source creates thermal effects on the surface of the crystal. The intensity-dependent refractive index is observed due to the local temperature difference between the laser irradiance spot and the fringe of the crystal sample.53 The closed aperture trace is used to estimate the phase shift, and from the calculated value, the nonlinear refraction of the DMMA was derived using the following equation.75 | (19) |
Theoretically, the closed aperture trace can be plotted with the help of the below formula; both the experimental and theoretical curves are depicted in Fig. 14.76
 | (20) |
Open-aperture
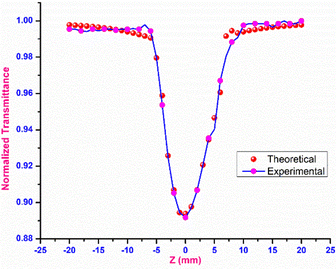
In open-aperture mode, all the transmitted light is allowed to fall on the detector without passing through an aperture; this transmitted light provides information about the nonlinear absorption ability of the material. The nonlinear absorption coefficient (β) is a pivotal parameter that can help to determine the suitability of the grown material for optical limiting applications. One of the prerequisites for an active optical limiting (OL) material is that it should exhibit reverse saturation absorption, so that the output intensity of the source can be attenuated without altering the input. The open-aperture curve reveals that the DMMA ionic crystal also exhibits reverse saturation absorption (RSA). The β value of the novel DMMA crystal was evaluated with the aid of the standard equation, where del T is the difference between the maximum of normalized transmittance and the minimum transmittance at the focus (Z = 0). | (21) |
The thermal effects arising from the continuous wave laser and the excited state absorption (ESA) make the greatest contributions to the RSA.77 The formula below was used to calculate the theoretical open aperture plot. The experimentally obtained open-aperture curve and theoretically simulated open-aperture graph are shown in Fig. 15.
 | (22) |
The derived n2 and β values were substituted into the subsequent eqn (23) and (24) to assess the real and imaginary values of the third-order nonlinear susceptibility. The calculated Im (χ3) and Re (χ3) values of the third-order susceptibility were substituted into eqn (25) to determine the third-order nonlinear susceptibility value of the DMMA crystal. The obtained χ3 value (3.73 × 10⁻¹⁰ esu) of the novel ionic crystal was compared with those of several standard NLO crystals, and the comparison results are presented in Table 3.
 | (23) |
 | (24) |
| |χ(3)| = [(Re (χ3))2 + (Im (χ3))2]1/2 | (25) |
This comparative analysis clearly indicates that the newly grown DMMA crystal displays higher nonlinearity. This is attributed to various factors, such as the bond length alteration (BLA) degree and delocalization of π-electrons from the donor and acceptor moieties in the cation and anion groups via the styryl pyridine and azo bridge, respectively. Additionally, the existence of hydrogen bonds between the anion and cation groups also boosts the nonlinearity in the grown material. It has been experimentally demonstrated that deviations in the bond length alternation (BLA) can lead to a change in the magnitude of the nonlinearity exhibited by a material.80 In the title compound, the BLA between the nitrogen atoms (pyridine and dimethyl amino) and the surrounding carbon atoms was estimated. The BLA value between the two nitrogen atoms attached to both ends of the cation and the adjacent carbon atoms (N5–C13 = 1.475 Å and N4–C24 = 1.368 Å) was found to be 0.107 Å. The BLA degree between the methyl group nitrogen (N4) and the nearest carbon atom was 0.007 Å.
The BLA degree for the pyridine nitrogen (N5) and the neighbouring carbon atom is 0.003 Å. The optimum BLA value for maximum nonlinearity is ± = 0.05 Å, whereas in the DMMA crystal it is 0.10 Å. The observed BLA value in the crystal structure implies that the structure factor also contributes to the nonlinearity of the material.
The crucial factor responsible for the substantial nonlinearity observed in the DMMA crystal is the charge transfer (CT) mechanism. A huge increase in the NLO effect is noticed if the delocalization of π-electrons takes place through the channel, which has low resonance energy (very small energy difference between the excited and ground states). This small energy difference increases the second-order molecular hyperpolarizability of the material to a great extent.81 The increase in hyperpolarizability will result in increased nonlinearity. In order to achieve an greater nonlinearity in this work, a styryl–pyridine bridge was selected, which meets the above-described condition. Among the well-established delocalization channels, styryl–pyridine is the most distinguished conjugated structure. Furthermore, the existence of an additional delocalization passage (N![[double bond, length as m-dash]](https://www.rsc.org/images/entities/char_e001.gif) N) in the anion is an added advantage. The motion of π-electrons from the dimethyl (donor) moiety to the pyridinium (acceptor) group through the styryl–pyridinium (C13H11N+) channel instigates the dipole moments in the material. As a consequence, an increase in polarization is observed, which subsequently enhances the NLO property of the title ionic crystal. The formation of hydrogen bonds between the stilbazolium cation and azo anion through the sulfonate group oxygen and pyridinium group carbon (C–H⋯O) atom also contributes to the nonlinearity shown by the DMMA crystal. Computational analysis also asserts the presence of intermolecular charge transfer (ICT) and hydrogen bond interactions in the newly grown DMMA crystal. These aspects are the most crucial factors responsible for the NLO property exhibited by the ionic crystal. The conclusions obtained from the Z-scan analysis suggest that the DMMA crystal is a good material for various kinds of NLO applications, namely optical switching, optical limiting and night-vision glasses.
N) in the anion is an added advantage. The motion of π-electrons from the dimethyl (donor) moiety to the pyridinium (acceptor) group through the styryl–pyridinium (C13H11N+) channel instigates the dipole moments in the material. As a consequence, an increase in polarization is observed, which subsequently enhances the NLO property of the title ionic crystal. The formation of hydrogen bonds between the stilbazolium cation and azo anion through the sulfonate group oxygen and pyridinium group carbon (C–H⋯O) atom also contributes to the nonlinearity shown by the DMMA crystal. Computational analysis also asserts the presence of intermolecular charge transfer (ICT) and hydrogen bond interactions in the newly grown DMMA crystal. These aspects are the most crucial factors responsible for the NLO property exhibited by the ionic crystal. The conclusions obtained from the Z-scan analysis suggest that the DMMA crystal is a good material for various kinds of NLO applications, namely optical switching, optical limiting and night-vision glasses.
Optical limiting
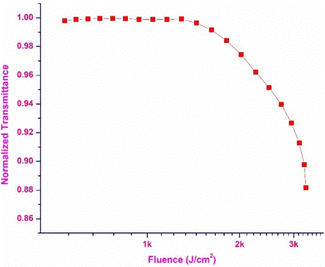
The optical limiting property of the DMMA crystal was extracted from the OA trace, and using the obtained data, the optical limiting threshold value was calculated. The plot between the normalized transmittance and the input influence is displayed in Fig. 16. This demonstrates the optical limiting characteristics of the DMMA material. The position at which a drop in the normalized transmittance is observed (onset) with respect to the input intensity is the point at which nonlinearity starts.82 The onset point (limiting threshold) value of the title ionic crystal is 1.3 kJ cm−2. This low limiting threshold affirms that the grown DMMA material can be used to block high-intensity green light (beyond 1.3 kJ cm−2).83 One of the major problems reported in the literature is the narrow operating range (IR region) of the existing optical limiting materials. This hurdle can be overcome by using the grown DMMA crystal, which has a wide operating window range (visible to IR region).Conclusion
Grafting of the azobenzene anion with the stilbazolium cation results in the development of a new third-order-active NLO single crystal, DMMA. SCXRD analysis was carried out to affirm the structural formation and third-order nonlinear activity of the DMMA crystal. All the crystallographic information associated with this novel ionic crystal is deposited in the CCDC data repository. The vibrations arising from the existence of various functional groups in the crystal structure were interpreted via FTIR spectroscopy. Evaluation of the linear optical properties was carried out with the aid of UV-Vis-NIR analysis. The conclusions from the linear optical analysis validate that the titular crystal possesses all the required criteria, such as a wide transmittance window (430 to 1500 nm), very low extinction coefficient value, high optical and electrical response and low level of defects (Urbach energy), which suggests the aptness of the DMMA crystal for optoelectronic and nonlinear optical field related applications. The photoluminescence characterization results indicate that the material is capable of emitting a red colour (610 nm). The high colour purity percentage (83.57%) from the CIE plot implies that the DMMA material is a suitable candidate for LED device fabrication. The software Gaussian was employed to study the theoretical aspects of the DMMA structure, such as the charge transfer mechanism, quantum descriptors, atomic charges and electronic transitions. The Hirsfeld surface was generated for the DMMA crystal structure to gain insight into the various intermolecular interactions that contribute to structural stability, namely, π–π stacking interactions and hydrogen bond interactions. The self-defocusing effect (closed-aperture mode) accompanied by the reverse saturation absorption phenomena (open-aperture mode) suggests that the DMMA crystal can be used as an active or passive optical limiter. The onset value observed in the optical limiting curve indicates that the DMMA material is capable of blocking high-intensity green light beyond 1.3 kJ cm−2. The conclusion that can be drawn from all the above characterization results is that the newly reported DMMA crystal is a potential material for optical limiting and optoelectronic (LED) applications.Experimental
Material preparation
All the starting materials used for the preparation of DMMA material were obtained from Tokyo Chemical Limited (TCL). The synthesis procedure encompasses three steps, which are shown in Fig. S1 in the ESI.† In the first step, 1,4-dimethyl pyridinium iodide is prepared by the chemical reaction between 4-picoline (purity: >98.0%) (2 ml) and iodomethane (purity: 98.0%) (1.3 ml). In the second step, 4-[2-(4-dimethylamino-phenyl)-vinyl]-1-methyl-pyridinium iodide (DMSI) powder is prepared by mixing equimolar amounts of 1,4-dimethyl pyridinium iodide (2.35 g) and 4-dimethyl amino benzaldehyde (purity: >98.0%) (1.5 g). A brief description of the ratio, solvent and methods used for the first two steps of the synthesis is provided in the previous work.7 The first two steps involved in the formation of DMMA powder were as same as described in the previous article.7 In the last step, the desired product 4-[2-(4-dimethylamino-phenyl)-vinyl]-1-methyl-pyridinium 4-aminoazobenzene-4′-sulfonate (DMMA) was obtained by combining an equimolar (1![[thin space (1/6-em)]](https://www.rsc.org/images/entities/char_2009.gif) :
:![[thin space (1/6-em)]](https://www.rsc.org/images/entities/char_2009.gif) 1) ratio of DMSI and sodium 4-aminoazobenzene-4′-sulfonate (purity: >98.0%) (0.599 g) in two different beakers with hot water (70 °C) as the solvent. Both the mixtures were maintained at 70 °C for 1 h. Then, the solution was allowed to cool to the surrounding temperature, and the final 4-[2-(4-dimethylamino-phenyl)-vinyl]-1-methyl-pyridinium 4-aminoazobenzene-4′-sulfonate (DMMA) powder settled as sediment in the solution. These residues were separated through a gravity filtration process, and the filtrate was dried in the oven for an hour.
1) ratio of DMSI and sodium 4-aminoazobenzene-4′-sulfonate (purity: >98.0%) (0.599 g) in two different beakers with hot water (70 °C) as the solvent. Both the mixtures were maintained at 70 °C for 1 h. Then, the solution was allowed to cool to the surrounding temperature, and the final 4-[2-(4-dimethylamino-phenyl)-vinyl]-1-methyl-pyridinium 4-aminoazobenzene-4′-sulfonate (DMMA) powder settled as sediment in the solution. These residues were separated through a gravity filtration process, and the filtrate was dried in the oven for an hour.
Solubility and crystal growth
The final product (DMMA powder) obtained from the synthesis process was subjected to solubility inspection to determine the most suitable solvent to grow good quality DMMA crystals. In order to test its solubility, five solvents, namely, acetone, methanol, DMSO and mixed solvents (methanol + acetone and methanol + DMSO) were utilized. The synthesised DMMA powder exhibited the highest solubility in methanol. Thus, the solubility test was carried out using methanol. For this experiment, an ultra-cryostat with ±0.01 °C precision was used. The analysis was carried out at five different temperatures (25 to 45 °C) with a temperature increments of 5 °C. At 25 °C, a saturated solution of DMMA was prepared, and the amount of the solute dissolved in the solution was determined by the gravimetric method, through which the solubility of the DMMA powder in the given methanol solvent was calculated. The solubility trace of DMMA is depicted in Fig. S2 in the ESI.† The slow evaporation growth method was followed to grow a DMMA single crystal with good optical quality. Based on the solubility data, a saturated solution was prepared at room temperature, and the solution was covered with an aluminium foil with small pores in the surface. The beaker was placed in a vibration-free environment for the slow evaporation of solvents via the small pores. After 20 to 25 days, a good quality DMMA single crystal with dimensions of 10 × 3 × 1 mm3 is obtained. The image of the novel DMMA crystal is presented in the inset of Fig. S2 in the ESI.†Author contributions
Sekar Anand: methodology, formal analysis, investigation, writing – original draft, and visualization. Muthurakku Usha Rani: conceptualization, visualization, supervision, review and editing.Conflicts of interest
There are no conflicts to declare.Acknowledgements
The authors would like to thank VIT – Vellore for providing the single-crystal XRD measurement. The author would also like to thank SAIF, IIT Madras for the single-crystal XRD data. The authors would also like to thank Dr Parutagouda Shankaragouda Patil and Neelamma B. Gummagol for the Z-scan analysis.References
- S. Rahman, S. Mirza, A. Sarkar and G. W. Rayfield, J. Nanosci. Nanotechnol., 2010, 10, 4805–4823 CrossRef CAS PubMed.
- R. Gadhwal and A. Devi, Opt. Laser Technol., 2021, 141, 107144 CrossRef CAS.
- R. Rajkumar and P. Praveen Kumar, J. Mol. Struct., 2019, 1179, 108–117 CrossRef CAS.
- D. Mary Deena, A. Dhanusha, T. C. Sabari Girisun and A. Philominal, Opt. Mater., 2023, 139, 113776 CrossRef CAS.
- T. Shanmugavadivu, K. Senthilkumar, M. Dhandapani, P. Muthuraja, S. Balachandar and M. Sethu Raman, J. Phys. Chem. Solids, 2017, 111, 82–94 CrossRef CAS.
- V. Siva, S. A. Bahadur, A. Shameem, S. Athimoolam, K. U. Lakshmi and G. Vinitha, J. Mol. Struct., 2019, 1191, 110–117 CrossRef CAS.
- S. Anand, M. U. Rani, S. Kalainathan and R. S. Babu, RSC Adv., 2022, 12, 29022–29033 RSC.
- M. Shalini, R. S. Sundararajan, E. Manikandan, M. Meena, B. S. Ebinezer, T. C. S. Girisun and R. Natarajan, Optik, 2023, 278, 170705 CrossRef CAS.
- P. P. Vinaya, A. N. Prabhu, K. Subrahmanya Bhat and V. Upadhyaya, Opt. Mater., 2019, 89, 419–429 CrossRef CAS.
- L. K. Joy, M. George, J. Alex, A. Aravind, D. Sajan and G. Vinitha, J. Mol. Struct., 2018, 1156, 733–744 CrossRef CAS.
- S. Kannan, A. Sekar and K. Sivaperuman, J. Mater. Chem. C, 2020, 8, 16668–16690 RSC.
- J. Yin, L. Li, Z. Yang, M. Jazbinsek, X. Tao, P. Günter and H. Yang, Dyes Pigm., 2012, 94, 120–126 CrossRef CAS.
- M. Jazbinsek, U. Puc, A. Abina and A. Zidansek, Appl. Sci., 2019, 9, 1–44 Search PubMed.
- A. Nisar, S. Tabassum, K. Ayub, T. Mahmood, H. AlMohamadi, A. L. Khan, M. Yasin, R. Nawaz and M. A. Gilani, Phys. Chem. Chem. Phys., 2023, 25(30), 20430–20450 RSC.
- A. Priimagi, G. Cavallo, P. Metrangolo and G. Resnati, Acc. Chem. Res., 2013, 46, 2686–2695 CrossRef CAS PubMed.
- A. Priimagi, J. Vapaavuori, F. J. Rodrigue, C. F. J. Faul, M. T. Heino, O. Ikkala, M. Kauranen and M. Kaivola, Chem. Mater., 2008, 20, 6358–6363 CrossRef CAS.
- G. M. Sheldrick, Acta Crystallogr., Sect. C: Struct. Chem., 2015, 71, 3–8 Search PubMed.
- N. Karuppanan and S. Kalainathan, J. Phys. Chem. C, 2018, 122, 4572–4582 CrossRef CAS.
- W. Kaminsky, J. Appl. Crystallogr., 2005, 38, 566–567 CrossRef CAS.
- N. Sinha, S. Bhandari, H. Yadav, G. Ray, S. Godara, N. Tyagi, J. Dalal, S. Kumar and B. Kumar, CrystEngComm, 2015, 17, 5757–5767 RSC.
- L. Yang and Y. Dong, Carbohydr. Res., 2011, 346, 2457–2462 CrossRef CAS PubMed.
- S. Goel, N. Sinha, H. Yadav, A. J. Joseph, A. Hussain and B. Kumar, Arabian J. Chem., 2020, 13, 146–159 CrossRef CAS.
- T. Vijayakumar, I. Hubert Joe, C. P. Reghunadhan Nair, M. Jazbinsek and V. S. Jayakumar, J. Raman Spectrosc., 2009, 40, 52–63 CrossRef CAS.
- A. U. Rani, N. Sundaraganesan, M. Kurt, M. Cinar and M. Karabacak, Spectrochim. Acta, Part A, 2010, 75, 1523–1529 CrossRef PubMed.
- S. A. Rupa, R. Moni, A. M. Patwary, M. Mahmud, A. Haque, J. Uddin and S. M. T. Abedin, Molecules, 2022, 27(5), 1656 CrossRef CAS PubMed.
- Z. Yu, T. Wang, G. Wang, K. Xu, Q. Cui, L. Cao and B. Teng, CrystEngComm, 2020, 22, 8362–8373 RSC.
- M. Krishna Kumar, S. Sudhahar, P. Pandi, G. Bhagavannarayana and R. Mohan Kumar, Opt. Mater., 2014, 36, 988–995 CrossRef CAS.
- K. Senthil, S. Kalainathan, A. Ruban Kumar and P. G. Aravindan, RSC Adv., 2014, 4, 56112–56127 RSC.
- M. Krishna Kumar, S. Sudhahar, G. Bhagavannarayana and R. Mohan Kumar, Spectrochim. Acta, Part A, 2014, 125, 79–89 CrossRef CAS PubMed.
- S. J. Sundaram, A. A. Raj, R. J. Vijay, M. Jaccob and P. Sagayaraj, J. Mol. Struct., 2021, 1241, 130669 CrossRef CAS.
- A. Shili, A. Ayadi, S. Taboukhat, N. Zouari, B. Sahraoui and A. El-Ghayoury, J. Mol. Struct., 2020, 1222, 128933 CrossRef CAS.
- R. Priya, S. Anitha, P. S. L. Mageshwari and R. Ragu, J. Mater. Sci.: Mater. Electron., 2020, 31, 21288–21302 CrossRef CAS.
- S. Vasumathi, H. Johnson Jeyakumar and P. Selvarajan, J. Mol. Struct., 2022, 1263, 133158 CrossRef CAS.
- N. Krishnan and K. Sivaperuman, Crystals, 2023, 13, 138 CrossRef CAS.
- M. Benaissa, A. Boukaoud, D. Sebbar, Y. Chiba and A. Krid, Spectrochim. Acta, Part A, 2024, 307, 123636 CrossRef CAS PubMed.
- J. Dalal and B. Kumar, Opt. Mater., 2016, 51, 139–147 CrossRef CAS.
- R. Surekha, P. Sagayaraj and K. Ambujam, Opt. Mater., 2018, 85, 133–137 CrossRef CAS.
- C. R. T. Kumari, A. Al Otaibi, T. Kamaraj, M. Nageshwari, G. Mathubala, A. Manikandan, M. L. Caroline, S. Sudha, H. A. Kashmery, P. Madhu, A. Khan, H. M. Marwani and A. M. Asiri, Crystals, 2021, 11, 1–17 CrossRef.
- S. J. Ikhmayies and R. N. Ahmad-Bitar, J. Mater. Res. Technol., 2013, 2, 221–227 CrossRef CAS.
- A. Ajmi, K. Karoui, K. Khirouni and A. Ben Rhaiem, RSC Adv., 2019, 9, 14772–14781 RSC.
- J. H. Joshi, S. Kalainathan, D. K. Kanchan, M. J. Joshi and K. D. Parikh, J. Mater. Sci.: Mater. Electron., 2019, 30, 2985–2993 CrossRef CAS.
- J. H. Joshi, S. Kalainathan, D. K. Kanchan, M. J. Joshi and K. D. Parikh, Arabian J. Chem., 2020, 13, 1532–1550 CrossRef CAS.
- J. H. Joshi, K. P. Dixit, K. D. Parikh, H. O. Jethva, D. K. Kanchan, S. Kalainathan and M. J. Joshi, J. Mater. Sci.: Mater. Electron., 2018, 29, 5837–5852 CrossRef CAS.
- J. H. Joshi, S. Kalainathan, M. J. Joshi and K. D. Parikh, Arabian J. Chem., 2020, 13, 5018–5026 CrossRef CAS.
- J. H. Joshi, S. Kalainathan, M. J. Joshi and K. D. Parikh, J. Mater. Sci.: Mater. Electron., 2019, 30, 14243–14255 CrossRef CAS.
- K. R. Rathod, J. H. Joshi, A. P. Kochuparampil, M. J. Joshi and K. D. Parikh, J. Electron. Mater., 2021, 50, 3348–3364 CrossRef CAS.
- M. F. Zaini, W. M. Khairul, S. Arshad, M. Abdullah, D. A. Zainuri, R. Rahamathullah, M. I. Rosli, M. S. Abd Aziz and I. A. Razak, Opt. Mater, 2020, 107, 110087 CrossRef CAS.
- J. H. Joshi, S. Kalainathan, D. K. Kanchan, K. Chaudhari, M. J. Joshi and K. D. Parikh, J. Mater. Sci.: Mater. Electron., 2023, 34, 1–20 CrossRef.
- D. Haleshappa, R. Bairy, Shridevi, S. N. Kakathkar, V. H. and N. Gummagol, Mater. Today Commun., 2023, 35, 106052 CrossRef CAS.
- J. Kunjumon, M. George, K. Abha, S. K. Gopi, G. Vinitha, D. Sajan and R. Philip, Surf. Interfaces, 2023, 39, 102965 CrossRef CAS.
- K. Senthil, S. Kalainathan, A. Ruban Kumar and P. G. Aravindan, RSC Adv., 2014, 4, 56112–56127 RSC.
- J. H. Joshi, G. M. Joshi, M. J. Joshi, H. O. Jethva and K. D. Parikh, New J. Chem., 2018, 42, 17227–17249 RSC.
- P. Asha Hind, P. S. Patil, N. B. Gummagol and B. V. Rajendra, J. Alloys Compd., 2022, 892, 162070 CrossRef CAS.
- F. Öztürk, J. Mol. Struct., 2023, 1271, 133945 CrossRef.
- S. Karthigha, S. Kalainathan, K. Uma, M. Rao, F. Hamada, M. Yamada and Y. Kondo, J. Cryst. Growth, 2016, 436, 113–124 CrossRef CAS.
- V. K. Verma, M. Guin, B. Solanki and R. C. Singh, Mater. Today Proc., 2022, 49, 3200–3204 CrossRef CAS.
- K. Senthil, S. Kalainathan, F. Hamada, M. Yamada and P. G. Aravindan, Opt. Mater., 2015, 46, 565–577 CrossRef CAS.
- K. P. Manoj, N. Elangovan and S. Chandrasekar, Inorg. Chem. Commun., 2022, 139, 109324 CrossRef CAS.
- A. Ramalingam, M. Kuppusamy, S. Sambandam, M. Medimagh, O. Emmanuel, A. Shanmugasundaram, N. Issaoui and N. Damilare, Heliyon, 2022, 8, e10831 CrossRef CAS PubMed.
- N. Kanagathara, R. Bhavani, A. Ya, M. K. Marchewka and J. Janczak, J. Mol. Struct., 2022, 1270, 133930, DOI:10.1016/j.molstruc.2022.133930.
- S. Chandrasekar, V. Balachandran, H. Evans and A. Latha, Spectrochim. Acta, Part A, 2015, 143, 136–146 CrossRef CAS PubMed.
- K. S. Munawar, S. Ali, S. Muhammad, M. Ashfaq, S. M. Abbas, M. N. Tahir, S. M. Siddeeg and G. Ahmed, J. Mol. Struct., 2023, 1274, 134427 CrossRef CAS.
- G. Amudha, R. Santhakumari, D. Chandrika, S. Mugeshini and N. Rajeswari, Chin. J. Phys., 2022, 76, 44–58 CrossRef CAS.
- E. Enbaraj, K. R. Jeyashri, G. Logeshwari, H. Manikandan and K. Sivakumar, J. Mol. Struct., 2023, 1275, 134605 CrossRef CAS.
- Y. Zorlu, H. Can and F. Aksakal, J. Mol. Struct., 2013, 1049, 368–376 CrossRef CAS.
- M. Guin, S. Halder, S. Chatterjee and S. Konar, J. Mol. Struct., 2022, 1270, 1–10 CrossRef.
- V. Ragavendran and S. Muthunatesan, J. Mol. Struct., 2016, 1125, 413–425 CrossRef CAS.
- M. Khalid, M. Aman, M. Adeel, M. Usman, M. Nawaz, A. Albert and C. Braga, J. Saudi Chem. Soc., 2019, 23, 546–560 CrossRef CAS.
- S. L. Tan, M. Jotani and E. R. T. Tiekink, Acta Crystallogr., Sect. E: Crystallogr. Commun., 2019, 308–318 CrossRef CAS PubMed.
- S. K. Seth, Acta Crystallogr., Sect. E: Crystallogr. Commun., 2018, 600–606 CrossRef CAS PubMed.
- P. R. Spackman, M. J. Turner, J. J. Mckinnon, S. K. Wolff, D. J. Grimwood and M. A. Spackman, J. Appl. Crystallogr., 2021, 1006–1011 CrossRef CAS PubMed.
- S. Kansiz, M. Almarhoon and N. Dege, Acta Crystallogr., Sect. E: Crystallogr. Commun., 2018, 217–220 CrossRef CAS PubMed.
- R. Ocs, Acta Crystallogr., Sect. E: Crystallogr. Commun., 2019, 75(12), 1857–1860 CrossRef PubMed.
- Q. Ai, C. Kheng, X. Ai, S. R. Maidur, H. Chong, Y. Win, P. Shankaragouda and N. B. Gummagol, J. Mol. Struct., 2022, 1267, 133584 CrossRef.
- L. Poornima, R. Shanker and S. Kalainathan, J. Mol. Struct., 2023, 1280, 134976 CrossRef CAS.
- M. Divya Bharathi, R. Bhuvaneswari, G. Ahila, G. Vinitha and G. Anbalagan, Chin. J. Phys., 2020, 67, 1–26 CrossRef CAS.
- J. C. Jebapriya, J. Christian and U. M. Sumaya, J. Phys. Chem. Solids, 2023, 173, 111091 CrossRef CAS.
- A. Antony Raj, R. Gunaseelan and P. Sagayaraj, Opt. Mater., 2014, 38, 102–107 CrossRef CAS.
- D. Li, D. Yu, Q. Zhang, S. Li, H. Zhou, J. Wu and Y. Tian, Dyes Pigm., 2013, 97, 278–285 CrossRef CAS.
- R. L. Gieseking, C. Risko and J. L. Brédas, J. Phys. Chem. Lett., 2015, 6(12), 2158–2162, DOI:10.1021/acs.jpclett.5b00812.
- X. Liu, Z. Yang, D. Wang and H. Cao, Crystals, 2016, 6(12), 158 CrossRef.
- M. Abith and T. C. Sabari Girisun, J. Mol. Liq., 2021, 341, 117337 CrossRef.
- J. Beena and A. S. Jebamalar, J. Mater. Sci.: Mater. Electron., 2021, 32, 27198–27215 CrossRef CAS.
Footnote |
| † Electronic supplementary information (ESI) available. CCDC 2233751. For ESI and crystallographic data in CIF or other electronic format see DOI: https://doi.org/10.1039/d3ma00988b |
| This journal is © The Royal Society of Chemistry 2024 |

