DOI:
10.1039/D3MA00989K
(Paper)
Mater. Adv., 2024,
5, 2597-2605
Effect of foaming on the electromagnetic interference-shielding performance of exfoliated graphite nanoplatelets-filled EVA/EOC blend composites in the S-band region
Received
10th November 2023
, Accepted 27th January 2024
First published on 14th February 2024
Abstract
In this study, microcellular ethylene vinyl acetate (EVA) and ethylene octane copolymer (EOC) blend composites filled with exfoliated graphite nanoplatelets (xGnP) were fabricated using azodicarbonamide (ADC) as a foaming agent. Closed cell structures were obtained, which were revealed via FESEM analysis. The size, density and porosity of cells increased with an increase in foaming agent content. The thermal stability of solids and their foamed counterparts were analyzed based on TGA thermograms. The EVA/EOC/xGnP foamed system showed enhanced values of specific EMI-shielding efficiency compared to their solid counterparts. The maximum EMI-shielding (SET) efficiency of 34.17 dB with a specific EMI SE value of 107.79 dB cm3 g−1 was achieved with 30 wt% of xGnP and 4 wt% of the foaming agent in the S-band region. The effect of xGnP loading was investigated at a constant foaming agent content (4 wt%); the results revealed that the maximum total shielding efficiency (SET) of 32.58 dB and a specific EMI SE of 113.51 dB cm3 gm−1 were achieved with 10 wt% of xGnP, which is much better than our previously studied xGnP-loaded solid counterparts. Thus, foaming EVA/EOC/xGnP offers the advantages of high EMI-shielding efficiency, low cost, and lightweight. The study of electromagnetic properties showed that real and imaginary permittivity values increased with an increase in foaming agent content, along with enhanced electrical conductivity.
1. Introduction
With the rapid technological evolution of electrical and electronic equipment, their applications in remote-sensing/controlled devices and mobile communication systems used in both military and civil fields are increasing day by day. These devices radiate a great number of electromagnetic waves, which cause electromagnetic pollution. They not only interfere with the normal operation of precious electronic devices but also have the potential to cause human health risks, especially non-communicable diseases such as migraine, cancer, and infertility.1 In order to address these problems, several efforts have been made to develop efficient electromagnetic-interference-shielding (EMI) materials. In recent years, focus has been on exploring conductive polymer composites (CPCs) for EMI shielding because of their several advantages, such as low density, easy processing and high corrosion resistance, compared to metal-based systems. It is reported that high electrical conductivity, dielectric constant and magnetic permeability are important characteristics for composites to exhibit effective EMI-shielding capacity. In this regard, owing to their intrinsic electrical conductivity and large surface area, carbon-based conductive fillers such as carbon black,2–5 carbon nanotubes, exfoliated graphite nanoplatelets6–8 and graphene9–14 have received considerable attention as additives to enhance the electrical conductivity and dielectric permittivity of insulating polymer matrixes. Owing to the high aspect ratio, large specific surface area, easy production process, low cost and excellent electrical/thermal conductivity of exfoliated graphene nanoplatelets (xGnP), they have drawn increasing interest as fillers for polymer-based EMI-shielding materials. The incorporation of xGnPs in polymer matrixes not only increases electrical conductivity but also improves other properties, such as hardness, stiffness, strength, abrasion and lubrication, of both solid and microcellular composites.15 However, in such polymer composites, electrical conductivity above percolation threshold is desirable. Interestingly, the percolation threshold of blends containing two immiscible polymers can be reduced by incorporating fillers, according to the concept of the double percolation phenomenon. The double percolation phenomenon was first proposed by Sumita et al.16 while studying immiscible polymer blends of carbon black (CB), in which CB was predominantly dispersed in one phase and also concentrated at the interfaces, as a result of which the electrical conductivity of the composites was significantly enhanced with a less amount of filler. Since then, the concept of double percolation has been applied to a number of immiscible polymer blends with CB,17 carbon nanotubes17 and carbon fibers.18 Materials with multiple interfaces are very important to enhance the EMI shielding performance. Wang et al.19 studied the effects of microcracks and microwrinkles in copper-coated carbon nanotubes (CNT)-polydimethylsiloxane (PDMS) composites. Absorption-type microwave shielding by sandwiched composites of PDMS/CNT has been reported.20 Composites of silver micro-tubes/barium Ferrites/Poly (lactic acid) show absorption-type electromagnetic shielding performance by enhancing impedance matching and electric-magnetic synergism.21 Sustainable electromagnetic shielding of graphene/nanocellulose thin films with excellent Joule heating and mechanical properties via in situ mechanical exfoliation and crosslinking with cations has been reported.22 Microwave shielding enhancement has been achieved by constructing unique conductive networks in carbon nanotubes/polymer composites via poly(ε-caprolactone)-induced partial aggregation of the carbon nanotubes.23
Previously, we have reported that the blend of EVA/EOC composited with 30 wt% xGnP loading shows a total EMI SE of −67.2 dB in the S- band (2–4 GHz) region.24 Thus, a further reduction in the density of the polymer composites with foamed microcellular structures has been explored to simultaneously reduce the amount of filler without compromising its electrical conductivity. Recent studies have reported increased microwave absorption capability in microcellular conducting polymer composites due to an enhancement in electrical conductivity due to improved interfacial polarization.25 The cellular morphology contributes to the optimization of impedance match, providing entry access to microwaves. This subsequently induces multiple reflections of the incident electromagnetic waves and results in their dissipation,26 thereby enhancing the EMI shielding effectiveness. The processability and behavior of such foaming materials are basically governed by their rheological and morphological characteristics, condition of processing, and more importantly, the type of foaming agent used. Generally, chemical blowing agents are widely used in the fabrication of microcellular polymer composites.27 According to the literature, Yang et al. developed a CNT/PS polymer foam composite by using the chemical blowing agent azo-bis-isobutyronitrile (AIBN). The nitrogen gas generated in the process accounts for the formation of the foamed structure, which was found to be useful in EMI shielding applications.28 In another work, Zhang et al. achieved an EMI SE of 51.2 dB by developing carbonized phthalonitrile(PN)-based polymer foams under continuous argon purging.29 It is anticipated that the dispersion of 2D GNP sheets in three-dimensional macroscopic microcellular composites might result in the reduction of the required amount of filler and an increase in EMI shielding efficiency. This work focuses on the electromagnetic interference-shielding performance of an exfoliated-graphite-nanoplatelet-filled microcellular EVA (VA: 18 wt%)/ethylene-octene copolymer (EOC; octane 25 wt%) blend composite. The choice of low-density polyolefin elastomers, such as EOC, for blending with EVA is mainly based on its ability to enhance the filler capacity, impact resistance and flexibility of the polymer composites.30,31 Further, EOC has been used in microcellular foaming for its excellent compression setting properties. It is anticipated that the homogeneous distribution of GN in the EVA/EOC blend and the higher electrical conductivity of the corresponding foamed blend composites would enhance their microwave absorption efficiency in the S-band region (2–4 GHz). In this study, we have investigated the effects of foaming on the EMI-shielding efficiency of 30 wt% xGnP-loaded EVA/EOC blends by varying the xGnP loading at a constant foaming agent loading. Our findings show that the maximum specific EMI SE value at 30 wt% xGnP and 4 wt% foaming agent was 107.79 dB cm3 g−1 in the S-band region. Among the composites with different xGnP loadings and a constant ratio of foaming agent (4 wt%), the 10 wt% xGnP-loaded microcellular EVA/EOC composite achieved the maximum specific EMI-shielding efficiency of 113.51 dB cm3 g−1. Moreover, the sample loaded with 5 wt% xGnP and foamed with 4 wt% foaming agent displayed a much higher specific EMI SE than that of the 30 wt% EVA/EOC composite.
2. Experimental methods
2.1. Materials
EVA (18% vinyl acetate (VA) content) was purchased from PIL (India). Ethylene octane co-polymer (EOC) with 25 wt% octene content and a density of 0.868 g cc−1 was purchased from DuPont-Dow Elastomer Co, USA. xGnP-15 with a thickness of 2 nm, 1–2 μm diameter, 120–150 m2 gm−1 surface area and 2.2 g cc−1 density was purchased from XG Sciences, USA. The foaming agent azodicarbonamide (ADC-21) was kindly supplied by HPL Additives Ltd, New Delhi. The curing agent dicumyl peroxide (DCP) used was purchased from Sigma Aldrich (India).
2.2. Preparation of EVA/EOC/xGnP microcellular composites
The melt compounding method was adopted for processing xGnP-incorporated EVA/EOC blend composites with varying foaming agent (ADC-21) contents of 0, 2, 3, 4, 5 and 6 wt%. Based on our previous studies32 on the conductivity of composites containing different proportions of EVA and EOC and a fixed quantity of xGnP, we chose EVA and EOC proportion of 80![[thin space (1/6-em)]](https://www.rsc.org/images/entities/char_2009.gif) :20 for processing microcellular composites. The 80:20 EVA-EOC blends were fed into a Brabender plasticoder (PLA 330) with a cam-type rotor and maintained at a temperature of 80 °C and a rotor speed of 60 rpm. Zinc oxide (2 wt%) and stearic acid (1 wt%) were added subsequently with a two-minute interval. Then, xGnP along with the blowing agent ADC-21 were added and mixed continued till a constant torque was achieved. Finally, the curative, namely DCP, was added at 1.2 wt%. The samples were compression-molded at 160 °C under a pressure of 5 MPa for 80% of their optimum cure time, as determined from a rheogram obtained from Monsanto Rheometer-R100. The samples were treated post-cure at 100 °C for one hour in an air-circulated electrical oven. The composites of 30 wt% xGnP-filled EVA/EOC loaded with 0, 2, 3, 4, 5 and 6 wt% foaming agent (ADC) were designated as EOX30, EOX30A2, EOX30A3, EOX30A4, EOX30A5 and EOX30A6, respectively, in which E, O, X and A represent EVA, EOC, xGnP and ADC, respectively. The composites with a fixed amount (4 wt%) of ADC and varying wt% of xGnP (0, 5, 10, 15, 20) were processed by following the same procedure and designated as EOX0A4, EOX5A4, EOX10A4, EOX15A4, EOX20A4, and EOX20A4 respectively.
:20 for processing microcellular composites. The 80:20 EVA-EOC blends were fed into a Brabender plasticoder (PLA 330) with a cam-type rotor and maintained at a temperature of 80 °C and a rotor speed of 60 rpm. Zinc oxide (2 wt%) and stearic acid (1 wt%) were added subsequently with a two-minute interval. Then, xGnP along with the blowing agent ADC-21 were added and mixed continued till a constant torque was achieved. Finally, the curative, namely DCP, was added at 1.2 wt%. The samples were compression-molded at 160 °C under a pressure of 5 MPa for 80% of their optimum cure time, as determined from a rheogram obtained from Monsanto Rheometer-R100. The samples were treated post-cure at 100 °C for one hour in an air-circulated electrical oven. The composites of 30 wt% xGnP-filled EVA/EOC loaded with 0, 2, 3, 4, 5 and 6 wt% foaming agent (ADC) were designated as EOX30, EOX30A2, EOX30A3, EOX30A4, EOX30A5 and EOX30A6, respectively, in which E, O, X and A represent EVA, EOC, xGnP and ADC, respectively. The composites with a fixed amount (4 wt%) of ADC and varying wt% of xGnP (0, 5, 10, 15, 20) were processed by following the same procedure and designated as EOX0A4, EOX5A4, EOX10A4, EOX15A4, EOX20A4, and EOX20A4 respectively.
3. Results and discussion
3.1. Morphological analysis
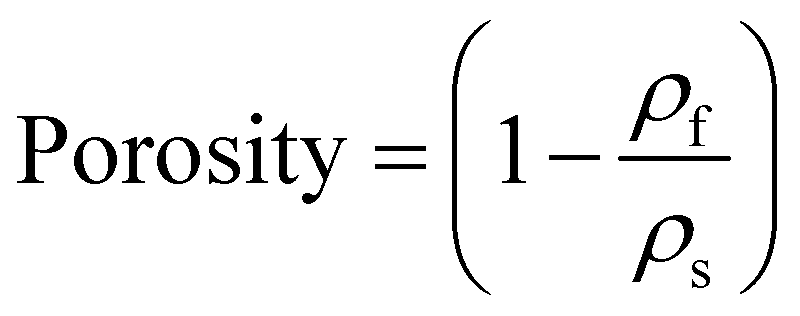
Scanning electron microscopy (SEM) images were captured to visualize the cell morphology of the as-fabricated foamed microcellular composites using a ZEISS-GEMINI II- 6105 operated at 5 kV. The samples were cryo-fractured after immersion in liquid nitrogen and then gold-coated by sputtering in an Argon atmosphere. The water displacement method (ASTMD792-00) was utilized to determine the density of the solids (ρs) and their foamed microcellular (ρf) composites. The porosity of the samples was calculated by using the formula:| |  | (1) |
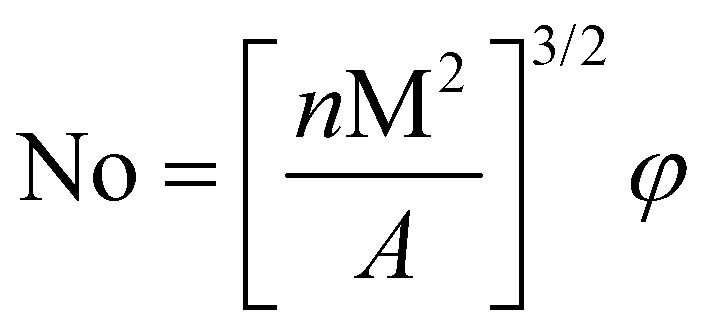
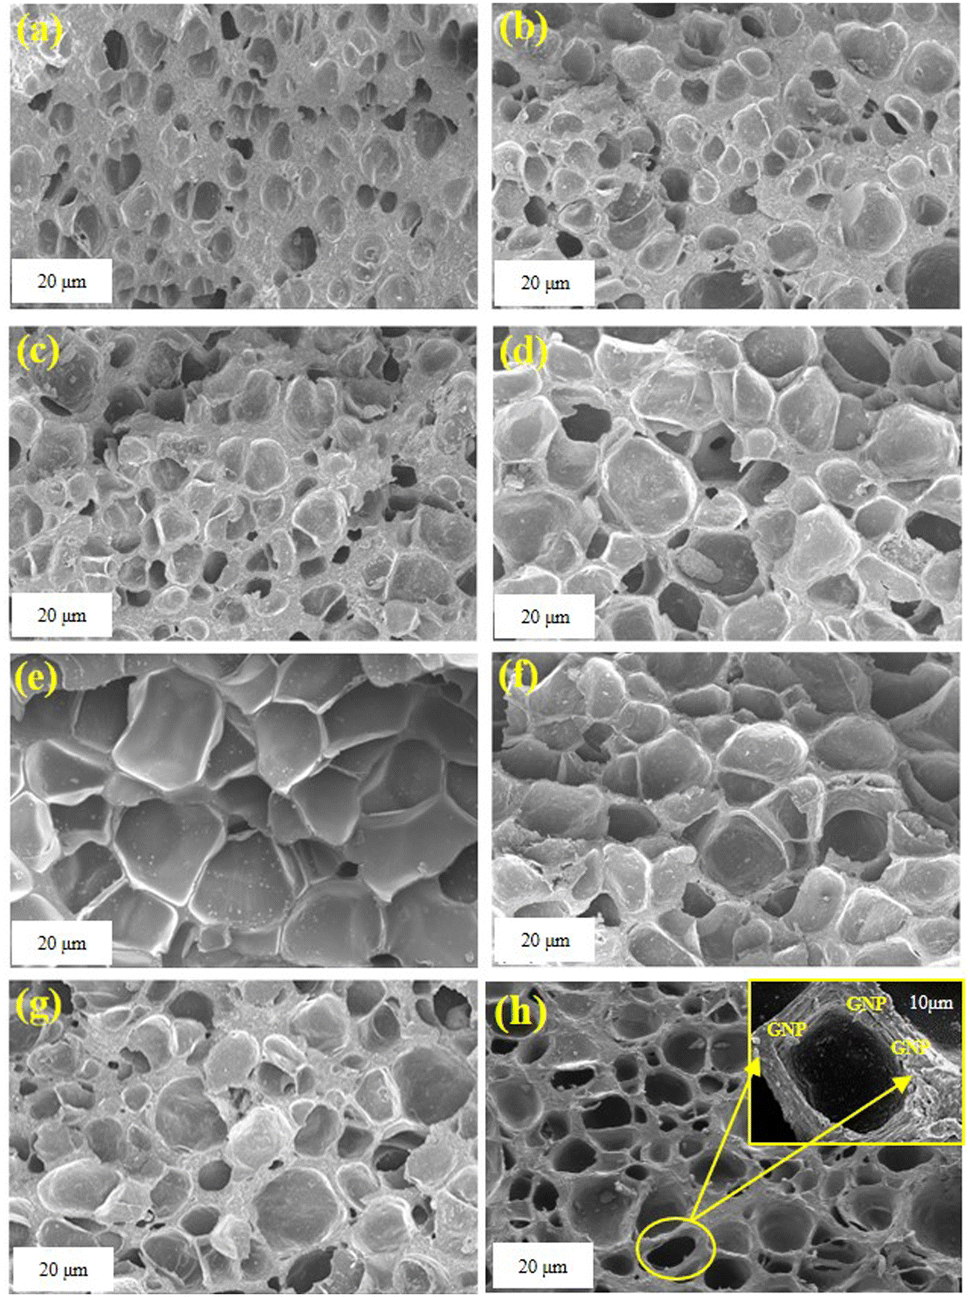
Fig. 1(a)–(d) show the micrographs of 30 wt% xGnP-incorporated EVA/EOC microcellular composites with 2, 3, 4 and 6 wt% ADC loadings, respectively. All micrographs show closed-cell structures. The cell density (N0) i.e., number of cells per unit volume (cm3) of the foamed composites at their maximum expansion was calculated using the following formula.33
| |  | (2) |
where
n is the number of cells in the SEM micrograph,
M is the magnification factor,
A is the area of the micrograph (cm
2), and
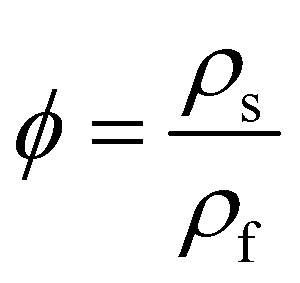
ϕ is the volume expansion ratio of the polymer foam, which was calculated according to the below equation.
| |  | (3) |
where
ρs and
ρf are the densities of the solid and foamed samples, respectively.
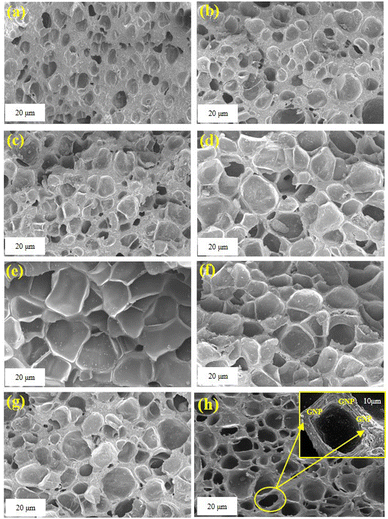 |
| | Fig. 1 FESEM images of (a) EOX30A2, (b) EOX30A3, (c) EOX30A4, (d) EOX30A6, (e) EOX0A4, (f) EOX5A4, (g) EOX15A4, and (h) EOX20A4 foam composites. The high-magnification image of the cell wall in (h) shows the presence of GNP. | |
The average cell sizes and cell densities of the samples are depicted in Table 1. The average cell sizes of the 30 wt% xGnP-loaded microcellular composites increased from 15.42 μm to 34.71 μm with an increase in foaming agent loading. The cell densities increased up to 4 wt% loading and then decreased marginally in the composite with 6 wt% ADC. This decrease in cell density is attributed to the fact that with increasing ADC wt%, the gas pressure inside the cells increases, and thus the cells collapse to form bigger cells.
Table 1 Cell parameters of the as-prepared microcellular composites
| Sample name |
Relative density 
|
Average cell diameter (μm) |
Porosity |
Cell density (N0) |
| EOX30A2 |
0.240 |
15.42 |
0.760 |
3.52 × 10¹⁶ |
| EOX30A3 |
0.160 |
20.21 |
0.840 |
3.61 × 10¹⁶ |
| EOX30A4 |
0.145 |
23.81 |
0.855 |
3.76 × 10¹⁶ |
| EOX30A6 |
0.132 |
34.71 |
0.868 |
3.70 × 10¹⁶ |
| EOX0A4 |
0.111 |
44.67 |
0.889 |
2.38 × 10¹⁶ |
| EOX5A4 |
0.121 |
36.16 |
0.879 |
3.45 × 10¹⁶ |
| EOX10A4 |
0.119 |
26.16 |
0.881 |
3.91 × 10¹⁶ |
| EOX20A4 |
0.140 |
24.57 |
0.860 |
3.86 × 10¹⁶ |
In the 30 wt% xGnP-loaded foamed EVA/EOC composites, the void fraction increased with the content of the blowing agent. The effect of xGnP loading was studied by incorporating a constant fraction i.e. 4 wt% of ADC and varying the xGnP content. Fig. 1(e)–(h) show the micrographs of 4 wt% blowing-agent-loaded EVA/EOC foam composites with varying xGnP loadings of 0, 5, 10 and 20 wt%, respectively. With the increase in xGnP loading, the average cell sizes decreased. The decrease in cell size is attributed to increased viscosity with increasing xGnP content, which provides a physical barrier and thus retards the growth of the cells. The cell density increased up to 10 wt% and then decreased marginally, which may be due to the increase in viscosity.
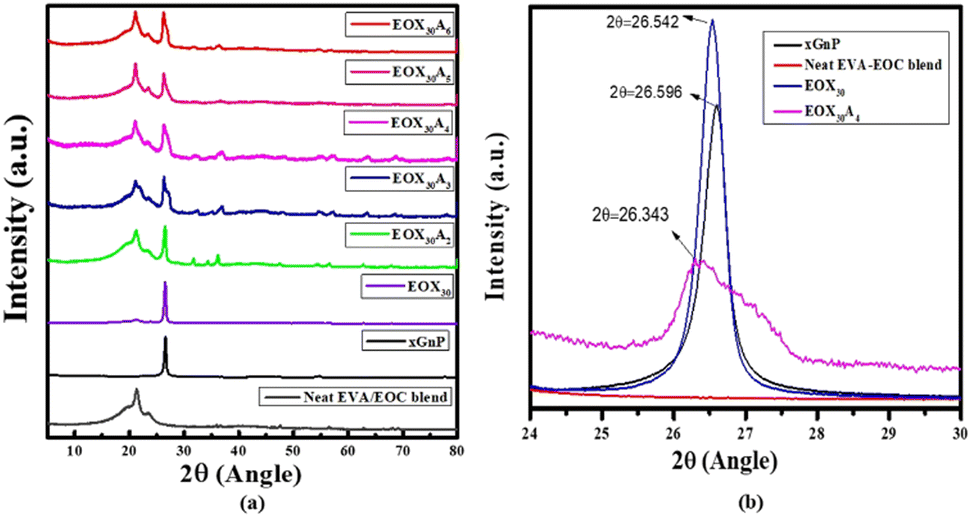
3.2. XRD analysis
The X-ray diffraction patterns of xGnP, unfilled, and xGnP-filled EVA/EOC solids, as well as foamed microcellular composites, were obtained on a Rigaku diffractometer using CuKα radiation (λ = 1.54056 Å) at a scanning rate of 2 deg min−1 in the 2θ range of 5° to 80°. Fig. 2(a) depicts the diffraction patterns of the neat EVA/EOC blend, 30 wt% xGnP loaded solid blend of EVA/EOC and its microcellular foam composites with varying foaming agent loading. The effect of xGnP in the EVA/EOC blend and the presence of foaming agent ADC on the foamed composites were evaluated by XRD analysis. For xGnP, one narrow intense peak appeared at 2θ = 26.6° from the (002) plane of graphite, and a short, broad peak at 2θ = 56.6° from the 004 plane of graphite was also seen.
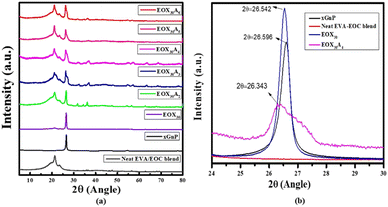 |
| | Fig. 2 (a) XRD patterns of the neat blend of EVA/EOC and the EVA/EOC/xGnP foam samples. (b) Magnified XRD images (2θ: 24°–30°) of xGnP, the neat EVA-EOC blend, EOX30 and EOX30A4 samples. | |
The neat EVA/EOC blend showed two broad peaks: one for EVA at 2θ = 21.15° and another for EOC at 2θ = 21.11° corresponding to the two polyethylene diffraction planes (110) and (200), respectively.34 As the foaming agent content increased from 2 to 6 wt%, the intense peak due to the presence of graphite gradually reduced and showed a marginal shift, as observed in its magnified microgram. Fig. 2(b) depicts the magnified peaks of the EVA/EOC/xGnP solid, as well as the 4 wt% foaming-agent-loaded microcellular foamed composite. Compared to the peak of pristine xGnP, the peaks of the xGnP-filled solid EVA/EOC blend composite and its microcellular composite were left-shifted. For the solid composite, a sharp and higher intense peak was observed, whereas, the peak of its foam counterpart displayed suppressed intensity due to the formation of a microcellular structure. The intensity reduction of the peak of the 002 plane is due to the exfoliation of the xGnPs.35
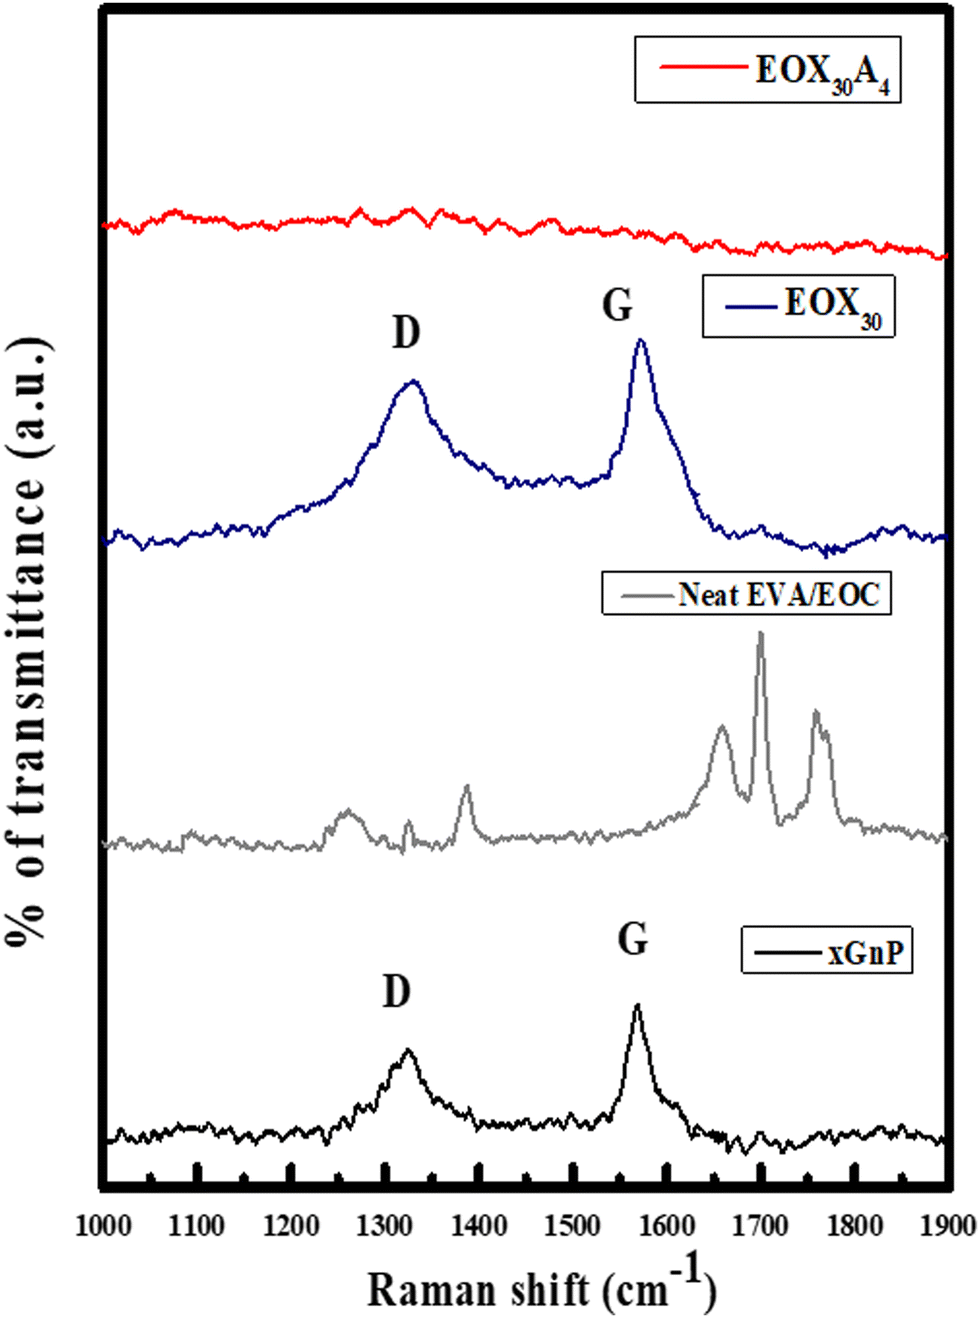
3.3. Raman spectroscopy
The Raman spectra were recorded using a Lab RAM HR Raman spectroscope (Jobin Yvon Horiba, France) with a laser wavelength of 633 nm. The Raman spectra of pristine xGnP, the neat blend of EVA and EOC, the solid xGnP-filled EVA/EOC blend and its foamed composite are shown in Fig. 3. The neat EVA/EOC blend presented peaks at 630 cm−1 and 1725 cm−1, which are characteristic of the vinyl acetate group (EVA). The bands at about 1200–1350 cm−1 depict the presence of the 1-octene group of EOC. Two bands appeared in the case of pristine xGnP at 1351 and 1588 cm−1, corresponding to the D and G bands of graphene nanoplatelets, respectively. In the spectrum of EVA/EOC/xGnP (EOX30), the D and G bands were shifted to 1330 cm−1 and 1573 cm−1 with increased intensities. This is because, when the xGnP is included in the EVA/EOC matrix, the nanoplatelets are subjected to strain, which results in the shifting of the D and G bands. With foaming agent loading, (EOX30A4), the peaks were suppressed. The suppression of the D and G bands is due to the exfoliation of GNPs in the EVA/EOC blend matrix.
 |
| | Fig. 3 Raman spectroscopy of xGnP, unfilled EVA and EOC blend, xGnP filled EVA/EOC and microcellular EVA/EOC/xGnP composites. | |
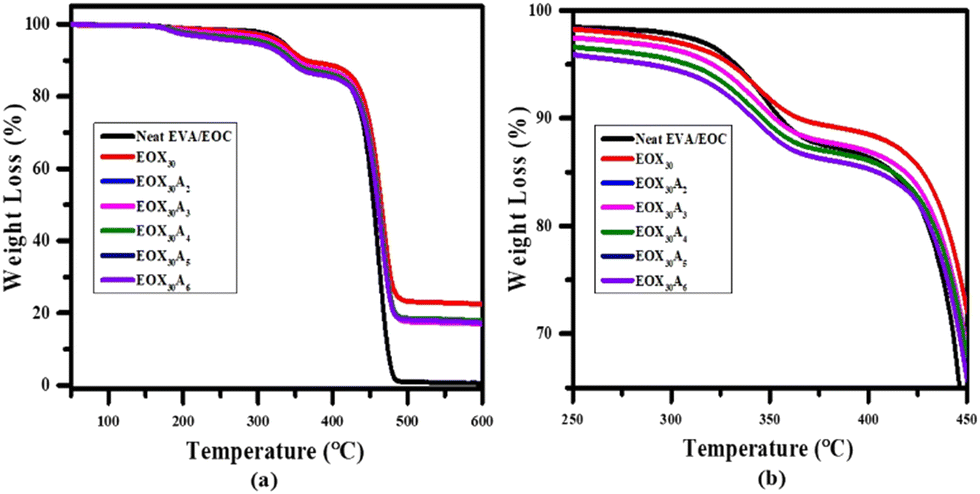
3.4. Thermogravimetric analysis
A PerkinElmer PYRIS calorimeter was utilized for the thermogravimetric analysis (TGA) of the samples at a heating rate of 10 °C min−1 from room temperature to 600 °C in a nitrogen atmosphere. The thermogravimetric curve of the unfilled EVA/EOC blend and the 30 wt% xGnP-loaded EVA/EOC solid and foamed composites are displayed in Fig. 4. The two-stage thermal degradation data of the composites are listed in Table 2. The first degradation step was observed in the range of 260–340 °C, and the vertical sloping of the curve depicts the delamination of the vinyl acetate group of the major constituent EVA and its decomposition to CO2.36 As the amount of xGnP was fixed, material stability was not dependent only on xGnP. The second degradation event was observed in the range of 360–430 °C due to the xGnP content and volatilization of the residual polymer content.36 With an increase in foaming agent content, the decomposition temperature increases because of an increase in the number of air-containing cells, which act as an insulating barrier and prevent degradation.
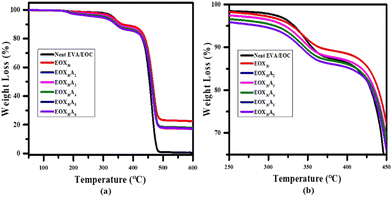 |
| | Fig. 4 . (a) TGA thermograms of xGnP-incorporated microcellular EVA/EOC composites; (b) the magnified thermograms of microcellular EVA/EOC/xGnP composites in the range of 250–450 °C show the major degradation step. | |
Table 2 TGA data of unfilled EVA/EOC and the xGnP-loaded solid and microcellular EVA/EOC/xGnP composites
| Sample |
Maximum degradation temperature (°C) |
Degradation rate (maximum) |
Residue wt% (600 °C) |
| EVA/EOC (50:50) |
413.65 |
0.21 |
0.69 |
| EOX30 |
417.69 |
0.84 |
22.58 |
| EOX30A2 |
419.03 |
0.86 |
17.95 |
| EOX30A3 |
419.95 |
0.87 |
17.24 |
| EOX30A4 |
421.97 |
0.90 |
16.56 |
| EOX30A5 |
422.23 |
0.91 |
16.01 |
| EOX30A6 |
425.19 |
0.94 |
15.88 |
3.5. Electromagnetic interference shielding effectiveness
An ENA series network analyzer (E5071C) from Agilent Technologies was used for the measurement of scattering parameters (S11, S21) by the wave guide method in the frequency range of 100 MHz–8.5 GHz. Samples with a specimen size of 13 mm diameter and 0.5 mm thickness were used to calculate the shielding efficiency.
The solid microwave-shielding polymer composites and their foamed composites, when exposed to electromagnetic waves for EMI shielding, follow four types of mechanisms i.e., absorption, reflection, transmission and multiple reflection. Eventually, the absorption and reflection mechanisms determine the total shielding efficiency. Dielectric and magnetic loss have important effects on the absorption mechanism, whereas, the surface free charge and electrical conductivity are important for the reflection mechanism.37 The scattering parameters (S11 and S21) measured from the network analyzer were determined; the reflectance® and transmittance (T) values of the EM waves were evaluated, as given below:38
The summation of the reflectance, absorbance and transmittance values tends to one, so absorbance (
A) can be expressed as
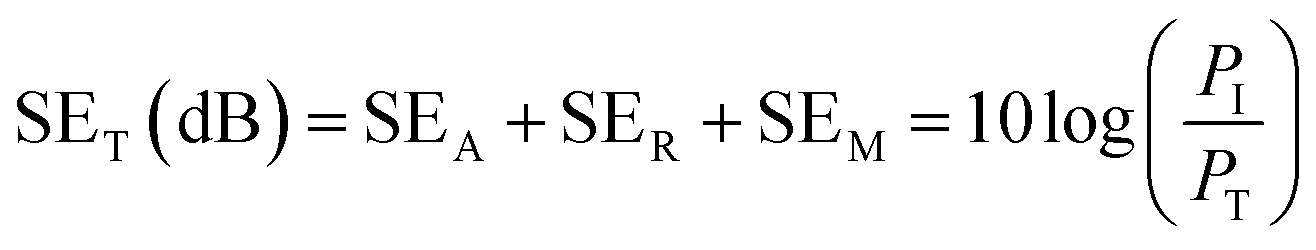
The EMI shielding efficiency (EMI SE) is denoted as the total shielding effectiveness (SET) and expressed in decibels (dB); it was calculated as the sum of shielding effectiveness due to absorption (SEA), reflection (SER) and multiple reflections (SEM):
| | 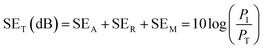 | (7) |
where
PI and
PT are the incident and transmitted EM waves, respectively. If the SE
T value is >15 dB, SE
M can be neglected.
39 Moreover, in the case of foamed conductive filler composites, most of the radiation reflected inside the materials is absorbed, and therefore, the total shielding effectiveness is only dependent on the SE
A and SE
R values.
39
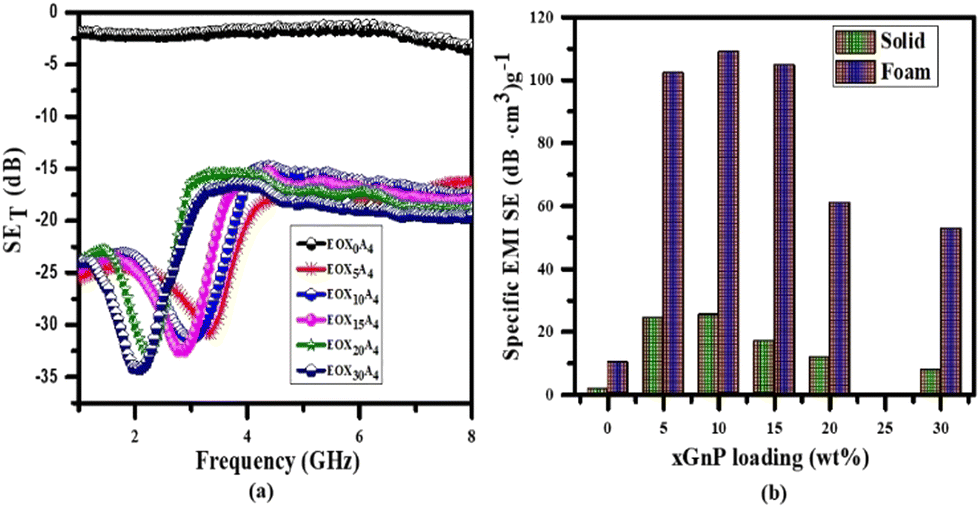
To explore the effects of foaming on electrical conductivity and shielding efficiency, the xGnP content was fixed at 30 wt% based on our previous findings24 and the amount of foaming agent ADC was varied. The EMI-shielding effectiveness of the xGnP-loaded EVA/EOC microcellular composites in the microwave frequency range of 1 to 8 GHz is shown in Fig. 5. The neat EVA-EOC composite exhibited low EMI shielding and was transparent to microwave absorption. The total EMI SE increased with the foaming agent content up to 4 wt% (EOX30A4) and then decreased at higher loadings. The increase in SET was due to the increase in cell density, as well as porosity, which causes easy scattering of the EM waves and increases the propagation time.
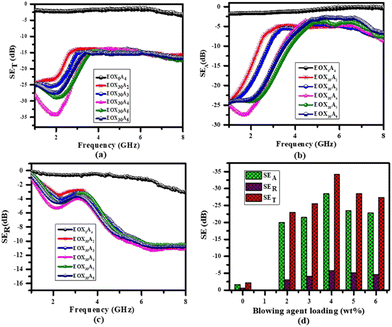 |
| | Fig. 5 (a) SET, (b) SEA and (c) SER of 30 wt% xGnP-filled microcellular EVA/EOC composites with varying ADC wt% over the 1 to 8 GHz frequency range; (d) variations in SET, SEA, SER with foaming agent loading. | |
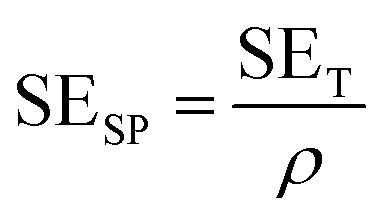
The EMI SE efficiency of the foamed microcellular EVA/EOC/xGnP composites had a minimum value of −15 dB in the studied frequency range. The highest value of total EMI SE (34.17 dB at 2.04 GHz) was obtained for the 4 wt% foaming agent-loaded EVA/EOC/xGnP foamed composite. As proposed by Ling et al., for the comparison of the shielding performance of polymer foams with those of typical metals used in aircraft and spacecraft applications, specific EMI shielding efficiency would be more appropriate. It is defined as the ratio of total EMI SE (SET) to density (ρ) and is denoted as specific EMI SE (SESP).40
| |  | (8) |
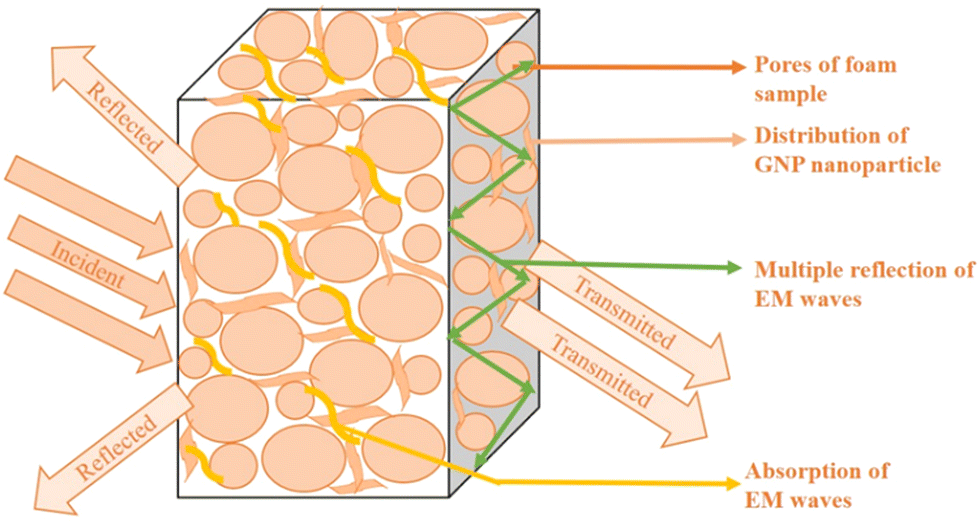
Thus, the EMI-shielding efficiency (SESP) of the 4 wt% foaming-agent-loaded 30 wt% xGnP-filled EVA/EOC blend was found to be 107.79 dB cm3 g−1, which is much higher than that of its solid counterpart. The main contribution to the higher EMI shielding efficiency of EVA/EOC/xGnP microcellular composite is from the interconnected graphene nanoplatelet network spread throughout the insulating EVA/EOC blend. Moreover, the gas released from the foaming agent stretches the graphene platelets, thus facilitating their presence on the cell walls and enhancing the interconnections. The high-magnification SEM micrograph in Fig. 1 shows GNP stuck to the cell wall. Fig. 5(d) represents the contribution of absorption (SEA) and reflection (SER) vs. frequency to the shielding effectiveness of the 30 wt% xGnP-loaded EVA/EOC microcellular foams with different blowing agent concentrations.
It is known that the absorption mechanism (SEA) is the major contributor to the electromagnetic attenuation mechanism. Because of the cellular structure in foamed composites, more EM waves can be absorbed due to continual scattering and multiple reflections, which lead to a prolonged traveling path and hence easy dissipation of the EM waves. The mechanism of electromagnetic shielding is shown in Fig. 6. Table 3 presents a comparison of the specific EMI SE data of the microcellular counterparts and the solid 30 wt% xGnP-loaded EVA/EOC composite (EOX30A0), which points out that as the blowing agent wt% increases, the SESP values gradually increase up to 4 wt% and then decrease at higher loadings.
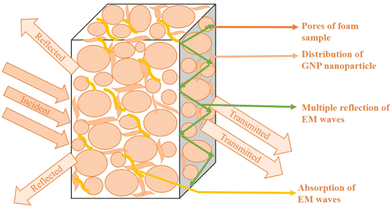 |
| | Fig. 6 Mechanism of EMI shielding in xGnP-filled microcellular EVA/EOC foam composites. | |
Table 3 Specific EMI SE data of the xGnP-filled solid and foamed EVA/EOC microcellular composites in the 2–4 GHz frequency range
| Sl. no. |
Composition |
Density (g cc−1) |
Total EMI SE (–dB) |
Specific EMI SE (dB cm3 g−1) |
| 1 |
EOX30 |
2.133 |
67.63 |
31.70 |
| 2 |
EOX30A2 |
0.512 |
23.01 |
49.94 |
| 3 |
EOX30A3 |
0.343 |
25.60 |
74.63 |
| 4 |
EOX30A4 |
0.317 |
34.17 |
107.79 |
| 5 |
EOX30A5 |
0.290 |
28.94 |
99.79 |
| 6 |
EOX30A6 |
0.284 |
27.40 |
96.47 |
After finding the maximum EMI shielding performance of the microcellular 30 wt% xGnP loaded EVA/EOC blend foamed with 4 wt% foaming agent, we examined the effect of xGnP loading by varying xGnP at 4 wt% blowing agent loading. Fig. 7(a) represents the SET of 4 wt% blowing agent-loaded EVA/EOC foam composites with the variation of xGnP content. The values are depicted in Table 4. The highest values of shielding effectiveness were achieved at 10 wt% xGnP loading, and the values decreased at higher wt% of xGnP foamed with 4 wt% foaming agent. Moreover, the maximum SE was observed in the 2–4 GHz range. Fig. 7(b) represents the comparative specific EMI shielding efficiencies (SEsp) of the solid and microcellular EVA/EOC/xGnP composites at the frequency of 3 GHz. The reason for choosing 3 GHz is that it crosses the conventional boundary between ultra-high frequency (UHF) and super-high frequency (SHF) in S-band. As shown, at each xGnP content, the foamed samples displayed higher SEsp values in comparison with their solid counterparts.
 |
| | Fig. 7 (a) SET of 4 wt% blowing agent-loaded EVA/EOC foam composites with varying xGnP wt% over the 1–8 GHz frequency range. (b) Comparison of specific EMI SE of solid and microcellular EVA/EOC/xGnP foam composites with different xGnP loadings at 3 GHz. | |
Table 4 Specific EMI SE data of the composites with a fixed amount (4 wt%) of ADC and varying wt% of xGnP (0, 5, 10, 15, 20) in the 2–4 GHz frequency range
| Sl. no. |
Composition |
Density (g cc−1) |
Total EMI SE (–dB) |
Specific EMI SE (dB cm3 g−1) |
| 1 |
EOX5A4 |
0.280 |
31.27 |
111.67 |
| 2 |
EOX10A4 |
0.287 |
32.58 |
113.51 |
| 3 |
EOX15A4 |
0.299 |
32.66 |
109.23 |
| 4 |
EOX20A4 |
0.304 |
33.06 |
108.64 |
The foamed EVA/EOC composite with 10 wt% xGnP loading had a specific EMI shielding of 113.51 dB cm3 g−1, which is lower than that (32.58 dB cm3 g−1) of its solid counterpart by 348%. Therefore, it is noteworthy that in order to attain a high value of EMI SE, foaming is a better option because it reduces the use of fillers, leading to cost reduction. We compared our EMI SE data with other studied conducting polymer composite foams, as presented in Table 5.
Table 5 EMI-shielding properties of different conducting polymer foam composites
| Composition |
Filler content |
EMI SE (dB) |
| Low density Polycarbonate foam32 |
0.5 wt% graphene |
14 |
| PMMA Foam33 |
1–8 wt% graphene |
13–19 |
| PVDF Foam34 |
5 wt% graphene |
20 |
| PDMS Foam35 |
0.8 wt% graphene |
30 |
| Polyetherimide foam31 |
10 wt% graphene |
11 |
| PLA foam11 |
5 wt% GNP |
10.9 |
| HDPE foam29 |
19 vol% GNP |
31.6 |
| PVDF foam |
10 wt% GNP |
27 |
| PVDF/PANI foam |
5 wt% RGO |
28.18 |
| EVA/EOC foam |
30 wt% xGnP |
34.17 |
3.6. Electromagnetic properties
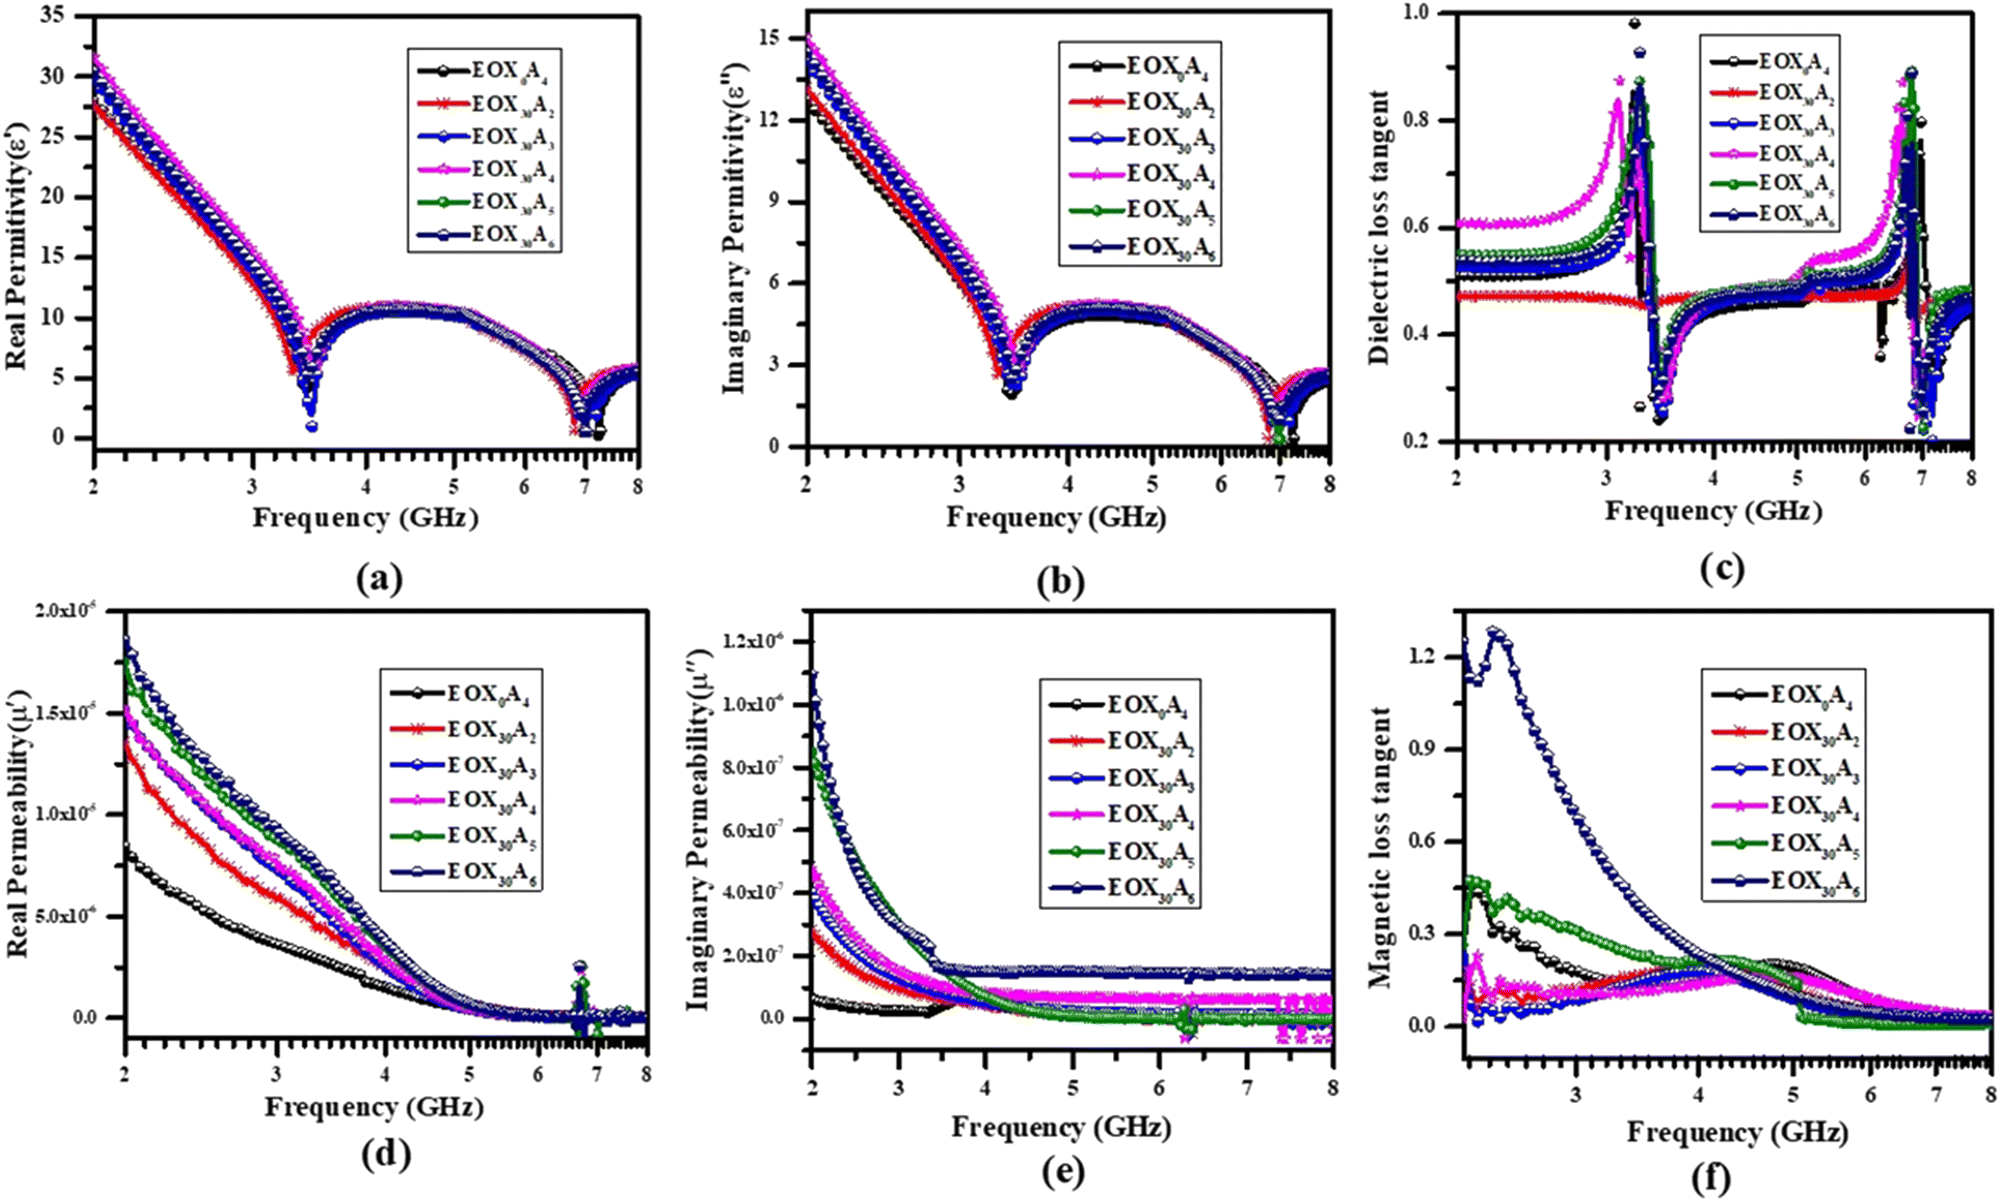
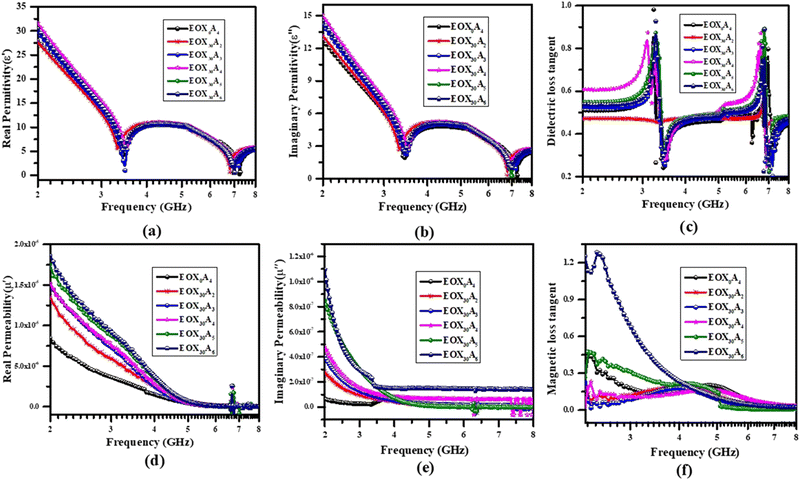
Since the filler and matrixes would have different electromagnetic properties, we measured all the electromagnetic parameters of the as-prepared solid and foamed samples by using the experimental scattering parameters S11 and S21 according to Nicolson-Ross-Weir (NRW) algorithms.43,44 Variations in the electromagnetic properties, including real and imaginary permittivity and dielectric loss tangent, of the xGnP-filled solid EVA/EOC composites and their microcellular counterparts with frequency are depicted in Fig. 8(a–c). Real permittivity (ε′) represents the electric charge storage capacity, while imaginary permittivity (ε′′) represents dielectric dissipation or losses, and the extent of losses was measured from the tangent of dielectric losses (tanδ = ε′′/ε′).45 As shown in Fig. 8(a), the maximum value of ε′ was achieved at the extreme lower end of frequency in the S-band region, and it experienced little fluctuation at veryhigh frequencies. It also measures the number of micro-capacitors and polarization centers created when current displacement occurs. The interfacial polarization and relaxation phenomena had some effect in the high-frequency region. As the blowing agent loading increased, the ε′ values increased, increasing the cell density in turn and creating mini-sized capacitors in the composites.46
 |
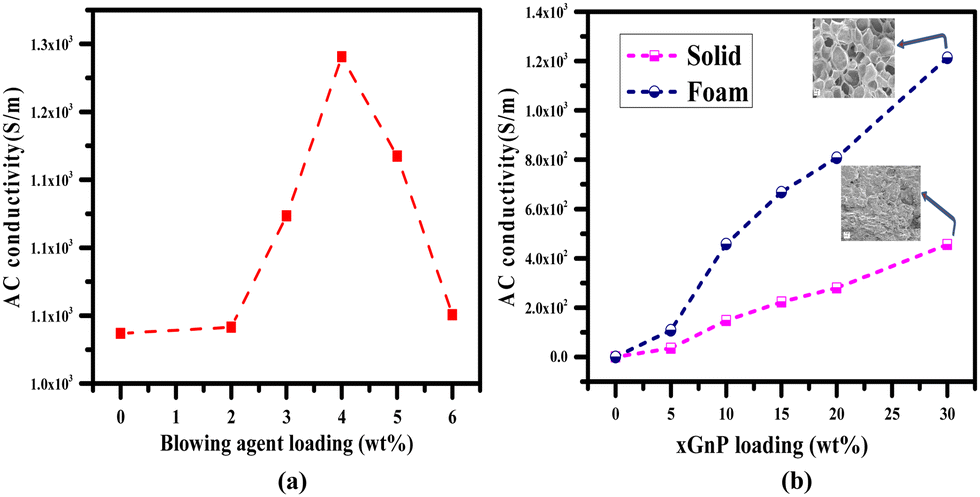
| | Fig. 8 (a) AC conductivity vs. blowing agent loading at 3 GHz; (b) comparison of the AC conductivity of the un-foamed and foamed composites with varying xGnP loadings. | |
Similarly, as shown in Fig. 8(b), with an increase in foaming agent loading, ε′′ values also increased, indicative of enhancement in conductivity; however, with the rise in frequency, it gradually fell at higher frequencies. A similar behavior was also noted for the real permittivity values. The extent of tangent losses is plotted in Fig. 8(c). Polymer composites with high permittivity and low tanδ values are good absorbers of microwave radiation. Similarly, Fig. 8(d–f) represent the variations of magnetic permeability parameters with frequency. The real (μ′) and imaginary parts (μ′′) of the permeability of the composites are shown in Fig. 8(d) and (e), which are related to magnetic storage and losses, respectively. It was observed that, with a rise in frequency, those parameters showed a decreasing tendency. Despite the rise in frequency, a quite low fluctuation of ε′ and no fluctuation of the imaginary part (ε′′) values were observed. The imaginary parts of the permeability values were lower than the real parts, which demonstrates that the composites had weak magnetic loss characteristics. The magnetic loss tangent (tanδ = μ′′/μ′) of the solid and foamed EVA/EOC/xGnP composites were calculated and are displayed in Fig. 8(f). As the xGnP wt% is fixed throughout the series, with an increase in wt% of the foaming agent, fluctuating values of loss tangent were observed in the cases of both dielectric and magnetic behaviors.
3.7. Conductivity study
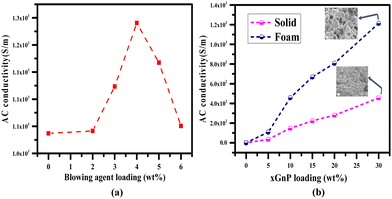
Conductivity is the main parameter that determines EMI-shielding effectiveness. Generally, as the conductivity value increases, the EMI-shielding effectiveness increases. The ac conductivity values of the different foam composites were estimated by using the following equation.where f is the frequency in GHz, ε0 is the permittivity of free space, and ε′′ is the imaginary part of permittivity. Fig. 9(a) represents the ac conductivity values of the foam composites with different wt% of foaming agent at 3 GHz frequency. With a fixed amount (30 wt%) of xGnP loading, conductivity increased up to 4 wt% blowing agent loading and then it decreased with a further increase in foaming agent content. This is due to the decrease in cell density, which causes cells to collapse and form bigger cells, leading to a high degree of foaming and disturbance in the internal circulation of current. The incorporation of a microcellular structure increases electrical conductivity and makes it efficient by controlling the void fraction because bubble growth leads to the rotation and displacement of the surrounding filler. This effect will cause a re-distribution of the preferentially aligned filler observed in the studied samples, thereby increasing the chance of interconnectivity.41Fig. 9(b) also shows a comparison of the conductivity values of the solid xGnP-filled EVA/EOC composites (reported in our previous work24) with their foam counterparts at a fixed foaming agent concentration of 4 wt% and a frequency of 3 GHz. For the same composition, foaming increases the conductivity values compared with the solid counterparts. The incorporation of the microcellular structure results in increased void fraction and cell density, which allow the movement of more electrons in the voids with internal reflection, as well as increase the local interconnectivity of xGnPs, due to cell growth during foaming.42
 |
| | Fig. 9 (a) ε′ vs. frequency, (b) ε′′ vs. frequency, (c) dielectric tangent loss vs. frequency, (d) μ′ vs. frequency, (e) μ′′ vs. frequency and (f) magnetic tangent loss of the solid and microcellular xGnP-filled EVA/EOC composites. | |
4 Conclusions
xGnP-filled EVA/EOC microcellular composites with varying foaming agent contents were processed through the melt compounding route. The morphology of the microcellular EVA/EOC/xGnP foams was analyzed via SEM analysis. All the samples presented closed-cell structures. The average cell size increased with an increase in foaming agent concentration. The cell density increased with increasing foaming agent up to 4 wt% and then decreased at 6 wt%, which is attributed to the rise in gas pressure as a result of which the cells coalesce. The comparative thermal stability of the solid composites and their foam counterparts were analyzed by TGA thermograms. The maximum value of total EMI shielding efficiency (−34.17 dB) with a specific EMI SE value of 107.79 dB cm3 g−1 at 2.04 GHz in the S-band region was achieved by the 30 wt% xGnP-loaded foamed blend with 4 wt% ADC. With the variation of xGnP loading at a constant blowing agent loading of 4 wt%, it was observed that an EMI SE of −32.58 dB was achieved (specific EMI SE of 113.51 dB cm3 g−1) at 10 wt% xGnP loading at 3 GHz frequency. The result thus obtained is much better than the other studied composite foams. From the study of electromagnetic properties, it was observed that the real and imaginary permittivity values increased and the conductivity properties were enhanced with an increase in the amount of foaming agent. Magnetic permeability had less influence on the material properties throughout studies. The ac conductivity values of the foamed samples were calculated by using the imaginary part of permittivity and the maximum of 1.24 × 10³ S m−1 was observed at 4 wt% foaming agent loading. Thus, the xGnP-filled microcellular EVA/EOC composites have remarkable EMI-shielding efficiency in the S-band region and can be used as microwave absorbers in different wireless communication devices.
Author contributions
The manuscript was written through contributions of all authors. All authors have given approval to the final version of the manuscript
Conflicts of interest
There are no conflicts to declare.
Acknowledgements
Nimai C. Nayak sincerely thanks to the Board of Research in Nuclear Sciences (BRNS), Department of Atomic Energy; Govt. Of India for financially supporting for this work vide grant No-37(3)/14/24/2017-BRNS.
References
- Z. Sienkiewicz, J. Radiol. Prot., 1998, 18, 185–193 CrossRef CAS PubMed.
- N. C. Das, T. K. Chaki, D. Khastgir and A. Chakraborty, Adv. Polym. Technol., 2001, 20, 226–236 CrossRef CAS.
- M. H. Al-Saleh and U. Sundararaj, J. Phys. D: Appl. Phys., 2012, 46, 035304 CrossRef.
- Y. Yang, M. C. Gupta and K. L. Dudley, Nanotechnology, 2007, 18, 345701 CrossRef.
- A. Ameli, P. U. Jung and C. B. Park, Carbon, 2013, 60, 379–391 CrossRef CAS.
- A. Fletcher, M. C. Gupta, K. L. Dudley and E. Vedeler, Compos. Sci. Technol., 2010, 70, 953–958 CrossRef CAS.
- J.-M. Thomassin, D. Vuluga, M. Alexandre, C. Jérôme, I. Molenberg, I. Huynen and C. Detrembleur, Polymer, 2012, 53, 169–174 CrossRef CAS.
- N. Joseph, C. Janardhanan and M. T. Sebastian, Compos. Sci. Technol., 2014, 101, 139–144 CrossRef CAS.
- R. Ram, M. Rahaman and D. Khastgir, Composites, Part A, 2015, 69, 30–39 CrossRef CAS.
- D. Han, H. Mei, S. Xiao, W. Xue, Q. Bai and L. Cheng, J. Mater. Sci., 2017, 52, 8401–8411 CrossRef CAS.
- A. Bregman, E. Michielssen and A. Taub, Polymers, 2019, 11, 1233 CrossRef PubMed.
- S. C. Tjong, Energy Environ. Sci., 2011, 4, 605 RSC.
- X. Xia, A. D. Mazzeo, Z. Zhong and G. J. Weng, J. Appl. Phys., 2017, 122, 025104 CrossRef.
- H.-B. Zhang, Q. Yan, W.-G. Zheng, Z. He and Z.-Z. Yu, ACS Appl. Mater. Interfaces, 2011, 3, 918–924 CrossRef CAS PubMed.
- J. Liang, Y. Wang, Y. Huang, Y. Ma, Z. Liu, J. Cai, C. Zhang, H. Gao and Y. Chen, Carbon, 2009, 47, 922–925 CrossRef CAS.
- M. Sumita, K. Sakata, S. Asai, K. Miyasaka and H. Nakagawa, Polym. Bull., 1991, 25, 265–271 CrossRef CAS.
- C. Mao, Y. Zhu and W. Jiang, ACS Appl. Mater. Interfaces, 2012, 4, 5281–5286 CrossRef CAS PubMed.
- M. F. Shakir, A. N. Khan, R. Khan, S. Javed, A. Tariq, M. Azeem, A. Riaz, A. Shafqat, H. M. Cheema, M. A. Akram, I. Ahmad and R. Jan, Results Phys., 2019, 14, 102365 CrossRef.
- Q.-M. He, J.-R. Tao, Y. Yang, D. Yang, K. Zhang and M. Wang, Carbon, 2023, 213, 118216 CrossRef CAS.
- M.-L. Huang, C.-L. Luo, C. Sun, K.-Y. Zhao, Y.-X. Weng and M. Wang, Composites, Part A, 2023, 169, 107532 CrossRef CAS.
- Y.-N. Gao, Y. Wang, T.-N. Yue and M. Wang, Composites, Part B, 2023, 249, 110402 CrossRef CAS.
- Y. Yang, C.-L. Luo, X.-D. Chen and M. Wang, Compos. Sci. Technol., 2023, 233, 109913 CrossRef CAS.
- J.-R. Tao, C.-L. Luo, M.-L. Huang, Y.-X. Weng and M. Wang, Composites, Part A, 2023, 164, 107304 CrossRef CAS.
- S. Parida, R. Parida, B. Parida, S. K. Srivastava and N. C. Nayak, Compos. Sci. Technol., 2021, 207, 108716 CrossRef CAS.
- X. Jia, B. Shen, L. Zhang and W. Zheng, Carbon, 2021, 173, 932–940 CrossRef CAS.
- B. Zhao, X. Li, S. Zeng, R. Wang, L. Wang, R. Che, R. Zhang and C. B. Park, ACS Appl. Mater. Interfaces, 2020, 12, 50793–50802 CrossRef CAS PubMed.
-
S.-T. Lee, C. B. Park and N. S. Ramesh, Polymeric Foams Science and Technology, 2006, CRC Press Search PubMed.
- Y. Yang, M. C. Gupta, K. L. Dudley and R. W. Lawrence, Nano Lett., 2005, 5, 2131–2134 CrossRef CAS PubMed.
- L. Zhang, M. Liu, S. Roy, E. K. Chu, K. Y. See and X. Hu, ACS Appl. Mater. Interfaces, 2016, 8, 7422–7430 CrossRef CAS.
- S. Park, C. Yim, B. H. Lee and S. Choe, Macromol. Res., 2005, 13, 243–252 CrossRef CAS.
- A. Mamun, M. T. Souier, S. M. Mujibur Rahman, S. H. Al-Harthi and A. Munam, Polym. Sci., Ser. A, 2017, 59, 397–404 CrossRef CAS.
-
S. K. Parida and R. K. Parida, Current advances in Mechanical Engineering: Select Proceedings of ICRAMERD, Springer, 2021, pp. 75–84 DOI:10.1007/978-981-33-4795-3_8.
- W. Zhai, S. N. Leung, L. Wang, H. E. Naguib and C. B. Park, J. Appl. Polym. Sci., 2010, 116, 1994–2004 CrossRef CAS.
- P. Rizzo, F. Baione, G. Guerra, L. Martinotto and E. Albizzati, Macromolecules, 2001, 34, 5175–5179 CrossRef CAS.
- M. Hamidinejad, B. Zhao, A. Zandieh, N. Moghimian, T. Filleter and C. B. Park, ACS Appl. Mater. Interfaces, 2018, 10, 30752–30761 CrossRef CAS PubMed.
- S. Kim and L. T. Drzal, J. Adhes. Sci. Technol., 2009, 23, 1623–1638 CrossRef CAS.
- J. Ling, W. Zhai, W. Feng, B. Shen, J. Zhang and W. Ge Zheng, ACS Appl. Mater. Interfaces, 2013, 5, 2677–2684 CrossRef CAS PubMed.
- G. Gedler, M. Antunes and J. I. Velasco, Composites, Part B, 2016, 92, 299–306 CrossRef CAS.
- H.-B. Zhang, Q. Yan, W.-G. Zheng, Z. He and Z.-Z. Yu, ACS Appl. Mater. Interfaces, 2011, 3, 918–924 CrossRef CAS PubMed.
- V. Eswaraiah, V. Sankaranarayanan and S. Ramaprabhu, Macromol. Mater. Eng., 2011, 296, 894–898 CrossRef CAS.
- Z. Chen, C. Xu, C. Ma, W. Ren and H. Cheng, Adv. Mater., 2013, 25, 1296–1300 CrossRef CAS.
- B. Zhao, C. Zhao, M. Hamidinejad, C. Wang, R. Li, S. Wang, K. Yasamin and C. B. Park, J. Mater. Chem. C, 2018, 6, 10292–10300 RSC.
- R. Bera, S. Paria, S. K. Karan, A. K. Das, A. Maitra and B. B. Khatua, eXPRESS Polym. Lett., 2017, 11, 419–433 CrossRef CAS.
- F. Abbasi, D. A. Shojaei and S. M. Bellah, J. Thermoplast. Compos. Mater., 2018, 32, 1378–1392 CrossRef.
- H. Enoki, Materia Japan, 1994, 33, 1262 CrossRef.
- F. Cilento, C. Curcio, A. Martone, A. Liseno, A. Capozzoli and M. Giordano, J. Compos. Sci., 2022, 6, 257 CrossRef CAS.
|
| This journal is © The Royal Society of Chemistry 2024 |
Click here to see how this site uses Cookies. View our privacy policy here. 
 Open Access Article
 This Open Access Article is licensed under a Creative Commons Attribution-Non Commercial 3.0 Unported Licence
 *a
*a