 Open Access Article
Rapid identification of molecular subtyping of breast cancer cell lines using a multi-channel sensor array†
Yuyao
Jin‡
 ab,
Yuanjie
Sun‡
 a,
Nan
Du
 a,
Wei-Tao
Dou
c,
Ying
Tan
 ab,
Xiao-Peng
He
c,
Naihan
Xu
*ab and
Chunyan
Tan
 *ab
*ab
aThe State Key Laboratory of Chemical Oncogenomics, Shenzhen International Graduate School, Tsinghua University, Shenzhen, 518055, P. R. China. E-mail: xu.naihan@sz.tsinghua.edu.cn; tancy@sz.tsinghua.edu.cn
bOpen FIESTA, Shenzhen International Graduate School, Tsinghua University, Shenzhen 518055, P. R. China
cKey Laboratory for Advanced Materials and Joint International Research Laboratory of Precision Chemistry and Molecular Engineering, Feringa Nobel Prize Scientist Joint Research Center, School of Chemistry and Molecular Engineering, Frontiers Center for Materiobiology and Dynamic Chemistry, East China University of Science and Technology, Shanghai 200237, P. R. China
First published on 20th June 2023
Abstract
In this paper, we present a multi-channel sensor array composed of three fluorescent probes that can be used to identify and differentiate breast cancer molecular subtypes, including luminal A, luminal B, HER2-enriched and triple-negative. The multi-channel sensor array allows the three probes to mix and interact with each cell sample in one well simultaneously, resulting in high efficiency, lower sample costs, and 100% accuracy in cell molecular subtype differentiation.
The use of sensor arrays to mimic mammalian taste and olfactory systems has gained considerable attention in research fields of analytical chemistry. The concept of “chemical tongues” or “electronic noses” was proposed as an alternative to traditional highly specific “lock-and-key” recognition systems.1–3 Array-based sensing relies on non-specific or semi-selective interactions between multiple sensor units and analytes that may lead to pattern recognition of complex mixture samples.2,4 Array-based sensing strategies have been used in discrimination of volatile organic compounds, metal ions, amino acids, proteins, food additives, beverages and so on.2 In recent years, sensor arrays have shown potential applications in analyzing complex biological systems. For example, a three-unit fluorescence sensor array has been used to discriminate proteins in urine samples for urinary disease diagnosis in our previous work;5 Rotello's group has reported using different designs of sensor arrays, including fluorescence nanoparticle–polymers,6 ratiometric conjugated polymer–fluorescent proteins,7 and quantum dot-gold nanoparticle sensor arrays,8 to differentiate cell types and phenotypes, and macrophage phenotypes;9,10 other reports include stem-cell differentiation,11 bacteria identification,12–17 microbial pathogen detection,18–20 recognition of gut microbiota,21etc.22–24
Lipids, carbohydrates, and several membrane proteins make up the membrane of cells.25 In the course of carcinogenesis, the lipid composition of the membrane varies,26 membrane receptors are overexpressed,27 and surface proteins are glycosylated,28 resulting in varying molecular patterns. Malignancy types and molecular subtypes also differ in the composition of cancer cell membranes. Breast tumours can be classified into four molecular subtypes based on gene expression patterns, namely luminal A (high expression of estrogen receptor), luminal B, HER2-enriched (human epidermal growth factor receptor 2-enriched), and basal-like (also known as triple-negative).29 Different subtypes result in different clinical behaviours, which are crucial to the development of targeted therapies and to determining the prognosis of breast cancer (BC). In clinical settings, determining the intrinsic molecular subtype of BC requires immunohistochemistry or gene expression profiling, both of which are costly, time-consuming, and not widely available.
Recently, we reported the development of a 12-unit sensor array consisting of 12 fluorescent probes, including conjugated polyelectrolytes, fluorophore-labelled peptides, and monosaccharides/glycans for the differentiation of BC exosomes.30 In contrast to a natural scenario, mammalian taste and olfactory systems actually “collect and analyze” responses delivered by different receptors within one breath of air or bite of food. This sensor array works on the principle of 12 different probes responding separately to each sample, and the response pattern is then analyzed through linear discriminant analysis (LDA), hierarchical cluster analysis (HCA) and a deep learning algorithm.
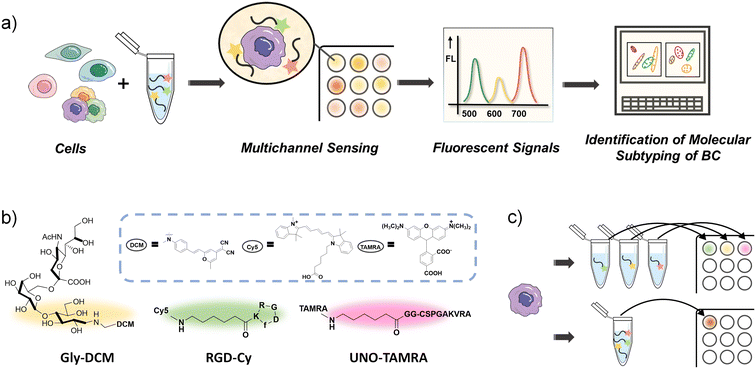
Large numbers of measurements have limited the use of sensor arrays composed of many sensor units in biological analysis. A “one-well analysis” method was developed to overcome this limitation, which combines multiple probes with the sample in one well, instead of measuring with each probe separately. Herein, we report a simple and efficient one-well three-channel fluorescent sensor array for rapid identification of molecular subtyping of BC cell lines (Scheme 1).
To minimize the number of probes and ensure identification of subtle differences between diverse BC subtypes, three recognition units have been selected to form the multi-channel sensor array: RGD-FITC, UNO-FITC and Gly–DCM (glycan–fluorophore conjugate). RGD-FITC contains an arginine–glycine–aspartic acid (RGD) tripeptide sequence. RGD can preferentially bind to integrin αvβ3, which is overexpressed on tumor endothelial cells as well as on some tumor cells such as BC, liver cancer and so on. RGD-based probes have been used for molecular imaging of BC.31 The recognition unit of UNO-FITC is a tumor homing peptide codenamed “UNO” that targets CD206 (a specific mannose binding receptor) on cells. Previously, it has been reported that UNO can target 4T1 and MCF7 breast carcinoma.32 Gly–DCM has a sialylated glycoconjugate, which binds to immune regulatory receptors (sialic acid-binding immunoglobulin-type lectins) predominantly found on cells.33 UNO and RGD have relatively high recognition specificity, while the glycan probe can cross-respond to a wider range of analytes. The combination of different interaction patterns is beneficial to maximize the recognition effect while reducing the number of probes.
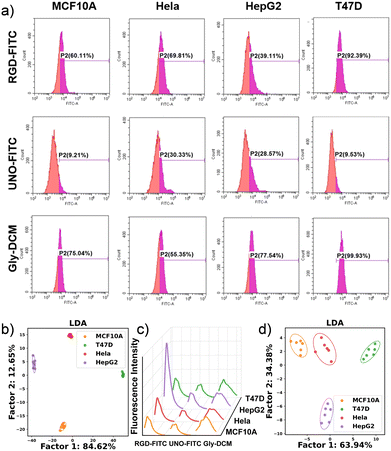
Initial studies examined the rationality of probe selection. Through flow cytometry (FCM), we first validated the discriminatory efficiency of three probes against a variety of cell lines: MCF10A (non-tumorigenic epithelial cell line), T47D (human BC cell line), HeLa (cervical cancer cell line), and HepG2 (liver carcinoma cell line). FCM provides a means of analyzing cell populations using different fluorescent stains. Using the probes of RGD-FITC, UNO-FITC, and Gly–DCM, a data matrix containing three probes, four cell types, and six replicates was generated. The results of the FCM analysis (Fig. 1a) provide different cell staining percentages with patterns. A number of machine learning methods have been developed to identify BC cell lines.34,35 Both LDA and principal component analysis (PCA) were used to analyze the experimental data in this study. As shown in Fig. 1b, LDA transformed raw fluorescence staining data into discriminant plots. Using leave-one-out cross-validation, four data groups clustered with 100% accuracy. PCA is an unsupervised learning algorithm (see Fig. S4†). In our study, LDA maximizes the signal-to-noise ratio of the data, allowing better differentiation between categories.
The same four cell lines and three probes were used to conduct the sensing experiment using a microplate reader to acquire fluorescence spectral data. Fig. 1c illustrates the fluorescence spectra, demonstrating details on individual intensities at different wavelengths. This provides a more advantageous approach than FCM in that FCM provides limited information on cell staining percentages and is relatively time-consuming to prepare samples. Meanwhile, fluorescence spectrometers and plate readers are more accessible than flow cytometers in most laboratories. Therefore, it is possible to collect high-dimensional fluorescence spectral data for the following data analysis. According to the LDA score plot (Fig. 1d), the four clusters were distributed in two-dimensional space without overlap and the accuracy is 100% with leave-one-out cross-validation.
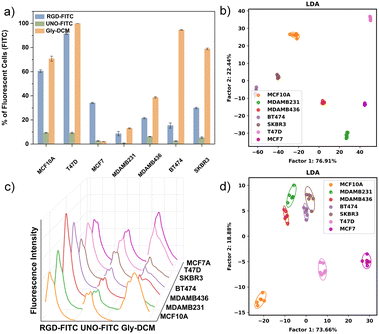
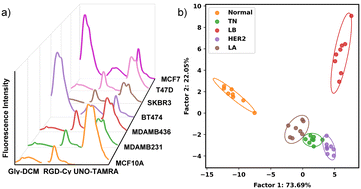
FCM and fluorescence spectral analysis were used to differentiate multiple cell lines, including one normal cell line MCF10A, and six BC cell lines, MDAMB231, MDAMB436, BT474, SKBR3, T47D, and MCF7 (Fig. 2). Both the FCM and fluorescence spectral analysis were successful in accurately classifying the samples, indicating the potential of the three-unit array for future applications.
In most sensor arrays reported in the literature, each sensor unit tests the sample individually, and all the separate signals are then collected and analyzed, whereas in mammalian olfactory and taste systems, all olfactory cells or taste buds respond to odors or tastes in concert and transmit a collective signal to the neural system for analysis. As a consequence, arrays with a large number of sensors require large quantities of samples and are labour-intensive and time-consuming. In order to observe the fluorescence from the three probes in one well, we modified the probes' recognition units with different coloured fluorophores. The chemical structures of the three modified probes are illustrated in Scheme 1b. We use Cy5 and TAMRA to modify RGD-peptide and UNO-peptide, to form RGD-Cy and UNO-TAMRA, respectively. Cy5 and TAMRA have strong light absorption and high quantum yields, which make them commonly used fluorophores. TAMRA fluoresces at 582 nm, whereas Cy5 fluoresces at 670 nm. Two glycine spacers (GG) were added between the 5-TAMRA unit and the circular UNO peptide sequence. Therefore, the three-channel sensor array is equipped with a yellow probe Gly–DCM, a red probe UNO-TAMRA, and a green probe RGD-Cy.
Although the modified probes on the fluorophore share the same recognition units, they differ from the original probes in reducing overlap among fluorophores and maximizing the amount of information collected across multiple detection channels while maintaining the cross-response capability of the original probes. Photophysical characterization of the probes is included in Fig. S1, ESI.† Gly–DCM exhibits a relatively wide spectrum of absorption and emission (λex = 456 nm; λem = 620 nm). RGD-Cy (λex = 600 nm; λem = 673 nm) and UNO-TAMRA (λex = 520 nm; λem = 582 nm) both exhibit strong and narrow emission signals.
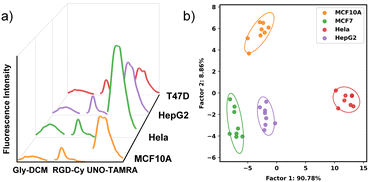
The three probes were then mixed together in one microwell and their spectra were measured. In the mixed system, Gly–DCM and UNO-TAMRA showed a slight change in spectral shape, which could be explained by the Förster resonance energy transfer (FRET) effect between the probes (Fig. S2, ESI†). FRET results in both a decrease in the fluorescence of the donor molecule and an increase in the fluorescence of the acceptor molecule. Some references have demonstrated that the use of FRET fluorophore pairs in a sensor array can provide more spectral information for pattern recognition.7,36 We then examined the fluorescence spectra of the sensor array with MCF10A and three tumor cell lines (Fig. 3a). As part of a one-well analysis, all probes were placed in one microwell in order to interact with the cell sample. Fluorescence spectra were then collected from each well at corresponding bands. A one-well analysis was able to discriminate four cell lines with 100% accuracy (Fig. 3b), demonstrating the feasibility of using multi-channel sensor arrays.
We further investigated the discrimination of different BC subtypes using a multi-channel sensor array with six different BC cell lines and one normal cell line. Based on the LDA result, these 7 cell lines can be divided into five groups: two LA subtype cell lines, T47D and MCF7, are grouped together; two TN cell lines, MDAMB 231 and MDAMB436 are grouped together; while MCF10A, SKBR3, and BT474 are grouped separately (Fig. 4b and Table S1, ESI†). As a heterogeneous disease with multiple subtypes, BC poses many treatment challenges. In these results, we demonstrate the capability of our multi-channel sensor array to differentiate molecular subtypes of BC cell lines.
In conclusion, a three-unit fluorescence sensor array for accurate discrimination of molecular subtypes of BC cells has been designed and constructed. With the multi-channel sensor array, three probes can mix and interact with each sample simultaneously, resulting in high efficiency, lower sample costs, and 100% accuracy in cell subtype differentiation. Moreover, due to its high sensitivity and excellent ability to recognize biological systems, this sensing platform might be well suited to more complex biological systems.
Author contributions
Yuyao Jin: data analysis, validation, and investigation. Yuanjie Sun: data analysis, validation, investigation, writing – original draft and review. Nan Du: validation, investigation, and data analysis. Wei-Tao Dou: resources. Ying Tan: formal analysis. Xiao-Peng He: resources. Naihan Xu: formal analysis and funding acquisition. Chunyan Tan: conceptualization, supervision, resources, writing – review & editing, methodology and funding acquisition.Conflicts of interest
There are no conflicts to declare.Acknowledgements
The authors would like to acknowledge the financial support from the State Key Laboratory of Chemical Oncogenomics and the Shenzhen Science and Technology Innovation Commission (JCYJ20220530142812029 and JCYJ20180508152213145).Notes and references
- F. Röck, N. Barsan and U. Weimar, Chem. Rev., 2008, 108, 705–725 CrossRef.
- Z. Li, J. R. Askim and K. S. Suslick, Chem. Rev., 2019, 119, 231–292 CrossRef CAS.
- J. R. Askim, M. Mahmoudi and K. S. Suslick, Chem. Soc. Rev., 2013, 42, 8649–8682 RSC.
- T. Li, X. Zhu, X. Hai, S. Bi and X. Zhang, ACS Sens., 2023, 8, 994–1016 CrossRef CAS PubMed.
- Y. Shen, Y. Huang, P. Zhang, B. Guo, H. Jiang, C. Tan and Y. Jiang, ACS Appl. Bio Mater., 2020, 3, 5639–5643 CrossRef CAS.
- A. Bajaj, O. R. Miranda, I.-B. Kim, R. L. Phillips, D. J. Jerry, U. H. F. Bunz and V. M. Rotello, Proc. Natl. Acad. Sci. U. S. A., 2009, 106, 10912–10916 CrossRef CAS.
- S. Rana, S. G. Elci, R. Mout, A. K. Singla, M. Yazdani, M. Bender, A. Bajaj, K. Saha, U. H. F. Bunz, F. R. Jirik and V. M. Rotello, J. Am. Chem. Soc., 2016, 138, 4522–4529 CrossRef CAS PubMed.
- Q. Liu, Y.-C. Yeh, S. Rana, Y. Jiang, L. Guo and V. M. Rotello, Cancer Lett., 2013, 334, 196–201 CrossRef CAS PubMed.
- Y. Geng, J. Hardie, R. F. Landis, J. A. Mas-Rosario, A. N. Chattopadhyay, P. Keshri, J. Sun, E. M. Rizzo, S. Gopalakrishnan, M. E. Farkas and V. M. Rotello, Chem. Sci., 2020, 11, 8231–8239 RSC.
- M. Jiang, A. N. Chattopadhyay, Y. Geng and V. M. Rotello, Chem. Commun., 2022, 58, 2890–2893 RSC.
- S. Tomita, S. Ishihara and R. Kurita, J. Mater. Chem. B, 2022, 10, 7581–7590 RSC.
- O. R. Miranda, X. Li, L. Garcia-Gonzalez, Z.-J. Zhu, B. Yan, U. H. F. Bunz and V. M. Rotello, J. Am. Chem. Soc., 2011, 133, 9650–9653 CrossRef CAS PubMed.
- W. Chen, Q. Li, W. Zheng, F. Hu, G. Zhang, Z. Wang, D. Zhang and X. Jiang, Angew. Chem., Int. Ed., 2014, 53, 13734–13739 CrossRef CAS PubMed.
- B. Duncan, N. D. B. Le, C. Alexander, A. Gupta, G. Yesilbag Tonga, M. Yazdani, R. F. Landis, L.-S. Wang, B. Yan, S. Burmaoglu, X. Li and V. M. Rotello, ACS Nano, 2017, 11, 5339–5343 CrossRef CAS.
- J. Han, H. Cheng, B. Wang, M. S. Braun, X. Fan, M. Bender, W. Huang, C. Domhan, W. Mier, T. Lindner, K. Seehafer, M. Wink and U. H. F. Bunz, Angew. Chem., Int. Ed., 2017, 56, 15246–15251 CrossRef CAS PubMed.
- H. Wang, L. Zhou, J. Qin, J. Chen, C. Stewart, Y. Sun, H. Huang, L. Xu, L. Li, J. Han and F. Li, Anal. Chem., 2022, 94, 10291–10298 CrossRef CAS PubMed.
- M. Zhao, X. Lin, X. Zhou, Y. Zhang, H. Wu and Y. Liu, ACS Appl. Mater. Interfaces, 2022, 14, 7706–7716 CrossRef CAS.
- H. Yuan, Z. Liu, L. Liu, F. Lv, Y. Wang and S. Wang, Adv. Mater., 2014, 26, 4333–4338 CrossRef CAS PubMed.
- H. Bai, H. Chen, R. Hu, M. Li, F. Lv, L. Liu and S. Wang, ACS Appl. Mater. Interfaces, 2016, 8, 31550–31557 CrossRef CAS PubMed.
- H. Yuan, H. Zhao, K. Peng, R. Qi, H. Bai, P. Zhang, Y. Huang, F. Lv, L. Liu, J. Bao and S. Wang, ACS Appl. Mater. Interfaces, 2020, 12, 21263–21269 CrossRef CAS PubMed.
- S. Tomita, H. Kusada, N. Kojima, S. Ishihara, K. Miyazaki, H. Tamaki and R. Kurita, Chem. Sci., 2022, 13, 5830–5837 RSC.
- X. Zhu, T. Li, X. Hai and S. Bi, Biosens. Bioelectron., 2022, 213, 114438 CrossRef CAS PubMed.
- M.-X. Liu, H. Zhang, X.-W. Zhang, S. Chen, Y.-L. Yu and J.-H. Wang, Anal. Chem., 2021, 93, 9002–9010 CrossRef CAS PubMed.
- S. Basu Roy, A. Nabawy, A. N. Chattopadhyay, Y. Geng, J. M. Makabenta, A. Gupta and V. M. Rotello, ACS Appl. Mater. Interfaces, 2022, 14, 27515–27522 CrossRef CAS PubMed.
- S. J. Singer and G. L. Nicolson, Science, 1972, 175, 720–731 CrossRef CAS PubMed.
- W. Szlasa, I. Zendran, A. Zalesińska, M. Tarek and J. Kulbacka, J. Bioenerg. Biomembr., 2020, 52, 321–342 CrossRef CAS PubMed.
- K. R. Kampen, J. Membr. Biol., 2011, 242, 69–74 CrossRef CAS PubMed.
- S. S. Pinho and C. A. Reis, Nat. Rev. Cancer, 2015, 15, 540–555 CrossRef CAS PubMed.
- T. Sørlie, R. Tibshirani, J. Parker, T. Hastie, J. S. Marron, A. Nobel, S. Deng, H. Johnsen, R. Pesich, S. Geisler, J. Demeter, C. M. Perou, P. E. Lønning, P. O. Brown, A.-L. Børresen-Dale and D. Botstein, Proc. Natl. Acad. Sci. U. S. A., 2003, 100, 8418–8423 CrossRef PubMed.
- Y. Jin, N. Du, Y. Huang, W. Shen, Y. Tan, Y. Z. Chen, W.-T. Dou, X.-P. He, Z. Yang, N. Xu and C. Tan, ACS Sens., 2022, 7, 1524–1532 CrossRef CAS PubMed.
- Z. Liu, F. Wang and X. Chen, Drug Dev. Res., 2008, 69, 329–339 CrossRef CAS PubMed.
- P. Scodeller, L. Simón-Gracia, S. Kopanchuk, A. Tobi, K. Kilk, P. Säälik, K. Kurm, M. L. Squadrito, V. R. Kotamraju, A. Rinken, M. De Palma, E. Ruoslahti and T. J. S. R. Teesalu, Sci. Rep., 2017, 7, 14655 CrossRef PubMed.
- K. F. Bornhöfft, T. Goldammer, A. Rebl and S. P. Galuska, Dev. Comp. Immunol., 2018, 86, 219–231 CrossRef PubMed.
- S. Farooq, M. Del-Valle, M. O. dos Santos, S. N. dos Santos, E. S. Bernardes and D. M. Zezell, Appl. Opt., 2023, 62, C80–C87 CrossRef PubMed.
- S. Farooq, A. Caramel-Juvino, M. Del-Valle, S. Santos, E. S. Bernandes and D. M. Zezell, 2022 SBFoton International Optics and Photonics Conference (SBFoton IOPC), 2022 Search PubMed.
- P. Zhang and C. Tan, Anal. Chem., 2022, 94, 5469–5473 CrossRef CAS PubMed.
Footnotes |
| † Electronic supplementary information (ESI) available: Additional experimental details, including materials and methods, and photophysical characterization of the probes. See DOI: https://doi.org/10.1039/d3sd00094j |
| ‡ These authors contribute equally to this work. |
| This journal is © The Royal Society of Chemistry 2023 |

