 Open Access Article
Synthesis of luminescent thorium-based metal–organic frameworks with 1,2,4,5-tetrakis(4-carboxyphenyl)benzene†
Ting Yu‡
 a,
Zheng-hua Qianb,
Lin Libc,
Xiao-ling Wubc,
Hui Hea,
Yan-bo Qiaob and
Guo-an Ye*a
aChina Institute of Atomic Energy, Department of Radiochemistry, Beijing 102413, China. E-mail: yeguoan@ciae.ac.cn
bShanghai Institute of Applied Physics, Chinese Academy of Sciences, Shanghai 201800, China
cUniversity of Chinese Academy of Sciences, Beijing 100049, China
First published on 12th May 2021
Abstract
Three new thorium-based MOFs based on 1,2,4,5-tetrakis(4-carboxyphenyl)benzene (H4TCPB) were obtained under a similar reaction system (metal salt, ligand, solvent, and acid are the same). Th(IV) forms the central unit of the MOFs in mononuclear and binuclear clusters, respectively. All the MOFs show blue ligand-based luminescence under an ultraviolet environment. This is the first time that multiple thorium-based MOFs with luminescence have been found with the same ligand.
1. Introduction
Metal–organic frameworks (MOFs), as functional materials with great potential, have been widely studied and applied in the fields of luminescence, adsorption, catalysis, and waste treatment since their discovery.1,2 In recent years, with the gradual improvement of the study on transition metal elements and lanthanide-based MOFs, actinide-based MOFs have attracted wide attention and form a new research direction.3 The 5f/6d/7s electron orbitals of actinides can easily be bonded by any element (the extranuclear electron configuration is 5f0–146d0–17s2), and they exhibit multiple oxidation states and have high coordination numbers. Therefore, actinides are more likely to react with ligands to form MOFs than transition metal elements and lanthanides. For example, uranyl-based MOFs with different topologies were synthesized using uranium(VI), and the properties of these compounds were characterized.4–9As an important part of the actinide chemistry, thorium has attracted more attention with the development of the thorium uranium fuel cycle. Thorium exists stably in solution as Th(IV), which hydrolyzes and condenses in a solution to form oxygen-containing or hydroxy-containing clusters.10 Compared with uranyl-based MOFs, the research progress of thorium-based MOFs is relatively slow.11 Only a few Th – containing compounds in CCDC database are MOFs. Since O'Hare first cofounded a series of thorium-based MOFs (TOF-1, TOF-2, and TOF-3),12–14 a number of constructed thorium-based MOFs have emerged newly, most of which are mononuclear, dimers, and trimers.15–19 In recent years, some thorium-based MOFs similar to the octahedral hexagonal zirconium clusters of classical zirconium-based MOFs have been synthesized successively: Thierry et al. synthesized Th-UiO-66,20 Li et al. synthesized Th-PCN-222,21 Islamoglu et al. synthesized Th-MOF-808,22 and Li et al. obtained a series of Th-UiO-66-X based on Th-UiO-66 by functional group modification.23,24
Unlike many of the photoluminescent uanyl-based MOFs found so far,25,26 thorium does not have typical photoluminescence characteristic peaks, so these known thorium-based MOFs focus more on the adsorption properties of materials.16,17,24 In this study, Th(IV) and 1,2,4,5-tetrad(4-carboxyl phenyl)benzene were used as raw materials for hydrothermal reaction. Three kinds of thorium-based MOFs with fluorescent properties were obtained without changing the reaction system except the reaction temperature, time, and regulator concentration. Like most known thorium-based MOFs, Th(IV) in our synthetic thorium-based MOFs exist as mononuclear and dinuclear clusters, respectively. These do not have hexagonal zirconium cluster structures similar to Zr-CAU-24.27
2. Experimental section
232Th used in this study is a radioactive and chemically toxic nuclide with the daughter of radioactive Ra-228. Standard precautions for handling radioactive materials should be followed.2.1 Materials and methods
Th(NO3)4·5H2O (99.5%, Shanghai Aladdin Biochemical Technology Co., Ltd), 1,2,4,5-tetrakis(4-carboxyphenyl)benzene (H4TCPB, 98%, Jilin Chinese Academy of Sciences-Yanshen Technology Co., Ltd), N,N′-dimethylformamide (DMF, 99.5%, Meryer Shanghai Chemical Technology Co., Ltd), trifluoroacetic acid (99%, Shanghai Macklin Biochemical Co., Ltd), ethanol (EtOH, 95%, Sinopharm Chemical Reagent Co., Ltd), n-hexane (97%, Meryer Shanghai Chemical Technology Co., Ltd), dichloromethane (DCM, 99.5%, Sinopharm Chemical Reagent Co., Ltd).The preparation of compound 2 was very accidental. A batch of samples was heated for 2 days, and no crystals were found when the autoclave was opened. Then the samples were heated for different times, and compound 2 was obtained in 4 days. We tried to heat the samples continuously for six days or more, but we didn't get the desired results. Therefore, cooling and pressure relief in the preparation process must be carried out.
Standard precautions were performed for handling radioactive materials during work with thorium-containing materials. The products were filtered and then dried in the air for analytical testing.
2.2 Single crystal X-ray diffraction (SCXRD)
Suitable crystals were selected and data collections were performed on a Bruker APEX-II CCD diffractometer equipped with a Turbo X-ray source (Ga Kα radiation, λ = 1.34180 Å) adopting the direct-drive rotating-anode technique and a CMOS detector. The crystal was kept at 169.98 K during data collection. Using Olex2,28 the structure was solved with the ShelXT29 structure solution program using intrinsic phasing and refined with the ShelXL30 refinement package using least squares minimization. The contributions to scattering due to these highly disordered solvent molecules were removed using the SQUEEZE routine of PLATON. Crystallographic data of compound 1–3 are given in Table S1† and the selected bond lengths are presented in Table S2.†2.3 Powder X-ray diffraction (PXRD)
The PXRD data were collected from 5° to 50° with a step of 0.02° on a Bruker D8 Advance diffractometer with Cu Kα radiation (λ = 1.54178 Å). The calculated PXRD pattern was produced from the CIFs using the SHELXTL-XPOW program. The phase purity of samples was confirmed by comparison of their simulated powder XRD patterns (Fig. S1†).2.4 Scanning electron microscope morphology (SEM)
SEM images were recorded on a Zeiss Merlin Compact LEO 1530 VP scanning electron microscope. Three thorium-based MOFs crystals were shown in sheets (20–40 m), biconical pillars (40–80 m), and lumps (30–50 m) under microscope (200 times) (Fig. S2†).2.5 Elemental analyses (EA)
The element content (C, H, and N) of the samples were performed with an Elementar Vario EL III.2.6 Infrared spectroscopy (IR)
The IR spectra in the range of 400 cm−1 to 4000 cm−1 was recorded by a Thermo Nicolet 6700 FTIR spectrometer equipped with a diamond attenuated total reflectance (ATR) accessory.2.7 Thermogravimetric analysis (TGA)
The TGA was carried out on a Mettler-Toledo TGA/DSC1 (N2) with a heating rate of 10 °C min−1 from 30 °C to 900 °C.2.8 Gamma irradiation
The prepared samples were irradiated by a 100 kCi radiation source (60Co) at a dose of 20 kGy to 100 kGy.2.9 Surface area measurement
The N2 adsorption isotherms were recorded at 77 K by using a micromeritics ASAP 2020 surface area and a porosity analyzer. NLDFT method was used for calculation of pore size distribution. Before the adsorption measurements, compound 1–3 were soaked in n-hexane and DCM for 6 h to exchange DMF guest solvent, respectively. The samples were then loaded into quartz glass tubes and outgassed under dynamic vacuum (10−2 kPa) at 100 °C for 6 h.2.10 Fluorescence spectroscopy
The photoluminescence emission spectra were performed on an Edinburgh Instrument FLS 980 fluorescence spectrometer.3. Results and discussion
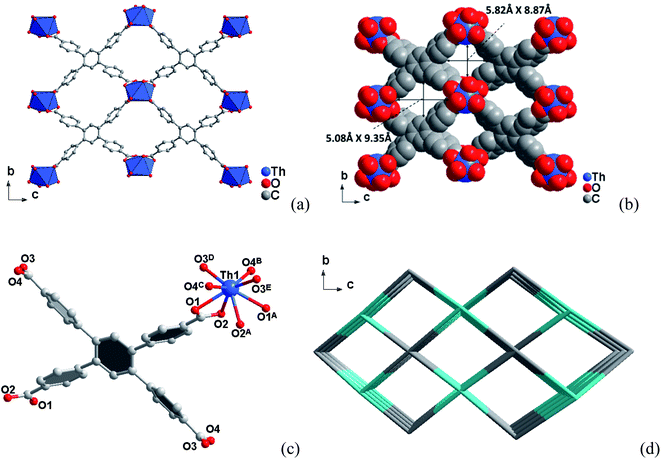
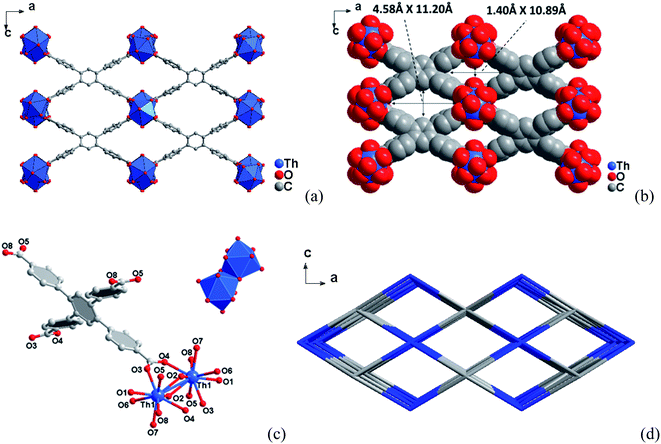
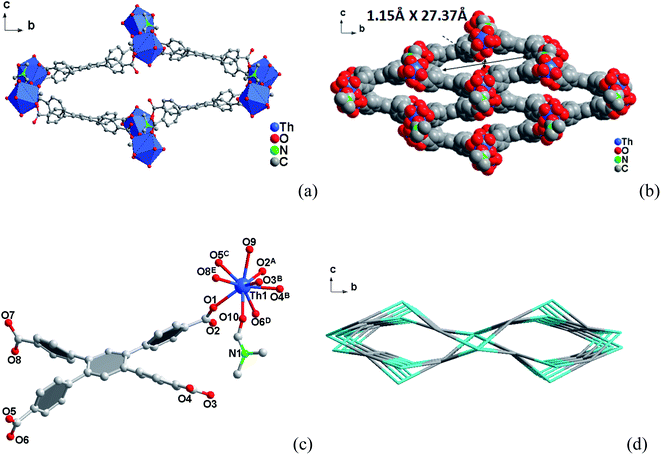
3.1 Crystal structures
3.2 Specific surface area and porosity
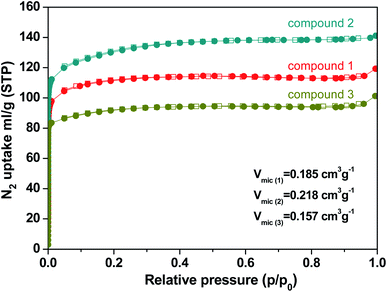
N2 sorption measurements were performed to evaluate the porous nature of the three kinds of compounds. The N2 sorption measurements were investigated by the reversible N2 adsorption and desorption isotherm at 77 K which were shown in typical type-I adsorption isotherms. Compound 1, 2, and 3 exhibit a specific BET surface area of 342 m2 g−1, 408 m2 g−1, and 283 m2 g−1, respectively (Fig. S3†). The data is smaller than those of Th-NU-905, Th-NU-1008 and Th-NU-1011 synthesized by the same tetradentate ligand, which are approximately 700–800 m2 g−1.11,21 The micropore volume of compound 1, 2, and 3 were 0.185 cm3 g−1, 0.218 cm3 g−1, and 0.157 cm3 g−1, respectively (Fig. 4). The micropore volume order of the three compounds is consistent with the space occupied by solvent and water molecules in the crystal obtained by thermogravimetric calculation. Moreover, the pore size distribution of compound 1, 2, and 3 was 5–12 Å, 5–15 Å, and 7–26 Å, respectively (Fig. S4†).3.3 Thermal properties
TGA diagram of compound 1, 2, 3 in nitrogen atmosphere is shown in Fig. S5.† Each compound loses water molecules, solvent molecules, and coordination water in the pores before 350 °C. Compound 1 weightlessness 24.59%; compound 2 weightlessness 37.92%; compound 3 weightlessness 17.08%. The structural collapse temperatures of compound 1, 2, and 3 were 573.66 °C, 532.48 °C, and 582.29 °C, respectively. TGA results show that the prepared MOFs structure can maintain high temperature, which is comparable with the most thermally stable thorium(IV)-based MOFs.313.4 Irradiation stability
Compound 1, 2, and 3 had good γ irradiation stability (Fig. S6†). After a total dose of 20–100 kGy γ irradiation for 7 hours, the PXRD patterns of each crystal after irradiation showed that its frame structure still existed and did not collapse within the radiation intensity determined by the experiment. All these materials had radiation resistance comparable to that of SCU-14,32 a uranium-based MOF which was irradiated continuously at a cumulative dose of 120 kGy with little change in photoelectric response.3.5 Luminescence properties
Under visible light, compound 1 and compound 3 are colorless, while compound 2 is pale yellow. All three crystals emit bluish light when exposed to ultraviolet light at 365 nm (Fig. 5). When the excitation is at 360 nm, the emission spectra of compound 1 (Fig. S8a†) and compound 3 (Fig. S8c†) shows broad emission bands with a maximum at 420 nm. However, the emission spectrum of compound 2 consists of a broad band with a maximum at 392 nm (λex = 350 nm, Fig. S8b†). The luminescence spectra of all the three thorium-based MOFs are similar to the ligand H4TCPB.27 This is the same with Zr-CAU-24, which indicates that the luminescence is mostly attributed to the emission of the organic linker. Some differences still exist. The intensity of the emission spectra of compound 1 and compound 3 increased and redshifted slightly, while compound 2 has a slightly blue shifted emission spectrum with reduced intensity. Compound 2 is the central unit of a dinuclear cluster, which is distinct from the mononuclear unit of compound 1 and compound 3. The variation of thorium coordination environment may be the cause of the above differences. Although thorium is a non-luminescence metal center, different nuclear clusters change the bond length and bond angle of Th–O–C, and then affect the electron density of the bonded benzene rings in the ligand, resulting in a slight change in the excitation spectrum.4. Conclusion
In summary, three new thorium-based MOFs were synthesized in H4TCPB, DMF, and trifluoroacetic acid reactive systems. Compound 1 and compound 3 are the mononuclear MOFs of the monoclinal system, while compound 2 is the binuclear cluster MOF of the orthorhombic system. The thermal stability of the synthetic thorium-based MOFs is higher than 500 °C and exhibits good γ irradiation stability. N2 sorption experiments reveal the specific BET surface area of 342 m2 g−1, 408 m2 g−1, 283 m2 g−1 and the micropore volume of 0.185 cm3 g−1, 0.218 cm3 g−1, 0.157 cm3 g−1 for compound 1, 2, and 3, respectively. All the complexes emit blue ligand-based luminescence, while the emission spectrum of compound 2 is slightly blue-shifted and reduced in intensity compared with the others.Conflicts of interest
There are no conflicts to declare.Acknowledgements
Supported by Spent nuclear fuel reprocessing special project: computer simulation and software development of reductive stripping of Plutonium(1B, 2B) in PUREX(BG17000303). The authors thank the “Young Potential Program of Shanghai Institute of Applied Physics, Chinese Academy of Sciences” (Y955031031) for the equipment applied in this work.References
- U. Mueller, M. Schubert, F. Teich, P. K. Schierle-Arndt, J. Pastre and J. Mater, Chem, 2006, 16(7), 626–636 CAS.
- J. Li, X. X. Wang, G. X. Zhao, C. L. Chen, Z. F. Chai, A. Alsaedi, T. Hayatf and X. K. Wang, Chem. Soc. Rev., 2018, 47, 2322–2356 RSC.
- E. A. Dolgopolova, A. M Rice and N. B. Shustova, Chem. Commun., 2018, 54, 6472 RSC.
- S. L. Hanna, X. Zhang, K. I. Otake, R. J. Drout, P. Li, T. Islamoglu and O. K. Farha, Cryst. Growth Des., 2019, 19(1), 506–512 CrossRef CAS.
- P. M. Cantos and C. L. Cahill, Cryst. Growth Des., 2014, 14, 3044–3053 CrossRef CAS.
- Z. H. Zhang, G. A. Senchyk, Y. Liu, T. Spano-Franco, J. E. S. Szymanowski and P. C. Burns, Inorg. Chem., 2017, 56, 13249–13256 CrossRef CAS PubMed.
- P. Thuéry, E. Rivière and J. Harrowfield, Inorg. Chem., 2015, 54, 2838–2850 CrossRef.
- M. B. Andrews and C. L. Cahill, Angew. Chem., Int. Ed., 2012, 51, 6631–6634 CrossRef CAS PubMed.
- L. Shao, F. W. Zhai, Y. L. Wang, G. Z. Yue, Y. R. Li, M. F. Chu and S. Wang, Dalton Trans., 2019, 48, 1595–1598 RSC.
- C. Ekberg, Y. Albinsson, M. J. Comarmond and P. L. Brown, J. Solution Chem., 2000, 29, 63–86 CrossRef CAS.
- P. Li, X. J. Wang, K. Otake, J. F. Lyu, S. L. Hanna, T. Islamoglu and O. K. Farha, ACS Appl. Nano Mater., 2019, 2(4), 2260–2265 CrossRef CAS.
- J. Y. Kim, A. J. Norquist and D. O'Hare, J. Am. Chem. Soc., 2003, 125(42), 12688–12689 CrossRef CAS PubMed.
- K. M. Ok, J. Sung, G. Hu, R. M. Jacobs and D. O'Hare, J. Am. Chem. Soc., 2008, 130(12), 3762–3763 CrossRef CAS PubMed.
- K. M. Ok and D. O'Hare, Dalton Trans., 2008,(No. 41), 5560–5562 RSC.
- N. P. Martin, C. Volkringer, C. M. Falaise, N. Henry and T. Loiseau, Cryst. Growth Des., 2016, 16(3), 1667–1678 CrossRef CAS.
- Y. Wang, W. Liu, Z. Bai, T. Zheng, M. A. Silver, Y. Li, Y. Wang, X. Wang, J. Diwu, Z. Chai and S. Wang, Angew. Chem., 2018, 130(20), 5885–5889 CrossRef.
- Y. Li, Z. Yang, Y. Wang, Z. Bai, T. Zheng, X. Dai, S. Liu, D. Gui, W. Liu, M. Chen, L. Chen, J. Diwu, L. Zhu, R. Zhou, Z. Chai, T. E. Albrecht-Schmitt and S. Wang, Nat. Commun., 2017, 8(1), 1354 CrossRef PubMed.
- G. Sargazi, D. Afzali and A. Mostafavi, Ultrason. Sonochem., 2018, 41, 234–251 CrossRef CAS PubMed.
- J. Andreo, E. Priola, G. Alberto, P. Benzi, D. Marabello, D. M. Proserpio, C. Lamberti and E. Diana, J. Am. Chem. Soc., 2018, 140(43), 14144–14149 CrossRef CAS PubMed.
- C. M. Falaise, J. S. B. Charles, C. Volkringer and T. Loiseau, Inorg. Chem., 2015, 54(5), 2235–2242 CrossRef CAS PubMed.
- P. Li, S. Goswami, K. Otake, X. J. Wang, Z. J. Chen, S. L. Hanna and O. K. Farha, Inorg. Chem., 2019, 58, 3586–3590 CrossRef CAS PubMed.
- T. Islamoglu, D. Ray, P. Li, M. B. Majewski, I. Akpinar, X. Zhang, C. J. Cramer, L. Gagliardi and O. K. Farha, Inorg. Chem., 2018, 57(21), 13246–13251 CrossRef CAS PubMed.
- Z. J. Li, Y. Ju, B. W. Yu, X. L. Wu, H. J. Lu, Y. X. Li, J. Zhou, X. F. Guo, Z. H. Zhang, J. Lin, J. Q. Wang and S. Wang, Chem. Commun., 2020, 56, 6715–6718 RSC.
- Z. J. Li, Z. H. Yue, Y. Ju, X. L. Wu, Y. M. Ren, S. F. Wang, Y. X. Li, Z. H. Zhang, X. F. Guo, J. Lin and J. Q. Wang, Inorg. Chem., 2020, 59, 4435–4442 CrossRef CAS.
- G. E. Gomez, J. A. Ridenour, N. M. Byrne, A. P. Shevchenko and C. L. Cahill, Inorg. Chem., 2019, 58(11), 7243–7254 CrossRef CAS.
- S. Saumitra and B. Udo, RSC Adv., 2015, 5, 26735–26748 RSC.
- M. Lammert, H. Reinsch, C. A. Murray, M. T. Wharmby, H. Terraschkea and N. Stock, Dalton Trans., 2016, 45, 18822–18826 RSC.
- O. V. Dolomanov, L. J. Bourhis, R. J. Gildea, J. A. K. Howard and H. Puschmann, J. Appl. Crystallogr., 2009, 42, 339–341 CrossRef CAS.
- G. M. Sheldrick, Acta Crystallogr., Sect. A: Found. Adv., 2015, A71, 3–8 CrossRef PubMed.
- G. M. Sheldrick, Acta Crystallogr., Sect. C: Struct. Chem., 2015, C71, 3–8 Search PubMed.
- K. P. Carter, J. A. Ridenour, M. Kalaj and C. L. Cahill, Chem.–Eur. J., 2019, 25, 7114–7118 CrossRef CAS.
- L. W. Cheng, C. Y. Liang, W. Liu, Y. X. Wang, B. Chen, H. L. Zhang, Y. L. Wang, Z. F. Chai and S. Wang, J. Am. Chem. Soc., 2020, 142(38), 16218–16222 CrossRef CAS PubMed.
Footnotes |
| † Electronic supplementary information (ESI) available: PXRD patterns, SEM photographs, BET and pore-size distribution, TGA curves, IR spectra, emission and excitation spectra (PDF) and CIF files. CCDC 2067961–2067963. For ESI and crystallographic data in CIF or other electronic format see DOI: 10.1039/d1ra01742j |
| ‡ Ungraduated students of Chinese Academy of Sciences. |
| This journal is © The Royal Society of Chemistry 2021 |


