Unprecedented capacitive deionization performance of interconnected iron–nitrogen-doped carbon tubes in oxygenated saline water†
Xingtao
Xu‡
 ab,
Jing
Tang‡
 *cd,
Yusuf Valentino
Kaneti
 bd,
Haibo
Tan
b,
Tao
Chen
e,
Likun
Pan
 *f,
Tao
Yang
*a,
Yoshio
Bando
bgh and
Yusuke
Yamauchi
 *di
*di
aState Key Laboratory of Hydrology-Water Resources and Hydraulic Engineering, College of Hydrology and Water Resource, Hohai University, Nanjing 210098, China. E-mail: tao.yang@hhu.edu.cn
bInternational Center for Materials Nanoarchitectonics (WPI-MANA), National Institute for Materials Science (NIMS), 1-1 Namiki, Tsukuba, Ibaraki 305-0044, Japan
cSchool of Chemistry and Molecular Engineering, Shanghai Key Laboratory of Green Chemistry and Chemical Processes, East China Normal University, Shanghai, 200062, China
dSchool of Chemical Engineering and Australian Institute for Bioengineering and Nanotechnology (AIBN), The University of Queensland, Brisbane, QLD 4072, Australia. E-mail: jing.tang1@uq.edu.au; y.yamauchi@uq.edu.au
eBeijing Synchrotron Radiation Facility (BSRF), Institute of High Energy Physics, Chinese Academy of Sciences, Beijing 100049, China
fShanghai Key Laboratory of Magnetic Resonance, School of Physics and Materials Science, East China Normal University, 3663 N. Zhongshan Rd, Shanghai 200-062, China. E-mail: lkpan@phy.ecnu.edu.cn
gInstitute of Molecular Plus, Tianjin University, No. 11 Building, No. 92 Weijin Road, Nankai District, Tianjin, 300072, P. R. China
hAustralian Institute for Innovative Materials, University of Wollongong, Squires Way, North Wollongong, NSW 2500, Australia
iDepartment of Plant and Environmental New Resources, Kyung Hee University, 1732 Deogyeong-daero, Giheung-gu, Yongin-si, Gyeonggi-do 446-701, South Korea
First published on 30th January 2020
Abstract
The exploration of new carbon materials to overcome the rapid performance decay of common carbon materials in oxygenated saline water (i.e., natural saline water) is the biggest challenge for the industrial application of the capacitive deionization (CDI) technology. In this work, we first report the layer-by-layer motif synthesis of 3D interconnected metal–organic framework (MOF) tubes and the derived nitrogen–iron-doped carbon tubes (3D-FeNC tubes) by using continuous polymeric fibers as templates. The elaborately designed 3D-FeNC tubes exhibit multiple advantages, including fast ionic diffusion (originating from the 1D hollow structure of the tubes), efficient electronic pathways and abundant active sites (arising from the 3D interconnected carbon frameworks), which are beneficial for enhancing the oxygen reduction ability. As a consequence, the as-prepared 3D-FeNC tubes exhibit an unprecedented CDI performance in oxygenated saline water with an exceptional salt adsorption capacity of 40.70 mg g−1 and ultrahigh capacity retention of 93.82% even after 200 cycles, highlighting the significance of morphological control and the benefits of hollow structured materials.
New conceptsOne of the biggest challenges limiting the industrial application of capacitive deionization (CDI) is the serious performance decay of common carbon materials in oxygenated saline water (i.e., natural saline water), which is caused by H2O2 formation due to the reduction of dissolved oxygen at the interface of carbon electrodes. In this article, we pioneer the use of three-dimensional interconnected nitrogen–iron-doped carbon tubes (3D-FeNC tubes) to overcome this problem. The large-scale production of 3D-FeNC tubes can be realized through a layer-by-layer motif synthesis using continuous polymeric fibers as the template to create hollow structures. The elaborately-designed nanoarchitecture features multiple advantages: 1D hollow tubes for fast ion diffusion, 3D interconnected carbon frameworks providing efficient electronic pathway and porous network, and abundant FeNx active sites for improved oxygen reduction ability. As a consequence, the 3D-FeNC tubes exhibit an unprecedented CDI performance in oxygenated saline water with exceptional desalination capacity and excellent cycling stability over 200 cycles. This strategy does not only highlight the significance of morphology-controlled synthesis and the importance of hollow structured materials, but also accelerate the development of industrial-scale CDI. |
Introduction
In recent years, the supply of affordable freshwater for the ever-growing population has become a significant problem worldwide. Water desalination which can provide significantly more water beyond the hydrological cycle is considered as a promising solution to freshwater shortage.1–3 In this regard, capacitive deionization (CDI) that operates by storing ions through the formation of electrical double layers in porous materials has emerged as an attractive option with many advantages (e.g., energy saving, low cost, and environmental friendliness) compared to reverse osmosis and electrodialysis.4–6 Generally, carbon is the most widely-used electrode material for CDI owing to its abundance and outstanding capacitive deionization properties.7 In the last two decades, significant progress achieved in the fabrication of carbon materials has given rise to the upsurge of CDI in laboratory-scale applications.8 However, at present, the industrial application of CDI is still in its infancy and remains challenging. This is due to the serious performance decay of conventional carbon materials in oxygenated saline water (i.e., natural saline water). Previously, the formation of H2O2 due to the reduction of dissolved oxygen (DO) in saline water was demonstrated to be a major contributor to the rapid degradation in CDI performance of carbon materials.9 The development of a new family of active materials beyond porous carbons is one possible solution to this problem, with some representative examples being AgCl,10 BiOCl,11 NaTi2(PO4)3,12 Prussian blue,13 metal–organic frameworks (MOFs),14etc. Alternatively, the inhibition of H2O2 formation by promoting oxygen reduction reaction (ORR) at the electrode surface via a four-electron pathway is also an effective solution;15 however, this strategy has been largely limited by the poor ORR activity of most carbon materials.16 Therefore, there is a significant interest to develop new carbon materials with high ORR activity in order to promote high CDI performance in oxygenated saline water.In recent years, the exploration of MOFs as convenient and universal precursors for fabricating various kinds of heteroatom- and metal-doped carbon composites has been of great interest.17–19 Zeolitic imidazolate frameworks (ZIFs) are one of the most popular members of the MOF family for preparing highly porous carbons due to the special structure of the tetrahedra-coordinated transition metal ions with imidazolate linkers in ZIFs.20 For example, bimetallic Zn–Co-ZIFs were transferred into Co–N–C catalysts which displayed high electrocatalytic activities for ORR,21 and core–shell structured ZIFs were converted to selectively functionalized core–shell carbons as electrode materials for high-performance supercapacitors.22 However, conventional MOF crystals are mostly dissociative and solid particles,23 which can lead to poor electrical conductivity (mainly due to the lack of interconnectivity between particles) and low accessible surface areas of the derived carbon-based composites. At present, there is a lack of in-depth studies focusing on the morphological control of MOF-derived carbons.
Shape-controlled synthesis has been proven to be an effective way to tune the properties and functional performances of nanomaterials for practical applications. One-dimensional (1D) hollow carbon tubes possess large accessible surface areas, abundant and highly accessible active sites, high surface-to-volume ratios, and good electrical properties.24 Furthermore, it is of great interest to integrate the 1D hollow carbon tubes into highly-organized three-dimensional (3D) architectures to enhance the interconnectivity among the tubes. At the microscopic level, 1D hollow carbon tubes can provide rich active sites and accessible pathways for the reactants. On the macroscopic level, the highly interconnected 3D architectures can create continuous electrically-conductive networks25 and prevent individual tubes from undergoing agglomeration. Although many 1D hollow tubes (e.g., carbon, metal oxides tubes, metal sulfide tubes) have been produced by using 1D metal oxide (e.g. Al2O3, ZnO, MnO2 and MoO3, CuO2) rods/fibers as templates,26 mostly through hydrothermal processes, the synthesis of 1D hollow MOF tubes and their derivatives is still rarely reported and worthy of investigation.
In this paper, we report the preparation of hollow MOF tubular networks by using a fibrous polymeric template. Such continuous polymeric fibers can be easily prepared on a large scale by an electrospinning method,27 and metal ions can be in situ impregnated into polymeric fibers as seeds for MOF nucleation. After the growth of MOF crystals, the polymeric template can be dissolved completely with the use of an organic solvent (e.g., N,N-dimethylformamide, DMF),28 leading to the formation of hollow MOF tubes. The layer-by-layer (LBL) deposition has been considered as an efficient strategy for obtaining dense films with controllable thickness.29 As such, this method may offer a promising route for controlling the thickness of the MOF shell deposited on the polymeric template.
Among various heteroatom-doped carbons, porous Fe, N-doped carbons are known for their high electrocatalytic activity for ORR which is close to those of noble metal electrocatalysts.30 In this work, Fe–Zn-containing ZIF (abbreviated as ZIF′) particles are coated on the polymeric fibers to prepare hollow ZIF′ tubes. Owing to the well-interconnected nature of the polymeric template, the resulting hollow ZIF′ tubes exhibit a 3D interconnected network (3D-ZIF′). After direct carbonization under an inert atmosphere, 3D-ZIF′-derived hollow tubular iron–nitrogen-doped carbon (abbreviated as 3D-FeNC) was prepared. Owing to the abundant and highly exposed active sites, larger accessible specific surface area (SSA), shortened diffusion pathway (arising from the 1D hollow tube structure), and continuous electrical pathway (originating from the 3D continuous networks), the as-prepared 3D-FeNC shows both excellent ORR activity and superior salt removal ability. These features lead to the unprecedented CDI performance of 3D-FeNC in oxygenated saline water.
Results and discussion
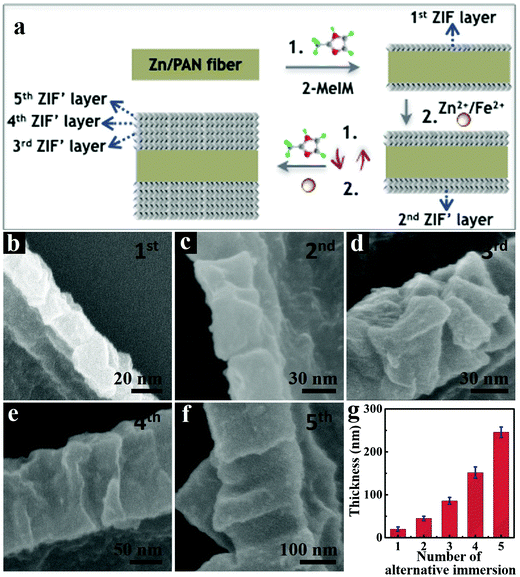
The synthetic processes of hollow tubular 3D-ZIF′ and the corresponding 3D-FeNC networks are schematically shown in Fig. 1a, and the experimental details are given in the ESI.† First, Zn-containing polyacrylonitrile (PAN) fibers, denoted as Zn/PAN fibers, were pre-synthesized by a simple electrospinning method31 using a transparent ZnAc2/PAN-containing DMF solution (Fig. S1, ESI†). These Zn/PAN fibers were subsequently used as self-templates to grow MOF layers (Fig. S2a, ESI†). The Zn/PAN fibers were alternately immersed in methanolic solutions of 2-methylimidazole (2-MeIM) (Fig. S2b, ESI†) and Zn2+/Fe2+ (Fig. S2c, the representative molar ratio of Fe2+/Zn2+ was 5%, ESI†) to induce the growth of ZIF′ crystals around the fibers. After several repeated alternate immersion, a uniform and compact ZIF′ shell was formed through the LBL growth method to produce 3D continuous PAN@ZIF′ fibers. Notably, the ZIF′ nanocrystals are hardly observed in the gaps between the fibers, because of the plentiful Zn2+ ions and rich nitrogen-containing functional groups within the Zn/PAN fibers that would help to attract 2-MeIM for ensuring the growth of ZIF′ nanocrystals. In addition, the PAN@ZIF′ fibers were washed by flowing methanol solution after synthesis. The isolated ZIF′ nanocrystals would be washed thoroughly due to the weak interaction between isolated ZIF′ crystals and PAN@ZIF' fibers. After being dispersed in DMF to completely dissolve the Zn/PAN core, hollow tubular 3D-ZIF′ networks were finally obtained and subsequently converted into 3D-FeNC through carbonization and acid etching.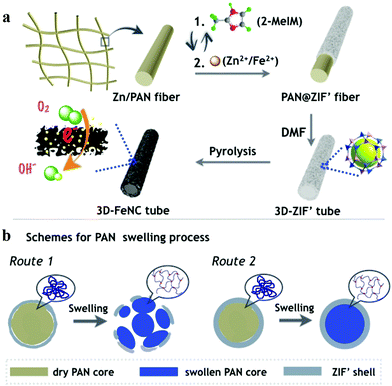 | ||
| Fig. 1 (a) Schematic illustrations showing the syntheses of 3D-ZIF′ and 3D-FeNC. (b) Cross-sectional illustration depicting the dissolution of the Zn/PAN core in a hot DMF solvent. | ||
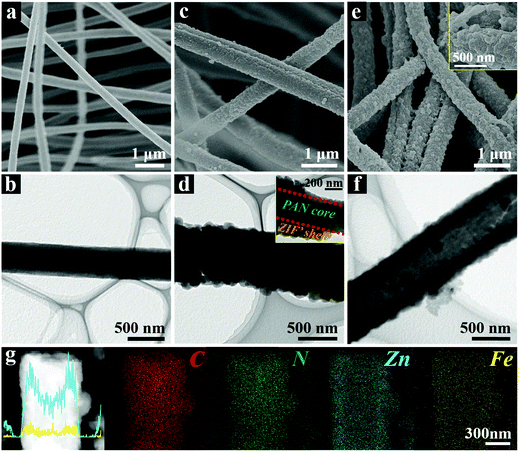
The morphological evolutions of the samples in each synthetic stage were carefully characterized. As shown in the field-emission scanning electron microscope (FESEM) images (Fig. 2a and Fig. S3a, ESI†), the as-prepared Zn/PAN fibers with diameters between 350–550 nm interconnect with each other to form a continuous 3D network. The field emission transmission electron microscope (TEM, Fig. 2b) image of a single Zn/PAN fiber shows that it has a diameter of ∼500 nm. As revealed by the high-angle annular dark field-scanning transmission electron microscopy (HAADF-STEM) and energy dispersive X-ray spectroscopy (EDX) elemental mapping images (Fig. S3b, ESI†), the Zn element is uniformly dispersed within the Zn/PAN fibers and serves as seeds for ZIF nucleation. Following the growth of ZIF′ nanocrystals via a LBL method, uniform and compact ZIF′ shells are successfully grown around the fibers (Fig. 2c and d). Correspondingly, the diameters of the PAN@ZIF′ fibers are increased to 500–700 nm (Fig. S4a, ESI†). The TEM image of a single PAN@ZIF′ fiber clearly shows its core–shell structure (inset of Fig. 2d). The powder X-ray diffraction (XRD) pattern (Fig. S4b, ESI†) of PAN@ZIF′ displays typical diffraction peaks belonging to the ZIF-8 crystal.32 In this stage, the number of ZIF′ layers coated on Zn/PAN is critical for obtaining intact hollow ZIF′ tubes and the details will be discussed in later sections.
After being dispersed in the DMF solvent, the Zn/PAN cores within the PAN@ZIF′ fibers are removed, thereby creating hollow 3D-ZIF′ tubes with a wall thickness of ∼150 nm (Fig. 2e and f). As shown in the inset of Fig. S5a (ESI†), the average diameter of the 3D-ZIF′ tubes is slightly increased compared with that of the PAN@ZIF′ fibers (Fig. S4a, ESI†), possibly due to the swelling of the Zn/PAN cores and the resulting expansion of the ZIF′ shells during the dissolution process. The XRD pattern of the 3D-ZIF′ tubes matches well with that of the traditional ZIF crystal (Fig. S5b, ESI†). From Fig. 2g, it can be observed that Fe and Zn elements are distributed uniformly within the 3D-ZIF′ tube (the precise content of Fe in 3D-ZIF′ is 0.57 wt% as estimated by inductively coupled plasma-optical emission spectrometry (ICP-OES)).
In the proposed strategy, the use of Zn-containing PAN fibers and the LBL growth method are crucial for obtaining intact 3D-ZIF′ hollow tubes. When the PAN@ZIF′ fibers were immersed in a hot DMF solvent, the Zn/PAN cores could absorb the solvents and swell before being dissolved.33 As schematically illustrated in Fig. 1b, if the ‘anti-pressure ability’ (defined as the ability to keep intact while suffering the pressure from a swollen polymer core) of the ZIF′ shells cannot overcome the pressure arising from the swollen Zn/PAN cores, the ZIF′ shells are easily destroyed (Route 1). Therefore, uniform, compact and thick ZIF′shells with excellent ‘anti-pressure ability’ are necessary (Route 2). The uniformly distributed Zn ions in the Zn/PAN fibers can serve as seeds to provide numerous coordination sites for the nucleation and growth of uniform ZIF′ shells. Conversely, without the assistance of pre-added Zn ions in the Zn/PAN fibers, incomplete and non-homogeneous ZIF′ shells were obtained, leading to cracked ZIF′ tubes after the removal of the fibrous template (Fig. S6, ESI†).
The successive LBL growth by alternately immersing Zn/PAN fibers in methanolic solutions of 2-MeIM and Zn2+/Fe2+ is also critical for preparing intact 3D-ZIF′ tubes. On one hand, the small ZIF′ crystals gradually grow and stack to form compact ZIF′ layers (Fig. 3a). When the Zn/PAN fibers were directly immersed in a mixed methanolic solution of Zn2+/Fe2+ and 2-MeIM, large ZIF′ crystals were coated on the Zn/PAN fibers and formed ZIF′layers with obvious interparticle spaces (Fig. S7, ESI†), ultimately leading to broken ZIF′ tubes after removal of the Zn/PAN cores (Fig. S8, ESI†). Furthermore, the thickness of the ZIF′ shell can be easily controlled by the LBL growth method. As shown in Fig. 3b–g, the thickness of the ZIF′ layer increases with the increased number of alternate immersion time. When the number was less than four, non-continuous ZIF′ tubes were obtained (Fig. S9, ESI†), while thick ZIF′ shells were formed when the number of alternate immersion times exceeded four (Fig. 3f). In this work, an optimum number of alternate immersion of four was selected to prepare intact hollow ZIF′ tubes, following the complete removal of the Zn/PAN template.
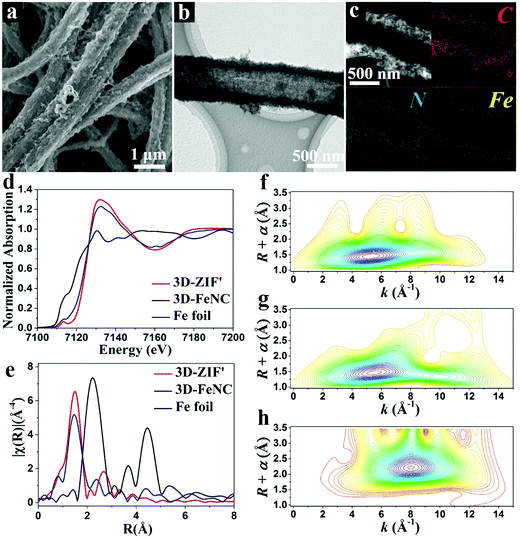
The corresponding 3D-FeNC tubes are obtained by the carbonization of 3D-ZIF′ tubes followed by acid etching and a secondary heat-treatment process. The FESEM images of 3D-FeNC tubes clearly reveal a continuous network (Fig. 4a and Fig. S10, ESI†) and good retainment of the original morphology of the 3D-ZIF′ precursor, possibly due to good mechanical strength derived from the uniform and compact tube walls, and abundant zinc species preventing the aggregation of the doped iron species. The TEM image shown in Fig. 4b confirms the hollow nature of the 3D-FeNC tube. The EDX elemental mapping images show the uniform distribution of C, N and Fe elements in 3D-FeNC (Fig. 4c). Small Fe-based nanoparticles and some atomically dispersed Fe are confirmed from the HAADF-STEM image in Fig. S11 (ESI†). For detecting the structure of Fe species at an atomic level, X-ray absorption near edge structure (XANES) spectra were recorded for 3D-FeNC, using the 3D-ZIF′precursor for comparison and Fe foil as a reference. The Fe K-edge XANES curve is shown in Fig. 4d. The XANES curves of the 3D-ZIF′ precursor and 3D-FeNC display higher near-edge absorption energies than Fe foil, indicating the positive charge of Fe atoms in the 3D-ZIF′ precursor and 3D-FeNC. The oxidation state of Fe in the 3D-ZIF′ precursor is close to 3+, similar to a previously reported Fe2O3 reference.34 After carbonization, the XANES curve of 3D-FeNC shifts slightly toward lower energy, suggesting a slight reduction in the oxidation state of Fe. 3D-FeNC shows a higher peak in the Fe pre-edge region (∼7113 eV) than 3D-ZIF′, which may be ascribed to the decreased local structure symmetry, probably due to the lower saturated coordination atoms around Fe in 3D-FeNC.35 As shown in Fig. 4e, the Fe K-edge Fourier transform extended X-ray absorption fine structure (FT-EXAFS) spectra of 3D-ZIF′ and 3D-FeNC without phase correction reveal different oscillation curves compared to that of the reference Fe foil. The EXAFS spectra of 3D-ZIF′and 3D-FeNC exhibit the main peak at around 1.5 Å which can be indexed to the scattering paths of Fe–N.36 A small Fe–Fe peak at around 2.2 Å is observed in 3D-FeNC, which is close to the peak of Fe foil, implying the existence of metallic Fe. Fe K-edge wavelet transformed EXAFS (WT-EXAFS) was conducted to show the dispersion of atomic iron because WT-EXAFS has high resolutions in both k and R spaces (Fig. 4f–h). The intensity maximum at 8 Å−1 in the WT contour plot of Fe foil is associated with Fe–Fe contribution. In comparison, the 3D-ZIF′ precursor displays only one intensity maximum at 5 Å−1 which can be assigned to the Fe–N bond.37 However, 3D-FeNC displays one intensity maximum higher than 5 Å−1. Therefore, based on the Fe K-edge FT-EXAFS (Fig. 4e) and Fe K-edge WT-EXAFS measurements, 3D-FeNC is composed of atomically dispersed Fe atoms and metallic Fe–Fe. The Fe K-edge EXAFS fitting was performed, as shown in Fig. S12 (ESI†). The results show that the coordination number of Fe in the 3D-ZIF′ precursor is well-fitted with approximately four N atoms and the Fe atoms in 3D-FeNC have a reduced coordination number of approximately three N atoms (Table S1, ESI†), which is in good agreement with the XANES results (Fig. 4d).
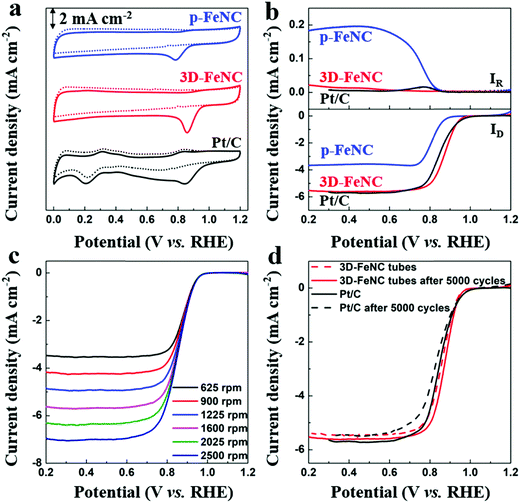
It is well known that Fe–N-co-doped carbon materials usually possess high ORR activity,38 which may endow them with superior CDI performance in oxygenated saline water. To highlight the structural advantages of 3D-FeNC for ORR, ZIF′ nanoparticle derived p-FeNC materials (Fig. S13a, ESI†) and commercial Pt/C (20 wt%, Fig. S13b, ESI†) were also tested for comparison. The cyclic voltammetry (CV) curves in Fig. 5a show that all catalysts have clear oxygen reduction peaks in an O2-saturated 0.1 M KOH solution, implying that all catalysts have activity for the ORR. Furthermore, 3D-FeNC shows a more positive oxygen reduction peak than p-FeNC, which is close to Pt/C (Fig. 5a). The linear sweep voltammetry (LSV) curves of the samples display a similar trend with the CV curves (Fig. 5b). Compared to p-FeNC, the 3D-FeNC catalyst exhibits a superior ORR activity in terms of half-wave potential, onset potential, and diffusion-limiting current density (Table S2, ESI†). Additionally, the ORR activity of the 3D-FeNC catalyst is influenced by the mass loading (Fig. S14, ESI†), with the optimized mass loading being 0.2 mg cm−2. The ORR kinetics of the 3D-FeNC catalyst were estimated from the LSV curves (Fig. 5c and Fig. S15, ESI†), revealing that the ORR process in 3D-FeNC tubes proceeds via an efficient four-electron pathway. After the accelerated degradation test, the half-wave potential of the 3D-FeNC catalyst decreased by 14.5 mV (Fig. 5d), which is slightly lower than that of the commercial Pt/C catalyst (16.2 mV). More importantly, the TEM image of 3D-FeNC tubes after the accelerated degradation test shows that the as-prepared 3D-FeNC tubes exhibit a good structural stability (Fig. S16, ESI†). The superior ORR performance of our 3D-FeNC catalyst may be ascribed to the following reasons. Each 1D hollow tube in the 3D-FeNC material is favorable for increasing exposure and accessibility to the Fe-based active sites, leading to improved electronic–ionic diffusion kinetics.39 In addition, the 1D hollow carbon tubes are interconnected together, forming a 3D continuous conductive network and providing enhanced electrical conductivity.40
Aside from the representative 3D-FeNC catalyst (denoted as 3D-FeNC-y (y = 5)), two other 3D-FeNC-y (y = 2.5 and 7.5) with different contents of Fe were also fabricated to investigate the effect of Fe content on the structure and ORR performance. The detailed structural characterizations are provided in Fig. S17–S19 and Table S3 (ESI†). All 3D-FeNC-y (y = 2.5, 5, 7.5) materials were characterized by N2 adsorption–desorption isotherms and XRD measurements. As estimated by N2 adsorption isotherms (Fig. S17a, ESI†), the SSAs of 3D-FeNC-2.5, 3D-FeNC-5, and 3D-FeNC-7.5 are 1239.7, 994.6, and 495.2 m2 g−1, respectively. This trend indicates that the higher the Fe content, the lower the SSA, which can be attributed to the catalytic effect of Fe on the graphitization of carbon materials. During carbonization, the carbon frameworks around Fe can be catalytically graphitized at the sacrifice of micropores. As shown in Fig. S17b (ESI†), none of the observed diffraction peaks in the XRD patterns of 3D-FeNC-2.5 and 3D-FeNC-5 can be indexed to the Fe phase. In contrast, some diffraction peaks observed in the XRD pattern of 3D-FeNC-7.5 can be assigned to Fe3O4 phase (PDF No. 19-0629). These results indicate that a high content of Fe is unfavourable for the formation of atomic-level Fe active sites. The chemical states of nitrogen and iron in 3D-FeNC-y (y = 2.5, 5, 7.5) materials were further investigated by X-ray photoelectron spectroscopy (XPS). The high-resolution N 1s spectra can be deconvoluted into four distinct peaks. The peaks at around 398.7, 399.9, 401.0, and 402.5 eV can be assigned to pyridinic-N, pyrrolic-N, graphitic-N, and pyridinic N+–O−, respectively (Fig. S18a and Table S3, ESI†). The contents of N estimated from N 1s XPS spectra are 12.1, 10.5, and 4.6 at% for 3D-FeNC-2.5, 3D-FeNC-5, and 3D-FeNC-7.5, respectively. The decreasing N content is attributed to the catalytic graphitization of the carbon frameworks with increasing Fe content. As shown in Fig. S18b (ESI†), the high-resolution Fe 2p spectra of 3D-FeNC-5 can be deconvoluted into four major peaks at 711.5 eV for Fe2+ 2p3/2, 714.2 eV for Fe3+ 2p3/2, 723.4 eV for Fe2+ 2p1/2, and 727.4 eV for Fe3+ 2p1/2, as well as a satellite peak at 719.0 eV.41 When the content of Fe is increased, an obvious peak at 707.0 eV assigned to metallic iron/iron carbide42 is observed in 3D-FeNC-7.5. The signal of Fe is not detected in 3D-FeNC-2.5 due to its low Fe content (Table S3, ESI†). As reported previously, pyridinic-N and graphitic-N have been considered as active sites for ORR catalysis.43 In addition, some of the doped nitrogen species in the carbon matrix can further coordinate with Fe atoms to possibly form Fe/Nx moieties, which are quite active for catalyzing the ORR.44 The divalent nature of Fe implies the likely interaction between Fe atoms and N dopants.45 Considering the half-wave potentials and onset potentials, 3D-FeNC-5 shows the highest catalytic activity for ORR among all 3D-FeNC-y samples (Fig. S19, ESI†), which is also competitive relative to previously reported Fe–N-co-doped carbon materials (Table S4, ESI†). The higher content of Fe in the 3D-ZIF′ precursor leads to the easier aggregation of Fe and increased graphitization degree during carbonization, thus resulting in decreased SSA, lower nitrogen content, and less effective Fe-based ORR active sites (Fig. S17 and S18, ESI†).
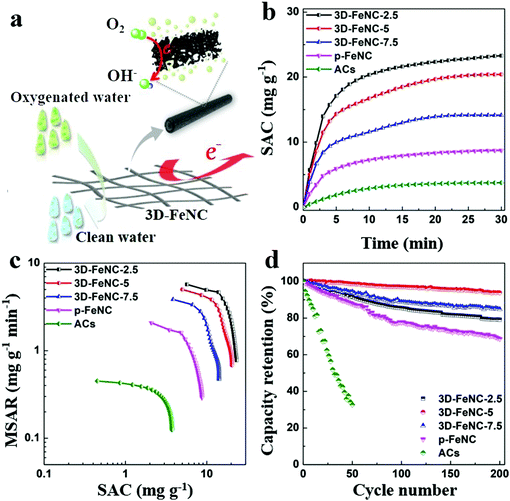
The possible working process of 3D-FeNC tubes in oxygenated saline water is illustrated in Fig. 6a. As shown in this figure, our 3D-FeNC tubes can not only serve as porous media for electrochemical removal of saline ions, but also act as electrocatalytic media to promote the reduction of DO through a four-electron pathway. In such a process, 3D-FeNC tubes should not only possess high ion adsorption capacity for salt removal, but also possess the ability to inhibit H2O2 formation to improve the overall cycling stability. The desalination performance of 3D-FeNC tubes was further evaluated in oxygenated saline water with an initial concentration of 5 mM at 1.2 V. For comparison, commercial activated carbons (ACs) and p-FeNC were also investigated under identical conditions. The recorded conductivity, current, and pH value profiles clearly indicate the full-cycle CDI characteristics of all samples (Fig. S20, ESI†). The derived salt adsorption capacity (SAC) variations shown in Fig. 6b further reveal that the as-prepared 3D-FeNC tubes exhibit greater variations in SAC than both p-FeNC and ACs, highlighting the superior salt removal ability of the 3D-FeNC tubes. Additionally, with the increase of Fe content in the precursor, SAC of the obtained 3D-FeNC decreases accordingly, possibly due to the decreased SSA of the 3D-FeNC tubes (Fig. S17a and Table S3, ESI†). As shown in Fig. 6c, the CDI Ragone plot of 3D-FeNC tubes shifts more toward the upper right region compared to p-FeNC and ACs, suggesting the higher mean salt adsorption rate (MSAR) and SAC of the 3D-FeNC tubes. Fig. 6d displays the long-term cycling performances of all materials over 200 cycles. It is obvious that the as-synthesized 3D-FeNC tubes show superior capacity retentions (79.09–93.82% after 200 cycles) compared to p-FeNC (68.66% after 200 cycles) and ACs (32.68% after 50 cycles). Furthermore, the capacity retention of 3D-FeNC-5 is the highest among all 3D-FeNC tubes, owing to the highest ORR activity of 3D-FeNC-5. Considering the excellent salt removal ability and superior cycling stability in oxygenated saline water, 3D-FeNC-5 exhibits a promising potential as a CDI electrode material in oxygenated saline water.
To further highlight the potential of 3D-FeNC-5 for the desalination of oxygenated saline water, it was tested in saline water with varying concentrations from 5 to 60 mM (Fig. S21 and Table S5, ESI†). It is well known that Langmuir and modified Donnan models are the two common tools to analyze the maximum SAC of carbon materials. In particular, the modified Donnan model that has been well developed by Biesheuvel et al.46 is very useful to fully interpret the double-layer structure inside the electrode. However, considering the complicated nature of electrochemical processes involved in this work, which involve electrosorption and four-electron ORR reaction, we have chosen not to use the modified Donnan model in this study. Instead, we have used the Langmuir model to study the maximum SAC for 3D-FeNC-5, and the value is predicted to be 40.70 mg g−1, which is much higher than those of previously reported carbon materials (Table S6, ESI†). The superior performance of the 3D-FeNC-5 catalyst is ascribed to the enhanced accessible SSA, shortened ion diffusion pathway, continuous electrically conductive network (originated from the interconnected hollow tube structure) and rich nitrogen doping in the carbon matrix (for enhancing ionic adsorption through the coordination effect).
Conclusions
In summary, continuous 3D architectures composed of 1D hollow MOF tubes have been prepared by using a fibrous polymeric template and LBL growth method, which are subsequently employed as precursors for obtaining 3D-FeNC materials. The obtained 3D-FeNC materials have several advantages benefiting from the 1D hollow tube structure, including abundant and highly exposed active sites, large accessible SSA for enhancing electrode/electrolyte contact, and shortened electronic–ionic diffusion pathway. In addition, the 1D hollow tubes interweave into higher-order 3D networks, leading to the formation of a continuous electrically-conductive pathway. Such elaborately-constructed 3D interconnected tubular materials exhibit both excellent ORR activity and superior salt removal ability, thereby leading to their unprecedented CDI performance in oxygenated saline water. These results highlight the benefits of morphology control and hollow structure for enhancing the ORR activity and CDI performance of porous carbon materials.Conflicts of interest
The authors declare no competing financial interests.Acknowledgements
This work was jointly supported by the National Natural Science Foundation of China (51909066), and China Postdoctoral Science Foundation funded project (2019M651682). Dr J. Tang and Professor Y. Yamauchi are the recipients of Discovery Early Career Researcher Award (DE190101410) and Future Fellow (FT150100479), respectively, funded by the Australian Research Council (ARC). This work was performed in part at the Queensland node of the Australian National Fabrication Facility, a company established under the National Collaborative Research Infrastructure Strategy to provide nano and micro-fabrication facilities for Australian researchers. In addition, Dr X. Xu is really thankful for the great moral support and patience that his wife and baby daughter give to him all the time.References
- F. He, P. Biesheuvel, M. Z. Bazant and T. A. Hatton, Water Res., 2018, 132, 282–291 CrossRef CAS PubMed.
- C. Zhang, D. He, J. Ma, W. Tang and T. D. Waite, Water Res., 2018, 128, 314–330 CrossRef CAS PubMed.
- M. E. Suss and V. Presser, Joule, 2018, 2, 10–15 CrossRef.
- T. Wu, G. Wang, S. Wang, F. Zhan, Y. Fu, H. Qiao and J. Qiu, Environ. Sci. Technol. Lett., 2018, 5, 98–102 CrossRef CAS.
- Y. Cho, K. S. Lee, S. Yang, J. Choi, H.-R. Park and D. K. Kim, Energy Environ. Sci., 2017, 10, 1746–1750 RSC.
- L. Wang and S. Lin, Environ. Sci. Technol., 2018, 52, 4051–4060 CrossRef CAS PubMed.
- X. Xu, H. Tan, Z. Wang, C. Wang, L. Pan, Y. V. Kaneti, T. Yang and Y. Yamauchi, Environ. Sci.: Nano, 2019, 6, 981–989 RSC.
- X. Xu, A. Enaiet Allah, C. Wang, H. Tan, A. A. Farghali, M. Hamdy Khedr, V. Malgras, T. Yang and Y. Yamauchi, Chem. Eng. J., 2019, 362, 887–896 CrossRef CAS.
- C. Zhang, D. He, J. Ma, W. Tang and T. D. Waite, Water Res., 2018, 128, 314–330 CrossRef CAS PubMed.
- F. Chen, Y. Huang, L. Guo, M. Ding and H. Y. Yang, Nanoscale, 2017, 9, 10101–10108 RSC.
- F. Chen, Y. Huang, L. Guo, L. Sun, Y. Wang and H. Y. Yang, Energy Environ. Sci., 2017, 10, 2081–2089 RSC.
- Y. Huang, F. Chen, L. Guo and H. Y. Yang, J. Mater. Chem. A, 2017, 5, 18157–18165 RSC.
- Z. Ding, X. Xu, Y. Li, K. Wang, T. Lu and L. Pan, Desalination, 2019, 468, 114078 CrossRef CAS.
- Z. Wang, X. Xu, J. Kim, V. Malgras, R. Mo, C. Li, Y. Lin, H. Tan, J. Tang, L. Pan, Y. Bando, T. Yang and Y. Yamauchi, Mater. Horiz., 2019, 6, 1433–1437 RSC.
- J. Luo, D. Tian, Z. Ding, T. Lu, X. Xu and L. Pan, J. Electroanal. Chem., 2019, 855, 113488 CrossRef CAS.
- P. Srimuk, M. Zeiger, N. Jäckel, A. Tolosa, B. Krüner, S. Fleischmann, I. Grobelsek, M. Aslan, B. Shvartsev, M. E. Suss and V. Presser, Electrochim. Acta, 2017, 224, 314–328 CrossRef CAS.
- B. Liu, H. Shioyama, T. Akita and Q. Xu, J. Am. Chem. Soc., 2008, 130, 5390–5391 CrossRef CAS PubMed.
- C. C. Hou, L. Zou and Q. Xu, Adv. Mater., 2019, 31, 1904689 CrossRef CAS PubMed.
- Q.-L. Zhu, W. Xia, L.-R. Zheng, R. Zou, Z. Liu and Q. Xu, ACS Energy Lett., 2017, 2, 504–511 CrossRef CAS.
- J. Yang, F. Zhang, H. Lu, X. Hong, H. Jiang, Y. Wu and Y. Li, Angew. Chem., Int. Ed., 2015, 54, 10889–10893 CrossRef CAS PubMed.
- Y.-N. Hou, Z. Zhao, Z. Yu, Y. Tang, X. Wang and J. Qiu, Chem. Commun., 2017, 53, 7840–7843 RSC.
- J. Tang, R. R. Salunkhe, J. Liu, N. L. Torad, M. Imura, S. Furukawa and Y. Yamauchi, J. Am. Chem. Soc., 2015, 137, 1572–1580 CrossRef CAS PubMed.
- H. Tang, S. Cai, S. Xie, Z. Wang, Y. Tong, M. Pan and X. Lu, Adv. Sci., 2016, 3, 1500265 CrossRef PubMed.
- W. Liu, R. Yin, X. Xu, L. Zhang, W. Shi and X. Cao, Adv. Sci., 2019, 6, 1802373 CrossRef PubMed.
- H. X. Zhong, J. Wang, Y. W. Zhang, W. L. Xu, W. Xing, D. Xu, Y. F. Zhang and X. B. Zhang, Angew. Chem., Int. Ed., 2014, 53, 14235–14239 CrossRef CAS PubMed.
- T. Kyotani, L.-f. Tsai and A. Tomita, Chem. Mater., 1995, 7, 1427–1428 CrossRef CAS.
- J. Xue, J. Xie, W. Liu and Y. Xia, Acc. Chem. Res., 2017, 50, 1976–1987 CrossRef CAS PubMed.
- Y. M. Chen, X. Y. Yu, Z. Li, U. Paik and X. W. D. Lou, Sci. Adv., 2016, 2, e1600021 CrossRef PubMed.
- C. Wang, M. Osada, Y. Ebina, B.-W. Li, K. Akatsuka, K. Fukuda, W. Sugimoto, R. Ma and T. Sasaki, ACS Nano, 2014, 8, 2658–2666 CrossRef CAS PubMed.
- J. Masa, A. Zhao, W. Xia, M. Muhler and W. Schuhmann, Electrochim. Acta, 2014, 128, 271–278 CrossRef CAS.
- S. Shi, X. Zhuang, B. Cheng and X. Wang, J. Mater. Chem. A, 2013, 1, 13779–13788 RSC.
- Y. Pan, Y. Liu, G. Zeng, L. Zhao and Z. Lai, Chem. Commun., 2011, 47, 2071–2073 RSC.
- M. Sokół, J. Grobelny and E. Turska, Polymer, 1987, 28, 843–846 CrossRef.
- H. Zhang, S. Hwang, M. Wang, Z. Feng, S. Karakalos, L. Luo, Z. Qiao, X. Xie, C. Wang, D. Su, Y. Shao and G. Wu, J. Am. Chem. Soc., 2017, 139, 14143–14149 CrossRef CAS PubMed.
- D. Carta, M. F. Casula, A. Falqui, D. Loche, G. Mountjoy, C. Sangregorio and A. Corrias, J. Phys. Chem. C, 2009, 113, 8606–8615 CrossRef CAS.
- P. Chen, T. Zhou, L. Xing, K. Xu, Y. Tong, H. Xie, L. Zhang, W. Yan, W. Chu, C. Wu and Y. Xie, Angew. Chem., Int. Ed., 2017, 56, 610–614 CrossRef CAS PubMed.
- D. Deng, X. Chen, L. Yu, X. Wu, Q. Liu, Y. Liu, H. Yang, H. Tian, Y. Hu, P. Du, R. Si, J. Wang, X. Cui, H. Li, J. Xiao, T. Xu, J. Deng, F. Yang, P. N. Duchesne, P. Zhang, J. Zhou, L. Sun, J. Li, X. Pan and X. Bao, Sci. Adv., 2015, 1, e1500462 CrossRef PubMed.
- H. Tan, J. Tang, J. Henzie, Y. Li, X. Xu, T. Chen, Z. Wang, J. Wang, Y. Ide, Y. Bando and Y. Yamauchi, ACS Nano, 2018, 12, 5674–5683 CrossRef CAS PubMed.
- H. Tan, J. Tang, J. Henzie, Y. Li, X. Xu, T. Chen, Z. Wang, J. Wang, Y. Ide and Y. Bando, ACS Nano, 2018, 12, 5674–5683 CrossRef CAS PubMed.
- Q. Niu, J. Guo, B. Chen, J. Nie, X. Guo and G. Ma, Carbon, 2017, 114, 250–260 CrossRef CAS.
- Q. Wang, Z.-Y. Zhou, Y.-J. Lai, Y. You, J.-G. Liu, X.-L. Wu, E. Terefe, C. Chen, L. Song, M. Rauf, N. Tian and S.-G. Sun, J. Am. Chem. Soc., 2014, 136, 10882–10885 CrossRef CAS PubMed.
- G. Ren, X. Lu, Y. Li, Y. Zhu, L. Dai and L. Jiang, ACS Appl. Mater. Interfaces, 2016, 8, 4118–4125 CrossRef CAS PubMed.
- M. Vikkisk, I. Kruusenberg, U. Joost, E. Shulga, I. Kink and K. Tammeveski, Appl. Catal., B, 2014, 147, 369–376 CrossRef CAS.
- D. Guo, R. Shibuya, C. Akiba, S. Saji, T. Kondo and J. Nakamura, Science, 2016, 351, 361–365 CrossRef CAS PubMed.
- S. Poulin, R. França, L. Moreau-Bélanger and E. Sacher, J. Phys. Chem. C, 2010, 114, 10711–10718 CrossRef CAS.
- P. Biesheuvel, S. Porada, M. Levi and M. Z. Bazant, J. Solid State Electrochem., 2014, 18, 1365–1376 CrossRef CAS.
Footnotes |
| † Electronic supplementary information (ESI) available. See DOI: 10.1039/c9mh01829h |
| ‡ The authors contributed equally to the study. |
| This journal is © The Royal Society of Chemistry 2020 |

