Ultrasound-assisted synthesis of Pt–Co/C bimetallic alloys for oxygen reduction in PEM fuel cells
Rajesh Kumar
Polagani
a,
Prashant L.
Suryawanshi
a,
Sarang P.
Gumfekar
 b,
Shirish H.
Sonawane
 *a and
Muthupandian
Ashokkumar
 c
c
aDepartment of Chemical Engineering, National Institute of Technology, Warangal-506004, Telangana, India. E-mail: shirish@nitw.ac.in; Tel: +91-870-246-2626
bDepartment of Chemical and Materials Engineering, University of Alberta, AB, Canada
cSchool of Chemistry University of Melbourne, VIC 3010, Australia
First published on 30th April 2018
Abstract
Carbon-supported Pt–Co (Pt–Co/C) nanoparticles of varying composition were synthesized using a sonochemical technique in the presence of PVP as a stabilizing agent. X-ray diffraction (XRD) analysis revealed that all compositions of as-synthesized Pt–Co/C nanoparticles exhibited a face centered cubic (fcc) structure. Transmission electron microscopy (TEM) images showed the narrow size distribution and the uniform dispersion of Pt and Co on the carbon support. The electrochemical properties of Pt–Co/C electrocatalysts were analysed using cyclic voltammetry (CV) and linear sweep voltammetry (LSV). The electrochemical properties of the Pt83–Co17/C composition exhibited the best catalytic activity and the highest stability for the oxygen reduction reaction (ORR) among all compositions synthesized in this study. The ORR performance is reported in terms of the electrochemically active surface area (EASA) and current density. The current density decreased with an increase in Co content and followed the trend of Pt83–Co17/C > Pt75–Co25/C > Pt50–Co50/C. The fabricated PEM fuel cell (PEMFC) presented a power of 0.176 W cm−2 at 0.436 V using the Pt83–Co17/C cathode and the 40% Pt/C anode and followed the same trend as the current density.
1. Introduction
The proton exchange membrane fuel cell (PEMFC) is considered as a clean energy source for sustainable development. However, the commercialization of fuel cells for large scale applications is restricted by the factors such as cost, activity and durability.1 The PEMFC performance is often limited by the slow oxygen reduction reaction (ORR) at the cathode.2 Improvement in cathode catalyst activity towards the ORR is a major challenge to obtain effective performance of low temperature PEMFCs.3 Platinum (Pt) is commonly used as a catalyst at the anode and cathode electrodes due to its outstanding performance as an electrocatalyst. Although pure Pt has higher catalytic activity towards the ORR, its lower stability and higher cost restrict its applications in PEMFCs.4 The cost of catalysts can be reduced by partially replacing the Pt content with other electroactive metals that also enhance the power density and overall catalytic performance.5Several researchers attempted to replace Pt to reduce the overall cost of the fuel cell assembly. The majority of the attempts partially replaced Pt with transition metals (bi- and tri-metallic alloys) supported on carbon with different atomic ratios of Pt and transition metals. Interestingly, the ORR activity of Pt-alloys was higher than that of pure Pt.6 Partial replacement of Pt with transition metals such as Co,7 Ni,8 Fe,9 Ru,10 Cu,11 Pd,12 Sn,13 and Cr14 supported on carbon4–6 is reported to improve electrocatalytic activities towards the ORR. Alloying Pt with transition metals improves the ORR characteristics due to changes in the electronic and adsorption properties of the electrocatalyst.6,15 Such alloying allows the individual functional components to work synergistically to improve the catalytic performance; thus, the approach promises a much more flexible catalyst design. There exists a relationship between alloy composition and ORR performance for carbon-supported Pt-alloys.16 The catalytic performance of bimetallic Pt–Co electrocatalysts is affected by the atomic ratio of Pt and Co and by subsequent changes in electronic properties and surface segregation.17 Among the various Pt-based catalysts, Pt–Co/C bimetallic alloys attracted researchers' attention due to their higher mass activity and better durability as compared to pure Pt.3
Commonly used synthetic strategies for Pt-based bimetallic catalysts are the colloidal chemistry method, impregnation method, and polyol method. Wang et al.2 synthesized Pt–Co/C using ethylene glycol as a stabilizing agent in alkaline solution and reported the effect of catalyst composition on ORR performance in a range of pHs. Gonzalez et al.17 prepared Pt–Co/C of varying composition and particle size at room temperature using sodium borohydride and alloying was carried out at 900 °C. They discussed the effect of electronic and geometric factors on the ORR performance. Hunsom et al.18 reported that the Pt loading and initial pH of the metal precursor solution affect the performance of PEMFCs. Several researchers synthesized Pt–Co/C of various morphologies using a combination of impregnation and seeding methods. Kim et al.19 prepared Pt-based, carbon-supported electrocatalysts by the incipient wetness impregnation method and investigated the effect of surface area and Pt–Pt spacing on catalytic activity in fuel cells. The method of synthesis plays an important role in determining the performance of Pt–Co/C nanoparticles for ORR activity. Researchers have synthesized electrocatalysts using various methods4–6,20,21 such as impregnation and seeding,18 electrodeposition,19 micro/miniemulsion,22 sol–gel,23 modified polyol synthesis,24 hydrothermal,25 microwave-assisted,26 and sonochemical techniques. Among these methods, the sonochemical technique with the presence of a stabilizing agent is a suitable method to prepare the Pt–Co/C catalyst.
In this work, we adopted the ultrasound-assisted synthesis, which is a promising synthetic method to prepare binary Pt-based alloy catalysts. Advantages of the ultrasound-assisted, also known as sonochemical, method include the ability to control particle size and size distribution, high dispersion on the supports, and precisely tunable bimetallic composition. Although the electrochemical performance of similar compositions is reported in the literature, the ability of sonochemical synthesis to precisely tune the chemical compositions and particle sizes of nanoalloy catalysts makes it the most effective among other methods. Further, the use of ultrasound radiation during the synthesis of Pt–Co not only decreases the synthesis time but also improves diffusion properties and the active phase dispersion and enables incorporation of larger cations into the catalytic lattice.27 Ultrasound radiation generates cavities that collapse into each other, generating high temperatures and pressures and forming hot spots.28,29 Such hot spots produce solids with small uniform particles and increase the specific surface area.30,31 Thus, the properties of the material obtained using this technique are ultimately reflected in increased catalyst activity, selectivity and stability. The capping agent/surfactant also plays an important role in stabilizing the nanoparticles and protecting against agglomeration during synthesis.32 Previously, our group developed synthetic methods33,34 and adopted the ultrasound approach to prepare various nanoparticles for fuel cell applications.32,35–37
In this article, we have presented the sonochemical synthesis of Pt–Co/C bimetallic electrocatalysts with varying compositions and investigated the effect of electrocatalyst composition on the catalytic activity. The electrocatalysts contained Pt to Co atomic ratios of 83![[thin space (1/6-em)]](https://www.rsc.org/images/entities/char_2009.gif) :
:![[thin space (1/6-em)]](https://www.rsc.org/images/entities/char_2009.gif) 17, 75
17, 75![[thin space (1/6-em)]](https://www.rsc.org/images/entities/char_2009.gif) :
:![[thin space (1/6-em)]](https://www.rsc.org/images/entities/char_2009.gif) 25, and 50
25, and 50![[thin space (1/6-em)]](https://www.rsc.org/images/entities/char_2009.gif) :
:![[thin space (1/6-em)]](https://www.rsc.org/images/entities/char_2009.gif) 50. We used sodium borohydride (NaBH4) as a reducing agent and polyvinylpyrrolidone (PVP) as a stabilizing agent in the synthesis. The morphology and structure of the various compositions of Pt–Co/C nanoparticles were characterized by XRD and TEM. The electrochemical activity and the stability of the electrocatalysts towards the ORR were investigated using CV and LSV. In particular, CV and LSV determined the impact of adsorption properties on the catalytic activity for oxygen reduction. The polarization studies in terms of power and current density reflected on the electrocatalytic activity of Pt–Co/C cathodes in PEMFCs.
50. We used sodium borohydride (NaBH4) as a reducing agent and polyvinylpyrrolidone (PVP) as a stabilizing agent in the synthesis. The morphology and structure of the various compositions of Pt–Co/C nanoparticles were characterized by XRD and TEM. The electrochemical activity and the stability of the electrocatalysts towards the ORR were investigated using CV and LSV. In particular, CV and LSV determined the impact of adsorption properties on the catalytic activity for oxygen reduction. The polarization studies in terms of power and current density reflected on the electrocatalytic activity of Pt–Co/C cathodes in PEMFCs.
2. Experimental details
2.1 Materials
Carbon powder (VXC 72), Pt/C (40 wt%), and 5 wt% Nafion solution were procured from Sainergy Fuel Cell Pvt. Ltd., Chennai, India. Chloroplatinic acid hexahydrate (H2PtCl6·6H2O) was procured from Indian Platinum Pvt. Ltd., Mumbai, India. Sodium borohydride (NaBH4, 98%) was procured from Molchem Pvt. Ltd., Mumbai, India. Isopropyl alcohol (IPA, 99%) and cobalt(II) nitrate hexahydrate (Co(NO3)2·6H2O, 98%) were procured from Merck Specialties Pvt. Ltd., Mumbai, India. Polyvinylpyrrolidone (PVP, mol wt 40![[thin space (1/6-em)]](https://www.rsc.org/images/entities/char_2009.gif) 000 g mol−1) was procured from S. D. Fine Chemicals Ltd., Mumbai, India. Sodium hydroxide (NaOH) was procured from Finar Ltd., Gujarat, India. Distilled water was used as a solvent to prepare all solutions throughout the study.
000 g mol−1) was procured from S. D. Fine Chemicals Ltd., Mumbai, India. Sodium hydroxide (NaOH) was procured from Finar Ltd., Gujarat, India. Distilled water was used as a solvent to prepare all solutions throughout the study.
2.2 Synthesis of Pt–Co/C electrocatalysts
The Pt–Co/C nanoparticles with varying compositions were synthesized by changing the precursor concentrations of Pt and Co solutions to control the Pt to Co atomic ratio. The synthesis proceeded in the presence of carbon black, the NaBH4 reducing agent, and the PVP stabilizing agent. The molar ratio of precursor to reducing agent was maintained at 1![[thin space (1/6-em)]](https://www.rsc.org/images/entities/char_2009.gif) :
:![[thin space (1/6-em)]](https://www.rsc.org/images/entities/char_2009.gif) 4. Prior to synthesis, we prepared the stock solutions of Pt and Co precursors, the reducing agent, and sodium hydroxide using distilled water.
4. Prior to synthesis, we prepared the stock solutions of Pt and Co precursors, the reducing agent, and sodium hydroxide using distilled water.
Before the reaction, carbon paste was prepared by mixing carbon black powder with distilled water followed by sonication for 5 minutes. Next, Pt and Co precursors were added together in a desired proportion and the solution was stirred for 30 minutes. Further, we introduced an ultrasound probe (15 cm height, 20 mm diameter, Dakshin Ultrasounds, Mumbai, India) to the solution and simultaneously added the reducing agent dropwise for 30 minutes. The sonicator operated at 20 kHz and 130 W in pulsating mode i.e. 2 seconds ON and 1 second OFF. This process formed the free radicals (Ho and OHo) and also generated heat within the reactor. However, we maintained the reaction temperature at 30 ± 2 °C by circulating the cooling water throughout the jacket of the ultrasound reactor.
Once the reaction was complete, we carried out centrifugation for 15 minutes at 12![[thin space (1/6-em)]](https://www.rsc.org/images/entities/char_2009.gif) 000 rpm to remove the impurities. Subsequently, the resultant mixture was washed several times with distilled water. Finally, the resultant product was dried at 80 °C for 12 h to obtain the Pt–Co/C nanoparticles. Various compositions of Pt–Co/C nanoparticles were prepared by a similar procedure but, changing the concentrations of Pt and Co precursors in the reaction mixture.
000 rpm to remove the impurities. Subsequently, the resultant mixture was washed several times with distilled water. Finally, the resultant product was dried at 80 °C for 12 h to obtain the Pt–Co/C nanoparticles. Various compositions of Pt–Co/C nanoparticles were prepared by a similar procedure but, changing the concentrations of Pt and Co precursors in the reaction mixture.
2.3 Preparation of electrocatalyst ink
We mixed Pt–Co/C nanoparticles with distilled water and IPA (1![[thin space (1/6-em)]](https://www.rsc.org/images/entities/char_2009.gif) :
:![[thin space (1/6-em)]](https://www.rsc.org/images/entities/char_2009.gif) 1 ratio) that made a slightly viscous solution. The mixture was further sonicated for 15 min to break the aggregates, to obtain a uniform dispersion, and to remove some water to the extent of obtaining a thick paste. Next, 5% Nafion solution was added as a binder and the mixture was sonicated for 20 minutes to prepare the electrocatalyst ink. The mass ratio of Nafion to carbon black was maintained at 0.7. Nafion ionomers acted as proton carriers and enhanced mass transport in electrodes. A similar procedure was used to prepare the anode side electrocatalyst ink with commercial 40 wt% Pt/C.
1 ratio) that made a slightly viscous solution. The mixture was further sonicated for 15 min to break the aggregates, to obtain a uniform dispersion, and to remove some water to the extent of obtaining a thick paste. Next, 5% Nafion solution was added as a binder and the mixture was sonicated for 20 minutes to prepare the electrocatalyst ink. The mass ratio of Nafion to carbon black was maintained at 0.7. Nafion ionomers acted as proton carriers and enhanced mass transport in electrodes. A similar procedure was used to prepare the anode side electrocatalyst ink with commercial 40 wt% Pt/C.
2.4 Fabrication of electrodes and membrane electrode assembly (MEA)
We fabricated the gas diffusion electrodes (GDEs) by coating the Pt/C and Pt–Co/C electrocatalyst inks on gas diffusion layers (GDLs) of 10.5 cm × 10.5 cm dimensions (100 cm2 area). First, Pt/C (0.25 mg cm−2) and Pt–Co/C (0.5 mg cm−2) electrocatalyst inks were homogeneously coated on GDLs for the anode and cathode. Then, the electrodes were dried at 80 °C for 20 minutes on a hot plate. The loading in mg cm−2 was confirmed by measuring the weight of GDLs before and after coating of electrocatalyst inks. Finally, the MEA was fabricated by assembling the Nafion membrane (N-117) between the cathode and the anode followed by hot pressing at 100 °C and a pressure of 120 kg cm−2 for 3 minutes.2.5 Physical characterization
Pt–Co/C nanoparticles were characterized by XRD (PANalytical XPERT-PRO, Netherlands) to calculate the crystallite size (d-spacing) using the Scherrer equation. XRD was performed at 30 mA and 40 kV with a scan range (2θ) of 10 to 80° at a scan rate of 0.02 s−1. TEM imaging was performed to investigate the morphology, individual particle size, and the aggregative nature of particles using a JEOL-2010, USA instrument that was operated at an accelerating voltage of 200 kV.2.6 Electrochemical measurements
Electrochemical measurements were performed with a reference electrode (normal hydrogen electrode, (NHE)) and a working electrode (Pt–Co/C, 100 cm2). The PEMFC containing the Pt/C anode and Pt–Co/C cathode was used as an electrochemical cell for the measurements. The NHE was used as a counter as well as reference electrode and Pt–Co/C electrodes were used as working electrodes. All reported potentials were measured against the NHE. CV and LSV measurements were taken on a multichannel potentiostat (Bio-Logic, France) electrochemical workstation. The workstation operated at an AC current of 10 mA and a voltage of 0.4 V. The CV measurements were performed at a scan rate of 50 mV s−1 and the electrochemically active surface area (EASA) was calculated. The open circuit potential (OCP) of the working electrode was determined under no-load conditions from the CV curves. The stability test was conducted by applying a potential in between −0.2 to 0.9 V against the NHE in a H2–N2 atmosphere. The LSV measurements were performed in a H2–O2 atmosphere at a scan rate of 5 mV s−1 in a range of 0.2 to 0.7 V against the NHE.2.7 Fuel cell performance
Each MEA within the PEMFC was tested with hydrogen–oxygen feed gases. The MEA was placed in between two graphite plates with serpentine gas flow channels of dimensions 13 cm × 20 cm. The MEA at humidification temperature 60 °C was activated on a fuel cell test station by passing hydrogen (2 mL s−1) on the anode side and oxygen (5 mL s−1) on the cathode side at 2 atm pressure. Finally, the polarization curves for MEAs containing different compositions of Pt–Co/C were compared.3. Results and discussion
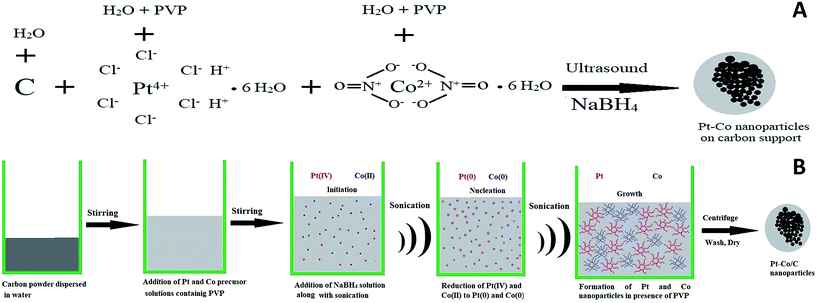
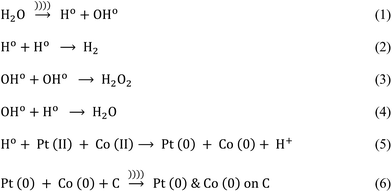
The plausible mechanism of Pt–Co nanoparticle formation on the carbon support using respective precursors, the PVP stabilizing agent, and the ultrasound probe is shown in Fig. 1. The presence of ultrasound decreased the time required for the reduction of precursors due to cavitation and subsequently enhanced mass transport. We observed the uniform dispersion of Pt and Co nanoparticles on the carbon support. The sonochemical method controlled the particle growth by controlling the initiation, nucleation, and growth phase. PVP stabilized the nanoparticles by adsorbing on their surface and preventing further growth and agglomeration.Pt and Co were “alloyed” on the carbon support due to a key role of ultrasound cavitation. The probe sonicator generated cavities in water that were further collapsed causing hemolysis according to eqn (1). The free radicals formed as a result of hemolysis may recombine with each other to produce H2, H2O2 and H2O (eqn (2)–(4)).29 However, uncombined radicals reduced Pt and Co precursors according to eqn (5).30 Further, zero-valent Pt and Co species are “alloyed” on the carbon surface as shown in eqn (6). Scheme 1 demonstrates a plausible mechanism of Pt–Co/C formation in the ultrasound-assisted process.
3.1 X-ray powder diffraction (XRD) analysis
The XRD patterns of various compositions of Pt–Co/C nanoparticles were recorded in a 2θ range of 10 to 80° and compared with that of commercial Pt/C in Fig. 2. The characteristic peak of the carbon support appeared at 25°. The fcc crystal structure of Pt showed characteristic peaks at approximately 40°, 46°, 68° and 82°, which correspond to (1 1 1), (2 0 0), (2 2 0), and (3 1 1) planes, respectively. We did not observe a crystalline peak for Co in the XRD patterns.38 The characteristic peaks shifted to higher 2θ due to alloying of Pt and Co, which can be compared to the Pt/C pattern. The peak corresponding to the (1 1 1) plane shifted to higher 2θ values with an increase in the Co content of the electrocatalyst. The zoomed-in image of the 40° peak clearly shows the shifting of the peak. The shifting of the (1 1 1) peak to higher 2θ values with an increase in the Co content of the electrocatalyst was caused due to the replacement of larger Pt atoms with smaller Co atoms that also increased lattice contraction. The increase in Co reduced the peak intensities and increased the lattice constants due to lattice expansion, which also confirmed the alloy formation.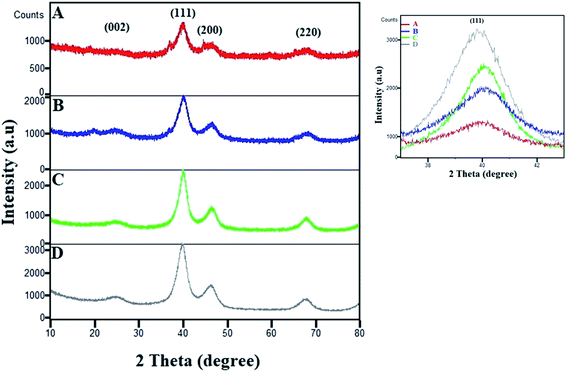 | ||
| Fig. 2 XRD patterns of (A) Pt50–Co50/C, (B) Pt75–Co25/C, (C) Pt83–Co17/C, and (D) 40% Pt/C. The magnified image of the (1 1 1) peak shows its shifting and change in intensity. | ||
We also observed a low intensity peak at approximately 20° and a shoulder peak at approximately 37° in Pt50–Co50/C and Pt75–Co25/C, which are compositions with higher Co content. The plausible source of those two peaks could be the segregation of Co and/or possible formation of Co oxide at the surface of bulk Pt–Co/C. These peaks were observed only when the Co content increased above 25% although the experimental conditions were the same for all experiments. In our case, both the segregation of Co and the formation of Co oxide were possible. The segregation of Co at the surface may occur at a higher Co content of Pt–Co in which Co atoms diffuse to the surface.39,40 Additionally, the formation of Co oxide is also possible because Co possesses a lower surface and cohesive energy and a high lattice mismatch with respect to pure Pt that confers higher oxophilicity on Co and favours surface segregation.41 Maillard et al. also showed direct evidence of Co segregation though XRD in the same nanoparticle system.42
Further, the Scherrer equation was used to calculate the crystallite size from the XRD patterns of all compositions of Pt–Co/C nanoparticles. We selected the peak at 40°, corresponding to the (1 1 1) plane of Pt to apply the Scherrer equation and calculated the crystallite sizes that are listed in Table 1. Since the full width at half maximum (FWHM) of the (1 1 1) peak of Pt–Co/C is broader than that of Pt/C, smaller (12–19 nm) particles of Pt–Co/C were observed as compared to Pt/C. The Pt50–Co50/C nanoparticles were smaller in size and narrower in distribution than the other two bimetallic alloys synthesized in this study.
| No. | Electrocatalyst | Actual atomic ratio (EDX) | Crystallite size nm | Particle size nm |
|---|---|---|---|---|
| XRD (Scherrer) | TEM | |||
| 1 | Pt/C | 100![[thin space (1/6-em)]](https://www.rsc.org/images/entities/char_2009.gif) : :![[thin space (1/6-em)]](https://www.rsc.org/images/entities/char_2009.gif) 0 0 |
10.8 | NA |
| 2 | Pt83–Co17/C | 81![[thin space (1/6-em)]](https://www.rsc.org/images/entities/char_2009.gif) : :![[thin space (1/6-em)]](https://www.rsc.org/images/entities/char_2009.gif) 19 19 |
18.27 | 6 |
| 3 | Pt75–Co25/C | 79![[thin space (1/6-em)]](https://www.rsc.org/images/entities/char_2009.gif) : :![[thin space (1/6-em)]](https://www.rsc.org/images/entities/char_2009.gif) 21 21 |
15.71 | 5 |
| 4 | Pt50–Co50/C | 48![[thin space (1/6-em)]](https://www.rsc.org/images/entities/char_2009.gif) : :![[thin space (1/6-em)]](https://www.rsc.org/images/entities/char_2009.gif) 52 52 |
12.39 | 4 |
3.2 Transmission electron microscopy (TEM)
Fig. 3 shows the TEM images of all compositions of Pt–Co/C nanoparticles. We observed mainly the spherical morphology and relatively uniform dispersion of Pt and Co on the carbon support. Although there were smaller aggregates, the individual particles were of approximately 4–6 nm size. The particle sizes obtained from the TEM are approximately one third of the sizes calculated from the XRD. The Pt and Co atomic ratios were designed based on the feed stoichiometry. The actual wt% of Pt and Co was characterized by EDX shown in Table 1, which shows nearly equal values to the feed values.3.3 Cyclic voltammetry analysis
The dispersion of particles on the support and their size influence on the electrochemical activity of the Pt–Co/C bimetallic electrocatalysts are demonstrated in CV curves shown in Fig. 4. The electrochemically active surface area (EASA) and catalytic activity of Pt–Co/C electrocatalysts were determined using CV. CV measurements performed in a range −0.2 to 0.9 V against the NHE revealed vital information about the oxidation/reduction (redox) and the hydrogen adsorption/desorption (HAD) phenomenon. Desorption peaks were observed in the forward sweep in a range of −0.2 to −0.05 V. In the reverse sweep, adsorption peaks were observed in the same potential range and the active sites subsequently increased on the surface. The oxidation peaks were observed at higher (positive) current (at 0.9 V) in the forward sweep whereas the reduction peaks were observed at lower (negative) current (0.2 to 0.5 V) in the reverse sweep. We also observed that the current density of the Pt–Co/C nanoparticles decreased with an increase in the Co content of the catalyst.43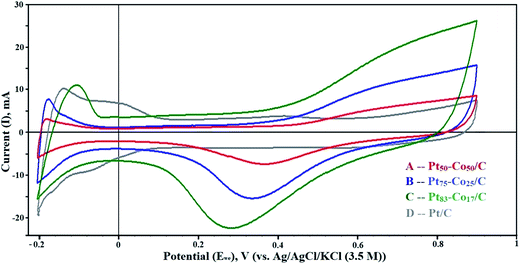 | ||
| Fig. 4 Cyclic voltammetry (CV) curves of (A) Pt50–Co50/C, (B) Pt75–Co25/C, (C) Pt83–Co17/C, and (D) Pt/C measured against the NHE in the H2–N2 atmosphere at a scan rate of 50 mV s−1. | ||
The Pt83–Co17/C composition exhibited higher current density at 0.28 V, which was higher than those of other compositions. This revealed that the oxygen reduction was easier for the Pt83–Co17/C bimetallic electrocatalyst. Since there was an oxidation peak for Pt/C, we confirmed that the ORR activity of the Pt–Co/C nanoparticles was higher than that of the commercial Pt/C electrocatalyst. Strong reduction peaks were observed for Pt–Co/C nanoparticles in Fig. 4, which confirmed that Co alloyed with Pt. The current peaks were in the following order: Pt83–Co17/C > Pt75–Co25/C > Pt50–Co50/C in the reverse sweep. The area under the reduction peak in CV was identified as the adsorption charge. The adsorption charge decreased with an increase in the Co content since Co replaced Pt atoms on the carbon surface. Alloying Co and Pt influenced the EASA of Pt–Co/C electrodes. The EASA was calculated by considering the adsorption charge and Pt loading of the catalyst. The EASA of Pt–Co/C compositions synthesized in this study followed the order of Pt/C > Pt83–Co17/C > Pt75–Co25/C > Pt50–Co50/C. Miyatake and Shimizu reported similar observations of reduction in particle size with an increase in Co content, which also affected the EASA.44 Overall, the EASA of all Pt–Co/C compositions is relatively high, considering the particle size of the nanoparticles.
3.4 Linear sweep voltammetry (LSV) analysis
The LSV curves mainly revealed the OCP in the test range of 0.2 to 0.8 V measured against the NHE. The LSV curves are shown in Fig. 5. The OCP increased with an increase in the Co content of Pt–Co/C electrodes. The highest OCP (0.658 V) in this study was obtained for the Pt50–Co50/C cathode, which was slightly lower than that of commercial Pt/C (0.781 V). We speculate that the diffusion of Co from bulk to surface during the operation reduced the OCP. The OCP of various Pt–Co/C compositions synthesized in this study followed the order of Pt/C > Pt50–Co50/C > Pt75–Co25/C > Pt83–Co17/C. The catalytic activity of all Pt–Co/C compositions in terms of current density is listed in Table 2. LSV curves indicated that the charge transport from 0.2 to 0.45 V was diffusion-controlled whereas it was combined kinetic and diffusion limited from 0.45 to 0.75 V.45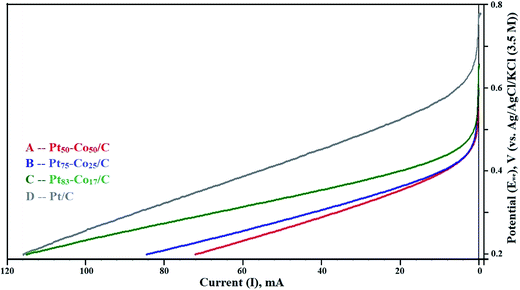 | ||
| Fig. 5 Linear sweep voltammetry (LSV) curves of (A) Pt50–Co50/C, (B) Pt75–Co25/C, (C) Pt83–Co17/C, and (D) Pt/C measured against the NHE in the H2–O2 atmosphere at a scan rate of 5 mV s−1. | ||
| No. | Electrocatalyst | Charge mC | EASA m2 g−1 | CV curves | LSV curves | ||
|---|---|---|---|---|---|---|---|
| OCP V | Peak current, mA@voltage, V | OCP V | Current, mA@0.3 V | ||||
| 1 | Pt/C | 22.56 | 7.88 | 0.866 | NA | 0.781 | 86.7 |
| 2 | Pt83–Co17/C | 17.13 | 7.04 | 0.802 | 22.5@0.28 V | 0.597 | 67.5 |
| 3 | Pt75–Co25/C | 5.55 | 3.86 | 0.819 | 15.6@0.33 V | 0.601 | 42.8 |
| 4 | Pt50–Co50/C | 5.43 | 3.59 | 0.833 | 8.1@0.36 V | 0.658 | 36.6 |
3.5 PEM fuel cell performance
Fig. 6 represents the performance of PEMFCs containing MEAs with various Pt–Co/C compositions on cathodes and the Pt/C anode. The performance of the Pt–Co/C-based MEA was compared with that of the MEA containing Pt/C on both anode and cathode sides. The PEMFC was tested at 60 °C and at atmospheric pressure. In the low potential and low current regions, the performance of all MEAs was approximately 0.6 V and 0.2 A cm−2. Further, the performance reached maximum, and later decreased in the high current region due to mass transfer resistance. The performance of Pt/C (0.189 W cm−2) was slightly higher than that of Pt–Co/C (0.176 W cm−2) nanoparticles. The performance of all compositions of Pt–Co/C synthesized in this study followed the order of Pt/C > Pt83–Co17/C > Pt75–Co25/C > Pt50–Co50/C, as reported in Table 3. The fuel cell performance increased with reduction in particle size, which was mainly attributed to an increase in the EASA of the electrocatalysts. The EASA primarily enhanced the ORR activity that ultimately improved the fuel cell performance.46 However, the fuel cell performance decreased with an increase in Co content. We speculate that the significant replacement of Pt was detrimental to ORR activity in fuel cells.47 On the other hand, the OCP increased with an increase in Co content. The highest OCP was obtained for Pt50–Co50/C (0.98 V) as observed in Fig. 6. The OCP of all compositions of Pt–Co/C synthesized in this study followed the order of Pt/C > Pt50–Co50/C > Pt75–Co25/C > Pt83–Co17/C. We obtained the highest current density of 0.497 A cm−2 at 0.318 V for Pt83–Co17/C. The current density followed the order of Pt83–Co17/C > Pt75–Co25/C > Pt50–Co50/C. Since researchers synthesized Pt–Co/C nanoparticles by various methods, their electrochemical properties also changed. Table 4 compares the electrochemical properties of Pt–Co/C nanoparticles prepared using the sonochemical technique and other methods.17,46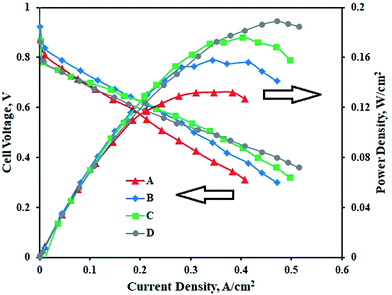 | ||
| Fig. 6 PEM fuel cell performance and polarization curves of (A) Pt50–Co50/C, (B) Pt75–Co25/C, (C) Pt83–Co17/C, and (D) Pt/C cathodes with the Pt/C anode. | ||
| No. | Electrocatalyst | OCP, V | Max. current density (A cm−2)@voltage, V | Peak power density (W cm−2)@voltage, V |
|---|---|---|---|---|
| 1 | Pt/C | 1.023 | 0.515@0.359 V | 0.189@0.4 V |
| 2 | Pt83–Co17/C | 0.958 | 0.497@0.318 V | 0.176@0.436 V |
| 3 | Pt75–Co25/C | 0.924 | 0.480@0.310 V | 0.172@0.473 V |
| 4 | Pt50–Co50/C | 0.894 | 0.471@0.300 V | 0.156@0.377 V |
| No. | Parameter | This study | Yupa and Nisit46 [2009] | Salgado et al.17 [2004] |
|---|---|---|---|---|
| 1 | Pt![[thin space (1/6-em)]](https://www.rsc.org/images/entities/char_2009.gif) : :![[thin space (1/6-em)]](https://www.rsc.org/images/entities/char_2009.gif) Co ratio Co ratio |
83![[thin space (1/6-em)]](https://www.rsc.org/images/entities/char_2009.gif) : :![[thin space (1/6-em)]](https://www.rsc.org/images/entities/char_2009.gif) 17 17 |
82![[thin space (1/6-em)]](https://www.rsc.org/images/entities/char_2009.gif) : :![[thin space (1/6-em)]](https://www.rsc.org/images/entities/char_2009.gif) 18 18 |
85![[thin space (1/6-em)]](https://www.rsc.org/images/entities/char_2009.gif) : :![[thin space (1/6-em)]](https://www.rsc.org/images/entities/char_2009.gif) 15 15 |
| 2 | Particle size, nm | 6 | 8.47 | 8.5 |
| 3 | Anode loading (Pt/C), mg cm−2 | 0.5 | 0.5 | 0.5 |
| 4 | Cathode loading, mg cm−2 | 0.25 | 0.451 | 0.4 |
| 5 | Open circuit potential (OCP), V | 0.958 | NA | 0.961 |
| 6 | Specific activity, mA cm−2 | 500@0.32 V | 800@0.3 V | 1500@0.35 |
4. Conclusion
In this work, we demonstrated the synthesis of Pt–Co/C bimetallic nanoparticles for oxygen reduction in PEM fuel cells. The Pt–Co/C bimetallic nanoparticles were synthesized using a sonochemical technique. The shifting of the (1 1 1) peak to higher 2θ vales in XRD confirmed the alloying of Pt and Co. The crystallite size of Pt–Co/C nanoparticles decreased with an increase in the Co content. The Pt–Co/C nanoparticles exhibited a spherical shape and a size smaller than 6 nm as observed in TEM images. Overall, the EASA and the current density decreased with an increase in the Co content of bimetallic nanoparticles. The fuel cell showed relatively inferior performance when the composition of higher Co content was used in electrodes. The Pt83–Co17/C composition performed best and gave 0.176 W cm−2 power at 0.436 V when tested in PEM fuel cells. Different ratios of Pt and Co loadings on the carbon support did not significantly affect the structure of Pt–Co/C nanoparticles, but influenced the particle size, EASA of the electrocatalyst, and fuel cell performance.Conflicts of interest
There are no conflicts to declare.Acknowledgements
The authors gratefully acknowledge the financial support from the Ministry of Electronics and Information Technology (MeitY), Government of India.References
- I. Spanos, C. P. Rellan, L. Altmann, M. Baumer and M. Arenz, Int. J. Hydrogen Energy, 2014, 39, 9143–9148 CrossRef CAS.
- Y. Zhao, J. Liu, Y. Zhao and F. Wang, Phys. Chem. Chem. Phys., 2014, 16, 19298–19306 RSC.
- Z. Yan, M. Wang, Y. Lu, R. Liu and J. Zhao, J. Solid State Electrochem., 2013, 1–16 Search PubMed.
- R. N. Singh, R. Awasthi and C. S. Sharma, Int. J. Electrochem. Sci., 2014, 9, 5607–5639 Search PubMed.
- X. Zhou, Y. Gan, J. Du, D. Tian, R. Zhang, C. Yang and Z. Dai, J. Power Sources, 2013, 232, 310–322 CrossRef CAS.
- Y. Bing, H. Liu, L. Zhang, D. Ghosh and J. Zhang, Chem. Soc. Rev., 2010, 39(6), 2184–2202 RSC.
- E. I. Santiago, L. C. Varanda and H. M. Villullas, J. Phys. Chem. C, 2007, 111, 3146–3151 CAS.
- Y. H. Cho, T. Y. Jeon, S. J. Yoo, K. S. Lee, M. Ahn, O. H. Kim, Y. H. Cho, J. W. Lim, N. Jung, W. S. Yoon, H. Choe and Y. E. Sung, Electrochim. Acta, 2012, 59, 264–269 CrossRef CAS.
- S. J. Hwang, J. W. Kim, S. J. Yoo, J. H. Jang, E. A. Cho, T. H. Lim, S. G. Pyo and S. K. Kim, Bull. Korean Chem. Soc., 2012, 33(2), 699–702 CrossRef CAS.
- J. W. Guo, T. S. Zhao, J. Prabhuram, R. Chen and C. W. Wong, Electrochim. Acta, 2005, 51, 754–763 CrossRef CAS.
- N. Hodnik, M. Bele, A. Recnik, N. Z. Logar, M. Gaberscek and S. Hocevar, Energy Procedia, 2012, 29, 208–215 CrossRef CAS.
- F. Kadirgan, A. M. Kannan, T. Atilan, S. Beyhan, S. S. Ozenler, S. Suzer and A. Yorur, Int. J. Hydrogen Energy, 2009, 34, 9450–9460 CrossRef CAS.
- S. K. Kim, J. Y. Park, S. C. Hwang, D. K. Lee, S. H. Lee, M. H. Han and Y. W. Rhee, J. Nanomater., 2014, 2014, 1–8 Search PubMed.
- E. Antolini, J. R. C. Salgado, L. G. R. A. Santos, G. Garcia, E. A. Ticianelli, E. Pastor and E. R. Gonzalez, J. Appl. Electrochem., 2006, 36, 355–362 CrossRef CAS.
- M. Min, J. Cho, K. Cho and H. Kim, Electrochim. Acta, 2000, 45, 4211–4217 CrossRef CAS.
- Y. J. Wang, N. Zhao, B. Fang, H. Li, X. T. Bi and H. Wang, Chem. Rev., 2015, 115(9), 3433–3467 CrossRef CAS PubMed.
- J. R. C. Salgado, E. Antolini and E. R. Gonzalez, J. Phys. Chem. B, 2004, 108, 17767–17774 CrossRef CAS.
- W. Trongchuankij, K. Pruksathorn and M. Hunsom, Appl. Energy, 2011, 88, 974980 CrossRef.
- S. Woo, I. Kim, J. K. Lee, S. Bong, J. Lee and H. Kim, Electrochim. Acta, 2011, 56, 3036–3041 CrossRef CAS.
- K. Vignarooban, J. Lin, A. Arvay, S. Kolli, I. Kruusenberg, K. Tammeveski, L. Munukutla and A. M. Kannan, Chin. J. Catal., 2015, 36, 458–472 CrossRef CAS.
- Y. Holade, N. E. Sahin, K. Servat, T. W. Napporn and K. B. Kokoh, Catalysts, 2015, 5, 310–348 CrossRef CAS.
- Q. He and S. Mukerjee, Electrochim. Acta, 2010, 55, 1709–1719 CrossRef CAS.
- M. A. G. Contreras and S. M. F. Valverde, J. Microwave Power, 2011, 45(4), 188–192 Search PubMed.
- E. I. Santiago, L. C. Varanda and H. M. Villullas, J. Phys. Chem. C, 2007, 111, 3146–3151 CAS.
- W. Ji, W. Qi, S. Tang, H. Peng and S. Li, Nanomaterials, 2015, 5, 2203–2211 CrossRef CAS PubMed.
- W. Zhang, J. Chen, G. F. Swiegers, Z. F. Mab and G. G. Wallace, Nanoscale, 2010, 2, 282–286 RSC.
- M. E. Sibaja, M. Munoz, S. Moreno and R. Molina, Fuel, 2017, 194, 7–16 CrossRef.
- K. S. Suslick, T. Hyeon, M. Fang and A. A. Cichowlas, Mater. Sci. Eng., A, 1995, 204, 186–192 CrossRef.
- H. Xu, B. W. Zeigera and K. S. Suslick, Chem. Soc. Rev., 2013, 42, 2555–2567 RSC.
- M. Ashokkumar and F. Grieser, Rev. Chem. Eng., 1999, 15(1), 41–83 CAS.
- S. Allahyari, M. Haghighi, A. Ebadi and S. Hosseinzadeh, Ultrason. Sonochem., 2014, 21, 663–673 CrossRef CAS PubMed.
- B. A. Bhanvase and S. H. Sonawane, Chem. Eng. Process., 2015, 95, 347–352 CrossRef CAS.
- S. Sharada, P. L. Suryawanshi, P. Rajesh Kumar, S. P. Gumfekar, T. Bala Narsaiah and S. H. Sonawane, Colloids Surf., A, 2016, 498, 297–304 CrossRef CAS.
- P. L. Suryawanshi, S. P. Gumfekar, P. Rajesh Kumar, B. B. Kale and S. H. Sonawane, Colloid Interface Sci. Commun., 2016, 13, 6–9 CrossRef CAS.
- B. A. Bhanvase, M. A. Patel, S. H. Sonawane and A. B. Pandit, Ultrason. Sonochem., 2016, 28, 311–318 CrossRef CAS PubMed.
- P. Rajesh Kumar, P. L. Suryawanshi, S. P. Gumfekar, B. A. Bhanvase and S. H. Sonawane, Surf. Interfaces, 2018 DOI:10.1016/j.surfin.2018.04.002.
- P. Rajesh Kumar, P. L. Suryawanshi, S. P. Gumfekar and S. H. Sonawane, Chem. Eng. Process., 2017, 121, 50–56 CrossRef.
- R. Ahmadi, M. K. Amini and J. C. Bennett, J. Catal., 2012, 292, 81–89 CrossRef CAS.
- K. S. An, A. Kimura, K. Ono, N. Kamakura, A. Kakizaki, C. Y. Park and K. Tanaka, Surf. Sci., 1998, 401, 336–343 CrossRef CAS.
- U. Bardi, B. C. Beard and P. N. Ross, J. Vac. Sci. Technol., A, 1988, 6, 665–670 CAS.
- G. E. R. Caballero, Y. Ma, R. C. Tovar and P. B. Balbuena, Phys. Chem. Chem. Phys., 2010, 12, 2209–2218 RSC.
- F. Maillard, L. Dubau, J. Durst, M. Chatenet, J. Andre and E. Rossinot, Electrochem. Commun., 2010, 12, 1161–1164 CrossRef CAS.
- Y. W. Ma, Z. R. Liu, B. L. Wang, Z. H. Lei, J. P. Yang and X. A. Li, New Carbon Mater., 2012, 27(4), 250–257 CrossRef CAS.
- K. Miyatake and Y. Shimizu, ACS Omega, 2017, 2(5), 2085–2089 CrossRef CAS.
- F. H. B. Lima, W. H. L. Valbuena, E. T. Neto, F. C. Nart, E. R. Gonzalez and E. A. Ticianelli, Electrochim. Acta, 2006, 52, 385–393 CrossRef CAS.
- S. Yupa and T. Nisit, J. Appl. Electrochem., 2009, 39, 123–134 CrossRef.
- B. P. Vinayan, R. I. Jafri, R. Nagar, N. Rajalakshmi, K. Sethupathi and S. Ramaprabhu, Int. J. Hydrogen Energy, 2012, 37, 412–421 CrossRef CAS.
| This journal is © The Royal Society of Chemistry 2018 |

