 Open Access Article
Rapid preparation of block copolymer templated mesoporous Zr1−xCexO2 thin films†
Ianina L. Violi ab,
Vittorio Luca
 c,
Analía L. Soldatid,
Horacio Troianid,
Galo J. A. A. Soler-Illia
 ae and
Andrés Zelcer
 *abf
*abf
aGerencia Química, CAC, CNEA, CONICET, Av. Gral. Paz 1499, B1650KNA, San Martín, Buenos Aires, Argentina. E-mail: Andres.Zelcer@cibion.conicet.gov.ar; Tel: +54 11 4899 5500
bCIBION, CONICET, Godoy Cruz 2390 (C1425FQD), CABA, Argentina
cCentro Atómico Constituyentes, Comisión Nacional de Energía Atómica, Av. Gral. Paz 1499, B1650KNA, San Martín, Buenos Aires, Argentina
dGerencia de Investigación Aplicada, Centro Atómico Bariloche, CNEA, CONICET, 8400, S.C. de Bariloche, Río Negro, Argentina
eInstituto de Nanosistemas, UNSAM, 25 de Mayo y Francia (1650), San Martín, Buenos Aires, Argentina
fECyT, UNSAM, 25 de Mayo y Francia (1650), San Martín, Buenos Aires, Argentina
First published on 18th May 2017
Abstract
A scalable, simple, robust and reproducible method is presented for the preparation of chemically homogeneous and ordered nanocrystalline and mesoporous Zr1−xCexO2 thin films. The method utilizes widely available commercial block copolymers as templates. We show how the preparation conditions, film compositions and thermal treatments determine the mesoporous and crystalline structure. Through the scanning of the synthetic process, it was possible to arrive at an optimized and very reproducible method which allows the preparation of high quality, transparent, nanocrystalline and ordered Zr1−xCexO2 mesoporous thin films with different compositions.
Reducible oxides are materials of increasing technological and industrial relevance that find applications as catalysts, catalyst supports, electrodes and conductors.1–3 Among such materials, ceria-based oxides possess an interesting redox chemistry that enable their use in large-scale and industrial applications including three-way catalysts for motor vehicles, soot combustion, the water–gas-shift reaction, the production of specialty chemicals, fine chemistry oxidation reactions and prototype fuel cell electrodes.4–8 Ceria acts as an oxide ion buffer, becoming reduced and re-oxidized depending of the redox demand. This characteristic gives rise to an oxygen storage capacity (OSC) that is a measure of the amount of oxygen provided by the oxide under certain environmental demands.9
Despite its excellent chemical properties, cerium oxide lacks sufficient structural and thermal stability to be used in long-term applications. Therefore, it must be supported on a robust material like alumina or incorporated into solid solutions with other metals that provide better mechanical stability. One of the most widespread ceria-containing solid solution system is the zirconia–ceria mixed oxide.10–13 This binary metal oxide combines the mechanical and thermal stability of zirconia and variable oxidation state of cerium, enhancing the reversibility of redox reactions through structural stabilization. Interestingly, the addition of Zr can even lead to an OSC higher than the observed for pure ceria.6,14,15 It is somewhat counterintuitive that Zr(IV), a non-reducible tetravalent ion, enhances the redox properties of ceria. Several studies have sought to shed light on the mechanism by which Zr modulates the electrochemical properties of Ce oxide. Based on high-resolution STM images and DFT calculations, Esch et al. proposed that Zr(IV) ions, being smaller than Ce(IV), facilitate the nucleation of surface defects, removing an energetic barrier for the formation of surface oxygen vacancy clusters.16 DFT calculations of the vacancy creation energies in the κ-CeZrO4 phase revealed that structural relaxation involved in creating an oxygen vacancy is assisted by the different radii of Zr and Ce ions.17
Mesoporous materials, which have pores in the 2–50 nm range, have high specific surface areas and pores that can readily be accessed by relatively small chemical species.18,19 These characteristics are highly desirable for catalysts and catalyst supports, two of the main applications of reducible oxides.18,20 In particular, the high surface area favors the formation of defects and surface states that act as catalytically active sites and also enhance the OSC.21 One of the most widely used and versatile strategies for the preparation of mesoporous materials is evaporation induced self-assembly (EISA).22,23 In this structuring strategy, the evaporation of solvents induces both a sol–gel transition of a precursor and the assembly of a structure directing agent, usually a surfactant, that serves as a sacrificial template for the pores. This method is particularly useful for the preparation of mesoporous thin films. This kind of processing allows the deposition of high surface area materials onto almost any substrate, thus allowing for the generation of materials that can be tailored to the environmental and catalytic applications. Indeed, the need to integrate the functionality of high surface Zr1−xCexO2 porous coatings in complex hierarchical porous structures usually also requires a deposition method compatible with industrial scale production.
Although some examples of mesoporous Zr1−xCexO2 thin film preparation have been reported, there is still a need for reproducible, scalable methods that employ readily available reagents. When producing mixed oxides, procedures that work for the preparation of xerogels and powders are not necessarily applicable for thin-film deposition, since evaporation rates are very different. This is particularly true for mixed metal oxides since the different reaction rates can lead to phase segregation and inhomogeneous materials.24 The difficulties arising in the preparation of mesoporous Zr1−xCexO2 thin films using sol–gel chemistry have been evident since the first studies of such materials.12,25 An early report from Crepaldi et al. used a commercial surfactant as a template and compositions up to 20 mol% Ce were investigated.12 As initially cast, the porous thin film shows little if any periodic ordering. A complex procedure was developed that entailed repeated exposition of the freshly deposited film to water vapor. This process promoted the rearrangement of oxo-clusters and resulted in a dramatic improvement in pore ordering. This synthetic pathway is sensitive to small changes in humidity during aging, leading to different mesopore arrangements. More recently, Brezesinski et al. prepared mesoporous Zr1−xCexO2 thin films using the custom-made KLE block copolymer as a template and a thermal treatment right after deposition.25 This rapid thermal treatment facilitates ordered film preparation within the full compositional range. They attributed the success of the synthetic strategy to the use of KLE as a template since (a) its self-assembly occurs with more rapid kinetics and (b) it is thermally more stable than Pluronic copolymers. The significant differences from bulk behavior in the electronic transport properties of these films were explained by a model based on surface defects.26
The objective of the present work is to optimize the synthesis and microstructure of mesoporous Zr1−xCexO2 thin films that fulfill the requirements for large scale production in terms of scalability, reproducibility and physicochemical properties. A simple, robust and reproducible synthetic strategy is presented for the preparation of chemically homogeneous mesoporous Zr1−xCexO2 thin films that utilizes as the porogen the commercially available Pluronic F127 block copolymer. It is demonstrated that the preparation conditions, film composition and thermal treatment determine the mesoporous and crystalline structure of the films. The mechanisms that dominate the complex processes that take place when preparing crystalline and mixed mesoporous thin films are also elucidated. The films can be prepared in a wide range of compositions and are highly porous. The pore system remains accessible to gases and other reagents. These films serve as supports for catalytically active gold nanoparticles leading to a reusable catalyst for chemical and electrochemical reactions.27
1 Experimental
1.1 Materials and methods
Zirconium propoxide (70% in propanol), cerium chloride heptahydrate, 2,4-pentanedione (acac) and triblock copolymer Pluronic F127 were acquired from Sigma-Aldrich. Absolute ethanol and concentrated hydrochloric acid were purchased from Merck. Water (resistivity 18 MΩ) was obtained from a Millipore system. Glass slides (Marienfeld) and silicon (University Wafers) were carefully cleaned and rinsed with acetone and water before use.1.2 Sample preparation
Sols were prepared using Zr(OPr)4 and CeCl3·7H2O as the metal ion sources, acac for hydrolysis control and Pluronic F127 as the template. The final compositions expressed in molar ratio were: Zr(OPr)4![[thin space (1/6-em)]](https://www.rsc.org/images/entities/char_2009.gif) :
:![[thin space (1/6-em)]](https://www.rsc.org/images/entities/char_2009.gif) CeCl3·7H2O
CeCl3·7H2O![[thin space (1/6-em)]](https://www.rsc.org/images/entities/char_2009.gif) :
:![[thin space (1/6-em)]](https://www.rsc.org/images/entities/char_2009.gif) EtOH
EtOH![[thin space (1/6-em)]](https://www.rsc.org/images/entities/char_2009.gif) :
:![[thin space (1/6-em)]](https://www.rsc.org/images/entities/char_2009.gif) H2O
H2O![[thin space (1/6-em)]](https://www.rsc.org/images/entities/char_2009.gif) :
:![[thin space (1/6-em)]](https://www.rsc.org/images/entities/char_2009.gif) acac
acac![[thin space (1/6-em)]](https://www.rsc.org/images/entities/char_2009.gif) :
:![[thin space (1/6-em)]](https://www.rsc.org/images/entities/char_2009.gif) HCl
HCl![[thin space (1/6-em)]](https://www.rsc.org/images/entities/char_2009.gif) :
:![[thin space (1/6-em)]](https://www.rsc.org/images/entities/char_2009.gif) F127 = (1 − x)
F127 = (1 − x)![[thin space (1/6-em)]](https://www.rsc.org/images/entities/char_2009.gif) :
:![[thin space (1/6-em)]](https://www.rsc.org/images/entities/char_2009.gif) x
x![[thin space (1/6-em)]](https://www.rsc.org/images/entities/char_2009.gif) :
:![[thin space (1/6-em)]](https://www.rsc.org/images/entities/char_2009.gif) 40
40![[thin space (1/6-em)]](https://www.rsc.org/images/entities/char_2009.gif) :
:![[thin space (1/6-em)]](https://www.rsc.org/images/entities/char_2009.gif) 20
20![[thin space (1/6-em)]](https://www.rsc.org/images/entities/char_2009.gif) :
:![[thin space (1/6-em)]](https://www.rsc.org/images/entities/char_2009.gif) (1 − x)
(1 − x)![[thin space (1/6-em)]](https://www.rsc.org/images/entities/char_2009.gif) :
:![[thin space (1/6-em)]](https://www.rsc.org/images/entities/char_2009.gif) 1
1![[thin space (1/6-em)]](https://www.rsc.org/images/entities/char_2009.gif) :
:![[thin space (1/6-em)]](https://www.rsc.org/images/entities/char_2009.gif) 0.005 where x was varied between 0.1 and 0.5 in 0.1 increments. In a typical preparation, acac was first dissolved in 80% of the required ethanol, then Zr(OPr)4 was added and the solution was briefly stirred until homogeneous. The required amount of CeCl3 was added and the solution stirred until the solid had completely dissolved. The required amount of HCl(c) and water were dissolved in the remaining ethanol, and this mixture was added dropwise under continuous agitation to the metals-ion containing solution.
0.005 where x was varied between 0.1 and 0.5 in 0.1 increments. In a typical preparation, acac was first dissolved in 80% of the required ethanol, then Zr(OPr)4 was added and the solution was briefly stirred until homogeneous. The required amount of CeCl3 was added and the solution stirred until the solid had completely dissolved. The required amount of HCl(c) and water were dissolved in the remaining ethanol, and this mixture was added dropwise under continuous agitation to the metals-ion containing solution.
For the preparation of mesoporous thin films sols were dip coated onto silicon or soda-lime glass, using withdrawal rates between 0.5 and 4.0 mm s−1. In the optimized synthesis, films were left to dry in the dip-coater for 30 seconds and then transferred directly to an oven at 200 °C for 30 minutes (from now on, this post-synthetic treatment is called T1). For further analysis of the effect of the post-deposition treatment, another two different stabilization steps were applied: (T2) 24 h at 50% RH, 24 h at 60 °C and 24 h at 130 °C; (T3) same temperatures as T2 but only for 30 minutes each step. After one of these treatments, samples were finally calcined at 350 °C for 2 h with a heating ramp of 1 °C min−1.
In order to study the thermal stability of the films some were further treated at higher temperatures (between 550 and 650 °C) and for different times (between 30 min and 3 h) to induce crystallization. Films were kept in a preheated oven for a specific period of time prior to exposing to ambient air.
1.3 Characterization
The morphology of the films was studied using Transmission Electron Microscopy (TEM Phillips EM 301 CMA, FCEyN, UBA) and Field Emission Scanning Electron Microscopy (FE-SEM, Carl-Zeiss SUPRA 40, CMA, FCEyN, UBA). The composition of the materials were determined using energy-dispersive X-ray spectroscopy (EDS, INCA X-Sight system, Oxford Instruments) coupled to a FE-SEM operating at 20 kV.High Resolution Transmission Electron Microscopy (HRTEM) was performed using a Philips CM 200 microscope operating at 200 kV and equipped with a LaB6 filament. The TEM was equipped with a CCD camera and an EDS detector for chemical elementary analysis. The microscope operated with an ultra-twin objective lens ideal for HRTEM observations. Small fragments of the mesoporous structure were scraped from the support and suspended in ethyl alcohol. Subsequently, small drops of the suspension were deposited on commercial ultrathin carbon films supported on Cu grids and were allowed to dry.
Porosity and pore dimensions were determined by environmental ellipsoporosimetry (EEP), and refractive index n as well as extinction coefficient k of the films were obtained by modelling of the ellipsometric signal (SOPRA GES5A). UV-Vis measurements were carried out in a Hewlett-Packard 8453 spectrophotometer. Contact angle measurements were performed by dropping E-pure water over each film, using a Ramé-Hart 290 device. Pore arrangement and interplanar distances were measured using Small Angle X-ray Scattering with 8 keV radiation (SAXS2 beamline, Laboratório Nacional de Luz Síncrotron, Brazil). Crystalline phases were characterized by Grazing Incidence X-Ray Diffraction (GIXRD, PANAnalytical Empyrean) in grazing incidence configuration using Cu Kα radiation and a PIXcel3D detector. Soller slits (0.04 radian) were used on both the incident and diffracted beam side. A parallel beam mirror, 1/2° primary divergence slit, a 0.04 radian Soller slit, and a beam mask were used on the incident beam side while a parallel plate collimator and an 0.04 radian Soller slit was employed on the diffracted beam side. Rietveld refinements were undertaken using the Rietveld implementation within the Panalytical HighScore software. Further analyses of thickness, porosity and crystalline evolution were performed by X-Ray Reflectometry (XRR) and GIXRD in the XRD1 beamline at Laboratório Nacional de Luz Síncrotron, Brazil.
2 Results and discussion
2.1 Synthetic strategy
Mesoporous thin films (MPTF) were prepared by coupling sol–gel reactions with EISA of surfactant micelles.22,23 The EISA strategy requires tuning the reaction conditions in order to adjust the timing of mesophase ordering and metal oxide framework formation. As different metal cations are involved in the film formation, the reactivity of both precursors must be adjusted in order to match the condensation rates. If the mixed oxide formation kinetics is mismatched, segregation of zirconia- and ceria-rich phases could take place.28–30 The higher charge and smaller ionic radius of Zr(IV) compared with Ce(III) ions lead to an increased partial charge and faster hydrolysis and condensation kinetics. In order to compatibilize the reactivities of both metal cations, we employed one equivalent of acac per zirconium ion. The use of acac for modulating the sol–gel reactivity of zirconium alkoxides is well documented in the literature, and has previously been used by us to prepare mesoporous ZrO2 thin films.31 Acac is a weak acid and acts as a bidentate ligand yet it neutralizes only one charge, therefore decreasing the hydrolysis and condensation kinetics of Zr(IV). The small oxo and hydroxo clusters that form show affinity with the hydrophilic part of the templating agents leading to a fast ordering of the inorganic framework during the EISA process. Previous works has shown that films prepared using Ce(III) chlorides need to be thermally treated immediately following deposition in order to avoid opalescence of the films. This degradation of the optical quality is suggested to arise from segregation of cerium chloride hydrate.25 In contrast, a classical approach to EISA-based mesoporous thin film synthesis includes, after deposition, first a treatment at controlled humidity, and then a gradual stepwise heating, to finally arrive at the appropriate calcination temperature.12 The rationale behind this procedure is to maintain film fluidity such that micelles are able to order, and then to gradually strengthen pore walls such that high stresses developed during contraction of the film can be absorbed. In the present work, the effect of different post-deposition treatments in the material properties, including homogeneity, mesopore order, optical quality, porosity and pore dimensions have been studied. The surfactant F127 was used as a porogen. In contrast to custom-made surfactants employed for templating of Zr1−xCexO2 materials,25 this low-cost triblock copolymer is readily available and non-toxic, making this procedure amenable to industrial production.2.2 Post-deposition treatment and film quality
Optical quality, transparent and highly ordered mesoporous thin films were obtained for all studied compositions when films were subjected to temperatures of 200 °C immediately after dip-coating (post-deposition treatment T1). TEM and FE-SEM images, as well as low-angle incidence (4°) 2D-SAXS patterns, show domains of ordered pores that are compatible with a distorted Im![[3 with combining macron]](https://www.rsc.org/images/entities/char_0033_0304.gif) m cubic arrangement (Fig. 1 and S1†). FE-SEM images of the film surfaces show multiple large area domains of ordered mesopores. Ordered films prepared using F127 and EISA usually show distorted cubic Im
m cubic arrangement (Fig. 1 and S1†). FE-SEM images of the film surfaces show multiple large area domains of ordered mesopores. Ordered films prepared using F127 and EISA usually show distorted cubic Im![[3 with combining macron]](https://www.rsc.org/images/entities/char_0033_0304.gif) m or Fm
m or Fm![[3 with combining macron]](https://www.rsc.org/images/entities/char_0033_0304.gif) m phases. In the case of Im
m phases. In the case of Im![[3 with combining macron]](https://www.rsc.org/images/entities/char_0033_0304.gif) m phases, the (110) direction is usually perpendicular to the substrate, while for Fm
m phases, the (110) direction is usually perpendicular to the substrate, while for Fm![[3 with combining macron]](https://www.rsc.org/images/entities/char_0033_0304.gif) m phases, it is the (111) direction which is normal to the surface. The distortion is typical of EISA deposited mesoporous thin films, and is caused by an anisotropic contraction of the film. After the micelles have self-assembled, further solvent evaporation and inorganic condensation during the thermal treatments lead to a reduction of the film volume. Since the film is anchored to the substrate, contraction along the xy plane is not possible and the films contract only on the z-direction. This contraction distorts the Im
m phases, it is the (111) direction which is normal to the surface. The distortion is typical of EISA deposited mesoporous thin films, and is caused by an anisotropic contraction of the film. After the micelles have self-assembled, further solvent evaporation and inorganic condensation during the thermal treatments lead to a reduction of the film volume. Since the film is anchored to the substrate, contraction along the xy plane is not possible and the films contract only on the z-direction. This contraction distorts the Im![[3 with combining macron]](https://www.rsc.org/images/entities/char_0033_0304.gif) m structure bringing the 110 planes closer, displacing the corresponding 110 reflection to larger angles. Although the arrangement is no longer strictly Im
m structure bringing the 110 planes closer, displacing the corresponding 110 reflection to larger angles. Although the arrangement is no longer strictly Im![[3 with combining macron]](https://www.rsc.org/images/entities/char_0033_0304.gif) m, the plane designations are maintained throughout this report for simplicity.
m, the plane designations are maintained throughout this report for simplicity.
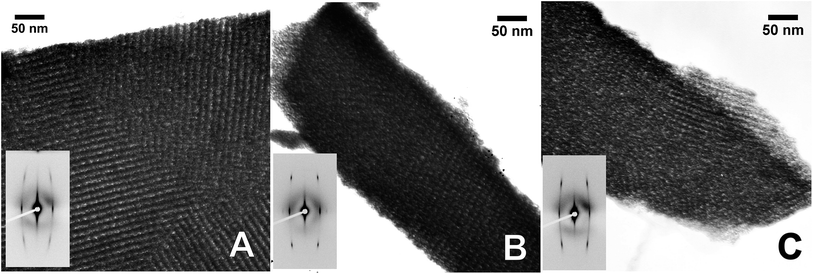 | ||
| Fig. 1 Representative TEM images of Zr1−xCexO2 MPTF deposited onto glass. (A) x = 0.1; (B) x = 0.3; (C) x = 0.5. Inset: 2D-SAXS patterns. | ||
Fourier transforms of the FE-SEM images show the typical 4 + 2 arrangement compatible with an Im![[3 with combining macron]](https://www.rsc.org/images/entities/char_0033_0304.gif) m disposition. The films are composed of multiple domains in the xy plane, each one exposing the [110] face. When SAXS diffractograms were obtained with a 90° incident beam, several peaks corresponding to different planes of an Im
m disposition. The films are composed of multiple domains in the xy plane, each one exposing the [110] face. When SAXS diffractograms were obtained with a 90° incident beam, several peaks corresponding to different planes of an Im![[3 with combining macron]](https://www.rsc.org/images/entities/char_0033_0304.gif) m pore arrangement are resolved (Fig. 2A). Moreover, in situ 2D-SAXS measurements show that the pattern obtained immediately following deposition of the sol used to synthesize Zr0.5Ce0.5O2 MPTFs perfectly matches the theoretical pattern32 of an Im
m pore arrangement are resolved (Fig. 2A). Moreover, in situ 2D-SAXS measurements show that the pattern obtained immediately following deposition of the sol used to synthesize Zr0.5Ce0.5O2 MPTFs perfectly matches the theoretical pattern32 of an Im![[3 with combining macron]](https://www.rsc.org/images/entities/char_0033_0304.gif) m with (110) direction perpendicular to the substrate (Fig. S2†).
m with (110) direction perpendicular to the substrate (Fig. S2†).
Films prepared with intermediate consolidation steps (T2 and T3) show well-ordered pores only for 0.1–0.3 ceria contents (Fig. S1† and 2A). For higher ceria proportions, a sponge-like structure is observed in FE-SEM, and in some cases, the films also show poor optical quality near the edges, with slightly opaque areas (Fig. S3†). Films prepared with ceria proportions 0.6 and higher show poor optical properties for all thermal treatments, and were not further studied.
Film thickness can be controlled by varying the withdrawal rate. Films with thicknesses between ∼50 and 200 nm can be cast using withdrawal speeds between 0.5 and 4.0 mm s−1 (Fig. S4†). Films with different cerium content prepared under the same conditions show small differences (25–50 nm) in thickness, but a similar dependence of thickness on withdrawal rate. Thus, withdrawal rate is the main processing parameter that controls film thickness, while the Ce to Zr ratio introduces a smaller variation.
2.3 Sol composition and thermal treatment
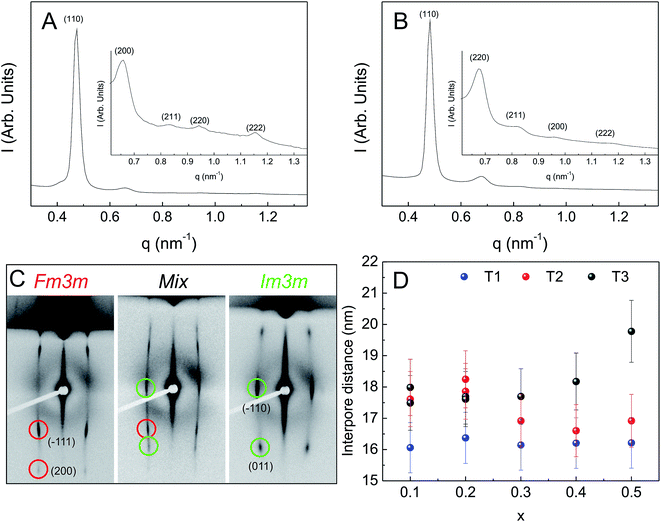
The mesopore arrangement was further studied using 2D-SAXS at normal and low incidence angle. Depending on the film composition and thermal treatment, different diffraction patterns are observed. For T1 treatment, all the samples only show diffraction spots compatible with a distorted Im![[3 with combining macron]](https://www.rsc.org/images/entities/char_0033_0304.gif) m structure.
m structure.
While for T1 the same arrangement is obtained for all compositions, for the T2 treatment a diffraction pattern consistent with an Fm![[3 with combining macron]](https://www.rsc.org/images/entities/char_0033_0304.gif) m space group is observed for low cerium molar ratio (0.1), and a Im
m space group is observed for low cerium molar ratio (0.1), and a Im![[3 with combining macron]](https://www.rsc.org/images/entities/char_0033_0304.gif) m geometry is observed for a cerium ratio of 0.3. For a the intermediate molar ratio of 0.2, a mixture of both cubic phases is obtained. For T3, a diffraction pattern compatible with an Fm
m geometry is observed for a cerium ratio of 0.3. For a the intermediate molar ratio of 0.2, a mixture of both cubic phases is obtained. For T3, a diffraction pattern compatible with an Fm![[3 with combining macron]](https://www.rsc.org/images/entities/char_0033_0304.gif) m arrangement is observed for cerium molar ratios of 0.1 and 0.2, and a Im
m arrangement is observed for cerium molar ratios of 0.1 and 0.2, and a Im![[3 with combining macron]](https://www.rsc.org/images/entities/char_0033_0304.gif) m geometry otherwise (Fig. 2C).
m geometry otherwise (Fig. 2C).
The degree of film contraction in the z-direction was calculated from the interplanar distances obtained from 2D-SAXS experiments. The measured distances for the (![[1 with combining macron]](https://www.rsc.org/images/entities/char_0031_0304.gif) 10) (d
10) (d![[1 with combining macron]](https://www.rsc.org/images/entities/char_0031_0304.gif) 10) and (110) (d110) planes of the cubic arrangement are 13.2 nm and 3.1 nm. The distance d
10) and (110) (d110) planes of the cubic arrangement are 13.2 nm and 3.1 nm. The distance d![[1 with combining macron]](https://www.rsc.org/images/entities/char_0031_0304.gif) 10 is taken as the one corresponding to the as cast cubic arrangement since the film does not contract in the xy plane. The ratio between these two distances indicates a contraction of almost 77%.
10 is taken as the one corresponding to the as cast cubic arrangement since the film does not contract in the xy plane. The ratio between these two distances indicates a contraction of almost 77%.
Although the interpore distances are similar for all thermal treatments and compositions, the values are always smaller and more homogeneous among different molar Ce ratios for films prepared using T1 treatment (Fig. 2D). This is consistent with a kinetically controlled process, where compositional differences are countermanded by temperature induced rapid kinetics for all metallic centers. It is interesting to note that although it has been suggested that in contrast to KLE, the Pluronics copolymer family is not sufficiently thermally stable to withstand this kind of thermal treatment,25 high quality pore ordering is observed for all compositions.
2.4 Pore ordering occurs immediately
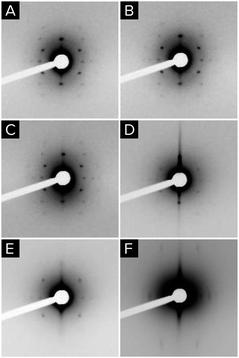
In order to obtain further insight into the formation of the different phases, in situ 2D-SAXS measurements were performed. The diffraction patterns of a Zr0.5Ce0.5O2 thin film were measured immediately following film deposition and at intervals during the successive steps employed in T2 and T3 treatments. Treatment times between those of T2 and T3 were also investigated (Fig. 3). The first measurement, performed about 1 minute after deposition, showed that Im![[3 with combining macron]](https://www.rsc.org/images/entities/char_0033_0304.gif) m order takes place immediately. This contradicts previous studies in which KLE is used as the template, which suggests that mesostructure formation when using the Pluronic copolymer family is too slow to stabilize the mesohybrid during hydrolysis.25 The patterns taken after 10 h at 50% HR and after 8 h at 130 °C confirm that long-range order is preserved, but it has to be noted that the intensity is diminished after the first thermal treatment at 60 °C. The uniaxial contraction of the film is evidenced by the increase in the diffraction angle of the reflection associated with the (110) planes. Even after 2 h at 200 °C, the diffraction spots of the Im
m order takes place immediately. This contradicts previous studies in which KLE is used as the template, which suggests that mesostructure formation when using the Pluronic copolymer family is too slow to stabilize the mesohybrid during hydrolysis.25 The patterns taken after 10 h at 50% HR and after 8 h at 130 °C confirm that long-range order is preserved, but it has to be noted that the intensity is diminished after the first thermal treatment at 60 °C. The uniaxial contraction of the film is evidenced by the increase in the diffraction angle of the reflection associated with the (110) planes. Even after 2 h at 200 °C, the diffraction spots of the Im![[3 with combining macron]](https://www.rsc.org/images/entities/char_0033_0304.gif) m space group are still visible, although large dispersion appears at very low angles and the spots are less evident. Comparing these results with those obtained after thermal treatment at 350 °C, it is apparent that T2 and T3 treatments destroy long-range order during the final calcination. Nevertheless, the existence of scattering at very low angles suggests that inhomogeneity develops at scales larger than that of the mesopores, which is consistent with the FE-SEM images of samples prepared through T1 and T2 treatments.
m space group are still visible, although large dispersion appears at very low angles and the spots are less evident. Comparing these results with those obtained after thermal treatment at 350 °C, it is apparent that T2 and T3 treatments destroy long-range order during the final calcination. Nevertheless, the existence of scattering at very low angles suggests that inhomogeneity develops at scales larger than that of the mesopores, which is consistent with the FE-SEM images of samples prepared through T1 and T2 treatments.
2.5 Porosity depends on treatment but not on composition
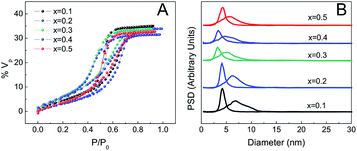
The porosity of the MPTF was studied by EEP using water as the adsorbent. Due to increased optical contrast between film and substrate, silicon was used as a support for these experiments. Fig. 4 shows the adsorption isotherms for films of different compositions prepared using T1. Type IV isotherms with H2 type hysteresis loops are observed in all cases, which are consistent with mesoporous systems formed by mesopores joined by restrictions.33Table 1 lists several structural parameters obtained by EEP as the pore and neck size, and the adsorbed volume (% Vad), the interplane distances obtained by 2D-SAXS, and composition measured by EDS. All films show highly accessible porous volumes between 31 and 35%. The pore and neck diameter are about 6 and 4 nm respectively and vary little with composition. Films prepared using longer treatments involving exposure to a controlled relative humidity of 50% (T2 and T3) show higher porous volume, close to 50%. Pore and neck diameters are also larger in these cases, around 10 and 6 nm, and having a broader size distribution (Fig. S5†). Final compositions determined using EDS agree very well with the molar ratios used to prepare the precursor solutions.
| x | dporea/nm | dnecka/nm | d![[1 with combining macron]](https://www.rsc.org/images/entities/char_0031_0304.gif) 10b/nm 10b/nm |
% Vporc | Ce/(Zr + Ce)d |
|---|---|---|---|---|---|
a Pore and neck sizes as measured by EEP.b (![[1 with combining macron]](https://www.rsc.org/images/entities/char_0031_0304.gif) 10) interplane distances obtained from the low-angle incidence (4°) 2D-SAXS patterns.c Porous volume as measured by EEP.d Cerium molar ratio measured by EDS. 10) interplane distances obtained from the low-angle incidence (4°) 2D-SAXS patterns.c Porous volume as measured by EEP.d Cerium molar ratio measured by EDS. |
|||||
| 0.1 | 6.6 | 4.0 | 13.1 | 35 | 0.110 ± 0.007 |
| 0.2 | 6.0 | 4.2 | 13.4 | 34 | 0.20 ± 0.01 |
| 0.3 | 5.0 | 3.2 | 13.2 | 34 | 0.294 ± 0.003 |
| 0.4 | 5.2 | 3.2 | 13.2 | 31 | 0.39 ± 0.02 |
| 0.5 | 5.6 | 3.8 | 13.2 | 33 | 0.48 ± 0.01 |
2.6 Ceria stabilizes zirconia sols
The stability of the sols was studied through aging experiments. Films were cast at different times ranging from 15 minutes up to 168 h (one week) after sol preparation. The sols were prepared and stirred at 25 °C for the duration of the experiment. The films were cast on soda glass slides at withdrawal speeds of 1 mm s−1 and subjected to T1 thermal treatment, followed by calcination at 350 °C. The MPTF were further studied by EPA and 2D-SAXS.An Im![[3 with combining macron]](https://www.rsc.org/images/entities/char_0033_0304.gif) m structure was observed for all the compositions and aging times studied. 2D-SAXS patterns were completely equivalent for all aging times (Fig. S6†), the only difference being a slight increase in the inter-planar distance for longer aged sols. Similar experiments performed using pure zirconia sols aged for longer than 72 h showed that the obtained films only present short range order. We believe that during aging, larger zirconium–cerium clusters form and grow, up to the point where stable structures are formed. The nature and size of these clusters depends on the concentration of metal ions, complexing agents, water and acids. The clusters initially grow, forming thicker walls that result in slightly larger inter-planar distances. The presence of cerium, with lower charge than zirconium, changes the nature of these clusters, producing smaller stable clusters that can be better accommodated around the micelles during the EISA process than those of pure zirconium.
m structure was observed for all the compositions and aging times studied. 2D-SAXS patterns were completely equivalent for all aging times (Fig. S6†), the only difference being a slight increase in the inter-planar distance for longer aged sols. Similar experiments performed using pure zirconia sols aged for longer than 72 h showed that the obtained films only present short range order. We believe that during aging, larger zirconium–cerium clusters form and grow, up to the point where stable structures are formed. The nature and size of these clusters depends on the concentration of metal ions, complexing agents, water and acids. The clusters initially grow, forming thicker walls that result in slightly larger inter-planar distances. The presence of cerium, with lower charge than zirconium, changes the nature of these clusters, producing smaller stable clusters that can be better accommodated around the micelles during the EISA process than those of pure zirconium.
2.7 The films are chemically homogeneous
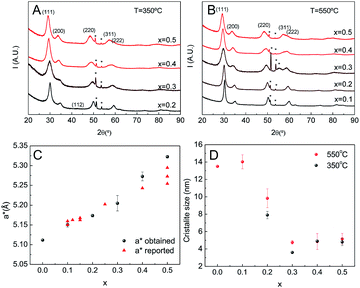
The chemical homogeneity of the films was further studied using GIXRD and HR-TEM. Films were deposited on silicon, subjected to T1 thermal treatment and calcined at 350 °C for 2 h. Their properties were studied both before and after a short treatment (30 minutes) at 550 °C. After calcination at 350 °C, all the samples with cerium molar ratios higher than 0.1 possessed diffraction patterns indicative of tetragonal or cubic zirconia (Fig. 5A). After heating at 550 °C all the samples, including those with 0.1 cerium content show reflections indicative of crystallinity (Fig. 5B). Despite the good data quality, the broadness of the peaks and relatively low intensity made a clear distinction between cubic (Fm![[3 with combining macron]](https://www.rsc.org/images/entities/char_0033_0304.gif) m) and tetragonal (P42/nmc) crystalline phases impossible. Based on our results from pure zirconia films and other reported data, Rietveld analysis was performed using the tetragonal space group. Comparing the patterns of these samples, it was observed that the position of the reflections consistently shifted to lower angles as the Ce proportion increased. This is expected for a solid solution as part of the smaller Zr(IV) is replaced by the larger Ce(III). The cell parameters extracted from the fittings are presented on Fig. 5C, together with published data.34–37 The linear relationship between cell volume and composition constitutes incontrovertible evidence of the formation of a complete solid solution across the entire compositional range without phase segregation. This result is supported by the absence of reflections from other phases. The c/a parameter is consistently larger than 1, indicating that a t′ tetragonal phase is obtained. EDS and HR-TEM experiments showed a homogeneous material density throughout the sample, without signs of ceria and zirconia segregation. However, small inhomogeneities in the composition at the nanoscopic lever are possible.38
m) and tetragonal (P42/nmc) crystalline phases impossible. Based on our results from pure zirconia films and other reported data, Rietveld analysis was performed using the tetragonal space group. Comparing the patterns of these samples, it was observed that the position of the reflections consistently shifted to lower angles as the Ce proportion increased. This is expected for a solid solution as part of the smaller Zr(IV) is replaced by the larger Ce(III). The cell parameters extracted from the fittings are presented on Fig. 5C, together with published data.34–37 The linear relationship between cell volume and composition constitutes incontrovertible evidence of the formation of a complete solid solution across the entire compositional range without phase segregation. This result is supported by the absence of reflections from other phases. The c/a parameter is consistently larger than 1, indicating that a t′ tetragonal phase is obtained. EDS and HR-TEM experiments showed a homogeneous material density throughout the sample, without signs of ceria and zirconia segregation. However, small inhomogeneities in the composition at the nanoscopic lever are possible.38
The crystallite size, as estimated using the Debye–Scherrer equation, is presented for all samples in Fig. 5D. For all temperatures the crystallite size was smaller for higher cerium content materials. In films treated at 350 °C, the crystallite size was independent of composition for cerium molar ratios equal to and greater than 30%. After heating at 550 °C, changes in the crystallite size of films with cerium molar ratios equal to and less than 0.3 was observed. For films not containing Ce and those with a Ce molar ratio of 0.1 the onset of crystallization was observed. The typical crystallite sizes were around 14 nm, while the crystallite size of films with Ce molar ratio of 0.2 and 0.3 increase from 8 to 10 nm and from 3 to 5 nm respectively. Interestingly, the crystallite size of films with higher ceria content did not change at all on heating. Although this dependence on cerium content has been reported previously, it has been observed here that the inclusion of cerium favors the formation of small crystallites around 350 °C and these do no evolve even after heating at 650 °C.25
2.8 The porosity is maintained at high temperatures
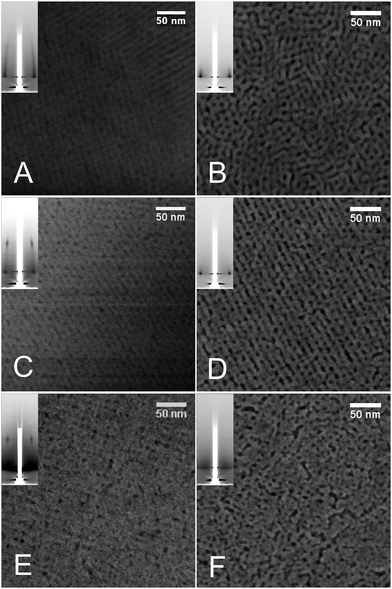
High temperatures produce crystallization of oxides and the associated structural rearrangements can severely degrade the mesopore ordering of the thin films. We studied the structural behavior at moderately high temperatures for films supported on silicon prepared using T1 treatment and calcined at 350 °C. The films were exposed to preset temperatures of 550 and 650 °C for periods of 30, 60 and 180 minutes. The porosity, pore order and crystalline structure of pore walls were studied using a combination of GIXRD, FE-SEM, EPA and GI-SAXS.FE-SEM images of the films surfaces confirmed that the films maintained porosity even after prolonged treatment at 650 °C (Fig. 6). It seems that the films with lower ceria proportion preserve the mesopore order, while those of higher ceria contents partially lose it. Indeed, after 180 min at 650 °C in air, GISAXS diffraction patterns of cerium-poor films show strong diffraction of the (![[1 with combining macron]](https://www.rsc.org/images/entities/char_0031_0304.gif) 10) reflection, while those of cerium-rich samples barely showed any periodicity.
10) reflection, while those of cerium-rich samples barely showed any periodicity.
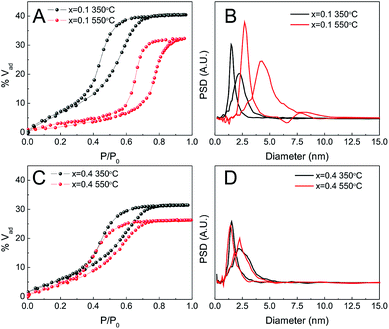
Fig. 7 shows the porosity of films before and after the treatment at 550 °C. The adsorption isotherms of samples with x = 0.1 (Fig. 7A) and x = 0.2 (not shown) changed from type IV with H2 hysteresis loops, characteristic of pores connected via constrictions, to type IV with H1 loops, characteristic of cylindrical or slit-like pores. The onset of adsorption and desorption branches was also shifted to higher pressures, suggesting a pore size increase (Fig. 7B). This change in the isotherm shape is well known in nanocrystalline mesoporous materials and is likely due to contraction of the films that produces pore fusion on the planes perpendicular to the substrate which in turn results in slit-shaped pores and a grid-like texture on the surface.39,40 When x > 0.2, this change is no longer observed although a small decrease in adsorption volume due to contraction can be noted (Fig. 7C and D).
2.9 The influence of temperature on crystallinity depends on ceria contents
The evolution of the crystalline structure with temperature and time was studied using GIXRD (Fig. 8). As previously noted, for samples treated only up to 350 °C there is a significant difference in crystallinity between low and high ceria contents. Films with x = 0.1 are amorphous (Fig. 5 and 8), while films with x ≥ 0.2 show diffraction signals. On heating, the low Ce content samples crystallize as evidenced by the onset of sharp reflections in the diffractograms. Indeed, for all thermal treatments the peak width of x = 0.1 is the smallest of all compositions. For all the samples, the breadth of the various reflections diminishes with longer thermal treatments, indicating only a small increase in the crystalline domain size after the onset of crystallization. The breadth is also consistently smaller for higher treatment temperatures, indicating that the maximum temperature reached influences the crystalline domain size more than the duration of such treatment. It is interesting that the compositions which show a greater atomic scale rearrangement only show a small mesoscopic perturbation. As previously shown (Fig. 6), the FE-SEM and GISAXS indicate that films with low Ce content preserve the morphology although the change in the XRD pattern is dramatic (Fig. 8). On the other hand, after flash treatments films with high Ce contents show a higher initial degree of crystallinity and possess larger peak widths than films with lower Ce contents. That the morphology of the films is also affected suggests a significant structural reorganization.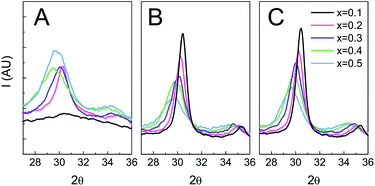 | ||
| Fig. 8 GIXRD of Zr1−xCexO2 treated at different temperatures. (A) T = 350 °C; (B) T = 650 °C 30 min; (C) T = 650 °C 3 h. | ||
The reflections present in the XRD patterns and the associated cell parameters are independent of flash treatment, indicating that no phase segregation occurs.
The changes in crystalline domain size for different treatments and composition also provide valuable information on the effect of temperature. When the Ce content of the film is high, the crystalline domain size remains the same and small (∼5 nm) for both tested temperatures. On the contrary, when the cerium content is low, crystallinity is not observed until the samples are treated at 550 °C, whereupon the crystalline domain sizes are at least three times larger. SAED experiments (see Fig. S7†) reveal that films with low Ce contents are barely crystalline after treatment at 350 °C, showing only weak diffuse halos. In contrast, the SAED of films heated to 550 °C show well defined rings with bright spots. The presence of well defined spots suggests that large crystallites exist in the sample. On the contrary, SAED of samples with equal proportion of Zr and Ce exhibit wide homogeneous rings, indicating that the material is composed of multiple small crystalline domains. Indeed, HRTEM images (Fig. 9) confirm that films with low Ce content have a very low degree of crystallization before heating at 550 °C, whereas after this thermal treatment large crystalline domains are observed. Images of films with equal ratios of Ce and Zr show small crystalline domains throughout the sample for both thermal treatments. The fact that properly oriented crystalline planes are found throughout the image confirms that many crystallites with multiple orientations exist within the field of view.
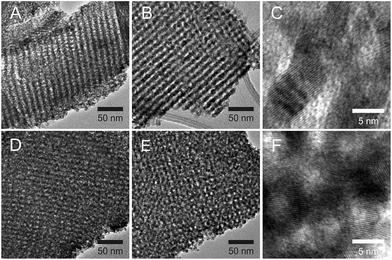 | ||
| Fig. 9 HR-TEM of Zr0.9Ce0.1O2 films treated at 350 °C (A) and 550 °C (B and C) and of Zr0.5Ce0.5O2 films treated at 350 °C (D) and 550 °C (E and F). | ||
It can be hypothesized that from certain Ce content, stable clusters of defined Ce molar ratio form and that these dictate the behavior of the films. The stability of these clusters would explain the inert nature of the sols (vide supra), the higher initial crystallinity of Ce-rich films and the fact that further crystallization is inhibited. It is also possible that Ce preferentially migrates to the surface of the crystallites, stabilizing the interface. In these cases, small inhomogeneities in the composition could exist at the nm scale. The higher ionic mobility in the crystallite interface could favour material migration, leading to larger morphological changes during heat treatments.
2.10 Optical properties are tuned through ceria content
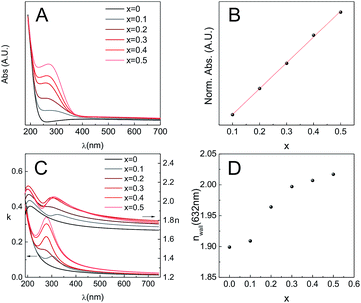
As mentioned previously, MPTF obtained through T1 are transparent and present high optical quality for all the compositions studied. In order to gain more information concerning the optical properties, films were deposited on fused silica substrates and then subjected to T1, with a final calcination step at 350 °C. The optical properties of the films were characterized by transmission UV-Vis spectrometry and spectroscopic ellipsometry (SE). Fused silica was used as a substrate in this case because it is transparent over a wide spectral range.UV-Vis spectra of all film compositions showed a band with a maximum at a wavelength between 270 and 290 nm, whose intensity increases with ceria content (Fig. 10A). Moreover, absorbance is linearly correlated (R2 = 0.9991) with the ceria content (Fig. 10B). For all compositions, this band was overlapped with a spectrum equivalent to that of a pure zirconia film (x = 0). The appearance of the ∼280 nm band and its linear increase with Ce content indicates that its origin is due to electronic transitions involving Ce centers. Indeed, it has been reported that this band can be assigned to Ce4+ ← O2− charge transfer transitions.41,42
The spectroscopic ellipsometry signal was modelled using a Cauchy–Lorentz relationship43 to describe the films refractive index (see ESI†). This dispersion relationship describes a dielectric material (Cauchy) with absorption at defined wavelengths. The different λmax obtained from UV-Vis spectroscopy were used as seeds to start the iterative modeling process. As shown in Fig. 10C, the extinction coefficient k follows the same trend observed by UV-Vis, which is a good indication that the ellipsometric model used for this system is robust. As k and n are bound variables that define the complex refractive index, after the iteration process both values are obtained. Considering that the MPTF is a mixture of Zr1−xCexO2 and the air contained in the pores, knowing the porosity, and using the Bruggeman effective medium approximation,44 it is possible to obtain the refractive index of the walls nwalls for each of the compositions studied (Fig. 10D). The reported refractive index for pure ceria thin films are in the range of 2.40–2.56, and previously reported results for zirconia thin films indicate that n550 = 2.1.45 Considering that sol–gel materials always present some degree of microporosity, which is not taken into account in the adsorbed volume found by EEP, the obtained refractive indexes here are in all cases lower than those reported for thin films when the material is obtained as a dense oxide. Nevertheless, the trend is the expected, i.e., n632 is higher when the films have higher ceria content.
Zirconia structures present a marked absorption in the UV range (5.3 to 5.7 eV, depending on the technique used), which corresponds to direct or indirect band gaps that are very similar in energy.46 In order to evaluate the effect of Ce(IV) doping on the energetics of the mesoporous film framework, we analyzed the absorption spectra in this high energy band gap region. The spectra were fit to the Tauc relationship for a direct band-gap,47 applied to both UV-Vis absorption and spectroscopic ellipsometry (SE) data. Eg values obtained from linear fitting in the high energy region are gathered in Table 2. An excellent coincidence is observed between the absorption and SE for the pure zirconia phase; the addition of Ce(IV) seems to have a complex impact in the energy gap of these materials. In recent work, it was observed that addition of Ce(IV) to zirconia leads to a monotonous shift of the band gap to lower energies (see Table 2).
| Composition (xCe) | Eg/eV (UV-Vis) | Eg/eV (SE) | Eg/eV (ref. 48) |
|---|---|---|---|
| 0.0 | 5.60 | 5.62 | 4.92 |
| 0.1 | 5.88 | 5.64 | 4.80 |
| 0.2 | 5.83 | 5.63 | 4.68 |
| 0.3 | 5.81 | 5.63 | 4.57 |
| 0.4 | 5.80 | 5.54 | 4.45 |
| 0.5 | 5.73 | 5.51 | 4.33 |
In the mesoporous and nanocrystalline thin film systems investigated here, the values of the direct zirconia Eg increase slightly (if measured by UV-Vis), or remain almost constant (SE) for cerium contents below 30%. Above these Ce(IV) contents, a decrease in the band gap is observed, in agreement with previous work.48 The band gap behaviour of the Zr-rich samples can be ascribed to an additional effect. In our systems, the presence of Ce ions in the oxides results in a significant decrease in the crystallite size (see Fig. 5), which can justify the Eg shift to higher energies due to confinement. Above 20–30% cerium substitution, the doping effect of the cation seems to prevail above the crystallite effect. In addition, the crystallite sizes in the case of our nanocrystalline and mesoporous mixed Zr–Ce oxides are in the range of 5–15 nm, which could explain the higher band gap energies of these mesoporous mixed oxides relative to the ca. 25 nm thick films epitaxially oriented, reported in ref. 48.
3 Conclusions
A rapid and simple method has been developed for deposition of Zr1−xCexO2 mesoporous thin films. The method relies in the adequate stabilization of the metal centers in the sol, and in a rapid thermal treatment after deposition, leading to chemically homogeneous solid solutions. When an optimized thermal treatment is used, the mesopore arrangement and dimensions are practically independent of the composition. On the other hand, initial crystallinity and thermally induced changes in morphology and crystallinity are strongly influenced by composition. Optical properties (i.e., band gaps and localized O2p → Ce4f transitions) are tunable with the Ce(IV) content, reflecting the changes in the electronic structure of the mixed oxides attainable through cation substitution. The films are stable at high temperatures, maintaining the mesoporosity at least up to 650 °C, potentially serving as a support for catalytic applications like water–gas-shift reaction, CO preferential oxidation and organic oxidations.7,49,50Acknowledgements
P. C. Angelomé is acknowledged for her participation in performing the in situ 2D-SAXS experiments and critically reading the manuscript. 2D-SAXS and some GIXRD experiments were performed thanks to LNLS projects 5353, SAXS1-15956 and XRD1-14555. This work was partly funded by grants PICT 2012-0852 and 2015-3526. I. L. Violi acknowledges a Conicet Doctoral fellowship. A. Z. and G. J. A. A. S.-I. are members of Conicet's scientific staff.References
- C. Ratnasamy and J. P. Wagner, Catal. Rev., 2009, 51, 325–440 CAS.
- P. Vernoux, L. Lizarraga, M. N. Tsampas, F. M. Sapountzi, A. De Lucas-Consuegra, J.-L. Valverde, S. Souentie, C. G. Vayenas, D. Tsiplakides, S. Balomenou and E. A. Baranova, Chem. Rev., 2013, 113, 8192–8260 CrossRef CAS PubMed.
- F. F. Tao and Z. Ma, Phys. Chem. Chem. Phys., 2013, 15, 15260 RSC.
- A. Trovarelli, M. Boaro, E. Rocchini, C. de Leitenburg and G. Dolcetti, J. Alloys Compd., 2001, 323–324, 584–591 CrossRef CAS.
- W. Deng, J. D. Jesus, H. Saltsburg and M. Flytzani-Stephanopoulos, Appl. Catal., A, 2005, 291, 126–135 CrossRef CAS.
- Catalysis by Ceria and Related Materials, ed. A. Trovarelli, Imperial College Press, 1st edn, 2002, vol. 2 Search PubMed.
- T. Montini, M. Melchionna, M. Monai and P. Fornasiero, Chem. Rev., 2016, 116, 5987–6041 CrossRef CAS PubMed.
- A. Trovarelli, Catal. Rev., 1996, 38, 439–520 CAS.
- T. Brezesinski, J. Wang, R. Senter, K. Brezesinski, B. Dunn and S. H. Tolbert, ACS Nano, 2010, 4, 967–977 CrossRef CAS PubMed.
- M. Pijolat, M. Prin, M. Soustelle, O. Touret and P. Nortier, J. Chem. Soc., Faraday Trans., 1995, 91, 3941 RSC.
- C. Janvier, M. Pijolat, F. Valdivieso, M. Soustelle and C. Zing, J. Eur. Ceram. Soc., 1998, 18, 1331–1337 CrossRef CAS.
- E. L. Crepaldi, G. J. D. A. A. Soler-Illia, A. Bouchara, D. Grosso, D. Durand and C. Sanchez, Angew. Chem., Int. Ed., 2003, 42, 347–351 CrossRef CAS.
- N. C. Strandwitz, S. Shaner and G. D. Stucky, J. Mater. Chem., 2011, 21, 10672 RSC.
- E. Aneggi, M. Boaro, C. de Leitenburg, G. Dolcetti and A. Trovarelli, J. Alloys Compd., 2006, 408–412, 1096–1102 CrossRef CAS.
- Y. Nagai, T. Nonaka, A. Suda and M. Sugiura, R&D Rev. Toyota CRDL, 2002, 37, 20–27 CAS.
- F. Esch, Science, 2005, 309, 752–755 CrossRef CAS.
- H.-F. Wang, Y.-L. Guo, G.-Z. Lu and P. Hu, Angew. Chem., Int. Ed., 2009, 48, 8289–8292 CrossRef CAS PubMed.
- Y. Ren, Z. Ma and P. G. Bruce, Chem. Soc. Rev., 2012, 41, 4909 RSC.
- P. Behrens, Adv. Mater., 1993, 5, 127–132 CrossRef CAS.
- A. Taguchi and F. Schüth, Microporous Mesoporous Mater., 2005, 77, 1–45 CrossRef CAS.
- C. T. Campbell, Science, 2005, 309, 713–714 CrossRef CAS PubMed.
- C. J. Brinker, Y. Lu, A. Sellinger and H. Fan, Adv. Mater., 1999, 11, 579–585 CrossRef CAS.
- D. Grosso, F. Cagnol, G. J. d. A. A. Soler-Illia, E. L. Crepaldi, H. Amenitsch, A. Brunet-Bruneau, A. Bourgeois and C. Sanchez, Adv. Funct. Mater., 2004, 14, 309–322 CrossRef CAS.
- V. Luca, G. J. Soler-Illia, P. C. Angelomé, P. Y. Steinberg, E. Drabarek and T. L. Hanley, Microporous Mesoporous Mater., 2009, 118, 443–452 CrossRef CAS.
- T. Brezesinski, M. Antonietti, M. Groenewolt, N. Pinna and B. Smarsly, New J. Chem., 2005, 29, 237–242 RSC.
- P. Hartmann, T. Brezesinski, J. Sann, A. Lotnyk, J.-P. Eufinger, L. Kienle and J. Janek, ACS Nano, 2013, 7, 2999–3013 CrossRef CAS PubMed.
- I. L. Violi, A. Zelcer, M. M. Bruno, V. Luca and G. J. A. A. Soler-Illia, ACS Appl. Mater. Interfaces, 2015, 7, 1114–1121 CAS.
- D. M. Pickup, G. Mountjoy, G. W. Wallidge, R. Anderson, J. M. Cole, R. J. Newport and M. E. Smith, J. Mater. Chem., 1999, 9, 1299–1305 RSC.
- J. Livage, M. Henry and C. Sanchez, Prog. Solid State Chem., 1988, 18, 259–341 CrossRef CAS.
- A. Bensalem, F. Bozon-Verduraz, M. Delamar and G. Bugli, Appl. Catal., A, 1995, 121, 81–93 CrossRef CAS.
- A. Zelcer and G. J. A. A. Soler-Illia, J. Mater. Chem. C, 2013, 1, 1359–1367 RSC.
- M. P. Tate, V. N. Urade, J. D. Kowalski, T.-c. Wei, B. D. Hamilton, B. W. Eggiman and H. W. Hillhouse, J. Phys. Chem. B, 2006, 110, 9882–9892 CrossRef CAS PubMed.
- M. Thommes, Chem. Ing. Tech., 2010, 82, 1059–1073 CrossRef CAS.
- M. Yashima, T. Hirose, S. Katano, Y. Suzuki, M. Kakihana and M. Yoshimura, Phys. Rev. B: Condens. Matter Mater. Phys., 1995, 51, 8018–8025 CrossRef CAS.
- D. G. Lamas, G. E. Lascalea, R. E. Juárez, E. Djurado, L. Pérez and N. E. Walsöe de Reca, J. Mater. Chem., 2003, 13, 904–910 RSC.
- R. O. Fuentes, L. M. Acuña, M. G. Zimicz, D. G. Lamas, J. G. Sacanell, A. G. Leyva and R. T. Baker, Chem. Mater., 2008, 20, 7356–7363 CrossRef CAS.
- R. O. Fuentes and R. T. Baker, J. Phys. Chem. C, 2009, 113, 914–924 CAS.
- R. Wang, P. A. Crozier, R. Sharma and J. B. Adams, J. Phys. Chem. B, 2006, 110, 18278–18285 CrossRef CAS PubMed.
- D. Grosso, G. J. d. A. A. Soler-Illia, E. L. Crepaldi, F. Cagnol, C. Sinturel, A. Bourgeois, A. Brunet-Bruneau, H. Amenitsch, P. A. Albouy and C. Sanchez, Chem. Mater., 2003, 15, 4562–4570 CrossRef CAS.
- I. L. Violi, M. D. Perez, M. C. Fuertes and G. J. A. A. Soler-Illia, ACS Appl. Mater. Interfaces, 2012, 4, 4320–4330 CAS.
- G. Ranga Rao and H. R. Sahu, J. Chem. Sci., 2001, 113, 651–658 CrossRef.
- M. Amimoto and M. Ozawa, IOP Conf. Ser.: Mater. Sci. Eng., 2011, 18, 222031 CrossRef.
- H. G. Tompkins and W. A. McGahan, Spectroscopic Ellipsometry and Reflectometry: A User's Guide, Wiley-Interscience, 1999 Search PubMed.
- D. A. G. Bruggeman, Ann. Phys., 1935, 416, 636–664 CrossRef.
- Z. W. Zhao, B. K. Tay, G. Q. Yu and S. P. Lau, J. Phys.: Condens. Matter, 2003, 15, 7707–7715 CrossRef CAS.
- H. Jiang, R. I. Gomez-Abal, P. Rinke and M. Scheffler, Phys. Rev. B: Condens. Matter Mater. Phys., 2010, 82, 045108 CrossRef.
- J. Tauc, Mater. Res. Bull., 1968, 3, 37–46 CrossRef CAS.
- O. Peña-Rodríguez, C. Sánchez-Valdés, M. Garriga, M. Alonso, X. Obradors and T. Puig, Mater. Chem. Phys., 2013, 138, 462–467 CrossRef.
- K. Wu, L.-D. Sun and C.-H. Yan, Adv. Energy Mater., 2016, 6, 1600501 CrossRef.
- M. Melchionna and P. Fornasiero, Mater. Today, 2014, 17, 349–357 CrossRef CAS.
Footnote |
| † Electronic supplementary information (ESI) available. See DOI: 10.1039/c7ra03647g |
| This journal is © The Royal Society of Chemistry 2017 |

