 Open Access Article
Creative Commons Attribution 3.0 Unported Licence
H-bond competition experiments in solution and the solid state†‡
James
McKenzie
a,
Neil
Feeder
b and
Christopher A.
Hunter
*a
aDepartment of Chemistry, University of Cambridge, Lensfield Road, Cambridge CB2 1EW, UK. E-mail: herchelsmith.orgchem@ch.cam.ac.uk
bThe Cambridge Crystallographic Data Centre, 12 Union Road, Cambridge CB2 1EZ, UK
First published on 21st December 2015
Abstract
The H-bonding outcomes in crystal structures of simple molecules, where two potential H-bonds can be formed, have been used to calculate relative H-bond probabilities for 59 combinations of H-bond donors and H-bond acceptors. H-bond probabilities are shown to correlate well with the difference in solution phase free energy between the two competing H-bonds.
Analysis of intermolecular contacts in the Cambridge Structural Database (CSD) has provided important fundamental insights into the nature of non-covalent interactions.1–7 The structural properties of functional group interactions in the solid state correlate well with ab initio calculations of interaction potentials in the gas phase and with solution phase spectroscopic properties, such as infrared bond stretching frequencies.8–15 Studies of intermolecular interactions in the solid state have focussed on geometrical properties that can be directly measured in X-ray crystal structures: interatomic distances, and the relative distributions of functional groups in three-dimensional space.16,17 However, the frequency distributions of functional group contacts in the CSD should also provide thermodynamic information about relative functional group interaction energies.18,19 In this paper, we show that experimentally determined solution phase H-bond parameters provide a good prediction of the probability of functional group interactions in the CSD. The results imply that the frequency distribution of functional group contacts in the CSD could provide a useful tool for the prediction of interaction energies in different environments.
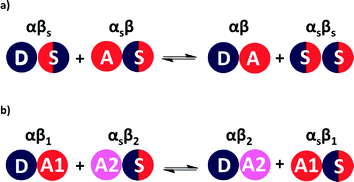
The relative stabilities of solution phase functional group interactions can be quantified using experimentally derived H-bond parameters, α and β (Fig. 1(a)).20 By summing over pairwise contacts between solvent and solute, the Gibbs free energy of complex formation, ΔG°, can be reliably estimated using eqn (1).
| ΔG° = − (α − αS)(β − βS) + 6 kJ mol−1 | (1) |
A similar approach can be used to estimate the difference in free energy between two different H-bonded complexes in solution (Fig. 1(b), eqn (2)). This H-bond competition experiment provides a convenient tool for tackling the relationship between solution phase and solid state interaction energies.
| ΔG°1 = −ΔG°2 = (α − αS)(β1 − β2) | (2) |
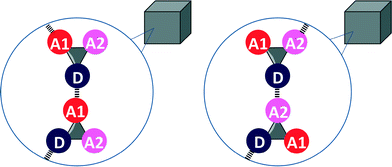
Eqn (2) and the frequency distribution of functional group interactions in the CSD can be used to compare the competition between two different H-bonding interactions in solution with the outcome of the competition between the same two interactions in the solid state. If we select molecules that contain one H-bond donor (D), two different H-bond acceptors (A1 and A2) and hydrocarbon only, then two different H-bonded states are possible in the solid state (Fig. 2). If sufficient X-ray crystal structure data are available for reliable statistics, the populations of the two different H-bonded states in the solid state should be related to the solution phase free energy for the competition equilibrium in a hydrocarbon solvent (Fig. 1(b)).
We therefore searched the CSD21 for molecules that contain only two functional groups, one of which is both a H-bond donor and a H-bond acceptor, and the other is only a H-bond acceptor. The frequency of occurrence of the two different H-bonds in the CSD was used to calculate the probability of H-bond formation in the solid state, pi (eqn (3)).
 | (3) |
The error in pi, εi, is given by eqn (4). For some systems, pi values of 1 and 0 were obtained, because one of the two H-bonds was never observed. For these systems, the error in pi cannot be estimated.
 | (4) |
Table 1 lists the functional groups studied in the H-bond competition experiments reported in this work. For each pair of functional groups in Table 1, the CSD was searched using a formula constraint to ensure that one of each functional group was present in the molecule with only a variable hydrocarbon skeleton connecting them. The criterion used to detect a H-bond was any contact between the specified atoms that was closer than the sum of the van der Waals radii, and the number of structures containing D·A1 and D·A2 H-bonds was recorded (see ESI†).
| Functional groups | α | β |
|---|---|---|
| Alcohol | 2.7 | 5.3 |
| Phenol | 3.6 | 3.0 |
| Secondary alkyl amide | 2.9 | 8.1 |
| Secondary alkyl aniline | 2.1 | 4.4 |
| Secondary sulphonamide | 3.1 | 5.9 |
| Pyrrole | 3.0 | 3.9 |
| Carboxylic acid | 3.6 | 4.9 |
| Ketone | 5.8 | |
| Nitrile | 5.0 | |
| Alkyl ether | 5.5 | |
| Aryl ether | 3.1 | |
| Ester | 5.4 | |
| Tertiary sulphonamide | 6.0 | |
| Sulphone | 6.2 | |
| Tertiary amine | 7.8 | |
| Sulphoxide | 8.6 | |
| Trialkyl phosphine oxide | 10.7 | |
| Pyridine | 7.4 | |
| N,N-Dialkyl carbamate | 7.2 | |
| N,N-Diaryl carbamate | 6.1 | |
| Nitroalkane | 3.8 | |
| N,N-Dialkyl aniline | 4.6 |
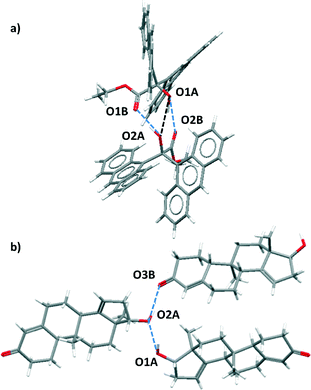
For certain functional group combinations the same crystal structure was retrieved in searches for D·A1 and for D·A2, i.e. the crystal contained both possible H-bonds. These structures were checked manually for artefacts. For example, Fig. 3 shows two results where both interactions were found in the competition experiment between a ketone acceptor and an alcohol acceptor for an alcohol donor. In Fig. 3(a), the presence of two ketone–alcohol H-bonds (O1A·O2B and O1B·O2A) forces the alcohol oxygens (O1A and O2A) into close proximity, so that the interatomic distance is shorter than the sum of the van der Waals radii. There is no hydrogen atom between O1A and O2A, so this H-bond was removed as a hit from the search. In contrast Fig. 3(b) shows that in a different structure both ketone–alcohol (O3B·O2A) and alcohol–alcohol (O1A·O2A) H-bonds are present.
The values of pi calculated from the CSD data can be compared with the free energy change for the corresponding solution phase competition experiment, ΔG°i. The values of solution phase H-bond parameters for a specific functional group vary with substituent (see ESI†). We therefore used a database of experimentally derived H-bond parameters to obtain generic values of α and β for each functional group, and these values were used in eqn (2) to calculate the free energy change for the solution phase H-bond competition experiment in a hydrocarbon solvent.22 The α value for the solvent was chosen as 0.7 (the average value of α for an aliphatic CH and an aromatic CH, which are 0.4 and 1.0 respectively). The results are not very sensitive to the precise value used as hydrocarbon is a very weak competitor for H-bonds. The results are compared with the corresponding H-bond frequency distribution in the solid state in Fig. 4. The 59 different functional group combinations studied produce 118 data points in Fig. 4, because each competition experiment gives two results, p1 and p2.
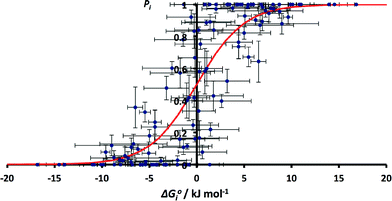 | ||
| Fig. 4 Relationship between ΔG°i and pi for all functional group combinations in Table 1 (RMSE = 0.20). The red line corresponds to the Boltzmann distribution in eqn (5). | ||
Although there is considerable scatter in Fig. 4, there is a clear correlation between the solution phase ΔG°i values and solid state pi values. If the frequency distribution of solid state H-bond interactions were determined by the solution phase free energy change for the competition experiment, then we would expect a Boltzmann distribution according to eqn (5). Eqn (5) is represented by the red line in Fig. 4.
 | (5) |
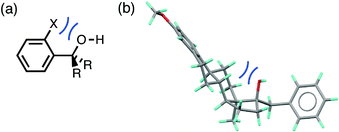
The root mean square error between the theoretical line and the experimental data in Fig. 4 is large (RMSE = 0.20). One of the outliers in Fig. 4 is the competition of an alcohol H-bond for an alcohol H-bond acceptor and an aryl ether H-bond acceptor. The alcohol–alcohol H-bond is 3 kJ mol−1 more stable that the alcohol-aryl ether H-bond according to the solution phase H-bond parameters, but the populations of these H-bonds in the CSD are equal (52% and 48% respectively, see ESI†). Fig. 5 illustrates some of the structures in the CSD that give rise to this behaviour. Of the 22 structures that contain an alcohol-aryl ether H-bond 9 have the generic structure shown in Fig. 5(a). In these structures, the C–OH bond is coplanar with the aromatic ring, which sterically blocks H-bond donors from interacting with the alcohol lone pairs. Fig. 5(b) shows another example where a rigid polycyclic ring structure sterically blocks the alcohol group from acting as a H-bond acceptor. This outlier in Fig. 4 is therefore due to a small number of structures with particular steric properties. This is a general problem with functional group combinations that yielded a relatively small number of hits in the CSD search.
The issue of poor sampling can be addressed by combining data from different searches. Fig. 4 compares the number of H-bonds observed in the CSD with solution phase H-bond free energy differences for specific functional group combinations. However, some functional group combinations have very similar values of ΔG°i. It is therefore possible to pool the CSD data from different searches by combining the results for solid state H-bond competition experiments with similar solution phase values of ΔG°i. The values of pi were therefore recalculated by summing the values of Ni for all systems where the values of ΔG°i fall within a 2 kJ mol−1 window. The results are shown in Fig. 6. The agreement between the frequency distribution of H-bonding interactions in the solid state and solution phase H-bond free energies is significantly better than obtained for the raw data in Fig. 4.
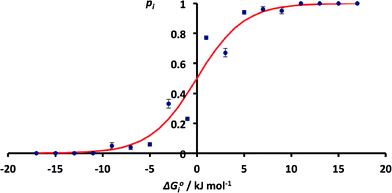 | ||
| Fig. 6 Relationship between ΔG°i and pi obtained by summing H-bond populations over 2 kJ mol−1 windows in ΔG°i (RMSE = 0.07). The red line corresponds to the Boltzmann distribution in eqn (5). | ||
These results indicate that the solution phase H-bond parameters α and β provide an accurate indicator of the probability of forming a H-bonding interaction in the solid state. This observation is consistent with the success of cocrystal screening approaches based on this assumption.23–25 The results also suggest that the CSD could provide a valuable resource for quantifying the relative strengths of intermolecular functional group interactions. The frequency distributions of functional group contacts in the CSD are directly related to the corresponding interaction energies in solution and may ultimately be useful for calibration of intermolecular potentials for use in molecular modelling applications.
Acknowledgements
We acknowledge the financial support from the EPSRC though a CASE award scheme in collaboration with the Cambridge Crystallographic Data Centre.Notes and references
- J. Kroon and J. A. Kanters, Nature, 1974, 248, 667 CrossRef CAS.
- P. Murray-Rust and W. D. S. Motherwell, J. Am. Chem. Soc., 1979, 101, 4374 CrossRef CAS.
- R. Taylor and O. Kennard, J. Am. Chem. Soc., 1982, 104, 5063 CrossRef CAS.
- F. H. Allen, C. A. Baalham, J. P. M. Lommerse and P. P. Raithby, Acta Crystallogr., Sect. B: Struct. Sci., 1998, 54, 320 CrossRef.
- R. Taylor, Acta Crystallogr., Sect. D: Biol. Crystallogr., 2002, 58, 879 CrossRef.
- F. H. Allen and W. D. S. Motherwell, Acta Crystallogr., Sect. B: Struct. Sci., 2002, 58, 407 CrossRef.
- F. H. Allen and R. Taylor, Chem. Soc. Rev., 2004, 33, 463 RSC.
- S. L. Price and A. J. Stone, Mol. Phys., 1982, 47, 1457 CrossRef CAS.
- S. L. Price, A. J. Stone, J. Lucas, R. S. Rowland and A. E. Thornley, J. Am. Chem. Soc., 1994, 116, 4910 CrossRef CAS.
- J. P. M. Lommerse, A. J. Stone, R. Taylor and F. H. Allen, J. Am. Chem. Soc., 1996, 118, 3108 CrossRef CAS.
- F. H. Allen, C. A. Baalham, J. P. M. Lommerse, P. R. Raithby and E. Sparr, Acta Crystallogr., Sect. B: Struct. Sci., 1997, 53, 1017 CrossRef.
- J. P. M. Lommerse, S. L. Price and R. Taylor, J. Comput. Chem., 1997, 18, 757 CrossRef CAS.
- I. Nobeli, S. L. Price, J. P. M. Lommerse and R. Taylor, J. Comput. Chem., 1997, 18, 2060 CrossRef CAS.
- F. H. Allen, C. A. Baalham, J. P. M. Lommerse and P. R. Raithby, Acta Crystallogr., Sect. B: Struct. Sci., 1998, 54, 320 CrossRef.
- A. Novak, Struct. Bonding, 1974, 18, 177 CrossRef CAS.
- F. H. Allen, O. Kennard, D. G. Watson, L. Brammer, A. G. Orpen and R. Taylor, J. Chem. Soc., Perkin Trans. 2, 1987, S1–S19 RSC.
- T. Steiner, Angew. Chem., Int. Ed., 2002, 41, 48 CrossRef CAS.
- S. Miyazawa and R. L. Jernigan, Macromolecules, 1985, 18, 534 CrossRef CAS.
- M. J. Sippl, J. Mol. Biol., 1990, 213, 859 CrossRef CAS PubMed.
- C. A. Hunter, Angew. Chem., Int. Ed., 2004, 43, 5310 CrossRef CAS PubMed.
- F. H. Allen, Acta Crystallogr., Sect. B: Struct. Sci., 2002, 58, 380 CrossRef.
- C. S. Calero, J. Farwer, E. J. Gardiner, C. A. Hunter, M. Mackey, S. Scuderi, S. Thompson and J. G. Vinter, Phys. Chem. Chem. Phys., 2013, 15, 18262 RSC.
- D. Musumeci, C. A. Hunter, R. Prohens, S. Scuderi and J. F. McCabe, Chem. Sci., 2011, 2, 883 RSC.
- T. Grecu, C. A. Hunter, E. J. Gardiner and J. F. McCabe, Cryst. Growth Des., 2014, 14, 165 CAS.
- T. Grecu, H. Adams, C. A. Hunter, J. F. McCabe, A. Portell and R. Prohens, Cryst. Growth Des., 2014, 14, 1749 CAS.
Footnotes |
| † Electronic supplementary information (ESI) available: Conquest search methods, CSD data and solution phase H-bond functional group parameters. See DOI: 10.1039/c5ce02223a |
| ‡ Data Access. All data supporting this study are provided as supplementary information accompanying this paper. |
| This journal is © The Royal Society of Chemistry 2016 |

