 Open Access Article
Creative Commons Attribution 3.0 Unported Licence
Identifying and mapping chemical bonding within phenolic resin using secondary electron hyperspectral imaging†
Nicholas T. H.
Farr
 *ab,
Sameer F.
Hamad
a,
Euan
Gray
a,
Christopher M.
Magazzeni
c,
Fodio
Longman
a,
David E. J.
Armstrong
c,
Joel P.
Foreman
a,
Frederik
Claeyssens
a,
Nicola H.
Green
 ab and
Cornelia
Rodenburg
 a
a
aDepartment of Materials Science and Engineering, Sir Robert Hadfield Building, Mappin Street, University of Sheffield, UK. E-mail: nfarr1@sheffield.ac.uk
bInsigneo Institute for in Silico Medicine, The Pam Liversidge Building, Sir Robert Hadfield Building, Mappin Street, Sheffield, UK
cDepartment of Materials, University of Oxford, Parks Road, Oxford, UK
First published on 15th December 2020
Abstract
The distributions of methylene and ether bridges have been shown to impact the mechanical properties of phenolic resin. This work demonstrates the ability of the novel SEM based technique, secondary electron hyperspectral imaging (SEHI), to characterise and map methylene and ether bridges within phenolic resin at the nanoscale.
Phenolic resins are a group of the most versatile polymers ever formulated. Although they were first produced around 1907 and were consequently one of the first polymers commercially available, they have been in constant development and use ever since and are widely used in various applications.1 A recent review article highlighted the deployment prospects of phenolic resin and evaluated where future research should focus to further increase and improve the potential of phenolic resins for future industrial applications.2 The article highlighted that improving phenolic resin's heat resistance and reducing brittleness are key enablers to future deployment opportunities. Demands from the aerospace industry and other industries with challenging environmental conditions raise the requirement to improve the long-term high-temperature oxidation resistance of phenolic resin.3 Historical studies have long establishing how novel synthesis interventions can augment the material's properties by altering the macromolecular structure of phenolic resin.4,5
Research focused on increasing phenolic resin's thermal stability with the aim of producing ‘tougher’ forms of phenolic resin has shown success by optimising the distribution of voids in the resins.6 Alternative approaches to addressing known ‘brittleness issues’ within phenolic resin,7,8 have also shown success through the inclusion of substances such as, rubber, glass fibres and thermoplastic resins.9–11
Further work towards delivering ‘tougher’ phenolic resins has investigated altering the polymer network of the resin by changing the bonding ratios of methylene and ether bridges.12,13 This work has identified improvements to the efficiency of the resin's production process which also mitigate environmental concerns of current practice. It has been observed that the quantity of ether bridges forming within the resin increases when the F![[thin space (1/6-em)]](https://www.rsc.org/images/entities/char_2009.gif) :
:![[thin space (1/6-em)]](https://www.rsc.org/images/entities/char_2009.gif) P (formaldehyde
P (formaldehyde![[thin space (1/6-em)]](https://www.rsc.org/images/entities/char_2009.gif) :
:![[thin space (1/6-em)]](https://www.rsc.org/images/entities/char_2009.gif) phenol) ratio increases and, depending on processing conditions, high numbers of ether linkages14 reduce the strength of the cured resin.15
phenol) ratio increases and, depending on processing conditions, high numbers of ether linkages14 reduce the strength of the cured resin.15
Despite the improved functionality of such resin more efficient and potentially greener ways of improving toughness of phenolic resin have come from studies targeted at altering the polymer network of phenolic resin by changing the bonding ratios of methylene and ether bridges have also delivered tougher materials.12,13 The proportion of ether bridges rises with increases in the F![[thin space (1/6-em)]](https://www.rsc.org/images/entities/char_2009.gif) :
:![[thin space (1/6-em)]](https://www.rsc.org/images/entities/char_2009.gif) P (formaldehyde
P (formaldehyde![[thin space (1/6-em)]](https://www.rsc.org/images/entities/char_2009.gif) :
:![[thin space (1/6-em)]](https://www.rsc.org/images/entities/char_2009.gif) phenol) ratio, with an excessive amount of ether linkages14 reducing the strength of the cured resin.15 It is important to note that processing conditions are also influential on the final strength of the cured resin.
phenol) ratio, with an excessive amount of ether linkages14 reducing the strength of the cured resin.15 It is important to note that processing conditions are also influential on the final strength of the cured resin.
Fast acting catalysts reduce the resin's curing time and impart “void like” structures.6 This is in contrast to phenolic resins that are required to be produced free from voids which typically require intensive curing processes using multiple heating cycles.
Such processes carry the disadvantage of slower curing cycles that create extra formaldehyde emissions. Future optimisation of phenolic resin properties requires an understanding of how these processes affect the material's structure at the nanoscale. The ability to map chemical bonding changes at the nanoscale would enable polymer scientists to better construct and optimise processes’ designed to alter the bonding ratios of methylene and ether bridges observed in phenolic resin.
Secondary electron hyperspectral imaging (SEHI) is a novel technique built on SE spectroscopy and has been used for characterising the surface chemistry of innovative polymeric biomaterials.16 A scanning electron microscope's (SEM) ability to detect secondary electrons (SEs) emissions from a material sample is the basis for SEHI. A series of images collected from selected SE energy bands is constructed to form the SEHI images stacks. This is in contrast to a standard SEM which assembles a single image with SEs of all energies contributing to it. SEHI delivers novel characterisation insights by creating a wide-ranging SE spectral representation of the sample material. A number of research studies have demonstrated SEHI's effectiveness including; molecular orientation of organic electronic devices,17 semi-crystalline polymer mapping and natural materials nanostructure variations18 but has not yet been applied to the mapping of ether or methylene bridges.
This study focuses on analysing the chemical bonding structure of a form of phenolic resin, PR382. PR382 has recently been produced6 with the design aim of minimising losses in desirable mechanical properties which occur as a consequence of using typical current resin production processes. This is achieved by substituting a new faster curing, more cost effective and environmentally friendlier fast curing cycle based production process. Analysis of phenolic resin requires the ability to map the chemical bonding distribution within the resin through the application of the SEHI technique. The emphasis of this study is mapping and showing sensitivity to specific bonding mechanisms that are present within the phenolic resin sample post synthetic intervention, as an example of how the SEHI technique can provide an enhanced understanding of micron – nano scale structures. This work establishes that the voids created as the phenolic resin cures in response to a slow acting acid catalyst, are a focus for a high level of CO bonding attributable to ether bridge formation around the voids sites.
Materials and methods
Materials
In this study, the resole commercial phenolic resin Cellobond J2027X pre-polymer was used (supplied by Caleb Technical Products Ltd, UK). This kind of resin is usually available as a water-based controlled-viscosity resin, which can be cured either with the application of heat only using long cure cycle (3–4 days) or with the use of a strong acid catalyst, short cure cycle (3 h) at low temperature (∼60 °C). It is suitable for the fabrication of fibre composites by hand layup and resin transfer molding. Catalyst (Cellobond Phencat 382), supplied by the same company (Caleb Technical Products Ltd, UK), was used in this study. Phencat 382 is a relatively slow action acid catalyst (working life ∼4 h), which is activated at low temperature, typically 60–80 °C. It is an acid-based catalyst consisting of, C3–9-alkyl esters (75–90%) and phosphoric acid (10–25%) by weight. A short cure cycle was selected where the resole phenolic resin was initially mixed with slow action acid catalyst (Phencat 382) then decanted into the PTFE mold to be placed in an autoclave for polymerisation. The catalyst ratio was 5 wt% of the resin. Phenolic resin samples were fractured to allow for analysis of the cross-section of the material.Methods
Results and discussion
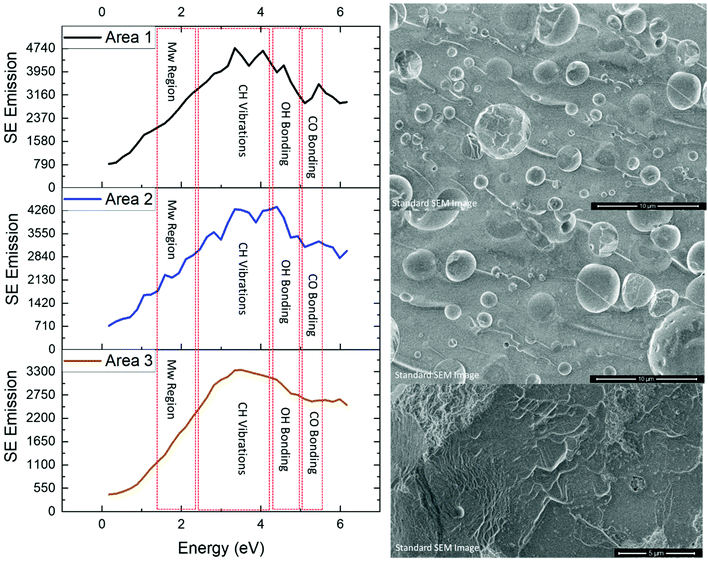
To illustrate the chemical bonding variations within PR382, SE spectra given in Fig. 1 represent spectra captured from three different areas (1, 2 and 3) across the cross-sectioned material. Each area's SEM field of view is included to show the exact region of analysis. Area 3 differs by virtue of its increased magnification which allows analysis of a single void site of interest.Previous studies have isolated the energy range of 1.4–2.3 eV to the molecular order of polymers.22 An increase in peak intensity in this range indicates an increased molecular order, indicative of the material being more crystalline. Areas 1 & 2 show a higher intensity level when compared to area 3. Area 3 is therefore disordered, as we do not observe any sharp peaks within 1.4–2.3 eV range. These observed differences are due to areas 1 and 2 both encompassing a greater density of cured cross-linked networks than that of area 3 which focuses on a singular void site.
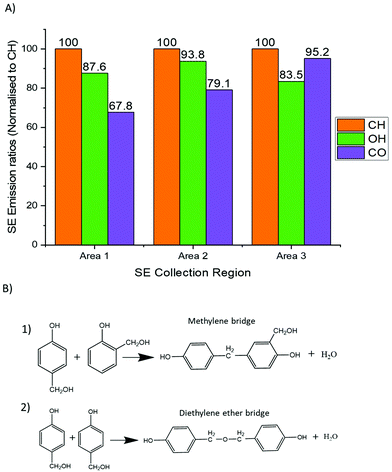
SE spectra analysis can provide for comparisons to be drawn regarding crosslinking networks. The SE emission captured in this study for areas 1 and 2 exhibited a greater SE emission in the energy range associated with CH vibrations and –OH groups16,23,24 when compared to that of area 3. The increase of CH2 and –OH formation in this polymer system indicates the presence of methylene bridges. Results obtained from the raw SE spectra display an increase in CH vibrations. The data given in Fig. 2A, shows an increase in –OH groups (when all areas are normalised to CH peak emission). These two results provide evidence to support the conclusion that areas 1 and 2 contain a greater density of methylene bridges than area 3.
All three areas show emissions within the SE emission region associated with C–O bonding. C–O bonding in area 3 displays the strongest emission ratios (when all areas are normalised to their respective CH emissions peak) compared to areas 1 and 2. As C–O bonding in phenolics is related to ether bridges (see Fig. 2B), area 3 possesses a large density of ether bridges compared to area 1 and 2. Fig. 2B shows the chemical bond formation of the two common types of crosslinks present within phenolic resin. Fig. 2B(1) depicts the various example structures of methylene bridges formation which is the most common form of crosslink with phenolic resin networks.15Fig. 2B(2) depicts the formation of ether bridges which are less commonly found within phenolic resin.
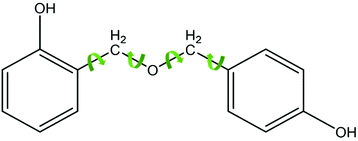
From the SE spectra results it can be assumed that this is consistent with areas 1 & 2 having a greater matrix (areas away from voids) concentration in the analysed field of view which will consequently have more (CH2, –OH) linked methylene bridges. Thus the SE spectra results show that areas 1 and 2 contain a higher density of methylene bridges than area 3 and also display a greater molecular order SE peak than area 3 compared to area 3. Methylene bridges possess a shorter bridging length when compared to that of ether bridges, which has a greater number of atoms between its phenyl rings. Therefore, phenolic resin with a greater ratio of methylene bridges to ether bridges would present a more ordered structure by virtue of ether bridges having a higher number of rotational degrees of freedom and being inherently flexible (see Fig. 3). The difference in chain length could also explain why there is a higher concentration of –OH detected as the phenyl rings appear more densely packed.
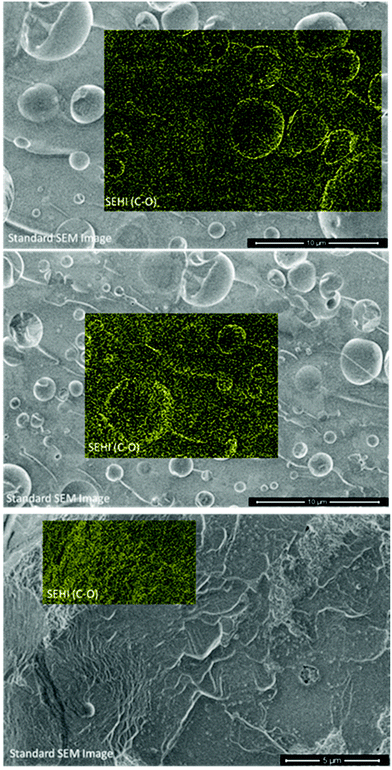
Various techniques have already shown that phenolic resin contains different ratios of methylene and ether bridges and this study's results above are not novel in that respect. However, by building on SE emission ranges obtained from the resulting SE spectra, it is now possible to use SEHI to map ether and methylene bridge spatial distributions on different length scales as demonstrated in Fig. 4 (and SI1†).
Fig. 4 shows SEHI images overlaid on standard SEM images to show the distribution of CO bonding. While the standard SEM image does not allow to determine the origin of the contrast associate with the voids, SEHI data enable component analysis to be performed on image stacks utilising non-negative matrix factorization (nnmf) to isolate components of interest (see ESI 1, 2 & 3†). The nnmf process gives a number of components which are derived in relation to the SE emission peaks of interest. Of particular importance to phenolic resin, nnmf isolated a region around 5–5.5 eV which has previously been shown to be a response to CO bonding.16,24 Therefore, this technique provides SEHI with the ability to map where ether bridges exist within the resin. SEHI images observes CO bonding emission to be most prominent around the edges of void sites. The mechanism of how ether bridges form around these voids is a subject for debate. The authors in this instance propose two potential mechanisms to be involved, but future work is required to fully understand this reaction.
One mechanism is based on the curing reaction of the resin itself: the structural inhomogeneity of “water/formaldehyde bubbles” is associated with density fluctuation that is related to crosslink density distributions that have been reported to exist within phenolic resin.25 In this case we propose that the inhomogeneous distribution of crosslinks can cause void trapping. As the water/formaldehyde bubbles form and migrate within the autoclave to the surface of the material, it is postulated that they become trapped by ether bridges developing around the edges of the voids. It has been long established that increasing the F![[thin space (1/6-em)]](https://www.rsc.org/images/entities/char_2009.gif) :
:![[thin space (1/6-em)]](https://www.rsc.org/images/entities/char_2009.gif) P molar ratios favours the production of ether bridges.14 As the voids sites predominantly contain water and formaldehyde, both by-products of previous crosslink reactions, it is suggested that voids sites have an increased localised F
P molar ratios favours the production of ether bridges.14 As the voids sites predominantly contain water and formaldehyde, both by-products of previous crosslink reactions, it is suggested that voids sites have an increased localised F![[thin space (1/6-em)]](https://www.rsc.org/images/entities/char_2009.gif) :
:![[thin space (1/6-em)]](https://www.rsc.org/images/entities/char_2009.gif) P ratio. This relationship would explain the ether bridge configuration around void sites as their formation is the preferred crosslink route.15
P ratio. This relationship would explain the ether bridge configuration around void sites as their formation is the preferred crosslink route.15
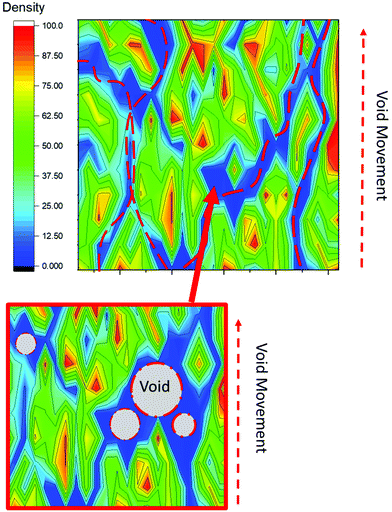
A proposed alternative mechanism is associated with the possibility that there is a preferred route for the water/formaldehyde bubbles take when attempting to leave the resin during curing.26 As the phenolic resin cures, the bubbles will leave the material by following a path of least resistance and therefore their migration will follow the least dense regions within the resin (see Fig. 5). Consequently, the voids will be concentrated away from areas of higher density molecular structures (strong methylene bridge content) and towards less dense molecular regions (strong ether bridge content). This is as a result of ether bridges containing a greater number of atoms between the anchoring phenol rings with intramolecular forces known to decrease rapidly with distance. Prior modelling studies have revealed that mass density fluctuations within phenolics are due to the inhomogeneous reactions described previously.27 These studies have observed density variations at the nano-scale but have encounter difficulties modelling at larger length scales. SEHI, being inherently multiscale in analysis, confirms the observed density variations in phenolic resin at the nano-micron scale and also provides evidence that they are dependent on inhomogeneous crosslinking reactions. Fig. SI4† supports the proposal that such variation observed in molecular density and crosslinking reactions does translates to large variations being exhibited in the nano-structural hardness of the resins.
Conclusions
The presented SEHI analysis and related SE spectra provide compelling evidence that a greater prevalence of C–O bonding exists in close proximity (∼50 nm) to void sites than the typical distribution observed within the matrix. This result can be explained to be the consequence of an increased incidence of ether bridges observed at such void sites. SEHI further revealed local variations in crosslinking and molecular order and functional groups (CH, OH) across the resin. Based on the demonstrated capability, SEHI is considered to be an ideal analysis tool with the capacity to isolate local variations in reactant remnants, such as formaldehyde, within phenolic resin.Conflicts of interest
The authors declare no conflict of interest.Acknowledgements
The authors thank EPSRC for funding under SEE MORE: Secondary Electron Emission-Microscopy for Organics with Reliable Engineering Properties (EP/N008065/1), and studentship for N. F. (EP/R513313/1). NF would also like to thank the Pico-FIB network for travel and collaboration funding. Electron microscopy and analysis was performed in the Sorby Centre for Electron Microscopy at the University of Sheffield.References
- K. Hirano and M. Asami, Phenolic resins—100years of progress and their future, React. Funct. Polym., 2013, 73(2), 256 CrossRef CAS.
- Y. Xu, L. Guo, H. Zhang, H. Zhaiab and H. Ren, Research status, industrial application demand and prospects of phenolic resin, RSC Adv., 2019, 50(9), 28924 RSC.
- S. Rapheepraew and E. Vuthichai, Synthesis of poly (siloxane/double-decker silsesquioxane) via dehydrocarbonative condensation reaction and its functionalization, Polymer, 2016, 86, 113 CrossRef.
- T. Holopainen, L. Alvila, J. Rainio and T. Pakkanen, Phenol–Formaldehyde Resol Resins Studied by 13C-NMRSpectroscopy, Gel Permeation Chromatography, and Differential Scanning Calorimetry, J. Appl. Polym. Sci., 1997, 66, 1183 CrossRef CAS.
- N. Gabilondo, M. López, J. A. Ramos, J. M. Echeverría and I. Mondragon, Curing kinetics of amine and sodium hydroxide catalyzed phenol-formaldehyde resins, J. Therm. Anal. Calorim., 2007, 90(1), 229 CrossRef CAS.
- S. Hamad, N. Farr, T. Fei, N. Shukor, J. Dean, S. Hayes, J. Foreman and C. Rodenburg, Optimizing size and distribution of voids in phenolic resins through the choice of catalyst types, J. Appl. Polym. Sci., 2019, 136, 48249 CrossRef.
- S. Hamad, N. Stehling, S. Hayes, J. Foreman and C. Rodenburg, Exploiting Plasma Exposed, Natural Surface Nanostructures in Ramie Fibers for Polymer Composite Applications, Materials, 2019, 12(10), 1631 CrossRef CAS PubMed.
- S. Q. Liu, P. C. Ning and Z. M. Ding, Research progress of modifed phenolic resin, Thermosetting Resin, 2016, 31, 64–70 Search PubMed.
- Z. Li, W. Zhou, L. Yang, P. Chen, C. Yan, C. Cai, H. Li, L. Li and Y. Shi, Glass Fiber-Reinforced Phenol Formaldehyde Resin-Based Electrical Insulating Composites Fabricated by Selective Laser Sintering, Polymers, 2019, 11, 135 CrossRef PubMed.
- X. M. Nie, Z. P. Gao and F. Q. Yi, Development of Phenolic Resin/Fiberglass Cloth Composite Prepreg Modified by Nitrile-Butadiene Rubber, Eng. Plast. Appl., 2019, 47, 42 Search PubMed.
- W. Solyman, H. Naguib, N. Alian, N. Shaker and U. Kandil, Synthesis and characterization of phenol/formaldehyde nanocomposites: Studying the effect of incorporating reactive rubber nanoparticles or Cloisite-30B nanoclay on the mechanical properties, morphology and thermal stability, J. Radiat. Res. Appl. Sci., 2016, 10(1), 72–79 CrossRef.
- J. Bouajila, G. Raffin, H. Waton, C. Sanglar and S. Alamercery, M.F Grenier-Loustalot, Phenolic Resins (II) – Influence of the Chemical Structure of High Molecular Weight Molecules on the Mechanisms of Cross-linking and on the Final Structure of the Resins, Polym. Polym. Compos., 2003, 11(4), 233–262 CAS.
- D. X. Wang, Z. M. Chen, G. X. Zhang, X. C. Liang, B. H. Li, X. Q. Cao and C. Wang, Study on Fast-Curing Phenol- Formaldehyde Resin Adhesive, Chem. Adhes., 2016, 38, 447 Search PubMed.
- P. W. King, R. H. Mitchell and A. R. Westwood, Structural analysis of phenolic resole resins, J. Appl. Polym. Sci., 1974, 18(4), 1117 CrossRef CAS.
- P. S. Parameswaran and E. T. Thachil, Int. J. Polym. Mater. Polym. Biomater., 2007, 56, 177 CrossRef CAS.
- N. Farr, S. Pashneh-Tala, N. Stehling, F. Claeyssens, N. Green and C. Rodenburg, Characterizing Cross–Linking Within Polymeric Biomaterials in the SEM by Secondary Electron Hyperspectral Imaging, Macromol. Rapid Commun., 2020, 41, 1900484 CrossRef CAS PubMed.
- Q. Wan, K. J. Abrams, R. C. Masters, A. C. S. Talari, I. U. Rehman, F. Claeyssens, C. Holland and C. Rodenburg, Adv. Mater., 2017, 29, 1703510 CrossRef PubMed.
- R. C. Masters, A. J. Pearson, T. S. Glen, F.-C. M. Sasam, L. Dapor, Li. A. M. Donald, D. G. Lidzey and C. Rodenburg, Sub-nanometre resolution imaging of polymer–fullerene photovoltaic blends using energy-filtered scanning electron microscopy, Nat. Commun., 2015, 6, 6928 CrossRef CAS PubMed.
- P. S. Kazemian, A. M. Mentink, C. Rodenburg and C.J. Humphreys, Quantitative secondary electron energy filtering in a scanning electron microscope and its applications, Ultramicroscopy, 2007, 107, 140 CrossRef CAS.
- J. Schindelin, I. Arganda-Carreras, E. Frise, V. Kaynig, M. Longair, T. Pietzsch, S. Preibisch, C. Rueden, S. Saalfeld, B. Schmid, J. Y. Tinevez, D. J. White, V. Hartenstein, K. Eliceiri, P. Tomancak and A. Cardona, Fiji: an open-source platform for biological-image analysis, Nat. Methods, 2012, 9, 676 CrossRef CAS PubMed.
- N. A. Stehling, R. Masters, Y. Zhou, R. O'Connell, C. Holland, H. Zhang and C. Rodenburg, New perspectives on nano-engineering by secondary electron spectroscopy in the helium ion and scanning electron microscope, MRS Commun., 2018, 8, 226 CrossRef CAS.
- R. C. Masters, N. Stehling, K. Abrams, V. Kumar, A. Schäfer, D. Lidzey and C. Rodenburg, Mapping Polymer Molecular Order in the SEM with Secondary Electron Hyperspectral Imaging, Adv. Sci., 2019, 6, 5 Search PubMed.
- K. J. Abrams, M. Dapor, N. Stehling, M. Azzolini, S. J. Kyle, J. S. Schäfer, A. Quade, F. Mika, S. Kratky, Z. Pokorna, I. Konvalina, D. Mehta, K. Black and C. Rodenburg, Making Sense of Complex Carbon and Metal/Carbon Systems by Secondary Electron Hyperspectral Imaging, Adv. Sci., 2019, 6, 19 Search PubMed.
- N. Farr, J. Thanarak, J. Schäfer, A. Quade, F. Claeyssens, N. Green and C. Rodenburg, Understanding surface modifications induced via Argon Plasma sterilisation through Secondary Electron Hyperspectral Imaging, Adv. Sci., 2020, 2003762 Search PubMed.
- Y. Shudo, A. Izumi, K. Hagita, T. Nakao and M. Shibayama, Large-scale molecular dynamics simulation of crosslinked phenolic resins using pseudo-reaction model, Polymer, 2016, 103, 261 CrossRef CAS.
- A. C. Loos and G. S. Springer, Curing of epoxy matrix composites, J. Compos. Mater., 1983, 17, 135 CrossRef CAS.
- Y. Shudo, A. Izumi, K. Hagita, T. Nakao and M. Shibayama, Structure-mechanical property relationships in crosslinked phenolic resin investigated by molecular dynamics simulation, Polymer, 2017, 116, 506 CrossRef CAS.
Footnote |
| † Electronic supplementary information (ESI) available. See DOI: 10.1039/d0py01220c |
| This journal is © The Royal Society of Chemistry 2021 |

