 Open Access Article
Creative Commons Attribution 3.0 Unported Licence
Unveiling the influence of alkaline modifiers in CuO synthesis on its photocatalytic activity for CO2 reduction†
Jéssica C.
de Almeida
 a,
Thais Aparecida
Rodrigues
a,
Gelson T. S. T.
da Silva
a,
Thais Aparecida
Rodrigues
a,
Gelson T. S. T.
da Silva
 b,
Caue
Ribeiro
 *c and
Vagner R.
de Mendonça
 *ad
*ad
aFederal University of São Carlos, Science and Technology Center for Sustainability, 18052-780, Sorocaba, SP, Brazil. E-mail: vrm@ifsp.edu.br
bInterdisciplinary Laboratory of Electrochemistry and Ceramics, Department of Chemistry, Federal University of Sao Carlos, São Carlos, São Paulo 13565-905, Brazil
cNanotechnology National Laboratory for Agriculture (LNNA), Embrapa Instrumentation, 13561-206, São Carlos, SP, Brazil. E-mail: caue.ribeiro@embrapa.br
dFederal Institute of Education, Science, and Technology of São Paulo – IFSP Campus Itapetininga, 18202-000, Itapetininga, SP, Brazil
First published on 12th July 2024
Abstract
The urgent quest for sustainable solutions to mitigate CO2 emissions underscores the critical role of advanced photocatalytic technologies. This investigation centers on developing CuO photocatalysts through a well-established chemical precipitation method. In this context, our methodological innovation lies in varying the alkaline composition using NaOH, KOH, NH4OH, and the novel incorporation of monoethanolamine (MEA) to explore their influence on the catalyst's effectiveness. The characterization revealed that all CuO samples shared a similar monoclinic structure and crystallite sizes despite marked differences in particle morphology and dispersion. MEA's introduction significantly altered the surface chemistry of CuO, introducing nitrogen-containing functional groups that enhanced photocatalytic CO2 reduction, particularly boosting methane production. Moreover, our study reveals a synergistic combination of MEA and KOH (MEA/KOH) in the catalyst synthesis process, surpassing the performance of single-alkali modifications. It is attributed to the rapid particle nucleation induced by KOH and the surface functionalization provided by MEA, cooperating to optimize the CO2 photoreduction activity. Our study provides valuable insights into synthesizing photocatalysts tailored for enhanced CO2 conversion, advancing sustainable technologies in the fight against climate change.
1. Introduction
The escalating global concern over greenhouse gas emissions, particularly carbon dioxide (CO2), has encouraged significant research towards the development of sustainable technologies for CO2 conversion. In this context, photocatalytic CO2 reduction has emerged as a promising approach for utilizing solar energy to transform CO2 into valuable chemicals and fuels.1–4 This process mimics natural photosynthesis by harnessing light irradiation to drive the conversion of CO2 molecules into usable products, offering a potential solution for mitigating climate change and achieving a circular carbon economy.Photoreduction is a heterogeneous photocatalysis process, a technique capable of driving reactions using light as an energy source.5,6 Applications include pollutants’ degradation, such as heavy metals, persistent organics, plastic waste, pathogenic bacteria, and gaseous pollutants.7–11 The photocatalyst, typically a semiconductor, captures light energy generating electron–hole pairs. These charge carriers participate in subsequent redox reactions at the catalyst's surface, such as reducing CO2 molecules adsorbed on the catalyst. At the same time, the holes oxidize water to produce oxygen (O2) or other sacrificial agents in the reaction medium. However, achieving efficient and selective photoreduction presents significant challenges.12 The inherent CO2 stability, characterized by its strong O![[double bond, length as m-dash]](https://www.rsc.org/images/entities/char_e001.gif) C
C![[double bond, length as m-dash]](https://www.rsc.org/images/entities/char_e001.gif) O linear double bonds, requires significant energy to initiate its reduction.13 It translates to the need for photocatalysts with suitable light absorption properties and efficient charge separation capabilities. Additionally, controlling the selectivity of the reaction towards products like methane (CH4) and ethane (C2H6) proves to be a complex task. Unwanted side reactions, e.g., hydrogen evolution (H2), can compete for photogenerated electrons, hindering the targeted conversion of CO2.14,15
O linear double bonds, requires significant energy to initiate its reduction.13 It translates to the need for photocatalysts with suitable light absorption properties and efficient charge separation capabilities. Additionally, controlling the selectivity of the reaction towards products like methane (CH4) and ethane (C2H6) proves to be a complex task. Unwanted side reactions, e.g., hydrogen evolution (H2), can compete for photogenerated electrons, hindering the targeted conversion of CO2.14,15
Copper oxide (CuO) has emerged as a promising photocatalyst since it possesses the highest electronegativity and highest number of alkaline sites for CO2 adsorption and a more favorable CO2 adsorption capability (ΔH = 45 kJ mol−1) compared to other transition metal oxides.14,16,17 However, the overall performance of CuO in CO2 reduction can be affected by various factors, including slight variations in particle size and surface chemistry that can compromise its effectiveness.18 Ávila-Lopez and colleagues19 illustrated how the synthesis methodology influenced the quantity of the formed products, employing three distinct configurations: powders produced in three synthesis routes, coating, and thin films. Tests revealed that the microwave-hydrothermal method produced 2.6 μmol gcat−1 h−1 of CH4, while sonochemically-produced catalysts led to 1.5 μmol gcat−1 h−1. The discrepancy between the films was noteworthy, wherein the coating, the amount of CH4 formed was 4.4 times of thin films. It underscores how altering the synthesis method, even under identical conditions, can significantly impact the obtained results. It can also influence CuO surface modification, altering the CO2 affinity over catalyst surfaces.20,21 Monoethanolamine (MEA) emerges as a promising modifier, leveraging its known ability to act as a CO2 adduct efficiently.22,23 This step is crucial for enhancing product selectivity.14
Several alternatives are employed to enhance the photocatalytic properties of a material, such as impurity doping,24 heterojunction construction,25 and alkali modification.26 Alkaline modification of the photocatalyst surface enhances the CO2 chemisorption capacity, as previously demonstrated for TiO2.26 In the context of the CuO catalyst, the effect of pH in the chemical precipitation synthesis process has already been studied with a focus on the mechanism of particle formation.27 The chemical precipitation route is commonly used to prepare CuO particles.28–31 During a typical synthesis, NaOH is usually employed to increase the pH and start the crystals’ nucleation.27,28,32 However, many factors can affect the size and morphology of the final material, the proportion of the reactants and temperature are some examples.28,33 Zhou et al. have achieved different CuO nanocrystal morphologies by changing the precursor Cu(NO3)2 to Cu(OAc)2 and the alkaline agent NaOH to Na2CO3 in the synthesis recipe.34
The novelty of this study lies in its systematic investigation of how different precipitation bases influence the photocatalytic activity and CO2 reduction selectivity of CuO. While chemical precipitation is a well-established synthesis method for CuO, it is a widely adopted approach in literature due to its simplicity, low energy, and temperature requirements, cost-effectiveness for large-scale production, and high product yield.31 The comparative analysis of these specific bases and their impact on photocatalytic performance, particularly in the context of photocatalysis, has not been extensively explored. The alkaline agents selected for this study were: sodium hydroxide (NaOH), potassium hydroxide (KOH), ammonium hydroxide (NH4OH), and monoethanolamine (MEA). The synthesized CuO samples were evaluated for their ability to convert CO2 into CH4 and C2H6.
Our findings revealed a remarkable distinction between the samples. Notably, CuO samples prepared using KOH (S-KOH) and MEA (S-MEA) displayed superior performance, achieving methane yields of 217 μmol g−1 and 173 μmol g−1, respectively. Interestingly, the S-KOH sample exhibited a higher number of overall CO2 reduction events, suggesting a more active catalyst surface. Conversely, the S-MEA sample demonstrated better selectivity towards CH4. In an attempt to synergize the benefits observed in both S-KOH and S-MEA samples, an additional CuO sample was prepared using a 1![[thin space (1/6-em)]](https://www.rsc.org/images/entities/char_2009.gif) :
:![[thin space (1/6-em)]](https://www.rsc.org/images/entities/char_2009.gif) 1 molar ratio of KOH and MEA precursors. This catalyst (S-MEA/KOH) showed promising features, combining the enhanced activity observed with S-KOH and the improved selectivity for CH4 production exhibited by S-MEA.
1 molar ratio of KOH and MEA precursors. This catalyst (S-MEA/KOH) showed promising features, combining the enhanced activity observed with S-KOH and the improved selectivity for CH4 production exhibited by S-MEA.
2. Experimental section
Synthesis
The catalyst synthesis methodology was adapted from Nogueira et al.35 In a typical synthesis, 1 mL of glacial acetic acid was added to 250 mL of an aqueous solution of 0.024 M copper acetate. The solution was heated to 90 °C under constant stirring. Subsequently, 50 mL of a 0.4 M solution of sodium hydroxide (NaOH) was added. The supernatant was removed, and the precipitate was dried at 60 °C. Modifications on this synthesis were conducted by replacing NaOH per alkaline solutions composed of NH4OH, KOH, and monoethanolamine (MEA). An additional sample named MEA/KOH was prepared with equimolar concentrations of MEA and KOH. The final base concentration for these samples was 67 mM. We also studied the MEA concentration, varying from 60 to 100 mM, to better evaluate the material capability.Characterization
The materials were characterized for their composition using X-ray diffraction (XRD), Fourier-transform infrared spectroscopy (FTIR), and X-ray photoelectron spectroscopy (XPS). Morphology was analyzed by scanning electron microscopy (SEM-FEG), transmission electron microscopy (TEM), and surface area was determined by N2 adsorption–desorption isotherms with Brunauer–Emmett–Teller (BET) calculation. The optical properties and band gap energies were determined by UV-vis diffuse reflectance spectroscopy (UV-vis DRS). Further details regarding the measurements and equipment used are provided in the ESI.†Photoreduction tests
The CO2 reduction photocatalytic activity was evaluated in a 150 mL quartz tube reactor equipped with a Teflon stopper, with 100 mL of deionized water and 50 mg of catalyst. The mixture was bubbled with high-purity CO2 gas for 20 minutes to ensure CO2 saturation and complete removal of oxygen. The quartz reactors were kept in a chamber containing 6 UVC lamps (Osram, 15 W, 254 nm) under constant stirring and a controlled temperature of 25 °C by a heat exchanger. After 5 hours of reaction, aliquots of 300 μL of the gaseous products were analyzed by Agilent 8860 gas chromatography equipped with a capillary HP-Plot Q (30 m × 530 μm × 40 μm) and HP-plot mole sieve (30 m × 530 μm × 25 μm) columns. A thermal conductivity detector (TCD) was used to detect H2, and a flame ionization detector (FID) with a methanizer was used to detect CO, CH4, C2H4, and C2H6. Argon was used as the carrier gas. Calculations were made based on standard gaseous mixture injections to determine product quantification and reaction yield.3. Results and discussion
Characterization
The crystalline phase composition of the synthesized materials, prepared using distinct alkaline solutions, was confirmed via XRD analysis, as shown in Fig. 1(a). The resulting diffractograms exhibited consistent patterns across all samples, with diffraction peaks indexed to the monoclinic CuO reference pattern from the Joint Committee on Powder Diffraction Standard (JCPDS) card no. 48-1548.36–38 Increasing the MEA concentration from 60 to 100 mM during the synthesis did not alter the sample composition, as evidenced by the diffractograms in Fig. S1 (ESI†). Although exhibiting identical diffraction patterns, the material's coloration was modified depending on the alkaline solution employed. S-KOH and S-NaOH samples exhibited a dark color, while samples S-NH4OH and S-MEA showed a matte brown color. This divergence in coloration can be attributed to differences in particle agglomeration size and morphology, induced by the use of strong or weak bases. The KOH and NaOH have strong alkaline properties, displaying considerable dissociation constants which lead to increased levels of hydroxide ions (OH−) and swift processes of nucleation and growth. On the other hand, NH4OH and MEA, which are categorized as weak bases, present comparatively lower dissociation constants, leading to reduced hydroxide ion concentrations and, consequently, slower particle formation.39 The MEA/KOH sample, synthesized using a mixture of strong and weak bases, exhibited optical characteristics intermediate between those observed with either strong or weak bases, suggesting a combined influence on particle formation kinetics.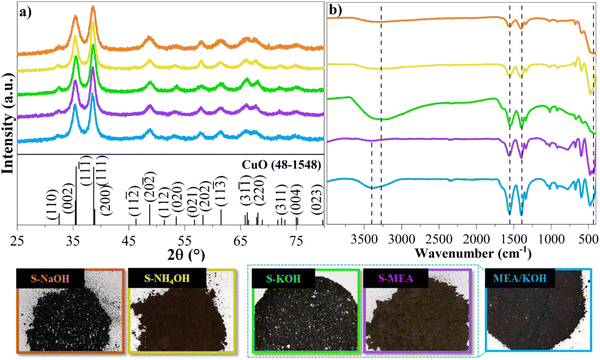 | ||
| Fig. 1 Photographic records of the S-KOH, S-NaOH, S-NH4OH, S-MEA, and MEA/KOH catalysts (67 mM), with their corresponding X-ray diffractograms in (a) and FTIR spectra in (b). | ||
FTIR analysis of the samples in Fig. 1(b) corroborates XRD findings, revealing the characteristic Cu(II)–O stretching vibration within the 400 to 600 cm−1 range, consistently observed across all samples.40 Additionally, the presence of asymmetric and symmetric stretching bands of C![[double bond, length as m-dash]](https://www.rsc.org/images/entities/char_e001.gif) O at 1561 cm−1 and 1391 cm−1, respectively, indicates acetate residues from the synthesis process.41 A broad OH stretching band at 3228 cm−1 is also observed, likely due to adsorbed water or surface hydroxyl groups. The S-MEA and MEA/KOH spectra exhibit an additional characteristic band at 3415 cm−1, assigned to N–H stretching vibrations originating from MEA functional groups, providing evidence for surface functionalization with MEA.42 The spectra of samples prepared with higher MEA concentrations, (Fig. S2, ESI†), exhibited additional bands at 2979 and 2876 cm−1, assigned to N–H and CH2 bonds originating from MEA functional groups. These bands further corroborate the surface functionalization.41
O at 1561 cm−1 and 1391 cm−1, respectively, indicates acetate residues from the synthesis process.41 A broad OH stretching band at 3228 cm−1 is also observed, likely due to adsorbed water or surface hydroxyl groups. The S-MEA and MEA/KOH spectra exhibit an additional characteristic band at 3415 cm−1, assigned to N–H stretching vibrations originating from MEA functional groups, providing evidence for surface functionalization with MEA.42 The spectra of samples prepared with higher MEA concentrations, (Fig. S2, ESI†), exhibited additional bands at 2979 and 2876 cm−1, assigned to N–H and CH2 bonds originating from MEA functional groups. These bands further corroborate the surface functionalization.41
XPS was employed to analyze the surface composition of the S-MEA sample. The survey spectrum (Fig. 2(a)) reveals the atomic percentages of the constituent elements, where elevated C percentage is attributed to the equipment calibration procedure. High-resolution spectra of Cu 2p3 (Fig. 2(b)) and O 1s (Fig. 2(c)) further elucidate the chemical state of these elements. The Cu 2p3 peak at 934.7 eV confirms the composition of CuO, where Cu acts as the active site during CO2 photoreduction.43 The O 1s spectrum exhibits contributions from oxide (22.7%), hydroxide (22.6%), and water (1.1%). The XPS results are consistent with the XRD and FTIR data, corroborating the formation of a CuO catalyst. The N 1s spectrum (Fig. 2(d)) displays a peak at 399.8 eV, attributed to C–N bonding, indicating nitrogen incorporation (0.8 atom%) on the catalyst surface.44,45
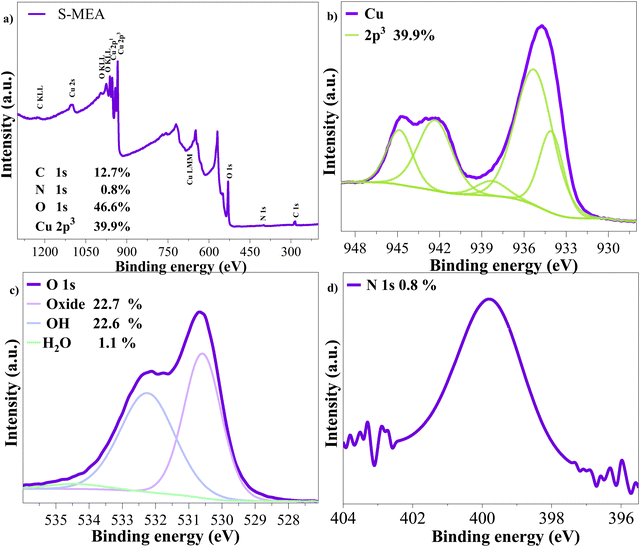 | ||
| Fig. 2 XPS analysis of the S-MEA sample: (a) survey spectrum showing the overall elemental composition, high-resolution spectrum of (b) Cu 2p3, (c) O 1s, and (d) N 1s. | ||
Zeta potential measurements, presented in Table 1, provide insights into the electrostatic surface charge of the prepared samples. Notably, samples containing amine compounds (S-MEA and MEA/KOH) exhibited a positive shift in zeta potential compared to those without amine groups (S-KOH and S-NH4OH). This observation supports the hypothesis of surface functionalization. The presence of these charged groups can significantly influence the material's interaction with its environment, potentially impacting its catalytic activity and selectivity.
| Sample | Zeta potential (mV) | Crystallite size (nm) | SSA (m2 g−1) |
|---|---|---|---|
| MEA/KOH | 35.7 | 6.0 | 52.7 |
| S-MEA | 43.4 | 7.0 | 61.7 |
| S-KOH | 26.4 | 5.2 | 28.6 |
| S-NH4OH | 43.4 | 6.0 | 77.0 |
| S-NaOH | 29.8 | 4.5 | 55.3 |
XRD measurements were used to calculate the crystallite size of the samples by the Scherrer eqn (1), as follows:9
 | (1) |
The crystallite sizes of the samples show variations depending on the base used during synthesis. The S-MEA sample exhibits the largest crystallite size (7.0 nm), while the S-NaOH sample has the smallest crystallite size (4.5 nm). Interestingly, samples prepared with strong bases (KOH and NaOH) tend to promote smaller crystallites on average compared to those prepared with weak bases (MEA and NH4OH). The MEA/KOH sample, exhibits an intermediate crystallite size (6.0 nm), suggesting a combined influence of both strong and weak base effects.
This variation is attributed to the different reaction kinetics that occur in the chemical environments of the distinct bases studied. The base plays a crucial role in controlling the concentration of hydroxide ions (OH−), which are essential reactants for the formation of CuO. The growth of CuO crystals proceeds through the following simplified reaction:27,33
| Cu2+ + 2OH− → CuO + H2O |
The concentration of OH− ions directly influences the rate of this reaction. Therefore, a higher concentration of OH−, as provided by strong bases, accelerates the reaction and favors rapid nucleation. However, this rapid consumption of reactants can limit the subsequent growth of the formed nuclei, resulting in smaller crystallites. Conversely, a lower concentration of OH−, as provided by weak bases, slows down the reaction and allows for a more controlled growth process, potentially leading to larger crystallite.39
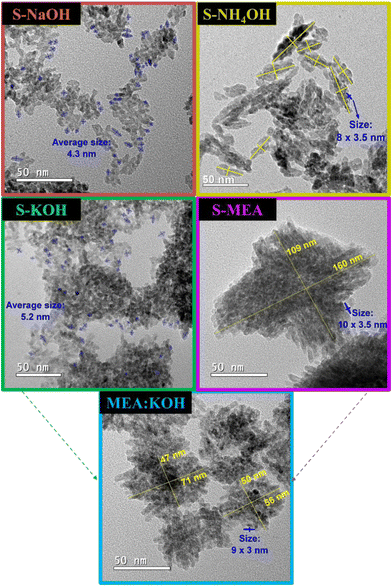
TEM analysis presented in Fig. 3 further supports these findings and reveals distinct morphological characteristics. Samples synthesized using KOH and NaOH alkali solutions, which promote fast reactions, exhibit small spherical particles with average sizes of 5.2 nm and 4.3 nm, respectively, consistent with the calculated sizes presented in Table 1. In contrast, reactions conducted with weak alkaline solutions, including the MEA/KOH mixture, were guided by slower kinetics, resulting in longer and more ordered particles. Interestingly, these particles have coalesced into larger agglomerated particles. Specifically, the TEM image of the S-MEA sample shows an agglomerated particle measuring 160 nm × 109 nm, composed of smaller particles of approximately 10 nm × 3.5 nm in size. The S-NH4OH sample displayed agglomerated particles of around 39.5 nm × 14.1 nm, formed by smaller particles of about 8 nm × 3.5 nm. The MEA/KOH sample exhibited agglomerated particles of about 63.3 nm × 48.7 nm, composed of smaller particles of around 9 nm × 3 nm. The smaller particle dimensions observed in TEM align well with the crystallite sizes calculated from XRD data. HRTEM images (Fig. S3 of ESI†) show interplanar spaces consistent with CuO planes.
SEM images in Fig. 4(a) reveal striking differences in morphology, particle size, and dispersion among the studied samples. These divergences likely arose from the contrasting reactant properties of KOH and NaOH (strong bases) and NH4OH and MEA (weak bases) during particle formation. It is noted in the literature that CuO nanoparticles prepared by the chemical precipitation route tend to agglomerate.33 Although agglomeration is observed across all the samples, those prepared by strong alkaline solution have been shown to form a block of uneven material while samples S-MEA, S-NH4OH, and MEA/KOH have exhibit agglomerations forming well-defined particles, consistent with those observed in TEM image. The S-NaOH and S-KOH catalysts exhibit an irregular and porous morphology composed of an agglomeration of the smaller particles observed in TEM images. In contrast, S-NH4OH and S-MEA catalysts display more well-defined morphology, comprising uniform and dispersed nanoparticles. The S-NH4OH image reveals nanoparticles with an average size of 29.8 nm, while the S-MEA sample exposes uniform oval-shaped nanoparticles with an average particle size of approximately 163 nm in length and 103 nm in width. The size of these particles corroborates with the larger agglomerations observed in TEM images. This smaller size and uniform distribution can enhance surface area and mass transport, potentially leading to improved catalytic activity and efficiency.46 A few agglomerations of particles can also be observed for the MEA/KOH catalyst. Despite the morphological similarities between MEA/KOH and S-MEA particles at higher magnification (50k×), the structure of MEA/KOH more closely resembles that of S-KOH when in 10k× magnification, as observed in Fig. 4(b).
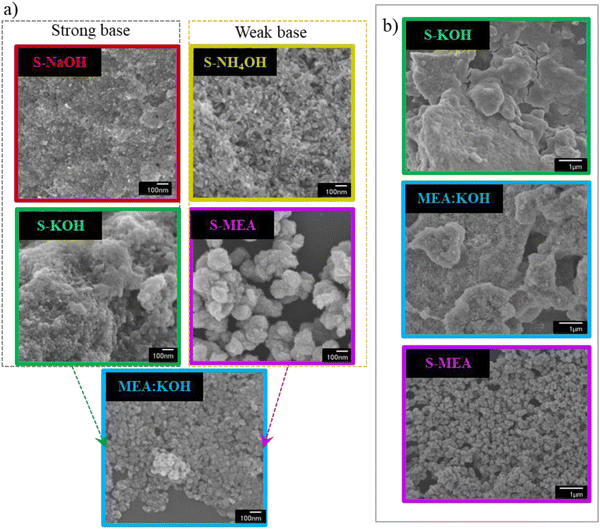 | ||
| Fig. 4 SEM images of the S-NH4OH, S-NaOH, S-KOH, S-MEA, and MEA/KOH catalysts in 50k× magnification (a) and comparison of the S-KOH, S-MEA, and MEA/KOH catalysts in lower magnification of 10k× (b). | ||
The specific surface area (SSA) of the catalysts was determined by the BET method (Table 1), showing values consistent with the morphological observations in Fig. 4. As expected, the catalysts synthesized by strong bases exhibited inferior specific surface area. S-KOH sample, which shows the most uneven and agglomerated morphology, possesses the lowest surface area of 28.6 m2 g−1. Conversely, the S-NH4OH catalyst, characterized by smaller agglomerated particles with a more defined structure, displays the highest surface area of 77 m2 g−1. Among the studied materials, S-MEA exhibits a relatively high surface area of 61.7 m2 g−1, while the MEA/KOH sample presents an intermediate value between those of MEA and KOH.
CO2 photoreduction performance
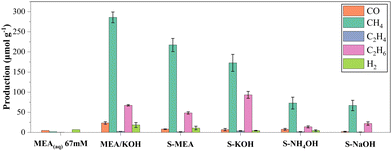
The photoreduction performance indicates similar profiles for all samples. The detected gas-phase products were carbon monoxide (CO), methane (CH4), ethylene (C2H4), ethane (C2H6), and hydrogen (H2). The byproducts were quantified by gas chromatography, and the results are presented in Fig. 5. The choice of alkaline agent in catalyst synthesis significantly impacted photoactivity, as evident from the data in Fig. 5. Remarkably, S-MEA and S-KOH catalysts stood out, achieving methane production rates of 217 and 173 μmol g−1, respectively, and ethane production rates of 48 and 93 μmol g−1, respectively. S-NH4OH and S-NaOH samples showed moderate activity with methane production rates around 70 μmol g−1 for both, while the ethane production rates were 14 and 22 μmol g−1, respectively.Although sample S-NH4OH exhibited a higher surface area, sample S-MEA outcome has a higher production. This enhancement can be attributed to the material surface functionalization by MEA, demonstrated by XPS and FTIR measurement. To confirm the role of MEA in solution from its interaction with the CuO surface, we analyzed an MEA (aq) (67 mM) sample without CuO. As expected, no significant gas-phase products were detected solely from MEA, highlighting the role of surface functionalization on CO2 photoreduction. Furthermore, varying the MEA concentration during catalyst synthesis revealed 67 mM to be the optimal condition for maximizing production rates. Detailed data on this optimization process can be found in Fig. S4 of the ESI.†
Following the observation that both MEA and KOH modifications significantly enhanced CO2 conversion on CuO catalysts, an additional experiment explored the potential synergy of these syntheses. A catalyst named as “MEA/KOH” was synthesized using a mixture of MEA and KOH at equal molar proportions (33.5 mM each) within the same overall base concentration (67 mM). The photocatalytic activity of this dual-base catalyst was then evaluated alongside the previously studied samples shown in Fig. 5. As depicted in the graph, the MEA/KOH catalyst outperformed all other studied materials, achieving the highest gas-phase product yields. Notably, methane production reached 286 μmol g−1, surpassing individual S-MEA and S-KOH modifications by 30% and 63%, respectively. Ethane production reached 67 μmol g−1, an intermediary production between the observed with S-MEA and S-KOH single-base synthesis.
It suggests that the base combination led to a synergistic effect of the MEA and KOH in the resulting catalyst, maximizing the photocatalytic activity of CuO for CO2 reduction. The combined presence of MEA and KOH during synthesis influences the nucleation and growth rate of CuO particles. This results in an intermediate particle size and morphology that optimizes the surface area available for CO2 adsorption and photoexcitation-driven activation. Additionally, the presence of MEA in the synthesis environment introduces organic amine groups onto the CuO surface. These amine groups can act as CO2 adducts, facilitating initial capture and activation of the reactant molecule through hydrogen bonding and electrostatic interactions. Enhancing adsorption and improved CO2 binding can lead to higher conversion rates.
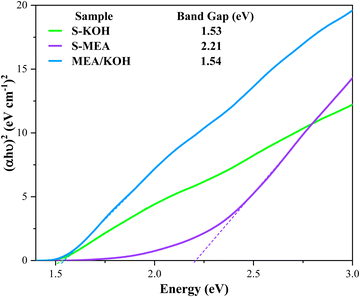
To gain deeper insights into this synergy, UV-vis diffuse reflectance spectroscopy (UV-vis DRS) was employed to elucidate the band energy structure of the S-KOH, S-MEA, and MEA/KOH samples (Fig. 6). The band gap energies were calculated using the Tauc method.47 The estimated band gaps of the S-KOH and MEA/KOH samples were similar, 1.53 eV and 1.54 eV, respectively, while the S-MEA sample exhibited a larger band gap of 2.21 eV. These values align with those reported in the literature for CuO.48 This data suggests that the enhanced activity of the S-MEA sample is primarily attributed to surface functionalization rather than band gap reduction, as its band gap is significantly larger. Additionally, the comparable band gaps of S-KOH and MEA/KOH indicate that the KOH alkaline agent influenced the light absorption properties of the MEA/KOH sample, effectively reducing its band gap.
Fig. 7 shows the calculated selectivity and number of electrons involved in the photochemical reduction of CO2 for the primary studied materials. The selectivity of the products was calculated following equation:
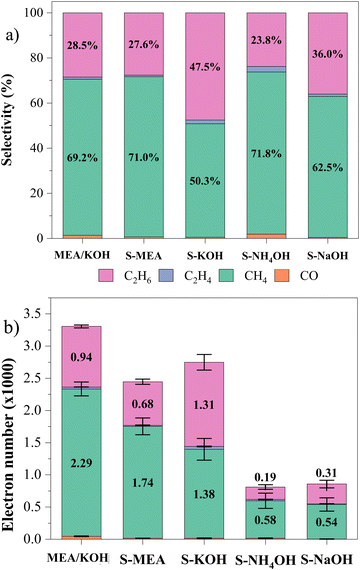 | ||
| Fig. 7 Selectivity of product generation in (a), and number of electrons transferred in 5-hour CO2 photocatalytic reduction reactions in (b). | ||
Beyond selectivity, analyzing the number of electrons involved in the reactions (Fig. 7(b)) unveils a crucial perspective on catalyst performance. This data combination provides deeper insights into the efficiency of CO2 conversion. The graph shows that the S-MEA, S-KOH, and MEA/KOH samples excelled in CO2 photoreduction, reaching 2.4, 2.7, and 3.3 × 10³ electrons. While ethane production is promising, S-MEA and MEA/KOH exhibited better selectivity due to specific surface functionalization characteristics.
CO2-catalyst interactions are critical determinants of product formation during photoreduction. We hypothesize that MEA-derived functional groups, although they facilitated the capture of CO2 on the surface, may not be strong enough to keep the molecule bound to the surface until its conversion into ethane. It might promote faster cycling and, thus, generate a higher concentration of methane. The union between MEA and KOH must have provided synthesis conditions related to the velocity of the particle growth and surface functionalization that mediated a more efficient process for the photochemical reduction of CO2.
Table 2 presents a comparative analysis of methane production rates reported in the literature. As evident from the data, the methane production rates achieved in this work are comparable to those reported in the literature, particularly when considering the simplicity of our synthesis methodology. This methodology does not involve energy-intensive processes, making it an attractive approach.
4. Conclusion
In this study, we successfully evaluated the effectiveness of CuO photocatalysts prepared via chemical precipitation using different alkaline agents. It was found that the base strength employed during synthesis significantly influenced the morphological characteristics due to variations in reaction velocity and particle growth dynamics. The photocatalytic performance assessments revealed that the MEA/KOH photocatalyst outperformed both S-MEA and S-KOH, displaying enhanced selectivity and electron involvement in the CO2 reduction reaction. The results revealed a synergistic enhancement of photoactivity due to the combined influence of faster particle nucleation facilitated by KOH and the presence of nitrogen-containing groups from MEA on the catalyst surface. These findings highlight the critical role of surface modification in optimizing photocatalytic materials, particularly in CO2 reduction. By tailoring the synthesis process and surface composition, photocatalysts with superior performance can be designed.Data availability
The authors confirm that the data supporting the findings of this study are available within the article and its ESI.†Conflicts of interest
There are no conflicts to declare.Acknowledgements
The authors are grateful to CNPq (grant 409904/2016-3) and FAPESP (grants 2018/01258-5 and 22/10255-5) for financial support. This study was financed in part by the Coordenação de Aperfeiçoamento de Pessoal de Nível Superior – Brasil (CAPES) – Finance Code 001; Agro-nano Network (Embrapa Research Network); and SISNANO/MCTI, FINEP (grant 1516 #01.17.0021.00). The authors also acknowledge the support of Brazilian S&T&I Ministry through SISNANO (CNPq proj #442575/2019-0) and INCT Programs (CNPq proj #406925/2022-4). JCA wishes to express gratitude to Leticia Vieira Savazi and Douglas Mendes da Silva Del Duque for their assistance in material synthesis and Forschungszentrum Julich (IEK-14) for conducting XPS measurements. The authors extend their sincere gratitude to the LME – Laboratório de Microscopia Eletrônica at IQSC (Institute of Chemistry of São Carlos), USP (University of São Paulo) for their invaluable assistance with the TEM and HRTEM analyses.References
- C. Hiragond, S. Ali, S. Sorcar and S.-I. In, Hierarchical Nanostructured Photocatalysts for CO2 Photoreduction, Catalysts, 2019, 9, 370, DOI:10.3390/catal9040370.
- W. A. Thompson, E. Sanchez Fernandez and M. M. Maroto-Valer, Review and Analysis of CO 2 Photoreduction Kinetics, ACS Sustainable Chem. Eng., 2020, 8, 4677–4692, DOI:10.1021/acssuschemeng.9b06170.
- S. Wang, X. Han, Y. Zhang, N. Tian, T. Ma and H. Huang, Inside-and-Out Semiconductor Engineering for CO2 Photoreduction: From Recent Advances to New Trends, Small Struct., 2021, 2, 2000061, DOI:10.1002/sstr.202000061.
- Y. Wang, J. A. Torres, M. Shviro, M. Carmo, T. He and C. Ribeiro, Photocatalytic materials applicationsfor sustainable agriculture, Prog. Mater. Sci., 2022, 130, 100965, DOI:10.1016/j.pmatsci.2022.100965.
- M. Fang, X. Tan, Z. Liu, B. Hu and X. Wang, Recent Progress on Metal-Enhanced Photocatalysis: A Review on the Mechanism, Research, 2021, 2021, 1–16, DOI:10.34133/2021/9794329.
- Y. Gao, X. Fang, D. Chen, N. Ma and W. Dai, Ternary photocatalyst of ZIF-8 nanofilms coupled with AgI nanoparticles seamlessly on ZnO microrods for enhanced visible-light photocatalysis degradation, J. Taiwan Inst. Chem. Eng., 2022, 131, 104146, DOI:10.1016/j.jtice.2021.11.013.
- M. Batool, M. F. Nazar, A. Awan, M. B. Tahir, A. Rahdar, A. E. Shalan, S. Lanceros-Méndez and M. N. Zafar, Bismuth-based heterojunction nanocomposites for photocatalysis and heavy metal detection applications, Nano-Struct. Nano-Objects, 2021, 27, 100762, DOI:10.1016/j.nanoso.2021.100762.
- F. Biancullo, N. F. F. Moreira, A. R. Ribeiro, C. M. Manaia, J. L. Faria, O. C. Nunes, S. M. Castro-Silva and A. M. T. Silva, Heterogeneous photocatalysis using UVA-LEDs for the removal of antibiotics and antibiotic resistant bacteria from urban wastewater treatment plant effluents, Chem. Eng. J., 2019, 367, 304–313, DOI:10.1016/j.cej.2019.02.012.
- J. C. de Almeida, M. T. Corrêa, R. H. Koga, D. M. S. Del Duque, O. F. Lopes, G. T. S. T. da Silva, C. Ribeiro and V. R. de Mendonça, Crystallization time in ZnO: the role of surface OH groups in its photoactivity, New J. Chem., 2020, 44, 18216–18224, 10.1039/D0NJ03239E.
- Q. Y. Lee and H. Li, Photocatalytic Degradation of Plastic Waste: A Mini Review, Micromachines, 2021, 12, 907, DOI:10.3390/mi12080907.
- A. A. Sery, W. A. A. Mohamed, F. F. Hammad, M. M. H. Khalil and H. K. Farag, Synthesis of pure and doped SnO2 and NiO nanoparticles and evaluation of their photocatalytic activity, Mater. Chem. Phys., 2022, 275, 125190, DOI:10.1016/j.matchemphys.2021.125190.
- S. Yoshino, T. Takayama, Y. Yamaguchi, A. Iwase and A. Kudo, CO2 Reduction Using Water as an Electron Donor over Heterogeneous Photocatalysts Aiming at Artificial Photosynthesis, Acc. Chem. Res., 2022, 55, 966–977, DOI:10.1021/acs.accounts.1c00676.
- C. Zuo, Q. Su and Z. Jiang, Advances in the Application of Bi-Based Compounds in Photocatalytic Reduction of CO2, Molecules, 2023, 28, 3982, DOI:10.3390/molecules28103982.
- T. Li, H. Huang, S. Wang, Y. Mi and Y. Zhang, Recent advances in 2D semiconductor nanomaterials for photocatalytic CO2 reduction, Nano Res., 2023, 16, 8542–8569, DOI:10.1007/s12274-022-5234-1.
- J. C. da Cruz, G. T. S. T. da Silva, E. H. Dias, D. S. D. Lima, J. A. Torres, P. F. da Silva and C. Ribeiro, Cobalt Oxide on Boron-Doped Graphitic Carbon Nitride as Bifunctional Photocatalysts for CO2 Reduction and Hydrogen Evolution, ACS Appl. Mater. Interfaces, 2024 DOI:10.1021/acsami.3c18640.
- M. Flores-Flores, E. Luévano-Hipólito, L. M. Torres-Martínez and T.-O. Do, CO2 adsorption and photocatalytic reduction over Mg(OH)2/CuO/Cu2O under UV-Visible light to solar fuels, Mater. Chem. Phys., 2019, 227, 90–97, DOI:10.1016/j.matchemphys.2019.01.062.
- V. I. Alexiadis, J. W. Thybaut, P. N. Kechagiopoulos, M. Chaar, A. C. Van Veen, M. Muhler and G. B. Marin, Oxidative coupling of methane: catalytic behaviour assessment via comprehensive microkinetic modelling, Appl. Catal., B, 2014, 150–151, 496–505, DOI:10.1016/j.apcatb.2013.12.043.
- A. E. Nogueira, G. T. S. T. Da Silva, J. A. Oliveira, J. A. Torres, M. G. S. Da Silva, M. Carmo and C. Ribeiro, Unveiling CuO role in CO2 photoreduction process – Catalyst or reactant?, Catal. Commun., 2020, 137, 105929, DOI:10.1016/j.catcom.2020.105929.
- M. A. Ávila-López, S. Gavrielides, X. Luo, A. E. Ojoajogwu, J. Z. Y. Tan, E. Luévano-Hipólito, L. M. Torres-Martínez and M. M. Maroto-Valer, Comparative study of CO2 photoreduction using different conformations of CuO photocatalyst: Powder, coating on mesh and thin film, J. CO2 Util., 2021, 50, 101588, DOI:10.1016/j.jcou.2021.101588.
- X. Lv, X. You, J. Pang, H. Zhou, Z. Huang, Y.-F. Yao and X.-L. Wang, Carbon nitride nanosheet-supported CuO for efficient photocatalytic CO2 reduction with 100% CO selectivity, Chem. Commun., 2024, 60(35), 4652–4655, 10.1039/D4CC00346B.
- G. S. Jamila, S. Sajjad, S. A. K. Leghari and T. Mahmood, Role of nitrogen doped carbon quantum dots on CuO nano-leaves as solar induced photo catalyst, J. Phys. Chem. Solids, 2020, 138, 109233, DOI:10.1016/j.jpcs.2019.109233.
- N. Wang, D. Wang, A. Krook-Riekkola and X. Ji, MEA-based CO2 capture: a study focuses on MEA concentrations and process parameters, Front. Energy Res., 2023, 11, 1230743, DOI:10.3389/fenrg.2023.1230743.
- M. N. Procopio, G. Urquiza, L. Castro and V. Zezatti, Saturation of the MEA solution with CO2: Absorption prototype and experimental technique, Results Eng., 2023, 19, 101286, DOI:10.1016/j.rineng.2023.101286.
- T. R. Seling, R. R. Katzbaer, K. L. Thompson, S. E. Aksoy, B. Chitara, A. K. Shringi, R. E. Schaak, U. Riaz and F. Yan, Transition metal-doped CuO nanosheets for enhanced visible-light photocatalysis, J. Photochem. Photobiol., A, 2024, 448, 115356, DOI:10.1016/j.jphotochem.2023.115356.
- F. C. Soares, J. C. de Almeida, R. H. Koga, D. M. da, S. Del Duque, G. T. S. T. da Silva, C. Ribeiro and V. R. de Mendonça, TiO2/BiVO4 composite from preformed nanoparticles for heterogeneous photocatalysis, Mater. Chem. Phys., 2022, 290, 126588, DOI:10.1016/j.matchemphys.2022.126588.
- J. Low, B. Cheng and J. Yu, Surface modification and enhanced photocatalytic CO2 reduction performance of TiO2: a review, Appl. Surf. Sci., 2017, 392, 658–686, DOI:10.1016/j.apsusc.2016.09.093.
- M. Shahmiri, N. A. Ibrahim, N. Zainuddin, B. Bakhtyar, A. Zaharim and K. Sopian, Effect of pH on the Synthesis of CuO Nanosheets by Quick Precipitation Method, WSEAS Trans. Environ. Dev., 2013, 9(2), 137–145 Search PubMed.
- S. Thakur, M. Shandilya, S. Thakur and D. K. Sharma, Growth mechanism and characterization of CuO nanostructure as a potent Antimicrobial agent, Surf. Interfaces, 2020, 20, 100551, DOI:10.1016/j.surfin.2020.100551.
- R. Wu, Z. Ma, Z. Gu and Y. Yang, Preparation and characterization of CuO nanoparticles with different morphology through a simple quick-precipitation method in DMAC–water mixed solvent, J. Alloys Compd., 2010, 504, 45–49, DOI:10.1016/j.jallcom.2010.05.062.
- M. J. F. Anik, S. R. Mim, S. S. Swapno, S. Munira, O. Roy and M. M. Billah, Vacancy induced enhanced photocatalytic activity of nitrogen doped CuO NPs synthesized by Co-precipitation method, Heliyon, 2024, 10(6), 1–18, DOI:10.1016/j.heliyon.2024.e27613.
- K. Phiwdang, S. Suphankij, W. Mekprasart and W. Pecharapa, Synthesis of CuO Nanoparticles by Precipitation Method Using Different Precursors, Energy Procedia, 2013, 34, 740–745, DOI:10.1016/j.egypro.2013.06.808.
- S.-H. Lee, Y.-S. Her and E. Matijević, Preparation and growth mechanism of uniform colloidal copper oxide by the controlled double-jet precipitation, J. Colloid Interface Sci., 1997, 186, 193–202 CrossRef CAS PubMed.
- Q. Zhang, K. Zhang, D. Xu, G. Yang, H. Huang, F. Nie, C. Liu and S. Yang, CuO nanostructures: Synthesis, characterization, growth mechanisms, fundamental properties, and applications, Prog. Mater. Sci., 2014, 60, 208–337, DOI:10.1016/j.pmatsci.2013.09.003.
- K. Zhou, R. Wang, B. Xu and Y. Li, Synthesis, characterization and catalytic properties of CuO nanocrystals with various shapes, Nanotechnology, 2006, 17, 3939, DOI:10.1088/0957-4484/17/15/055.
- A. E. Nogueira, A. S. Giroto, A. B. S. Neto and C. Ribeiro, CuO synthesized by solvothermal method as a high capacity adsorbent for hexavalent chromium, Colloids Surf., A, 2016, 498, 161–167, DOI:10.1016/j.colsurfa.2016.03.022.
- F. Peng, Y. Sun, Y. Lu, W. Yu, M. Ge, J. Shi, R. Cong, J. Hao and N. Dai, Studies on Sensing Properties and Mechanism of CuO Nanoparticles to H2S Gas, Nanomaterials, 2020, 10, 774, DOI:10.3390/nano10040774.
- W. Chen, L. Li, Q. Peng and Y. Li, Polyol synthesis and chemical conversion of Cu2O nanospheres, Nano Res., 2012, 5, 320–326, DOI:10.1007/s12274-012-0212-7.
- L. Feng, R. Wang, Y. Zhang, S. Ji, Y. Chuan, W. Zhang, B. Liu, C. Yuan and C. Du, In situ XRD observation of CuO anode phase conversion in lithium-ion batteries, J. Mater. Sci., 2019, 54, 1520–1528, DOI:10.1007/s10853-018-2885-0.
- F. Scholz and H. Kahlert, Chemical equilibria in analytical chemistry, Springer, 2019 Search PubMed.
- T. X. Wang, S. H. Xu and F. X. Yang, Green synthesis of CuO nanoflakes from CuCO3·Cu(OH)2 powder and H2O2 aqueous solution, Powder Technol., 2012, 228, 128–130, DOI:10.1016/j.powtec.2012.05.007.
- M. A. Badillo-Ávila, R. Castanedo-Pérez, M. A. Villarreal-Andrade and G. Torres-Delgado, Cu2O thin films obtained at low temperature by mono-ethanolamine decomposition in open atmosphere, Mater. Sci. Semicond. Process., 2018, 85, 168–176, DOI:10.1016/j.mssp.2018.06.009.
- A. Dastneshan, S. Rahiminezhad, M. Naderi Mezajin, H. Nouri Jevinani, I. Akbarzadeh, M. Abdihaji, R. Qahremani, M. Jahanbakhshi, Z. Asghari Lalami, H. Heydari, H. Noorbazargan and E. Mostafavi, Cefazolin encapsulated UIO-66-NH2 nanoparticles enhance the antibacterial activity and biofilm inhibition against drug-resistant S. aureus: In vitro and in vivo studies, Chem. Eng. J., 2023, 455, 140544, DOI:10.1016/j.cej.2022.140544.
- U. Jerome Etim, R. Semiat and Z. Zhong, CO2 Valorization Reactions over Cu-Based Catalysts: Characterization and the Nature of Active Sites, Am. J. Chem. Eng., 2021, 9, 53–78, DOI:10.11648/j.ajche.20210903.12.
- X. Zhang, C. Wang, J. Zhou, Z. Liu, G. Liu, H. Ma and Y. Li, Effect and Mechanism of Dual-Official Group of Ethanolamines on the Chemical Mechanical Polishing of Monocrystalline Silicon, ECS J. Solid State Sci. Technol., 2022, 11, 093005, DOI:10.1149/2162-8777/ac911c.
- H.-D. Chang, B.-E. Wu, M. Chandra Sil, Z.-H. Yang and C.-M. Chen, Study of synergy of monoethanolamine and urea on copper corrosion inhibition in alkaline solution, J. Mol. Liq., 2022, 359, 119344, DOI:10.1016/j.molliq.2022.119344.
- P. H. Karpinski and J. S. Wey, Precipitation processes, in Handbook of Industrial Crystallization, ed. A. S. Myerson, Butterworth-Heinemann, Woburn, 2nd edn, 2002, ch. 6, pp. 141–160 DOI:10.1016/B978-075067012-8/50008-2.
- H. Zhang, Y. Gao, S. Meng, Z. Wang, P. Wang, Z. Wang, C. Qiu, S. Chen, B. Weng and Y. Zheng, Metal Sulfide S-Scheme Homojunction for Photocatalytic Selective Phenylcarbinol Oxidation, Adv. Sci., 2024, 11, 2400099, DOI:10.1002/advs.202400099.
- S. Ruzgar and E. Acar, The statistical neural network-based regression approach for prediction of optical band gap of CuO, Indian J. Phys., 2022, 96, 3547–3557, DOI:10.1007/s12648-022-02283-6.
- A. E. Nogueira, G. T. S. T. Silva, J. A. Oliveira, O. F. Lopes, J. A. Torres, M. Carmo and C. Ribeiro, CuO Decoration Controls Nb2O5 Photocatalyst Selectivity in CO2 Reduction, ACS Appl. Energy Mater., 2020, 3, 7629–7636, DOI:10.1021/acsaem.0c01047.
- Y. Song, C. Ye, X. Yu, J. Tang, Y. Zhao and W. Cai, Electron-induced enhanced interfacial interaction of the CuO/BiOCl heterostructure for boosted CO2 photoreduction performance under simulated sunlight, Appl. Surf. Sci., 2022, 583, 152463, DOI:10.1016/j.apsusc.2022.152463.
- M. A. Ávila-López, J. Z. Y. Tan, E. Luévano-Hipólito, L. M. Torres-Martínez and M. M. Maroto-Valer, Production of CH4 and CO on CuxO and NixOy coatings through CO2 photoreduction, J. Environ. Chem. Eng., 2022, 10, 108199, DOI:10.1016/j.jece.2022.108199.
- Y. Zhou, Q. Zhang, X. Shi, Q. Song, C. Zhou and D. Jiang, Photocatalytic reduction of CO2 into CH4 over Ru-doped TiO2: Synergy of Ru and oxygen vacancies, J. Colloid Interface Sci., 2022, 608, 2809–2819, DOI:10.1016/j.jcis.2021.11.011.
- J. S. Santos, M. Fereidooni, V. Marquez, M. Arumugam, M. Tahir, S. Praserthdam and P. Praserthdam, Single-step fabrication of highly stable amorphous TiO2 nanotubes arrays (am-TNTA) for stimulating gas-phase photoreduction of CO2 to methane, Chemosphere, 2022, 289, 133170, DOI:10.1016/j.chemosphere.2021.133170.
- D.-E. Lee, D. Jin Kim, V. Devthade, W.-K. Jo and S. Tonda, Size-dependent selectivity and activity of highly dispersed sub-nanometer Pt clusters integrated with P25 for CO2 photoreduction into methane fuel, Appl. Surf. Sci., 2022, 584, 152532, DOI:10.1016/j.apsusc.2022.152532.
Footnote |
| † Electronic supplementary information (ESI) available. See DOI: https://doi.org/10.1039/d4ma00337c |
| This journal is © The Royal Society of Chemistry 2024 |

