 Open Access Article
Creative Commons Attribution 3.0 Unported Licence
Localized surface plasmon resonances of size-selected large silver nanoclusters (n = 70–100) soft-landed on a C60 organic substrate†
Tomoya
Inoue
a,
Kaito
Mizoguchi
a,
Miwa
Tokita
a,
Masahiro
Shibuta‡
b,
Masato
Nakaya§
a,
Toyoaki
Eguchi¶
a and
Atsushi
Nakajima
 *ab
*ab
aDepartment of Chemistry, Faculty of Science and Technology, Keio University, 3-14-1 Hiyoshi, Kohoku-ku, Yokohama 223-8522, Japan. E-mail: nakajima@chem.keio.ac.jp; Fax: +81-45-566-1697; Tel: +81-45-566-1712
bKeio Institute of Pure and Applied Sciences (KiPAS), Keio University, 3-14-1 Hiyoshi, Kohoku-ku, Yokohama 223-8522, Japan
First published on 22nd May 2024
Abstract
Silver nanoclusters (Agn NCs) exhibit a remarkable optical property known as localized surface plasmon resonance (LSPR) in the visible to ultraviolet wavelengths. In this study, we address the size gap in LSPR responses between small NCs and nano-islands by synthesizing large Agn NCs with a countable number of atoms (n = 70–100) using a magnetron sputtering method, which were precisely size-selected and soft-landed onto substrates. The monodispersed Agn NCs were immobilized on a pre-decorated substrate with fullerene (C60) molecules, and their LSPR behaviors were characterized using two-photon photoemission (2PPE) spectroscopy. Due to the distinct polarization selectivity of incident light associated with LSPR, the intensity ratio between p- and s-polarized lights (Ip/Is) in 2PPE spectroscopy serves as a reliable indicator of LSPR and its structural correlations. From n = 70 to 100, the Ip/Is value gradually decreases as the cluster size increases. This decrease is attributed to the enhancement of s-polarized light (Is), indicating that large Agn NCs on a C60 substrate undergo a deformation from spherical to flattened geometries, particularly above approximately n = 55.
Introduction
The intense light absorption resulting from collective photoexcitation in assemblies of metal atoms is known as localized surface plasmon resonance (LSPR), where the optical response of LSPR varies with the size, composition, structure, and surrounding environment of the metal assemblies.1–4 Silver (Ag), belonging to the Group 11 elements, efficiently converts ultraviolet-visible light into excitons through LSPR, and due to its chemical stability, numerous applications combining Ag LSPR with light excitation processes have been experimentally explored.5–12 The optical responses in large nanoparticles with sizes of around 100 nm can be theoretically explained within the framework of classical electromagnetism, approximated with continuous band structures.13Conversely, LSPR responses have been observed in the gas phase even in countable nano-sized regions containing a few to a few hundred atoms, corresponding to nanoclusters (NCs) with diameters below a few nanometers.14–19 These findings have spurred research into constructing a theoretical framework based on quantum theory calculations, to enhance our understanding of the optical responses in these NC regions.20–29 Regarding the threshold size for LSPR optical response in a NC, the LSPR response of Agn NCs emerges at around 9 atoms when fabricating size-selectively monodispersed Agn NCs on a C60 organic substrate. Two-photon photoemission (2PPE) spectroscopy elucidates the LSPR response, showcasing polarization-dependent enhanced photoemission, including wavelength dependence and electronic relaxation processes of massive flat-shaped Ag NCs on graphite substrates.9,10,30 However, there exists a size gap in the research between small NCs up to approximately 50 atoms and flat-shaped NC islands with hundreds of atoms. It is therefore essential to evaluate the optical properties using atomically precise Agn NCs monodispersed on a substrate to spectroscopically reveal the transition regions for advancing theoretical treatments.
In this study, large Agn NCs (n = 70, 85, and 100) were uniformly surface-immobilized on organic C60 substrates, and their LSPR responses were evaluated using 2PPE spectroscopy. We will discuss the correlation with surrounding environments and structures by comparing them with classical optical-electromagnetic field analyses.31
Experimental and calculation details
NC synthesis
Experimental details have been previously published.12,30,32–34 Briefly, Agn NCs were synthesized in the gas phase using a magnetron sputtering (MSP) system (NAP01-nanojima, Ayabo Corp.). After mass selection using a quadrupole mass analyzer (MAX-16000, Extrel CMS), the Ag atoms and ions ejected by accelerating Ar+ ions from a Ag target were cooled and aggregated in helium (He) gas at liquid nitrogen temperature. The Agn NCs were then grown within the growth cell cooled by liquid nitrogen. The Agn NC cations generated in the growth cell were selectively transported using a quadrupole ion guide and an ion deflector, and then introduced into the quadrupole mass analyzer for precise mass selection on a single-atom basis. The synthesis conditions of Agn NCs were optimized while detecting the ion current originating from Agn NC cations after mass separation to obtain the targeted size n of NCs. The deposition of Agn NC cations was carried out by applying a sufficiently low negative voltage of −5 V to the sample substrate to gently attract positive ions, ensuring soft-landing conditions where the NCs are not destroyed upon collisions with the substrate, and deposited 0.2 monolayer (ML) under these conditions. A highly purified HOPG substrate heated to 400 °C and pre-coated with a 2 ML C60 film was used as the sample substrate. The Ag NC-supported substrate was transferred to the photoemission spectroscopy system under ultra-high vacuum conditions (∼10−8 Pa). Furthermore, the monodispersity of Agn NCs on the C60 substrate was confirmed in advance using a scanning tunneling microscope (STM), the images of which were analyzed using WSxM software.352PPE measurements
In this study, measurements were conducted using 2PPE spectroscopy, where the incident light served as both pump and probe light.12,30,36 For 2PPE, second and third harmonics (SH and TH) obtained from a Ti:sapphire laser (COHERENT, Mira-900F; 76 MHz, 150 fs) were used, resulting in photon energy ranges of 2.26–3.44 eV and 3.96–4.65 eV, respectively. The incident light was focused onto the sample using an aluminum-coated concave mirror (f = 400 mm), and the incident angle was set to 65°. The polarization of the incident light was changed to p-polarization and s-polarization in the vertical and horizontal directions of the substrate, respectively, using a half-wave plate. The kinetic energy distributions of photoelectrons generated by the two-photon process using polarized light were detected using a hemispherical electron energy analyzer (VG SCIENTA, R-3000), and the sample temperature during measurements was maintained at 293 K.Optical-electromagnetic field analysis
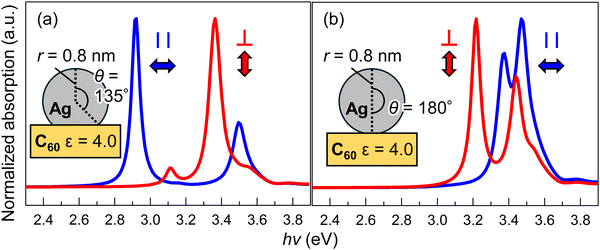
The optical absorption efficiencies of metal spheres supported as complete spheres and truncated spheres on dielectric films were calculated using a model based on classical electromagnetism by M. M. Wind et al.31 The dielectric function of Ag was used for the metal spheres,37 a value of 4.0 was employed for the dielectric constant of C60 as the support material,38,39 and the surrounding medium was assumed to be vacuum (ε = 1.0). The radius of the metal spheres, r, was set to 0.8 nm, and simulations were conducted for both complete spheres (θ = 180°) and truncated spheres (θ = 135°).Results and discussion
2PPE spectrum of Ag100/C60
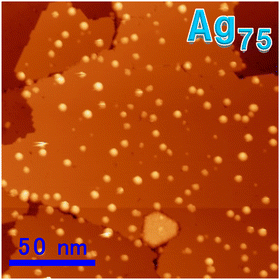
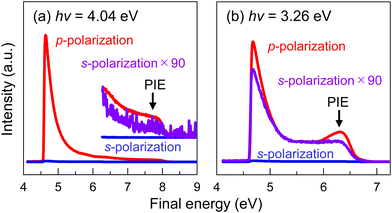
Fig. 1 shows the STM image obtained when depositing Ag75 NCs. From the figure, it is evident that each Agn NC is immobilized in a monodispersed state on the C60 substrate. The height on the C60 surface averages around 1.3 nm, which is notably higher than 0.8 nm height reported previously for Ag13 but is comparable to the average height of Ag55, also reported as 1.3 nm.32 Regarding the lateral width, the differences depending on the shape of the STM tip are significant, making quantitative comparisons difficult. From this monodispersed state, it is confirmed that the optical response is defined by Agn NCs with a precise number of atoms, as demonstrated in Fig. S1 in the ESI† for smaller sized Agn on a C60 substrate. Ultraviolet and X-ray photoelectron spectra for large Agn NCs on a C60 substrate are provided in Fig. S2 in the ESI.†Fig. 2(a) shows the 2PPE spectrum of Ag100 NCs (0.2 ML) on a C60 substrate measured with p-polarization (red) and s-polarization (blue) at hν = 4.04 eV (TH photons). The photoemission yield detected with p-polarization is generally enhanced compared to that with s-polarization, particularly exhibiting an exponential increase in photoemission yield between 4.5 eV and 5.5 eV in a final energy from the Fermi level (EF). This enhancement is attributed to the photoemission spectrum measurement encompassing electronic relaxation processes after LSPR excitation, where low-energy hot electrons are generated to approach thermal equilibrium distribution through the Landau damping (1–100 fs) and exciton relaxation processes (100 fs–1 ps).9,10,30,40
Additionally, as shown in Fig. 2(a), a peak attributed to LSPR excitation, PIE (photoemission intensity enhancement), is observed around EF + 2 hν (ca. 8 eV in final energy), where the photoemission yield is more than 90 times larger with p-polarization (red) than with s-polarization (purple). A similar trend is observed in Fig. 2(b) for the 2PPE spectrum measured with hν = 3.26 eV (SH photons), where the photoemission intensity with p-polarization (red) is also more than 90 times larger than that with s-polarization (purple), particularly exhibiting a significant increase in photoelectrons below 5.0 eV and above 6.0 eV of final energy in the PIE region.
Size dependence of Ip/Is
To quantitatively evaluate the LSPR response, the ratio of photoemission intensity with p-polarization to that with s-polarization is defined in the PIE region as Ip/Is, and its size dependence at hν = 3.26 eV is shown in Fig. 3. The reported Ip/Is values for Agn NCs on C60 substrates with n ≤ 55 (black circles) are included to observe their size evolution,30 along with that for flat-shaped Agn NCs on HOPG substrates with φ ∼ 2.5 nm, t ∼ 1 nm (n is roughly estimated to 8 × 10²) (green line) reported by S. Tan et al.10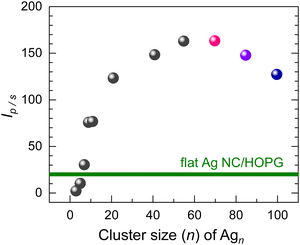 | ||
| Fig. 3 The Ip/Is values of Agn NCs deposited on a C60 substrate are plotted against cluster size n. These Ip/Is values are determined by integrating the PIE (>6 eV region in final energy) from the 2PPE spectra of SH photons at hν = 3.26 eV for both p- and s-polarization. Based on the Ip/Is values, the plasmonic response of Agn NCs becomes evident at n ≥ 9 and reaches a local maximum around n = 60, followed by a gradual decline; three colored dots in pink, violet and blue represent Agn NCs (n = 70, 85, and 100), respectively, while the other dots in black correspond to values reported previously.30 For ref. 10, an Ip/Is value of 20 is indicated for flat-shaped Ag NCs (φ ∼ 2.5 nm, t ∼ 1 nm, n ∼ 8 × 10²) on HOPG at hν = 3.26 eV, represented by a green line. | ||
Regarding the size evolution from Ag3 atom to Ag100, Ip/Is increases at small size n, reaching a threshold around n ∼ 9, then peaking around n ∼ 60 with further size increase, and subsequently shows a monotonic decrease for larger sizes. Notably, Ip/Is begins to decrease for larger sizes with n > 55, eventually converging to a small Ip/Is value. This trend can be rationalized by considering that Ip/Is at hν = 3.26 eV for flat Ag NCs with sizes around n ∼ 8 × 10² supported on HOPG substrates has been reported as a small Ip/Is value of 20. However, it is unlikely that the LSPR response itself reaches a maximum at n ∼ 60, as it has been reported that LSPR absorption efficiency further increases toward particle sizes of 20 nm or larger (n > 2 × 10⁵).41,42
Photon energy dependence in p- and s-polarizations
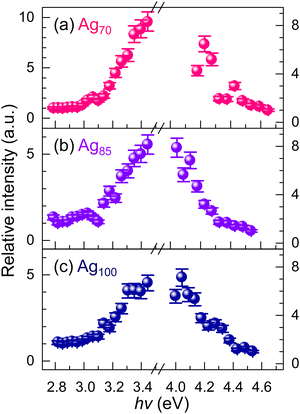
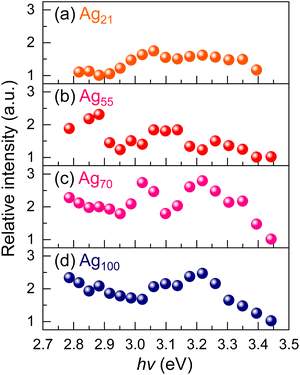
To elucidate the reason for the decrease in Ip/Is value with increasing size n, the 2PPE spectra were measured with varying photon energies in p-polarization for Agn (n = 70, 85, and 100), and the relative intensity in the PIE region is plotted in Fig. 4. The intensity increases towards 3.6–3.7 eV, similar to Agn NCs/C60 with n ≤ 55, and no distinct shift in the center wavelength of LSPR is observed with size variation. However, particularly in the SH wavelength region with hν < 3.5 eV, the intensity of Ip decreases from n = 70 to n = 85 for the same photon energy.Next, to investigate the behaviors with Is, the 2PPE spectra were measured with varying photon energies in s-polarization for Agn NCs (n = 21, 55, 70, and 100), and the relative intensity in the PIE region is plotted in Fig. 5. For Ag21 and Ag55, there is no discernible photon energy dependence, and no distinct structures in Is are observed. On the other hand, for larger sizes such as Ag70 and Ag100, an increase in intensity in Is is observed in the range of hν = 3.0–3.4 eV, showing a peak-like structure around hν ∼ 3.2 eV. The result suggests that the decline in Ip/Is with size for n > 55, observed in Fig. 3 at hν = 3.26 eV, is attributable to both a decrease in Ip and an increase in Is.
Classical electromagnetic field analysis for photo-absorption of Ag100/C60
To investigate the origin of the observed peak in the photon energy dependence of 2PPE intensity at s-polarization, an optical electromagnetic field simulation was conducted for the Ag100/C60 system. Fig. 6 illustrates the normalized absorption cross-sections for the substrate in horizontal and vertical (surface normal) directions when Ag100 NC is assumed to be supported on the C60 substrate; (a) a truncated sphere and (b) a complete sphere. In the simulation, a dielectric constant of 4.0 was used for the C60 substrate38,39 and the experimentally measured dielectric constant was used for the Ag metal film.37 Two spherical Ag100 shapes are assumed with a radius of 0.8 nm; (a) truncated at θ = 135° from the apex and (b) untruncated (θ = 180°), as shown in the insets of Fig. 6. In the case of the truncated sphere (a), the LSPR absorption (red) in the substrate vertical direction (p-polarization) is observed at 3.4 eV, which is 0.2–0.3 eV lower than the experimentally measured value. This discrepancy is likely due to the simulation's accuracy being limited to classical analysis, and further discussion is needed to include quantum size effects.43,44 On the other hand, the LSPR absorption (blue) in the substrate horizontal direction (s-polarization) is observed at a lower energy of 2.9 eV, which is 0.5 eV lower than the absorption in the substrate vertical direction (red). This qualitatively reproduces the experimental results shown in Fig. 5(d).In the case of the complete sphere (b), conversely, LSPR absorption in the substrate horizontal direction (blue) is calculated to occur on the higher energy side compared to the substrate vertical direction (red). This discrepancy does not align the experimental results indicating the appearance of lower energy components. These analyses suggest that the low energy components responsible for s-polarized light are attributed to a flattened structure of Agn NCs with n > 55, similar to a truncated sphere. Furthermore, the lower intensity Ip in p-polarization for n = 70 compared to n = 85 and 100 can be explained by the shorter distance in the substrate vertical direction (lower height) in Agn NCs deformed by flattening. While the LSPR response in the NC region increases with distance in the substrate vertical direction,23,25,26 the diameter of n = 55, which is considered close to a complete sphere based on STM,32 is 1.2 nm, which is almost the same as the vertical length of 1.3 nm in the truncated sphere of n = 100. Specifically, such flattening deformation of supported Ag NCs with increasing size has also been reported on silica glass substrates,8,9 and thus the decrease in Ip/Is at hν = 3.26 eV for Agn NCs with n > 55 in this study is attributable to the formation of a flattened structure of Agn NCs on the C60 substrate. Namely, a flattened structure of larger Agn NCs could result in the manifestation of LSPR absorption in s-polarization and a decrease in distance in the substrate vertical direction.
Previous theoretical studies have shown that the magnitude of the LSPR transition moment is proportional to the particle size in regions of NCs.25 When 55-mer and 100-mer nanoclusters are supported on a C60 organic substrate as complete or truncated spheres, respectively, as shown in Fig. 6(b) and (a), respectively, the vertical dimension relative to the substrate remains the same for both clusters (1-fold), while the maximum horizontal length is 1.2 times longer for the 100-mer compared to the 55-mer. In fact, 2PPE measurements indicate that the Ip/Is ratio for the 55-mer is 1.3 times larger than for the 100-mer, suggesting flattening deformation in the 100-mer.
The optical response of LSPR is influenced by the mode of excitation and precise atomic configurations, which are essential for maximizing the atomic utilization of precious metals. By strategically positioning plasmonic particles on solid surfaces, improvements in optical materials like photocatalysts and solar cells are expected with minimal additions. However, there is limited research on how the size and shape of nanoclusters affect plasmonic functionality. This study explores the relationship between plasmonic responses and structural changes in silver nanoclusters, offering important insights that could refine plasmonic device functions. The findings provide critical guidelines for designing plasmonic systems and help bridge the gap between nanocluster science and mesoscopic plasmonics.
Conclusions
The LSPR response of large Agn NCs (n =70, 85, and 100) precisely immobilized on C60 substrates was evaluated using 2PPE. When irradiated with p-polarized light, the photoemission intensity increases dramatically compared to the intensity with s-polarized light, indicating a strong LSPR effect. However, the ratio of photoemission intensity between p- and s-polarized lights, Ip/Is, gradually decreases with larger sizes, specifically for n > 55. The LSPR response in s-polarization becomes observable for these larger sizes, suggesting that Agn NCs adopt flattened structures on the C60 substrate, which is qualitatively consistent with optical electromagnetic field simulation based on classical models. These results demonstrate that Ip/Is serves as an indicator of LSPR, which sensitively responds to surface immobilization structures, allowing for the evaluation of the LSPR response of uniformly dispersed Agn NCs on dielectric films, including their structural correlations. The precise design of LSPR responses through structural control of Agn NCs deposited on different substrates and sizes is expected to contribute to the development of optoelectronic conversion materials based on plasmonic nanostructures.Data availability statement
Data related to this work are available in the ESI.†Conflicts of interest
The authors declare no competing financial interest.Acknowledgements
This work is partly supported by JSPS KAKENHI of Grants-in-Aid for Scientific Research (A) No. 19H00890, for Challenging Research No. 21K18939, and for Transformative Research Areas (A) “Hyper-Ordered Structures Science” (21H05573).References
-
U. Kreibig and M. Vollmer, Optical Properties of Metal Clusters, Springer, Berlin, 1995 Search PubMed
.
- K. L. Kelly, E. Coronado, L. L. Zhao and G. C. Schatz, J. Phys. Chem. B, 2003, 107, 668–677 CrossRef CAS
.
- M. Rycenga, C. M. Cobley, J. Zeng, W. Li, C. H. Moran, Q. Zhang, D. Qin and Y. Xia, Chem. Rev., 2011, 111, 3669–3712 CrossRef CAS PubMed
.
- E. Petryayeva and U. J. Krull, Anal. Chim. Acta., 2011, 706, 8–24 CrossRef CAS PubMed
.
- A. J. Haes and R. P. Van Duyne, J. Am. Chem. Soc., 2002, 124, 10596–10604 CrossRef CAS PubMed
.
- P. Christopher, H. Xin and S. Linic, Nat. Chem., 2011, 3, 467–472 CrossRef CAS PubMed
.
- M. Valamanesh, Y. Borensztein, C. Langlois and E. Lacaze, J. Phys. Chem. C, 2011, 115, 2914–2922 CrossRef CAS
.
- M. Thämer, A. Kartouzian, P. Heister, T. Lünskens, S. Gerlach and U. Heiz, Small, 2014, 10, 2340–2344 CrossRef PubMed
.
- S. Tan, A. Argondizzo, J. Ren, L. Liu, J. Zhao and H. Petek, Nat. Photonics, 2017, 11, 806–812 CrossRef CAS
.
- S. Tan, L. Liu, Y. Dai, J. Ren, J. Zhao and H. Petek, J. Am. Chem. Soc., 2017, 139, 6160–6168 CrossRef CAS PubMed
.
- C. Liang, Z. A. Lu, J. Wu, M. X. Chen, Y. Zhang, B. Zhang, G. L. Gao, S. Li and P. Xu, ACS Appl. Mater. Interfaces, 2020, 12, 54266–54284 CrossRef CAS PubMed
.
- K. Yamagiwa, M. Shibuta and A. Nakajima, ACS Nano, 2020, 14, 2044–2052 CrossRef CAS PubMed
.
- G. Mie, Ann. de. Phys., 1908, 25, 377–445 CrossRef CAS
.
- J. Tiggesbäumker, L. Köller, K. H. Meiwes-Broer and A. Liebsch, Phys. Rev. A: At., Mol., Opt. Phys., 1993, 48, R1749–R1752 CrossRef PubMed
.
- W. A. de Heer, Rev. Mod. Phys., 1993, 65, 611–676 CrossRef CAS
.
- E. Loginov, L. F. Gomez, N. Chiang, A. Halder, N. Guggemos, V. V. Kresin and A. F. Vilesov, Phys. Rev. Lett., 2011, 106, 233401 CrossRef PubMed
.
- C. Xia, C. Yin and V. V. Kresin, Phys. Rev. Lett., 2009, 102, 156802 CrossRef PubMed
.
- S. Kawamura, M. Yamaguchi, S. Kono, M. Arakawa, T. Yasuike, T. Horio and A. Terasaki, J. Phys. Chem. A, 2023, 127, 6063–6070 CrossRef CAS PubMed
.
- N. Iwe, K. Raspe, F. Martinez, L. Schweikhard, K.-H. Meiwes-Broer and J. Tiggesbäumker, Phys. Chem. Chem. Phys., 2023, 25, 1677–1684 RSC
.
- V. Bonačić-Koutecký, L. Češpiva, P. Fantucci, J. Pittner and J. Koutecký, J. Chem. Phys., 1994, 100, 490–506 CrossRef
.
- K. Yabana and G. F. Bertsch, Phys. Rev. A: At., Mol., Opt. Phys., 1999, 60, 3809–3814 CrossRef CAS
.
- E. Cottancin, G. Celep, J. Lermé, M. Pellarin, J. R. Huntzinger, J. L. Vialle and M. Broyer, Theor. Chem. Acc., 2006, 116, 514–523 Search PubMed
.
- J. Yan, Z. Yuan and S. Gao, Phys. Rev. Lett., 2007, 98, 216602 CrossRef PubMed
.
- G.-T. Bae and C. M. Aikens, J. Phys. Chem. C, 2012, 116, 10356–10367 CrossRef CAS
.
- T. Yasuike, K. Nobusada and M. Hayashi, Phys. Rev. A: At., Mol., Opt. Phys., 2011, 83, 013201 CrossRef
.
- T. Yasuike and K. Nobusada, Phys. Chem. Chem. Phys., 2013, 15, 5424–5429 RSC
.
- E. B. Guidez and C. M. Aikens, Nanoscale, 2014, 6, 11512–11527 RSC
.
- M. Kuisma, A. Sakko, T. P. Rossi, A. H. Larsen, J. Enkovaara, L. Lehtovaara and T. T. Rantala, Phys. Rev. B: Condens. Matter Mater. Phys., 2015, 91, 115431 CrossRef
.
- R. Schira and F. Rabilloud, J. Phys. Chem. C, 2019, 123, 6205–6212 CrossRef CAS
.
- M. Shibuta, K. Yamamoto, T. Ohta, T. Inoue, K. Mizoguchi, M. Nakaya, T. Eguchi and A. Nakajima, ACS Nano, 2021, 15, 1199–1209 CrossRef CAS PubMed
.
- M. M. Wind, J. Vlieger and D. Bedeaux, Phys. A, 1987, 141, 33–57 CrossRef
.
- M. Nakaya, T. Iwasa, H. Tsunoyama, T. Eguchi and A. Nakajima, Adv. Funct. Mater., 2014, 24, 1202–1210 CrossRef CAS
.
- M. Nakaya, T. Iwasa, H. Tsunoyama, T. Eguchi and A. Nakajima, Nanoscale, 2014, 6, 14702–14707 RSC
.
- M. Nakaya, T. Iwasa, H. Tsunoyama, T. Eguchi and A. Nakajima, J. Phys. Chem. C, 2015, 119, 10962–10968 CrossRef CAS
.
- I. Horcas, R. Fernández, J. M. Gómez-Rodríguez, J. Colchero, J. Gómez-Herrero and A. M. Baro, Rev. Sci. Instrum., 2007, 78, 013705 CrossRef CAS PubMed
.
- M. Shibuta and A. Nakajima, J. Phys. Chem. Lett., 2023, 14, 3285–3295 CrossRef CAS PubMed
.
- P. B. Johnson and R. W. Christy, Phys. Rev. B: Solid State, 1972, 6, 4370–4379 CrossRef CAS
.
- A. Richter and J. Sturm, Appl. Phys. A: Mater. Sci. Process., 1995, 61, 163–170 CrossRef
.
- P. C. Eklund, A. M. Rao, Y. Wang, P. Zhou, K. A. Wang, J. M. Holden, M. S. Dresselhaus and G. Dresselhaus, Thin Solid Films, 1995, 257, 211–232 CrossRef CAS
.
- M. L. Brongersma, N. J. Halas and P. Nordlander, Nat. Nanotechnol., 2015, 10, 25–34 CrossRef CAS PubMed
.
- N. G. Bastús, J. Piella and V. Puntes, Langmuir, 2016, 32, 290–300 CrossRef PubMed
.
- W. He, X. Huang, X. Ma and J. Zhang, J. Opt., 2022, 51, 142–153 CrossRef
.
- J. A. Scholl, A. L. Koh and J. A. Dionne, Nature, 2012, 483, 421–427 CrossRef CAS PubMed
.
- M. Shabaninezhad and G. Ramakrishna, Plasmonics, 2020, 15, 783–795 CrossRef CAS
.
Footnotes |
| † Electronic supplementary information (ESI) available. See DOI: https://doi.org/10.1039/d4cp01151a |
| ‡ Present address: Department of Physics and Electronics, Graduate School of Engineering, Osaka Metropolitan University, 1-1 Gakuen-cho, Naka-ku, Sakai, Osaka 599-8531, Japan. |
| § Present address: Department of Energy Science and Engineering, Nagoya University, Furo-cho, Chikusa-ku, Nagoya 464-8603, Japan. |
| ¶ Present address: The Toyama Monozukuri Center, 3816-1 Kishi, Yamakita-machi, Ashigarakami-gun, Kanagawa, 258-0112, Japan. |
| This journal is © the Owner Societies 2024 |

