 Open Access Article
Creative Commons Attribution 3.0 Unported Licence
Impact of crystal structure on optical properties and temperature sensing behavior of NaYF4:Yb3+/Er3+ nanoparticles
Charu Dubeya,
Anjana Yadava,
Diksha Balonia,
Santosh Kachhapb,
Sunil Kumar Singhb and
Akhilesh Kumar Singh *a
*a
aDepartment of Physical Sciences, Banasthali Vidyapith, Banasthali-304022, Rajasthan, India. E-mail: akhilesh_singh343@yahoo.com
bDepartment of Physics, Indian Institute of Technology (Banaras Hindu University), Varanasi-221005, India
First published on 11th July 2023
Abstract
We report a comprehensive study of the structural, morphological, and optical properties, and UC-based ratiometric temperature sensing behavior of (α) cubic and (β) hexagonal phases of NaYF4:Yb3+/Er3+ nanoparticles. The α-NaYF4:Yb3+/Er3+ and β-NaYF4:Yb3+/Er3+ nanoparticles were synthesized using co-precipitation and hydrothermal methods, respectively. Powder X-ray diffraction studies confirmed the phase purity of the samples. The morphological studies show uniform particle sizes of both phases; the average particle size of α-NaYF4:Yb3+/Er3+ and β-NaYF4:Yb3+/Er3+ was 9.2 nm and 29 nm, respectively. The Raman spectra reveal five sharp peaks at 253 cm−1, 307 cm−1, 359 cm−1, 485 cm−1, and 628 cm−1 for β-NaYF4:Yb3+/Er3+, whereas α-NaYF4:Yb3+/Er3+ shows two broad peaks centred at 272 cm−1 and 721 cm−1. The optical property measurements show that α- and β-NaYF4:Yb3+/Er3+ phases have distinct upconversion emission and temperature sensing behavior. The upconversion emission measurements show that β-NaYF4:Yb3+/Er3+ has higher overall emission intensities and green/red emission intensity ratio. The temperature-dependent upconversion emission measurements show that α-NaYF4:Yb3+/Er3+ has higher energy separation between 2H11/2 and 4S3/2 energy states. The temperature sensing performed utilizing these thermally coupled energy levels shows a maximum sensitivity of 0.0069 K−1 at 543 K and 0.016 K−1 at 422 K for β-NaYF4:Yb3+/Er3+ and α-NaYF4:Yb3+/Er3+, respectively.
1. Introduction
Upconversion (UC) emission is a process where the absorption of two or more low-energy photons by a material leads to the emission of a single photon of higher energy.1 This process occurs mainly in lanthanide ions (Er3+, Ho3+, Tm3+, etc.) that possess multiple intermediate energy levels with long lifetimes favoring excited state absorption and excited state energy transfer.2 There are various mechanisms for the UC process namely excited state absorption (ESA), energy transfer UC (ETU), cooperative energy transfer between pairs of ions, etc.3,4 The upconverting materials have attracted a lot of interest in bioimaging,5 photovoltaics,6,7 luminescent security inks,8,9 luminescence-based sensing,10,11 etc. The focus of this work would be on temperature sensing using two different phases of an upconverting nanomaterial.The UC-based temperature sensors utilize the emission intensity ratio originating from two closely spaced energy levels of lanthanide ions that have temperature dependencies.12 The advantages of UC-based temperature sensing include high sensitivity, low background noise, and the ability to operate in harsh environments; it is self-referenced (unlike most other thermometers) and can even detect the temperature of nano-dimensional objects.13,14 Additionally, upconverting materials can be tailored to operate at specific temperatures, making them suitable for various applications. Overall, UC emission is a promising technology for temperature sensing with potential applications in fields such as materials science, engineering, and medicine.15 In literature, Er3+, Ho3+, and Tm3+ doped upconverting materials have been utilized for ratio-metric temperature sensing.16,17 Among them, Er3+/Yb3+ doped upconverting materials have been extensively explored, in recent years, because of their high UC efficiency (in comparison to other activators), suitable energy separation between 2H11/2 and 4S3/2 thermally-coupled levels, longer emission lifetime making better signal-to-noise ratio in the temperature measurements, and its biocompatibility making them ideal for use in biological and medical applications.
Here we highlight a brief literature review on Er3+/Yb3+ doped upconverting materials for temperature sensing. Liu et al. studied Er3+-doped tellurite glass fiber for temperature sensing and reported that it possesses high sensitivity and linear response over a wide temperature range.18 Sachin et al. compare the temperature sensing behavior of Yb3+/Er3+ doped CaMoO4 in bulk and nanophosphor and obtained that nanoparticle-based temperature sensors show better results.19 Further, they also report that the incorporation of Bi3+ in the CaMoO4 host reduces the non-radiative channels and creates local symmetry distortion which improves the sensing behavior of Er3+ further. Maciel et al. studied the role of crystallite size and surrounding medium on temperature sensing behavior of Er3+-doped BaTiO3; the experiments performed in air, water, and glycerol in physiological temperature range reveals that temperature sensitivity changes with particle size but it does not alter with the surrounding medium.20 Mahata et al. have shown that the use of Zn2+ improved the UC emission intensity and temperature sensing behavior of BaTiO3:Er3+/Yb3+ nanophosphor.21 Our group investigated the role of host matrix (Y2O3, YVO4, and YPO4) on temperature sensing behavior of Er3+ ions and found a very high-temperature sensitivity i.e. 0.0105 K−1 in YVO4 host.22
Lanthanide-doped NaYF4 exhibits better chemical stability, high UC quantum efficiency, and lower phonon energy than other (e.g., oxide and chloride oxyfluoride) host materials. Cui et al. synthesized NaYF4:Yb3+/Er3+ phosphor by hydrothermal process and studied optical temperature sensing behavior, and the maximum sensitivity for β-phase NaYF4:Yb3+/Er3+ were 0.00466 K−1 at 550 K.23 Tong et al. have synthesized spherical NaYF4:Yb3+/Er3+ micro-/nano-crystals via microwave-assisted hydrothermal route.24 The β-NaYF4:Yb3+/Er3+ show strong green, red, weak blue, and purple UC emissions. The maximum sensitivity for β-NaYF4:Yb3+/Er3+ was 0.0048 K−1 at ∼515 K.24 Tong et al. and Zhang et al. have synthesized β-phase NaYF4:Sm3+/Yb3+@NaYF4:Er3+/Yb3+ and NaYF4:Er3+/Yb3+@NaYF4:Tm3+/Yb3+ core–shell nanostructures by thermal decomposition technique, respectively, and studied their temperature sensing behavior.25,26 The maximum temperature sensitivity was found to be 0.0046 K−1 at 489 K. Their studies showed that the core–shell structure is suitable for accurate temperature detection in the field of photothermal therapy.26 As NaYF4 has two crystal structures, namely, hexagonal phase (β) and cubic phase (α) that provides different crystallographic environments for Er3+ ions and might result in a different UC emission behavior.27 Therefore, the objective of this work is to explore the impact of NaYF4 (host) crystal structure on the structural, optical, and temperature sensing behavior of Yb3+/Er3+ doped in α- and β-NaYF4. The work is of fundamental importance and would be a proof of concept to explore the sensing behavior of other materials that crystallize in different phases, for the development of high-performance optical temperature sensors.
2. Experimental
2.1 Materials
Erbium oxide (Er2O3, 99.99%, Sigma-Aldrich), ytterbium oxide (Yb2O3, 99.99%, Sigma-Aldrich), yttrium oxide (Y2O3, 99.9%, Alfa Aesar), ethanol (99.9%, Analytical CS Reagent), sodium hydroxide (NaOH, 99.99% Sigma-Aldrich), 1-octadecene (ODE, 90% technical grade, Sigma-Aldrich), DI water (H2O, CDH Pvt. Ltd.), ammonium fluoride (NH4F, 95%, Fisher Scientific), oleic acid (OA, 65–88%, Merck), chloroform (CHCl3, 99% Sisco Research Laboratories Pvt. Ltd), and hydrochloric acid (HCl, 37% Sigma-Aldrich), methanol (99%, Ranken Chemicals) were used at raw materials for synthesizing NaYF4:Yb3+/Er3+ phosphor without any further purification.2.2 Synthesis of α-NaYF4:Yb3+/Er3+ by co-precipitation method
The α-NaYF4:Yb3+/Er3+ was synthesized by the co-precipitation method.28 The stoichiometric amount of Y2O3, Yb2O3, and Er2O3 was dissolved in dilute HCl for synthesizing α-NaYF4:Yb3+/Er3+ (α-NaY0.78Yb0.2Er0.02F4). In a 100 mL flask with 16 mL oleic acid and 24 mL 1-octadecene, 1.6 mmol of rare earth chloride was added as an aqueous solution. To remove the solution's moisture content, the reaction mixture was heated at 423 K for 30 min while being continuously dry N2 purged, and then it was allowed to cool at ambient temperature (300 K). The aforementioned solution was then supplemented with 4.8 mmol NH4F and 1.6 mmol NaOH dissolved in 20 mL of methanol, and stirred for 30 minutes. The reaction mixture was heated at 350 K under constant dry N2 purging until the entire methanol had evaporated (around 1.5 hours). The reaction mixture was heated to 513 K for 45 min while being continuously purged with dry N2. After that, it was cooled to room temperature. By adding ethanol to the reaction mixture, the synthesized nanoparticles were precipitated and then collected by centrifugation. The nanoparticles were repeatedly cleaned in ethanol before being dispersed in chloroform. In the co-precipitation method the reaction temperature, reaction time, and ligand molecules control the phase purity and size/morphology of the synthesized upconverting nanoparticles. Kavand et al. have reported that for the co-precipitation process carried out in a round bottom flask at 573 K β nucleation starts after 30 min.29 Chen and Wang have shown that the introduction of oleylamine regulates phase transformation from the α-phase to the β-phase and also reduces the required temperature for phase transformation.302.3 Synthesis of β-NaYF4:Yb3+/Er3+ by hydrothermal method
To synthesize β-NaYF4:Yb3+/Er3+ (β-NaY0.78Yb0.2Er0.02F4) by hydrothermal method, 7.5 mL DI water solution of 1.5 g NaOH was mixed with 25 mL of ethanol and 25 mL of oleic acid under stirring. To the resulting mixture, 10 mL aqueous solution of lanthanide chloride (0.5735 g YCl3, 0.1616 g YbCl3, and 0.01333 g ErCl3) and 5 mL methanol solution of 0.3741 g NH4F were added while stirring. In 100 mL of Teflon-lined autoclave, the solution was transferred, and it was heated at 473 K for 5 hours. The resulting phosphor was centrifuged, collected, and then cleaned multiple times with ethanol and DI water before being redispersed in cyclohexane. The advantage of the hydrothermal process is that it requires lower temperature, a one-step synthetic procedure, environmental friendliness, good phase control, and uniform particle size.312.4 Characterization
For structural analysis, powder samples were characterized using Bruker D8 Advance X-ray diffractometer operating at 40 kV tube voltage and 40 mA current in the 2θ range 10 to 90°. The Tecnai G2 TWIN was used to take TEM pictures of the NaYF4:Yb3+/Er3+ phosphor while operating at 200 kV acceleration voltages. The Raman spectra of NaYF4:Yb3+/Er3+ phosphor were recorded using a Thermo Scientific DXRxi Raman imaging microscope instrument equipped with a 532 nm laser. To capture the photoluminescence (PL) excitation and emission spectra of the powder sample, a fluoromax-plus spectrofluorometer with a 150 W xenon flash lamp was employed (without using an integrating sphere). PL decay measurements were carried out at the same set-up using a pulsed xenon lamp (25 W). The 976 nm tunable continuous-wave diode laser was used as an external excitation source in the same setup to record the UC emissions. A homemade heater equipped with a k-type thermocouple was utilized for the temperature-dependent UC emission measurements, and it was placed right next to the laser's focal point. A variac was used to control the temperature of the (by controlling the voltage of the heater) sample.3. Results and discussions
3.1 Crystal structure
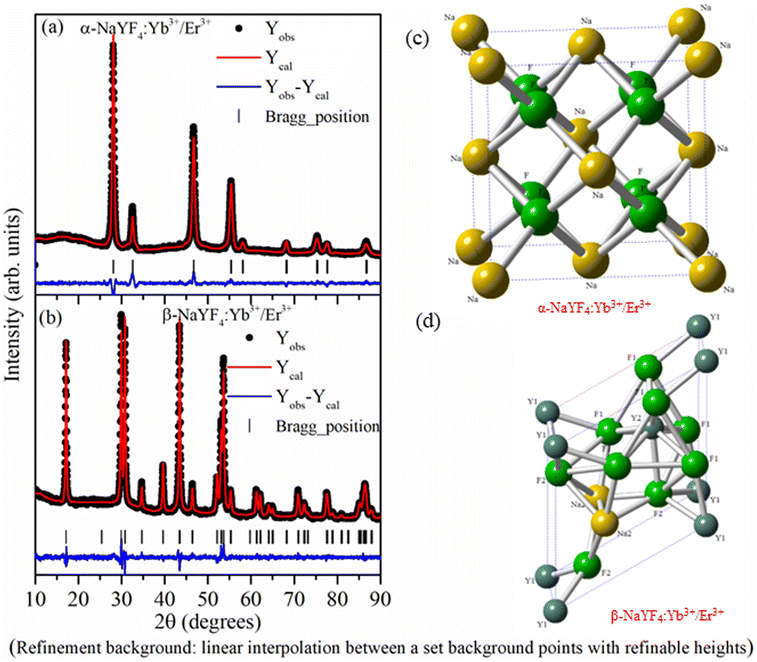
As the crystallographic structure and phase purity play an important role in the UC emission intensity, the powder X-ray diffraction data of NaYF4:Yb3+/Er3+ nanophosphor prepared using co-precipitation and hydrothermal methods were recorded. The Rietveld refinement using the FullProf software was used to analyze powder X-ray data. The calculated intensity profile was compared with experimental data and the best fit was obtained by the least squares fitting method. The R-factor (residual functions), which is an indicator of the quality of fit, is minimized to attain the best refinement. Fig. 1 reveals that all the XRD peaks in the sample synthesized by co-precipitation and hydrothermal methods were indexed considering the Fm![[3 with combining macron]](https://www.rsc.org/images/entities/char_0033_0304.gif) m space group of cubic (α-NaYF4:Yb3+/Er3+ phase) and P
m space group of cubic (α-NaYF4:Yb3+/Er3+ phase) and P![[6 with combining macron]](https://www.rsc.org/images/entities/char_0036_0304.gif) space group of hexagonal (β-NaYF4:Yb3+/Er3+) crystal systems, respectively. There is no impurity phase or overlapping of α- and β-NaYF4:Yb3+/Er3+ phases.
space group of hexagonal (β-NaYF4:Yb3+/Er3+) crystal systems, respectively. There is no impurity phase or overlapping of α- and β-NaYF4:Yb3+/Er3+ phases.
In the α-NaYF4:Yb3+/Er3+ phase, 4a crystallographic sites of Fm![[3 with combining macron]](https://www.rsc.org/images/entities/char_0033_0304.gif) m space group is occupied by Na+ and Y3+/Yb3+/Er3+ cations in a 1
m space group is occupied by Na+ and Y3+/Yb3+/Er3+ cations in a 1![[thin space (1/6-em)]](https://www.rsc.org/images/entities/char_2009.gif) :
:![[thin space (1/6-em)]](https://www.rsc.org/images/entities/char_2009.gif) 1 ratio, whereas F− occupies the 8c crystallographic sites. In the β-NaYF4:Yb3+/Er3+ phase, F− occupies 3j and 3k crystallographic sites. Metal cations occupy three different crystallographic sites. Out of three sites, 1a and 1f are 9-fold coordinated with fluoride ions forming a tricapped trigonal prism. The 1a site is occupied by Y3+/Yb3+/Er3+ cations, and the 1f site is occupied by Na+ and Y3+/Yb3+/Er3+ cations in a 1
1 ratio, whereas F− occupies the 8c crystallographic sites. In the β-NaYF4:Yb3+/Er3+ phase, F− occupies 3j and 3k crystallographic sites. Metal cations occupy three different crystallographic sites. Out of three sites, 1a and 1f are 9-fold coordinated with fluoride ions forming a tricapped trigonal prism. The 1a site is occupied by Y3+/Yb3+/Er3+ cations, and the 1f site is occupied by Na+ and Y3+/Yb3+/Er3+ cations in a 1![[thin space (1/6-em)]](https://www.rsc.org/images/entities/char_2009.gif) :
:![[thin space (1/6-em)]](https://www.rsc.org/images/entities/char_2009.gif) 1 ratio. Within the distorted octahedral, formed by six fluoride anions, the half of 2h site is occupied by Na+ and half of the sites are vacant. Fig. 1(c) and (d) show the crystal structure of α-NaYF4:Yb3+/Er3+ and β-NaYF4:Yb3+/Er3+ phosphor based on the Rietveld refinement parameters. Table 1 shows the atomic positions of different atoms, the occupancy factor of different crystallographic sites, lattice parameters, and other refined parameters.
1 ratio. Within the distorted octahedral, formed by six fluoride anions, the half of 2h site is occupied by Na+ and half of the sites are vacant. Fig. 1(c) and (d) show the crystal structure of α-NaYF4:Yb3+/Er3+ and β-NaYF4:Yb3+/Er3+ phosphor based on the Rietveld refinement parameters. Table 1 shows the atomic positions of different atoms, the occupancy factor of different crystallographic sites, lattice parameters, and other refined parameters.
![[3 with combining macron]](https://www.rsc.org/images/entities/char_0033_0304.gif) m), β-NaYF4:Yb3+/Er3+ (space group: P
m), β-NaYF4:Yb3+/Er3+ (space group: P![[6 with combining macron]](https://www.rsc.org/images/entities/char_0036_0304.gif) ) nanophosphors
) nanophosphors
| Phase | Atoms | Positional coordinates | Occupancy | Multiplicity | ||
|---|---|---|---|---|---|---|
| X | Y | Z | ||||
| α-Phase | Na | 0.0000(0) | 0.0000(0) | 0.0000(0) | 0.01 | 4a |
| Y/Yb/Er | 0.0000(0) | 0.0000(0) | 0.0000(0) | 0.01 | 4a | |
| F | 0.2500(0) | 0.2500(0) | 0.2500(0) | 0.042 | 8c | |
| a = b = c = 5.5010 (1) Å, Rp = 3.59, Rwp = 4.80, Rexp = 12.6, χ2 = 3.42 | ||||||
| β-Phase | Na1 | 0.6666(0) | 0.3333(0) | 0.5000(0) | 0.083 | 1f |
| Na2 | 0.3333(0) | 0.6666(0) | 0.8641(24) | 0.167 | 2h | |
| Y1 | 0.0000(0) | 0.0000(0) | 0.0000(0) | 0.167 | 1a | |
| Y2 | 0.6666(0) | 0.3333(0) | 0.5000(0) | 0.083 | 1f | |
| F1 | 0.6669(0) | 0.07814(18) | 0.0000(0) | 0.333 | 3j | |
| F2 | 0.7107(17) | 0.7606(18) | 0.5000(0) | 0.333 | 3k | |
| a = b = 5.9752(2) Å, c = 3.5086(2) Å, Rp = 4.34, Rwp = 5.78, Rexp = 2.87, χ2 = 4.06 | ||||||
3.2 Morphology
The TEM images of NaYF4:Yb3+/Er3+ nanophosphor synthesized using co-precipitation (α-phase) and hydrothermal (β-phase) methods were captured for morphological studies and to analyze particle size. Fig. 2(a and b) reveals the cubic and spherical morphology of α-NaYF4:Yb3+/Er3+ and β-NaYF4:Yb3+/Er3+, respectively. The sample synthesized using the hydrothermal method shows a bigger particle size than synthesized using the co-precipitation method. The particle sizes were quite uniform. To determine the average particle size from TEM images ∼150 particles were evaluated. A Gaussian fit to the histogram shown in Fig. 2(c and d) indicates the average particle size of α-NaYF4:Yb3+/Er3+ and β-NaYF4:Yb3+/Er3+ as 9.2 nm and 29 nm, respectively.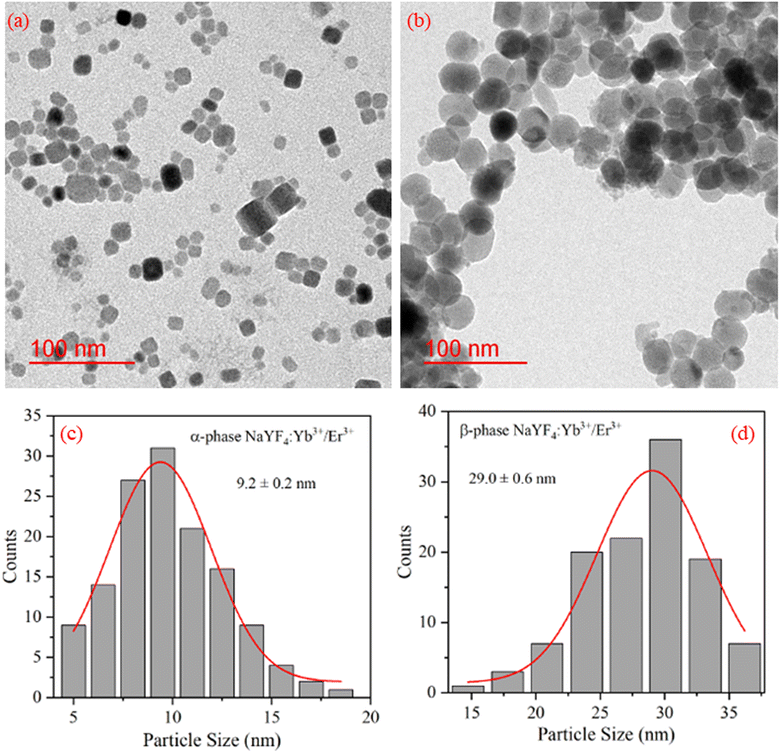 | ||
| Fig. 2 TEM image of (a) α-NaYF4:Yb3+/Er3+, (b) β-NaYF4:Yb3+/Er3+ nanophosphor. (c) and (d) shows the particle size distribution of α-NaYF4:Yb3+/Er3+, and β-NaYF4:Yb3+/Er3+ nanophosphor, respectively. | ||
3.3 Raman studies
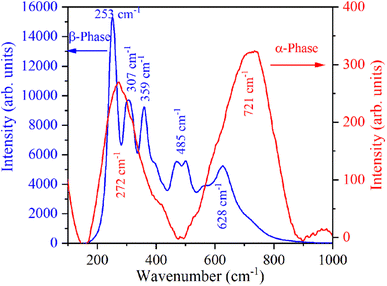
The Raman spectrum of β-NaYF4:Yb3+/Er3+ shown in Fig. 3 reveals five Raman peaks at 253 cm−1, 307 cm−1, 359 cm−1, 485 cm−1, and 628 cm−1. Similar Raman spectra were also reported in the literature for β-NaYF4:Yb3+/Er3+.32,33 Klier and Kumke observed Raman peaks at 251 cm−1, 303 cm−1, 359 cm−1, 492 cm−1, and 625 cm−1.32 Shan et al. have attributed Raman peaks observed at 485 cm−1, and 628 cm−1 to organic surfactant present at the nanoparticle surfaces.33 Further in β-NaYF4:Yb3+/Er3+ the highest phonon energy is 500 cm−1 which makes it an excellent host for UC.34,35 The Raman spectrum of α-NaYF4:Yb3+/Er3+ shows two broad peaks centered at 272 cm−1 and 721 cm−1. Broad Raman band above 500 cm−1 is the signature of α-NaYF4:Yb3+/Er3+.34,363.4 Down-shifting emission
Fig. 4 shows the excitation and emission spectrum of β-NaYF4:Yb3+/Er3+ monitored at 546 nm emission and 375 nm excitation wavelengths, respectively. The excitation spectrum shows peaks at 362 nm, 375 nm, 404 nm, 487 nm, and 518 nm that correspond to 4G9/2 ← 4I15/2, 4G11/2 ← 4I15/2, 2H9/2 ← 4I15/2, 4F7/2 ← 4I15/2, and 2H11/2 ← 4I15/2 transitions of Er3+ ions, respectively. The down-shifting emission intensities in β-NaYF4:Yb3+/Er3+ are quite weak that further diminish in the α-NaYF4:Yb3+/Er3+ nanophosphor and it was not recordable. The PL decay of the green emission band in β-NaYF4:Yb3+/Er3+ was monitored at 375 nm excitation and 539 nm emission wavelengths, respectively, shown in Fig. 5. The average lifetime determined by the tri-exponential fit was found to be 164 μs.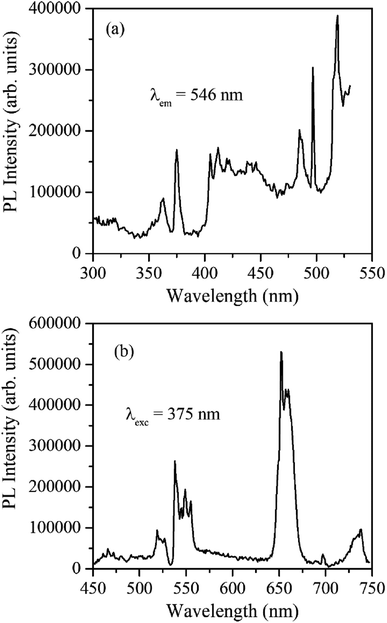 | ||
| Fig. 4 (a) PL excitation spectrum of β-NaYF4:Yb3+/Er3+ monitored at 546 nm emission wavelength. (b) The PL emission spectrum of β-NaYF4:Yb3+/Er3+ was monitored at 375 nm excitation wavelength. | ||
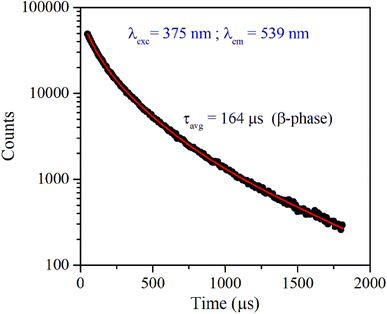 | ||
| Fig. 5 Time-resolved PL of β-NaYF4:Yb3+/Er3+ phosphor monitored at 375 nm excitation and 539 nm emission wavelength, respectively. | ||
3.5 UC emission
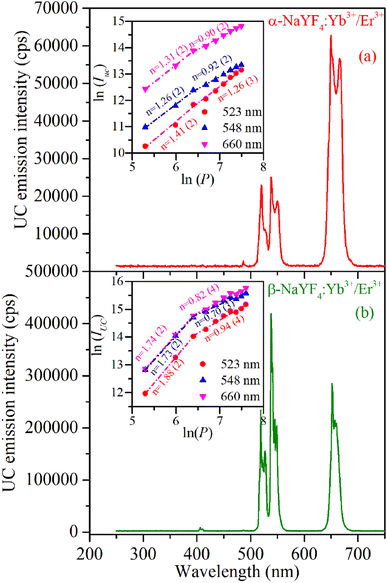
The UC emission spectra of α-NaYF4:Yb3+/Er3+ and β-NaYF4:Yb3+/Er3+ (shown in Fig. 6) were recorded using a 976 nm wavelength CW diode laser. The 976 nm wavelength photons absorbed by the Er3+ ions in its ground state result in the resonant excitation of the 4I11/2 level, moreover it is resonant with 2F7/2 → 2F5/2 transition of Yb3+ which has high absorption cross section than Er3+ ions and works as a sensitizer to Er3+ ions.37 The α-NaYF4:Yb3+/Er3+ shows emission bands at 523, 548, and 660 nm corresponding to the 2H11/2 → 4I15/2, 4S3/2 → 4I15/2 and 4F9/2 → 4I15/2 transitions of Er3+ ion, respectively. The β-NaYF4:Yb3+/Er3+ along with these emission bands show an additional emission band at 407 nm corresponding to the 2H9/2 → 4I15/2 transition of Er3+ ions. The comparison of UC emission reveals that the overall emission intensity of β-NaYF4:Yb3+/Er3+ is 4.6 times higher than that of α-NaYF4:Yb3+/Er3+. Furthermore, in β-NaYF4:Yb3+/Er3+ the intensity ratio of green to red emission bands is 1.437 whereas it is 0.376 in α-NaYF4:Yb3+/Er3+ resulting in greenish and reddish emission color in β-NaYF4:Yb3+/Er3+ and α-NaYF4:Yb3+/Er3+, respectively. The difference in the UC emission behavior might be because of higher phonon frequency and different crystallographic environments for Er3+ ions in α-NaYF4:Yb3+/Er3+. The distinct Stark splitting in the emission bands is induced by the crystal field of ligands around the Er3+ ions in the host lattice.As the UC is a non-linear optical process the emission intensities of various bands are proportional to the ‘nth’ power of laser excitation power.
| IUC ∝ Pn | (1) |
3.6 Temperature sensing
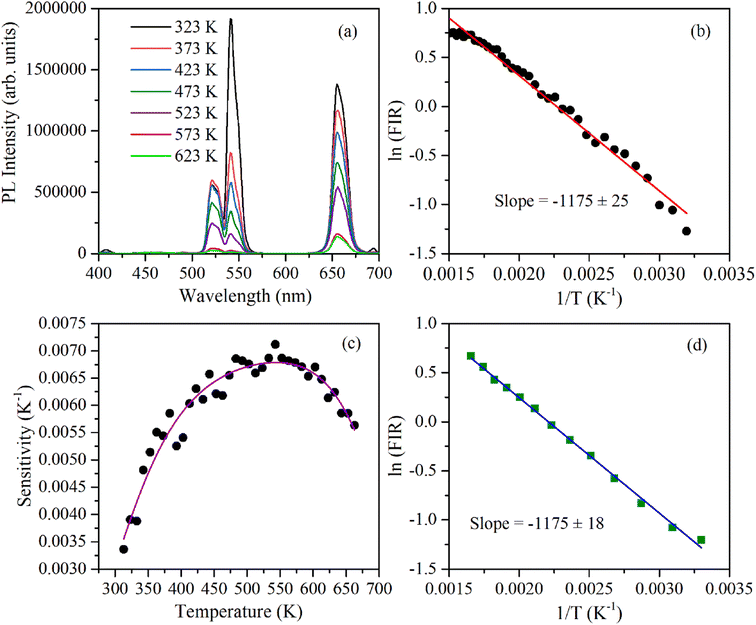
The 2H11/2 and 4S3/2 energy levels in the Er3+ ions are thermally coupled to each other, an increase in the temperature results in more population to the 2H11/2 energy level. This in turn reflected in a change in the emission intensity ratio of 2H11/2 → 4I15/2 and 4S3/2 → 4I15/2 transitions of Er3+ ions centered at 523 nm and 548 nm, respectively. In the temperature-dependent UC emission measurements, the relative populations of 2H11/2 and 4S3/2 energy levels can be expressed by the Boltzmann distribution function that leads to,
 | (2) |
To calculate the temperature sensitivity we take the natural logarithm of expression (2),
 | (3) |
 | (4) |
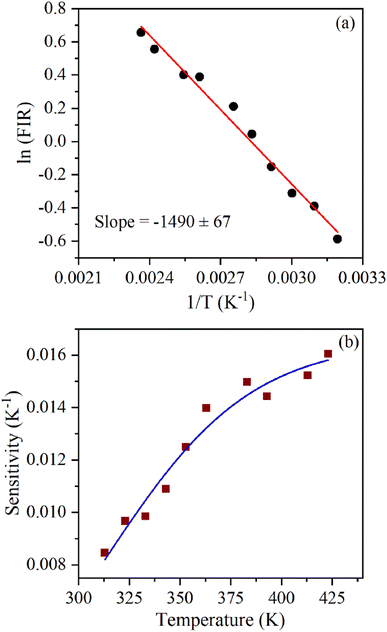
The energy separation between 2H11/2 and 4S3/2 thermally coupled levels of Er3+ ions were calculated for α- and β-NaYF4:Yb3+/Er3+ using slope obtained in Fig. 7(b) and 8(a) and it was observed 816 cm−1 and 1035 cm−1, respectively. This could also be a reason for the distinct temperature sensitivity of α- and β-phases of NaYF4:Yb3+/Er3+. As overall UC emission intensity for α-NaYF4:Yb3+/Er3+ was less in comparison to β-NaYF4:Yb3+/Er3+ it could not be explored for a wide temperature range. However, because of biocompatibility, small particle size and high sensitivity α-NaYF4:Yb3+/Er3+ phosphor could be a good choice for temperature sensing at the physiological range in biological applications.5,41,42
4. Conclusion
Phase pure α- (cubic) and β-NaYF4:Yb3+/Er3+ (hexagonal) nanoparticles were synthesized. Both the phases show uniform morphology with an average particle size of 9.2 nm and 29 nm for α-NaYF4:Yb3+/Er3+ and β-NaYF4:Yb3+/Er3+, respectively. The Raman studies show completely different behavior for both phases. The UC studies show that the green-to-red emission intensity ratio is 1.437 and 0.376 in β-NaYF4:Yb3+/Er3+ and α-NaYF4:Yb3+/Er3+, respectively. Temperature sensing performed utilizing the fluorescence intensity ratio of 2H11/2 and 4S3/2 levels of Er3+ ions shows higher maximum sensitivity (0.016 K−1) for α-NaYF4:Yb3+/Er3+ than (0.069 K−1) β-NaYF4:Yb3+/Er3+ nanoparticles. The obtained results suggest that β-NaYF4:Yb3+/Er3+ could be promising for temperature sensing in a wide temperature range, whereas α-NaYF4:Yb3+/Er3+ could be used for physiological range in biological applications.Author contributions
Charu Dubey: acquisition of data, analysis and/or interpretation of data, drafting the manuscript, revising the manuscript. Anjana Yadav: acquisition of data, analysis and/or interpretation of data. Diksha Baloni: acquisition of data, drafting the manuscript. Santosh Kachhap: Rietveld refinement and structural analysis, Sunil Kumar Singh: analysis and/or interpretation of data, revising the manuscript. Akhilesh Kumar Singh: conceptualization, analysis and/or interpretation of data, drafting the manuscript, revising the manuscript.Conflicts of interest
There are no conflicts to declare.Acknowledgements
SKS is thankful to the Department of Science and Technology (DST), New Delhi, India for the core research grant (CRG/2022/001393).References
- J. Zhou, Q. Liu, W. Feng, Y. Sun and F. Li, Chem. Rev., 2015, 115, 395–465 CrossRef CAS PubMed.
- F. Auzel, Chem. Rev., 2004, 104, 139–173 CrossRef CAS PubMed.
- H. Dong, L.-D. Sun and C.-H. Yan, Nanoscale, 2013, 5, 5703–5714 RSC.
- T. Catunda, L. A. O. Nunes, A. Florez, Y. Messaddeq and M. A. Aegerter, Phys. Rev. B, 1996, 53, 6065–6070 CrossRef CAS PubMed.
- M. Rai, S. K. Singh, A. K. Singh, R. Prasad, B. Koch, K. Mishra and S. B. Rai, ACS Appl. Mater. Interfaces, 2015, 7, 15339–15350 CrossRef CAS PubMed.
- A. Shalav, B. S. Richards and M. A. Green, Sol. Energy Mater. Sol. Cells, 2007, 91, 829–842 CrossRef CAS.
- A. K. Singh, S. K. Singh, P. Kumar, B. K. Gupta, R. Prakash and S. B. Rai, Sci. Adv. Mater., 2014, 6, 405–412 CrossRef CAS.
- C. Dubey, A. Yadav, D. Baloni, S. Singh, A. K. Singh, S. K. Singh and A. K. Singh, Methods Appl. Fluoresc., 2023, 11, 025001 CrossRef PubMed.
- P. K. Shahi, P. Singh, A. K. Singh, S. K. Singh, S. B. Rai and R. Prakash, J. Colloid Interface Sci., 2017, 491, 199–206 CrossRef CAS PubMed.
- R. S. Y. Monika, A. Bahadur and S. B. Rai, RSC Adv., 2019, 9, 40092–40108 RSC.
- A. Pandey, V. K. Rai, V. Kumar, V. Kumar and H. C. Swart, Sens. Actuators, B, 2015, 209, 352–358 CrossRef CAS.
- A. K. Singh, S. K. Singh, B. K. Gupta, R. Prakash and S. B. Rai, Dalton Trans., 2013, 42, 1065–1072 RSC.
- F. Vetrone, R. Naccache, A. Zamarrón, A. Juarranz de la Fuente, F. Sanz-Rodríguez, L. Martinez Maestro, E. Martín Rodriguez, D. Jaque, J. García Solé and J. A. Capobianco, ACS Nano, 2010, 4, 3254–3258 CrossRef CAS PubMed.
- G. Lin and D. Jin, ACS Sens., 2021, 6, 4272–4282 CrossRef CAS PubMed.
- J. Chen and J. X. Zhao, Sensors, 2012, 12, 2414–2435 CrossRef CAS PubMed.
- R. S. Yadav, S. J. Dhoble and S. B. Rai, Sens. Actuators, B, 2018, 273, 1425–1434 CrossRef CAS.
- A. Pandey and V. K. Rai, Dalton Trans., 2013, 42, 11005–11011 RSC.
- L. Liu, Z. Sun, C. Ma, R. Tao, J. Zhang, H. Li and E. Zhao, Mater. Res. Bull., 2018, 105, 306–311 CrossRef CAS.
- S. Singh, S. Kachhap, A. K. Singh, S. Pattnaik and S. K. Singh, Methods Appl. Fluoresc., 2022, 10, 044004 CrossRef PubMed.
- G. S. Maciel, M. A. R. C. Alencar, C. B. de Araújo and A. Patra, J. Nanosci. Nanotechnol., 2010, 10, 2143–2148 CrossRef CAS PubMed.
- M. K. Mahata, T. Koppe, T. Mondal, C. Brüsewitz, K. Kumar, V. Kumar Rai, H. Hofsäss and U. Vetter, Phys. Chem. Chem. Phys., 2015, 17, 20741–20753 RSC.
- A. K. Singh, P. K. Shahi, S. B. Rai and B. Ullrich, RSC Adv., 2015, 5, 16067–16073 RSC.
- Y. Cui, Q. Meng, S. Lü and W. Sun, ChemistrySelect, 2019, 4, 4316–4323 CrossRef CAS.
- L. Tong, X. Li, R. Hua, X. Li, H. Zheng, J. Sun, J. Zhang, L. Cheng and B. Chen, J. Lumin., 2015, 167, 386–390 CrossRef CAS.
- L. Tong, X. Li, J. Zhang, S. Xu, J. Sun, H. Zheng, Y. Zhang, X. Zhang, R. Hua, H. Xia and B. Chen, Opt. Express, 2017, 25, 16047–16058 CrossRef CAS PubMed.
- Y. Zhang, S. Xu, X. Li, J. Zhang, J. Sun, H. Xia, R. Hua and B. Chen, Opt. Mater. Express, 2018, 8, 368–384 CrossRef CAS.
- G. A.-O. Leménager, S. Tusseau-Nenez, M. Thiriet, P. E. Coulon, K. Lahlil, E. Larquet and T. A.-O. Gacoin, Nanomaterials, 2019, 9, 1560 CrossRef PubMed.
- R. G. Geitenbeek, P. T. Prins, W. Albrecht, A. van Blaaderen, B. M. Weckhuysen and A. Meijerink, J. Phys. Chem. C, 2017, 121, 3503–3510 CrossRef CAS PubMed.
- A. Kavand, C. A. Serra, C. Blanck, M. Lenertz, N. Anton, T. F. Vandamme, Y. Mély, F. Przybilla and D. Chan-Seng, ACS Appl. Nano Mater., 2021, 4, 5319–5329 CrossRef CAS.
- B. Chen and F. Wang, Inorg. Chem. Front., 2020, 7, 1067–1081 RSC.
- C. Yan, H. Zhao, D. F. Perepichka and F. Rosei, Small, 2016, 12, 3888–3907 CrossRef CAS PubMed.
- D. T. Klier and M. U. Kumke, J. Mater. Chem. C, 2015, 3, 11228–11238 RSC.
- J. Shan, M. Uddi, N. Yao and Y. Ju, Adv. Funct. Mater., 2010, 20, 3530–3537 CrossRef CAS.
- M. D. Modak, G. Damarla, S. Maity, A. K. Chaudhary and P. Paik, RSC Adv., 2019, 9, 38246–38256 RSC.
- C. Renero-Lecuna, R. Martín-Rodríguez, R. Valiente, J. González, F. Rodríguez, K. W. Krämer and H. U. Güdel, Chem. Mater., 2011, 23, 3442–3448 CrossRef CAS.
- H. Assaaoudi, G.-B. Shan, N. Dyck and G. P. Demopoulos, CrystEngComm, 2013, 15, 4739–4746 RSC.
- R. A. Talewar, S. Mahamuda, K. Swapna, M. Venkateswarlu and A. S. Rao, Mater. Res. Bull., 2021, 136, 111144 CrossRef CAS.
- S. Pattnaik and V. K. Rai, Mater. Res. Bull., 2020, 125, 110761 CrossRef CAS.
- A. Siaï, P. Haro-González, K. Horchani Naifer and M. Férid, Opt. Mater., 2018, 76, 34–41 CrossRef.
- A. M. Voiculescu, S. Hau, G. Stanciu, D. Avram and C. Gheorghe, J. Lumin., 2022, 242, 118602 CrossRef CAS.
- Y. Liu, D. Tu, H. Zhu and X. Chen, Chem. Soc. Rev., 2013, 42, 6924–6958 RSC.
- Z. Yi, X. Li, Z. Xue, X. Liang, W. Lu, H. Peng, H. Liu, S. Zeng and J. Hao, Adv. Funct. Mater., 2015, 25, 7119–7129 CrossRef CAS.
| This journal is © The Royal Society of Chemistry 2023 |

