
Oxygenated copper vanadium selenide composite nanostructures as a cathode material for zinc-ion batteries with high stability up to 10![[thin space (1/6-em)]](https://www.rsc.org/images/entities/h2_char_2009.gif) 000 cycles†
000 cycles†
D.
Narsimulu
 ,
B. N. Vamsi
Krishna
,
R.
Shanthappa
and
Jae Su
Yu
*
,
B. N. Vamsi
Krishna
,
R.
Shanthappa
and
Jae Su
Yu
*
Department of Electronics and Information Convergence Engineering, Institute for Wearable Convergence Electronics, Kyung Hee University, 1732 Deogyeong-aero, Giheung-gu, Yongin-si, Gyeonggi-do 17104, Republic of Korea. E-mail: jsyu@khu.ac.kr
First published on 31st January 2023
Abstract
The development of aqueous zinc-ion batteries (AZiBs) towards practical implementations is hampered by unsuitable host cathode materials. Herein, we reported a high-capacity, stable, and long-cycle-life (10![[thin space (1/6-em)]](https://www.rsc.org/images/entities/char_2009.gif) 000 cycles) oxygenated copper vanadium selenide composite material (Cu0.59V2O5/Cu0.828V2O5@Cu1.8Se1/Cu3Se2, denoted as O–CuVSe) as a cathode for AZiBs. The newly constructed O–CuVSe composite cathode can be operated in the wide potential window of 0.4–2.0 V, exhibiting a high specific capacity of 154 mA h g−1 at 0.2 A g−1 over 100 cycles. Interestingly, the O–CuVSe composite cathode delivered excellent specific capacities of 117 and 101.4 mA h g−1 over 1000 cycles at 1 and 2 A g−1, respectively. Even at a high current density of 5 A g−1, the cathode delivered a high reversible capacity of 74.5 mA h g−1 over an ultra-long cycling life of 10000 cycles with no obvious capacity fading. Apart from this, the cathode exhibited excellent rate capability at different current densities. The superior electrochemical properties originate from the synergistic effects between the oxygen vacancy engineering and interlayer doping of Cu ions to increase the structural stability during the cycling, enhancing the electron/ion transport kinetics. Moreover, the Zn2+ storage mechanism in the Zn/O–CuVSe aqueous rechargeable battery was explored. This study provides a new opportunity for the fabrication of different kinds of a new class of cathode materials for high-voltage and high-capacity AZiBs and other energy storage devices.
000 cycles) oxygenated copper vanadium selenide composite material (Cu0.59V2O5/Cu0.828V2O5@Cu1.8Se1/Cu3Se2, denoted as O–CuVSe) as a cathode for AZiBs. The newly constructed O–CuVSe composite cathode can be operated in the wide potential window of 0.4–2.0 V, exhibiting a high specific capacity of 154 mA h g−1 at 0.2 A g−1 over 100 cycles. Interestingly, the O–CuVSe composite cathode delivered excellent specific capacities of 117 and 101.4 mA h g−1 over 1000 cycles at 1 and 2 A g−1, respectively. Even at a high current density of 5 A g−1, the cathode delivered a high reversible capacity of 74.5 mA h g−1 over an ultra-long cycling life of 10000 cycles with no obvious capacity fading. Apart from this, the cathode exhibited excellent rate capability at different current densities. The superior electrochemical properties originate from the synergistic effects between the oxygen vacancy engineering and interlayer doping of Cu ions to increase the structural stability during the cycling, enhancing the electron/ion transport kinetics. Moreover, the Zn2+ storage mechanism in the Zn/O–CuVSe aqueous rechargeable battery was explored. This study provides a new opportunity for the fabrication of different kinds of a new class of cathode materials for high-voltage and high-capacity AZiBs and other energy storage devices.
1. Introduction
Rechargeable lithium (Li)-ion batteries (LiBs) have attracted great attention in a wide range of energy sources, including portable electronics, electric vehicles, and hybrid electric vehicles, owing to their high energy densities.1–5 However, a shortage of Li sources in the earth's crust and the unsafety of electrolytes have limited the further application of LiBs in large-scale energy storage systems (EESs). A promising alternative to LiBs, which is coupled with low-cost and environmental-friendly electrolytes, needs to be developed. Aqueous rechargeable batteries are promising energy storage devices because of their low cost and safe operation with electrolytes.6–10 Among them, aqueous zinc-ion batteries (AZiBs) have attracted considerable attention for the implementation of energy sources in EES demands owing to their outstanding properties of Zn, such as high abundance, high theoretical capacity (820 mA h g−1), and safe water-based electrolyte.9–16 More importantly, Zn has a high volumetric theoretical capacity (5854 mA h cm−3) and low redox potential (−0.78 V versus standard hydrogen electrode) in comparison with other aqueous rechargeable batteries.13,17,18 Despite these advantages, the development of AZiBs is currently hindered by the lack of suitable host cathode materials for fast and reversible electrochemical Zn2+ storage. Thus, finding a suitable cathode material with stable and high reversible capacity for AZiBs has become a challenging task. So far, manganese-based materials, vanadium (V)-based materials, and Prussian blue analogues have been employed as a cathode for AZiBs to navigate this issue.14,19–29 Among them, V-based materials have attracted increasing interest for LIBs and AZiBs owing to their fascinating properties such as multiple oxidation states and high abundance.21,30–33 Like other materials, V-based cathodes also suffer from poor charge transfer kinetics and unstable crystal structure during the charge/discharge process, leading to rapid capacity decay and inferior rate performance. To solve this problem, researchers have devoted considerable attention to improving the Zn-ion storage performance of V-based cathodes by introducing the morphology of different nanostructures, structural modification, and cation/molecular pillaring.34–39 Insertion of metal ions into the interlayer of the V-based materials including V2O5 and VSe is an efficient strategy to improve the electrochemical properties. The metal ions could act as a pillar, which can alter the structural stability and thus result in electrochemical performance improvement. Metal ions, including Ca+, Na+, Li+, K+ Mn+, and Mg+, have been promoted as excellent pillars for the V-based materials.36,37,40–43 F. Nazar et al. reported the insertion of Zn ions and water molecules into V2O5 (i.e., Zn0.25V2O5·nH2O). The Zn0.25V2O5·nH2O cathode delivered a specific capacity of 260 mA h g−1 over 1000 cycles at 4 A g−1.44 Duan Bin et al. fabricated the (NH4)0.5V2O5 cathode, delivering a discharge capacity of 418.4 mA h g−1 at 0.1 A g−1 over 2000 cycles.45 Another report by Chuan Xia et al. demonstrated the layered calcium vanadium oxide bronze (Ca0.25V2O5·nH2O) as a cathode material of AZiBs. The Ca0.25V2O5·nH2O cathode was prolonged for 3000 cycles with a capacity of 340 mA h g−1.43 Recently, metal selenides exhibited fascinating properties, such as better catalytic activity and narrower bandgap than their hydroxide/oxide counterparts.46 Thus, metal selenides can be also employed as good cathode materials for AZiBs.47 In particular, bimetallic selenide exhibited excellent energy storage properties. To confirm this, Liji Wang et al. fabricated a layered VSe cathode for AZiBs and described the Zn2+ storage mechanism in the VSe cathode host. The VSe cathode delivered reversible capacities of 250.6 and 132.6 mA h g−1 at 0.2 and 5 A g−1, respectively.48 Yocun Bai et al. obtained binder-free VSe nanosheets with a capacity of 265.2 mA h g−1 over 150 cycles at 0.2 A g−1.49 However, the above-mentioned cathode materials operated conventionally at low voltage (below 1.6 V), and their cycling stability is limited to only a few cycles, which does not meet the rapidly growing demands for EESs. Therefore, the development of a stable and high-capacity cathode material with high operating voltage remains a challenging task. Zhe Chen et al. fabricated a Zn-ion full battery using zinc hexacyanoferrate as a cathode and metallic Zn as an anode. The fabricated battery was operated at a high voltage of 2.4 V.50 Chunyi Zhi et al. fabricated a high voltage supported Ni-based metal–organic frameworks electrode, which delivered a rate capability of 139.4 mA h g−1 at 2.5 A g−1.51 Huilin Cui et al. developed a high voltage organic cathode that ran continuously for 8000 cycles with a capacity retention of 82%.52 Longtao Ma et al. developed a 2.2 V AZiB using Co3O4 as a cathode material, and it was sustained for 5000 cycles.53 To the best of the author's knowledge, copper vanadium selenide as a cathode for AZiBs has not been reported yet.In this work, for the first time, we fabricated a novel oxygenated copper vanadium selenide composite (Cu0.59V2O5/Cu0.828V2O5@Cu1.8Se1/Cu3Se2, i.e., O–CuVSe) nanostructure via a simple hydrothermal method associated with calcination at 500 °C. The as-prepared O–CuVSe composite sample acts as a cathode material for AZiBs. The copper ions serve as a pillar to stabilize the layered O–VSe structure during the repeated charge and discharge cycles. In addition, oxygen vacancies in CuVSe improved the fast diffusion of ions/electrons, thus leading to the enhancement of its electrochemical performance. The O–CuVSe composite operated in the wide potential range of 0.4–2.0 V versus Zn2+/Zn. The broadened potential window was also more beneficial to achieving the good rate capability and cycling stability of the Zn/(O–CuVSe) battery. The electrochemical properties of the fabricated Zn/O–CuVSe composite battery were also explored in terms of reversibility and rate capability.
2. Experimental section
In a typical synthesis, 0.35 mM of copper nitrate trihydrate was dissolved in 50 mL of de-ionized (DI) water via ultrasonication for 10 min, followed by the addition of 0.35 mM of ammonia meta vanadate under continuous stirring for 30 min. In another beaker, 0.7 mM of selenous acid and 3 g of 2-methylimidazole were dissolved in 50 mL of distilled (DI) water via ultrasonication for 10 min under continuous stirring for 30 min. Both solutions were mixed, sonicated for another 10 min, and followed by stirring for another 30 min. The solution was transferred to the 140 mL capacity of the Teflon lined autoclave and maintained at 160 °C for 6 h. After naturally cooling down to room temperature, the precipitation was collected by centrifugation and dried at 80 °C for 12 h in a vacuum oven. Finally, the obtained powder was calcined in a tube furnace at 500 °C in Ar atmosphere.3. Results and discussion
Fig. 1 shows the schematic illustration for the preparation of the O–CuVSe composite material by a facile hydrothermal synthesis. In the step-I process, stoichiometric amounts of all the precursor chemicals were dissolved in DI water, stirred, and transferred to the autoclave. After the completion of the hydrothermal process, the obtained precipitation powder was calcined in a tube furnace in Ar atmosphere, creating the O–CuVSe composite powder. In step II, the obtained O–CuVSe composite powder was pasted onto a carbon fiber cloth (CFC) substrate using a brush with an additive. The O–CuVSe-coated CFC substrate was employed as a cathode for AZiBs. After several cycles, the morphology became fine nanosheets, and these nanosheets were well laminated and bonded with the CFC substrate. To further evaluate the phase purity of the sample, the powder material was verified by X-ray diffraction (XRD) along with the Rietveld refinement, as seen in Fig. 2(a). The Rietveld refinement results were well-fitted with the XRD patterns, suggesting that the sample is composed of the many phases of copper vanadium oxide and copper selenide. According to the Rietveld refinement results, the sample consists of the major phases of copper vanadium oxide with the monoclinic phase (Cu0.59V2O5) (ICDD card no. 98-007-7609) and copper selenide (Cu1.8Se1) (ICDD card no. 98-018-1660). In addition, the minor phase of copper vanadium oxide with the monoclinic phase (Cu0.828V2O5) (ICDD card no. 98-007-0017) and copper selenide (Cu3Se2) (ICDD card no. 98-001-6949) exists. The crystal structure of the O–CuVSe sample is very complex, which is composed of monoclinic Cu0.59O5V2, monoclinic Cu0.828V2O5, tetragonal Cu3Se2, and cubic Cu1.8Se1, as shown in Fig. 2(b). Fig. 2(c) and (d) shows the field-emission scanning electron microscope (FE-SEM) images of the O–CuVSe composite material. It is observed that non-uniform-shaped nanostructures are aggregated together. To further investigate the detailed microstructure of the material, transmission electron microscope (TEM) analysis was performed, as shown in Fig. 3(a–c). From the TEM images, the O–CuVSe composite material exhibited a non-uniform-shaped hollow cube-like structure. The non-uniform-shaped hollow cubes are aggregated together. From the high-resolution (HR)-TEM image (Fig. 3(d) (i and ii)), the calculated d-spacings of the lattice fringes are 3.13 and 3.2 nm, corresponding to the lattice planes of (401) and (111), respectively, which agreed well with the measured XRD results. The selected area electron diffraction (SAED) pattern indicates the polycrystalline nature of the material (Fig. 3(e)). The elemental mapping images (Fig. 3f(i–iv)) confirmed the uniform distribution of copper (Cu), vanadium (V), and selenium (Se) elements on the surface of the O–CuVSe sample. The energy-dispersive X-ray spectroscopy (EDS) spectrum further confirmed the presence of Cu, V, and Se elements (Fig. 3(g)).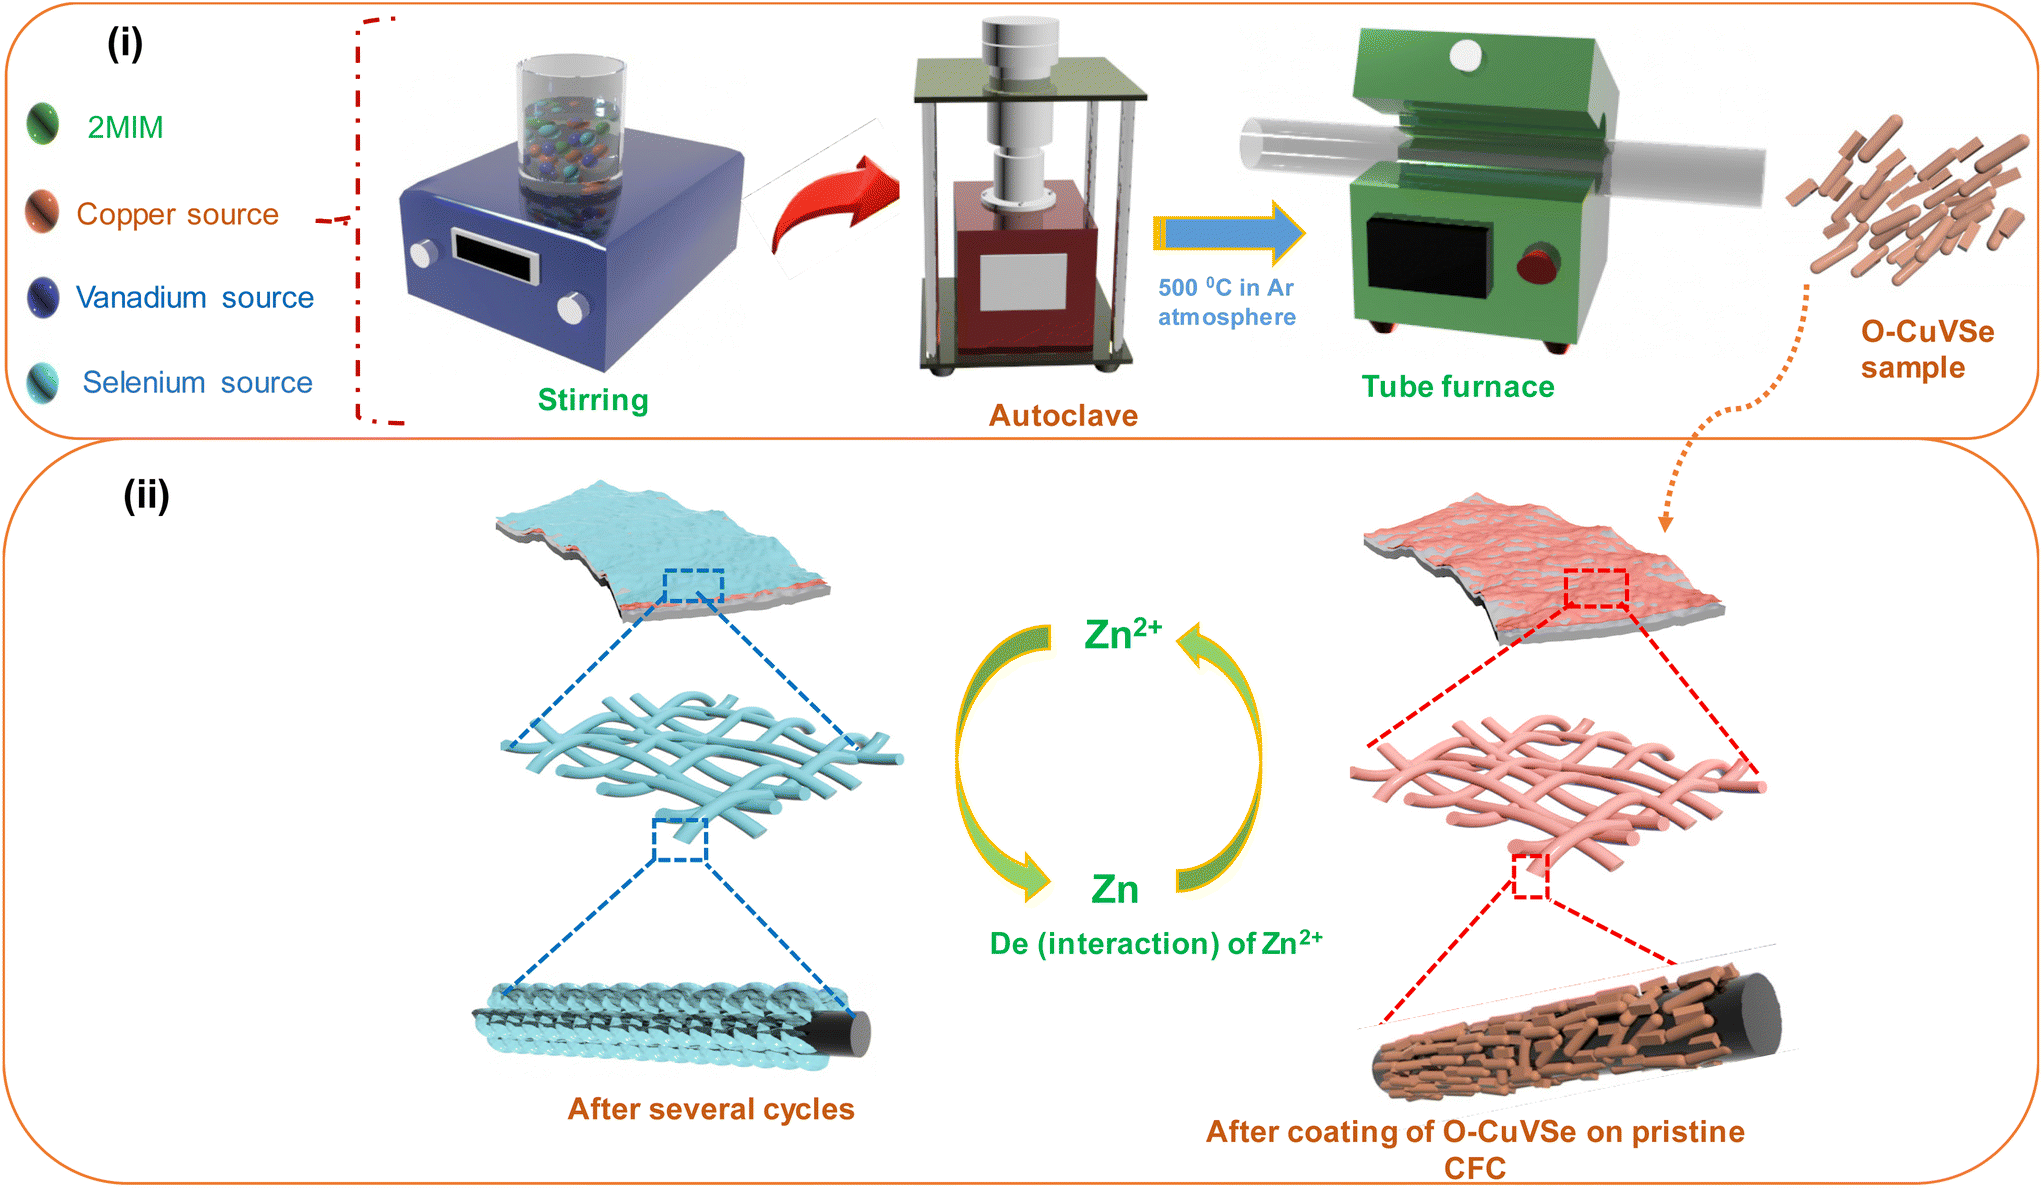 | ||
| Fig. 1 Schematic illustration for (i) the synthesis of the O–CuVSe composite material and (ii) the O–CuVSe-coated CFC substrate. | ||
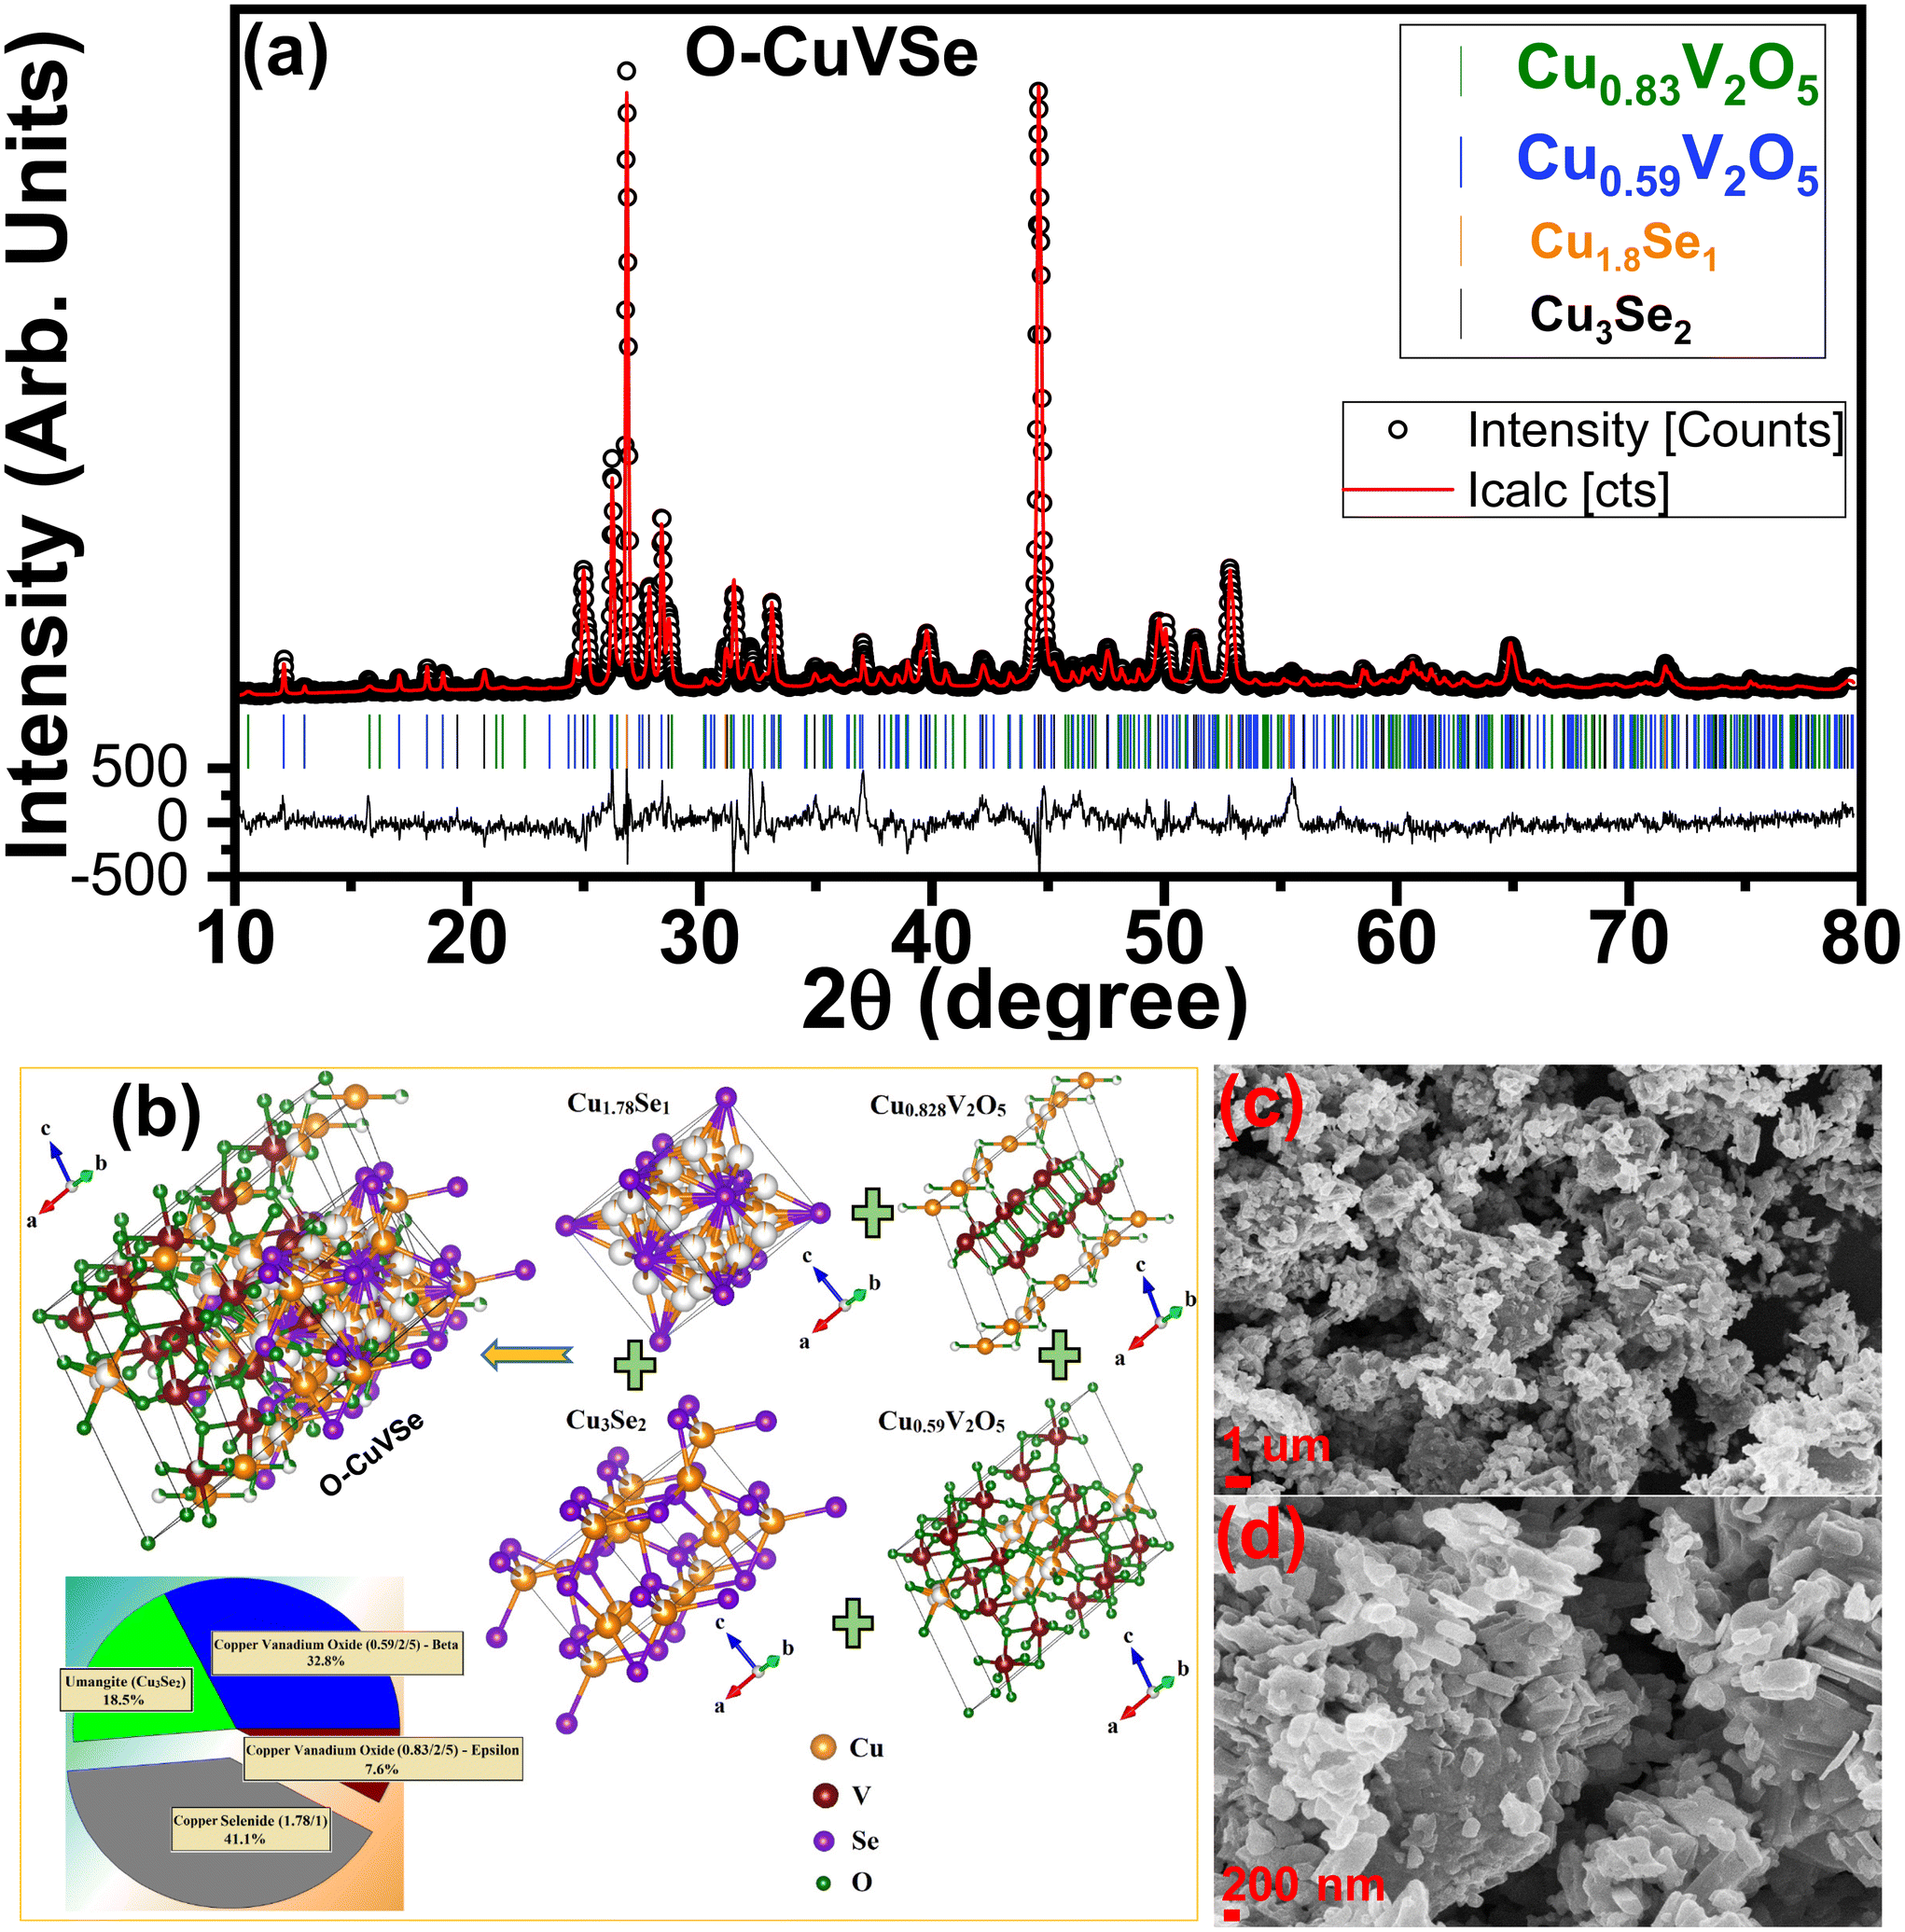 | ||
| Fig. 2 (a) Rietveld refinement of the XRD pattern, (b) structure diagram, and (c) low- and (d) high-magnification FE-SEM images of the O–CuVSe composite material. | ||
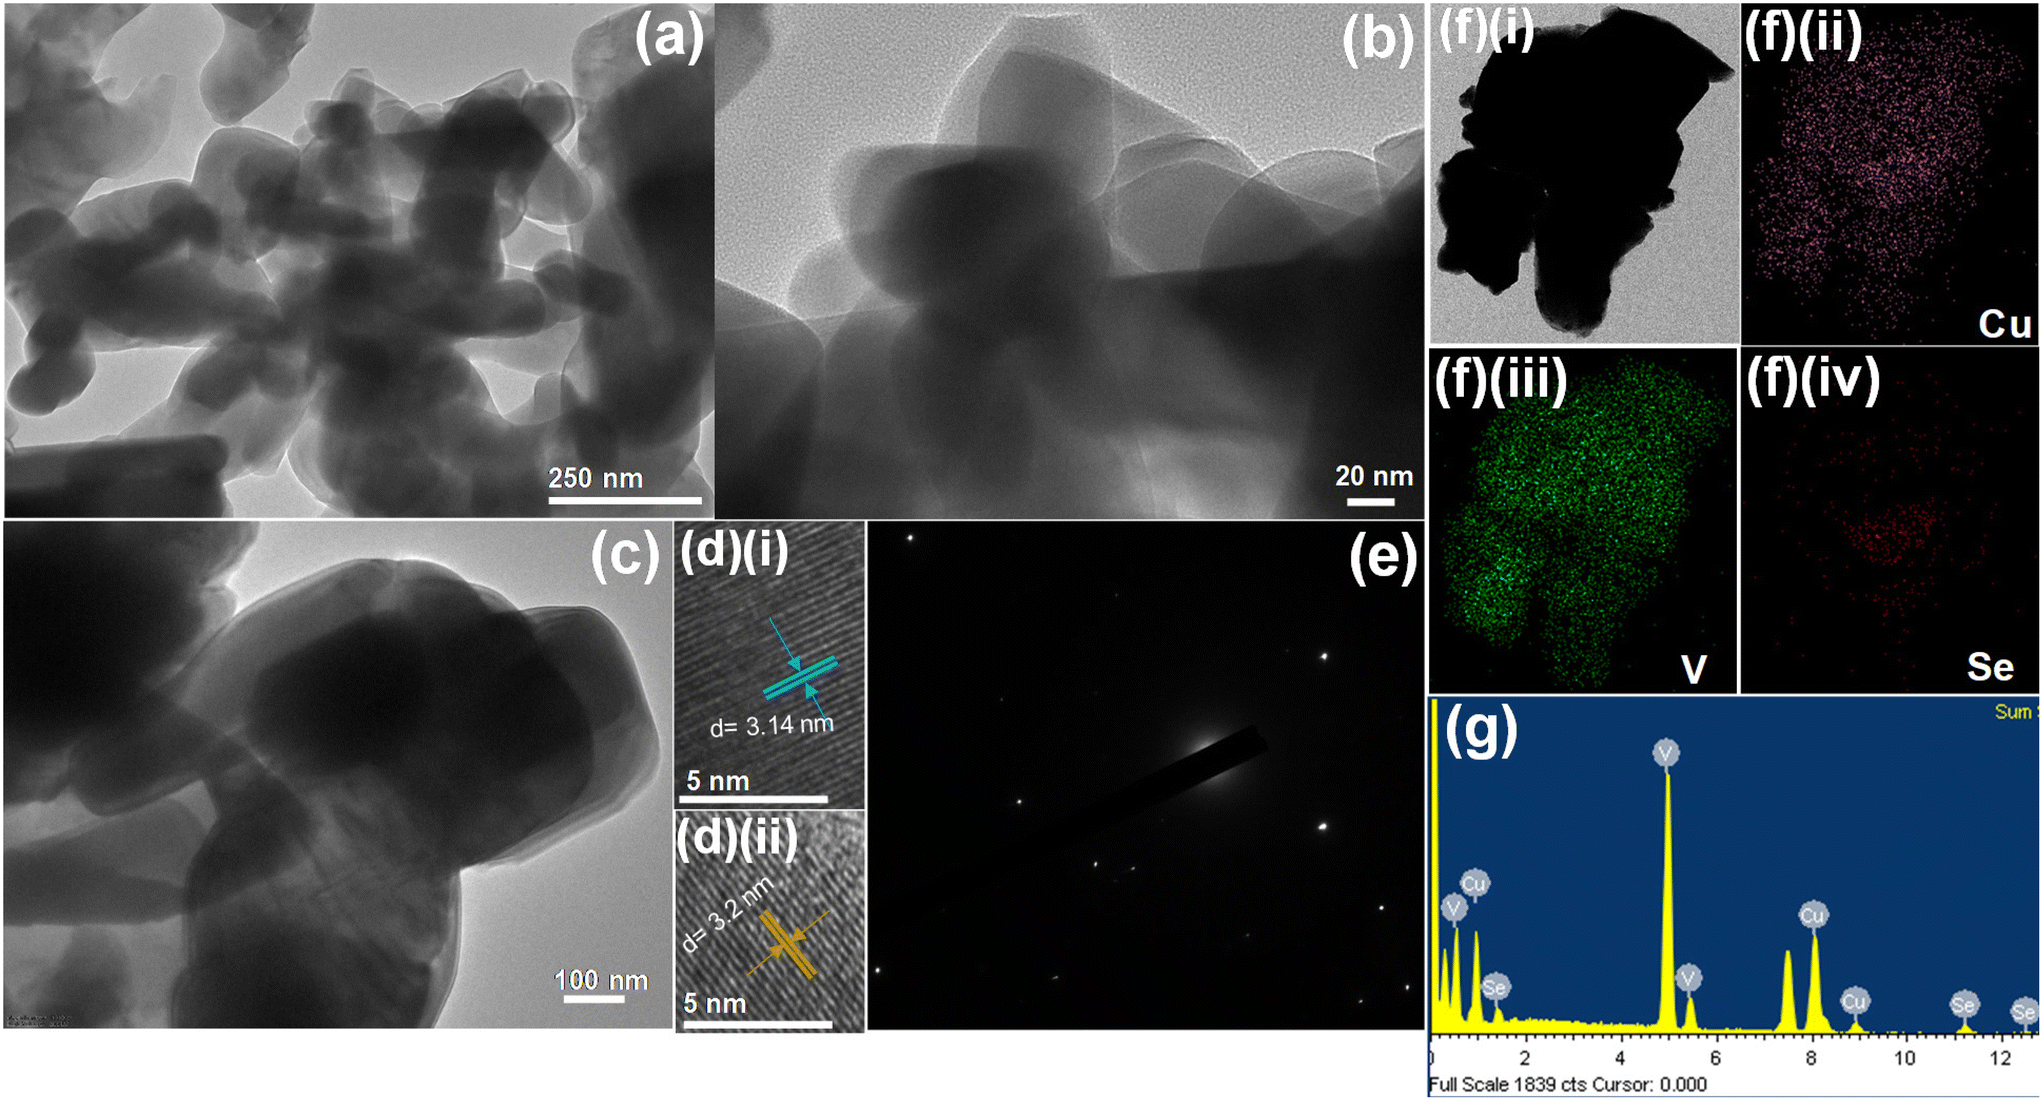 | ||
| Fig. 3 (a–c) TEM images, (d) (i and ii) HR-TEM images, (e) SAED pattern, (f) (i–iv) elemental mapping images, and (g) EDS spectrum of the O–CuVSe composite material. | ||
The schematic diagram of the fabricated Zn/O–CuVSe battery is shown in Fig. 4(a). The electrochemical performances of the Zn/O–CuVSe battery were measured in CR2032 coin-type cell using the O–CuVSe composite as the cathode and metallic Zn as the anode. Zn(CF3SO3)2 (2 M) was employed as an electrolyte, and the GF/D glass fiber membrane was used as a separator. The cell was fabricated in an air environment. For comparison, 2 M ZnSO4 was also utilized as an electrolyte. The Zn-ion storage performance of the Zn/O–CuVSe battery was evaluated between 0.4 and 2.0 V versus Zn2+/Zn. To evaluate the Zn-ion insertion/extraction into/from the cathode host, cyclic voltammetry (CV) measurements were carried out at a scan rate of 0.1 mV s−1, as shown in Fig. 4(b). From Fig. 4(b), a pair of redox peaks were observed during the cycling process, indicating the multiple redox reaction processes occurring concerning Zn2+ (de)-intercalation. In the initial anodic scan, the oxidation peak was observed at 1.83 V and disappeared in subsequent cycles, which indicates that the structural reconstruction occurs after initial charging. As shown in Fig. 4(b), cathodic peaks were observed at 0.6 and 1.22 V and anodic peaks appeared at 0.73, 1.16, and 1.35 V. The observed anodic and cathodic peaks at 1.35 and 1.22 V, respectively are related to the conversion reaction between Se0 to Se.2–54 In previous reports on the ZnSe cathode, the same kind of redox peaks are also observed.54 Other redox peaks are related to the redox reaction between V4+ and V5+. The redox reaction of the Z/O–CuVSe composite battery is explained in detail in the discussion of the ex situ X-ray photoelectron spectroscopy (XPS) measurements.
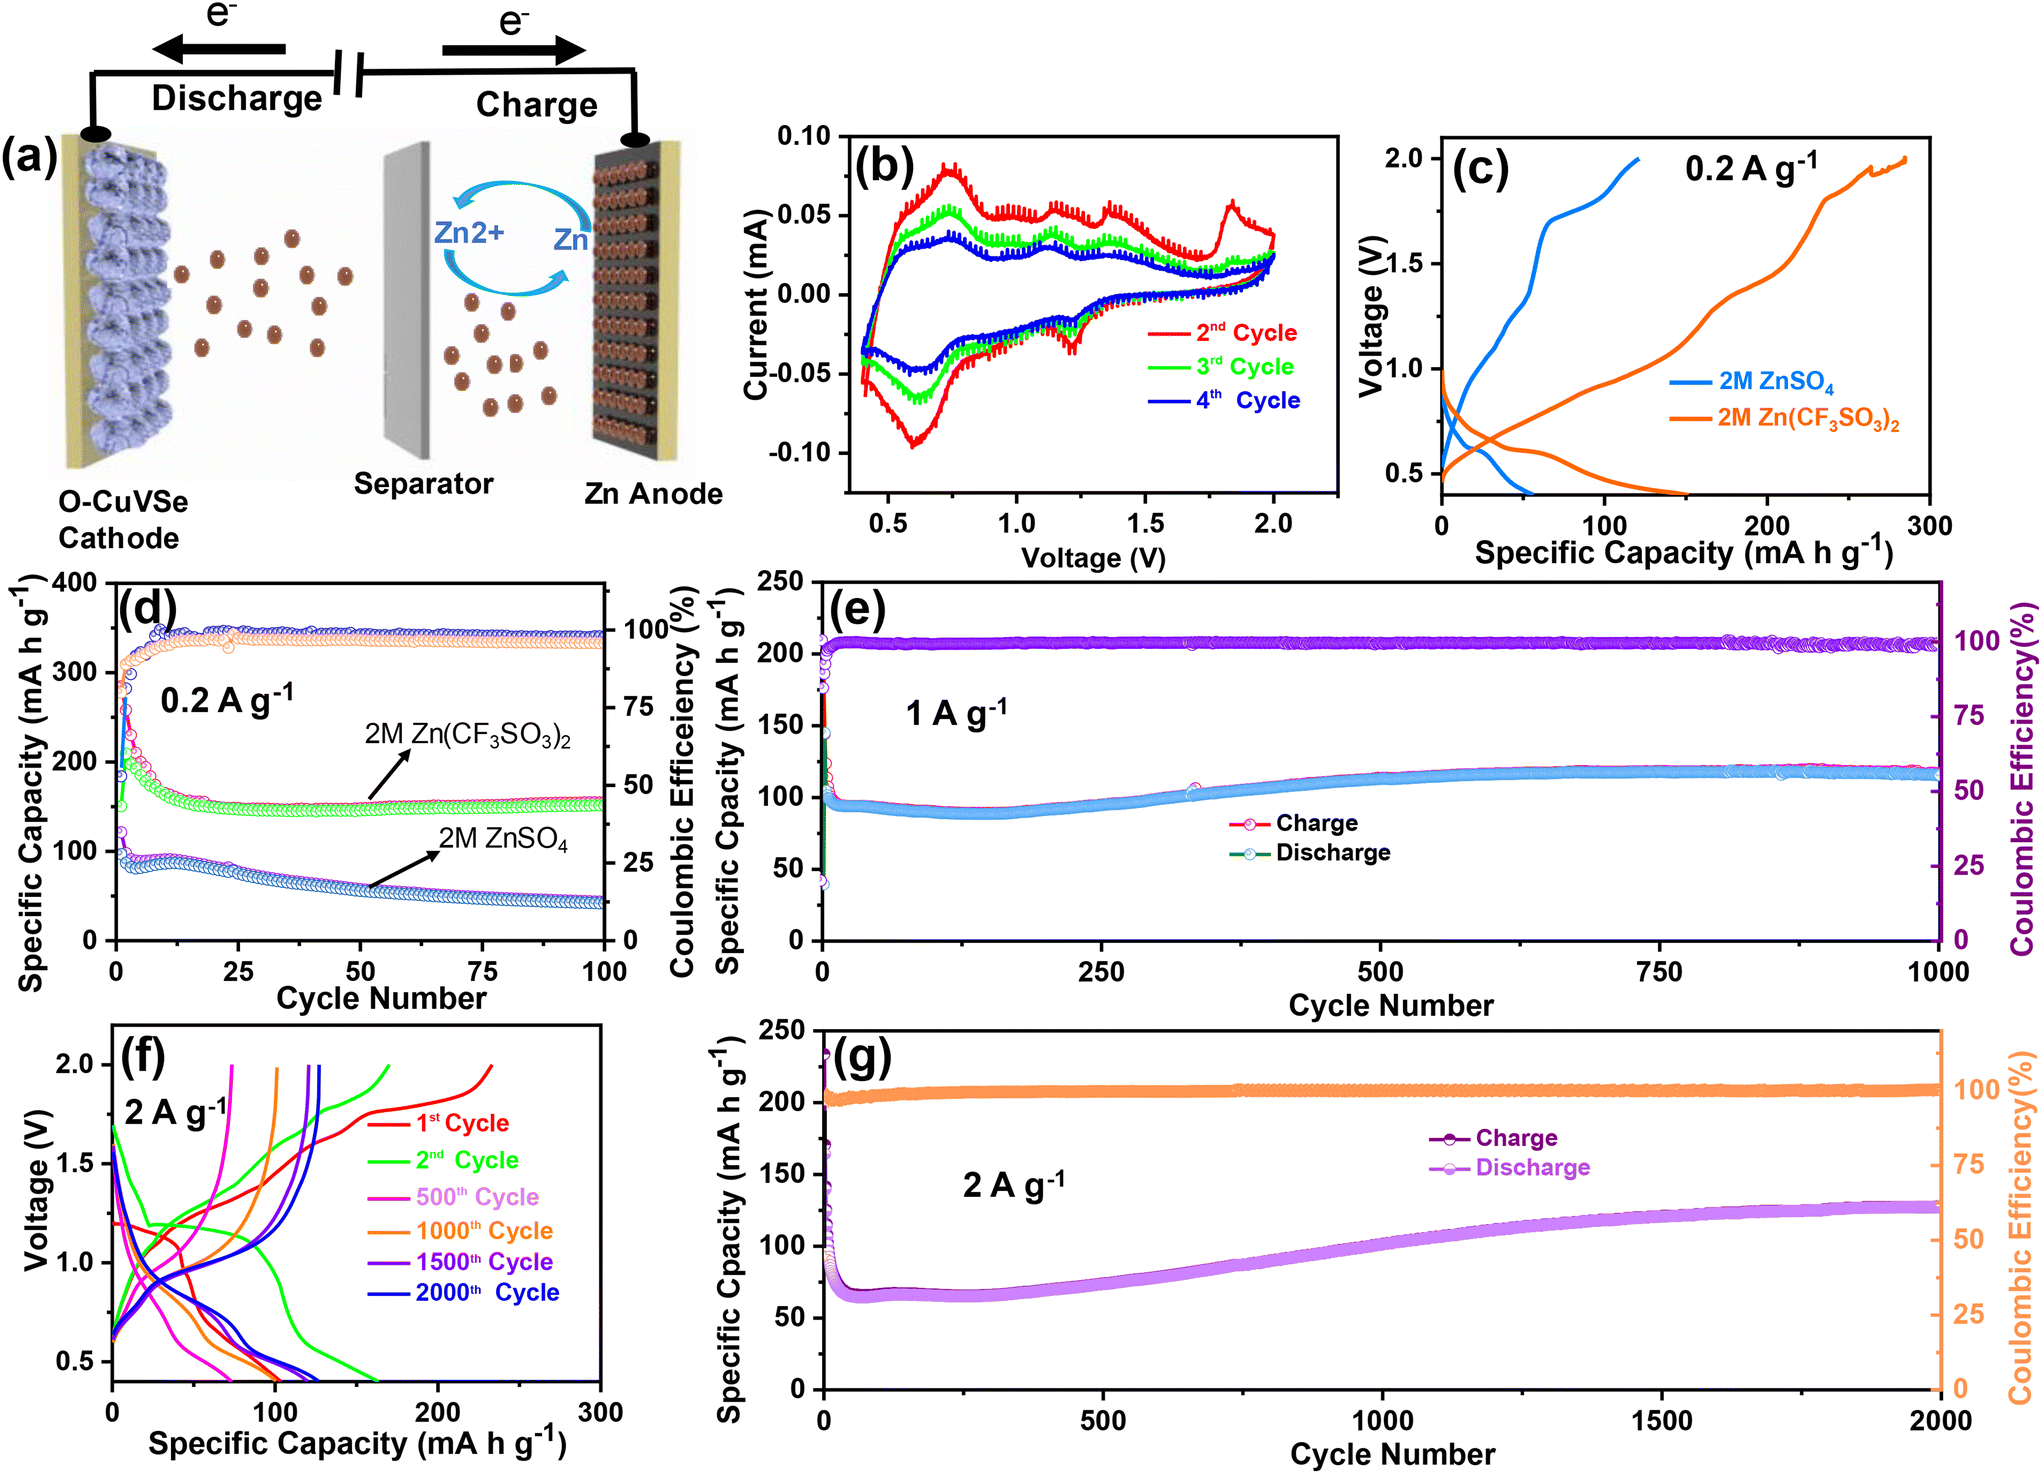 | ||
| Fig. 4 (a) Schematic strategy for the working principle of AZiBs using the O–CuVSe composite as a cathode. (b) CV curves of the O–CuVSe composite cathode at 0.1 mV s−1. (c) Voltage profile curves and (d) cycling performance at 0.2 A g−1 using different electrolytes for the O–CuVSe composite cathode. (e) Cycling performance at 1 A g−1 of the O–CuVSe composite cathode. (f) Voltage profile curves and (g) cycling performance at 2 A g−1 of the O–CuVSe composite cathode. | ||
The cycling tests for the O–CuVSe composite cathode were conducted between 0.4 and 2.0 V at 0.2 A g−1 using both 2 M ZnSO4 and 2 M Zn (CF3SO3)2 electrolytes. The voltage profile curves and cycling performance of the O–CuVSe cathode using these electrolytes are shown in Fig. 4(c) and (d). The voltage profile curves using only 2 M Zn (CF3SO3)2 electrolyte at 0.2 A g−1 are shown in Fig. S1(a) of the ESI.† The charge and discharge capacities of 285 mA h g−1 and 151 mA h g−1, respectively were obtained during the initial cycle with the Coulombic efficiency (CE) of 53% (for 2 M Zn(CF3SO3)2 electrolyte). For the 2nd cycle, the charge and discharge capacities were found to be 209.6 mA h g−1 and 258.3 mA h g−1, respectively, which resulted in an enhancement of CE up to 81%. A discharge capacity of 154 mA h g−1 remained after 100 cycles with 80% of capacity retention. The CE of the cathode was obtained at around 98% after 100 cycles. In comparison, the discharge capacity of the O–CuVSe cathode using 2 M ZnSO4 electrolyte was limited to 43.5 mA h g−1 with a CE of 95.8%. The above results suggest that the 2 M Zn(CF3SO3)2 electrolyte is mechanically more stable than the 2 M ZnSO4 electrolyte during the cycling of O–CuVSe composite cathode. To confirm the stability of the electrode over long cycles, the cycling tests were also conducted at 1 A g−1. The voltage profile curves measured at 1 A g−1 are shown in Fig. S1(b),† and the corresponding cycling performance is shown in Fig. 4(e) (only for 2 M Zn (CF3SO3)2 electrolyte). It is worth mentioning that the capacity of the electrode was decreased up to 300 cycles, and then gradually improved up to 1000 cycles. After 1000 cycles, the electrode delivered a discharge capacity of 115 mA h g−1 with a CE of 99%. The capacity retention of the electrode was found to be 81%. Furthermore, the long-term cycling tests were conducted at 2 A g−1 over 2000 cycles. The voltage profile curves are shown in Fig. 4(f), and the corresponding cycling performance is shown in Fig. 4(g). A capacity decay trend was observed in the initial cycles, but the capacity was slowly increased and then became stable. After 2000 cycles, a discharge capacity of 127 mA h g−1 (101 mA h g−1 for 1000 cycles) was observed. After 2000 cycles, a CE of 99% with 77.4% capacity retention was attained.
To further determine the durability and stability over long cycles, the cycling performance was evaluated at 5 A g−1 over 10000 cycles. The cycling performance at 5 A g−1 over 10000 cycles is shown in Fig. 5(a), and the corresponding voltage profile is shown in Fig. S2 of the ESI.† Even at a high current density of 5 A g−1, a reversible capacity of 70.4 mA h g−1 was obtained over an ultra-long life of 10000 cycles. The CV tests were again conducted to verify the redox reaction in the O–CuVSe composite after the completion of the cycling test (at 5 A g−1 over 10000 cycles) at a scan rate of 0.5 mV s−1 (Fig. 5(b)). The CV curves exhibited a pair of redox peaks at 0.96 V/0.7 V and 0.79 V/0.55 V, which implies the multistep (de)-intercalation of Zn2+ into/from the cathode host. The observed pair of peaks indicate a redox reaction of V5+/V4+, which is consistent with the XPS results. The measured CV results in Fig. 4(c) reveal that the peaks correspond to the redox reaction of V5+/V4+ and Se0/Se2−. From the previous literature on the Se-based cathode, it is clear that the oxidation peak was observed at 0.86 V. The reduction peaks were obtained at 1.35 and 1.99 V, which indicates the conversion reaction between Se2− and Se0.54 Meanwhile, after the cycling (10000 cycles), the peaks for the redox reaction of V5+/V4+ were observed, and the selenium-related redox peaks completely disappeared. The reason for the disappearance of the selenium-related redox peaks is still unclear. From the measured CV results, the oxidation/reduction in the Zn/O–CuVSe composite battery is due to the transition of electrons between V5+ and V4+. The redox reaction between Se2− and Se0 was observed in a few cycles, and it completely disappeared after some extended cycles. The rate performance was evaluated at different current densities of 0.2, 0.4, 0.6, 0.8, 1.0, 1.2, 1.4, 1.6, 1.8, 2.0, and 2.5 A g−1 in forward and reverse directions (Fig. 5(c)). The discharge capacities of 165, 131.4, 107, 99, 82, 79, 76, 75, 68, and 65 mA h g−1 were obtained at 0.2, 0.4, 0.6, 0.8, 1.0, 1.2, 1.4, 1.6, 1.8, and 2.0 A g−1, respectively. Surprisingly, even at a high current density of 2.5 A g−1, the cathode delivered a superior discharge capacity of 59 mA h g−1. While increasing the current density, the capacity decrease is much less, indicating the excellent stability of the electrode materials. When it returned to an initial current density of 0.2 A g−1, the discharge capacity of 150 mA h g−1 was restored with a recovery ratio of 90.9% and a corresponding CE of about 99.9%. The voltage profile curves (Fig. 5(d)) revealed the same shape and small polarization at all the current densities, especially at higher current densities, which indicates the fast charge transfer kinetics of the electrode. The specific capacity versus cycle at different current densities for the O–CuVSe composite cathode is shown in Fig. 5(e).
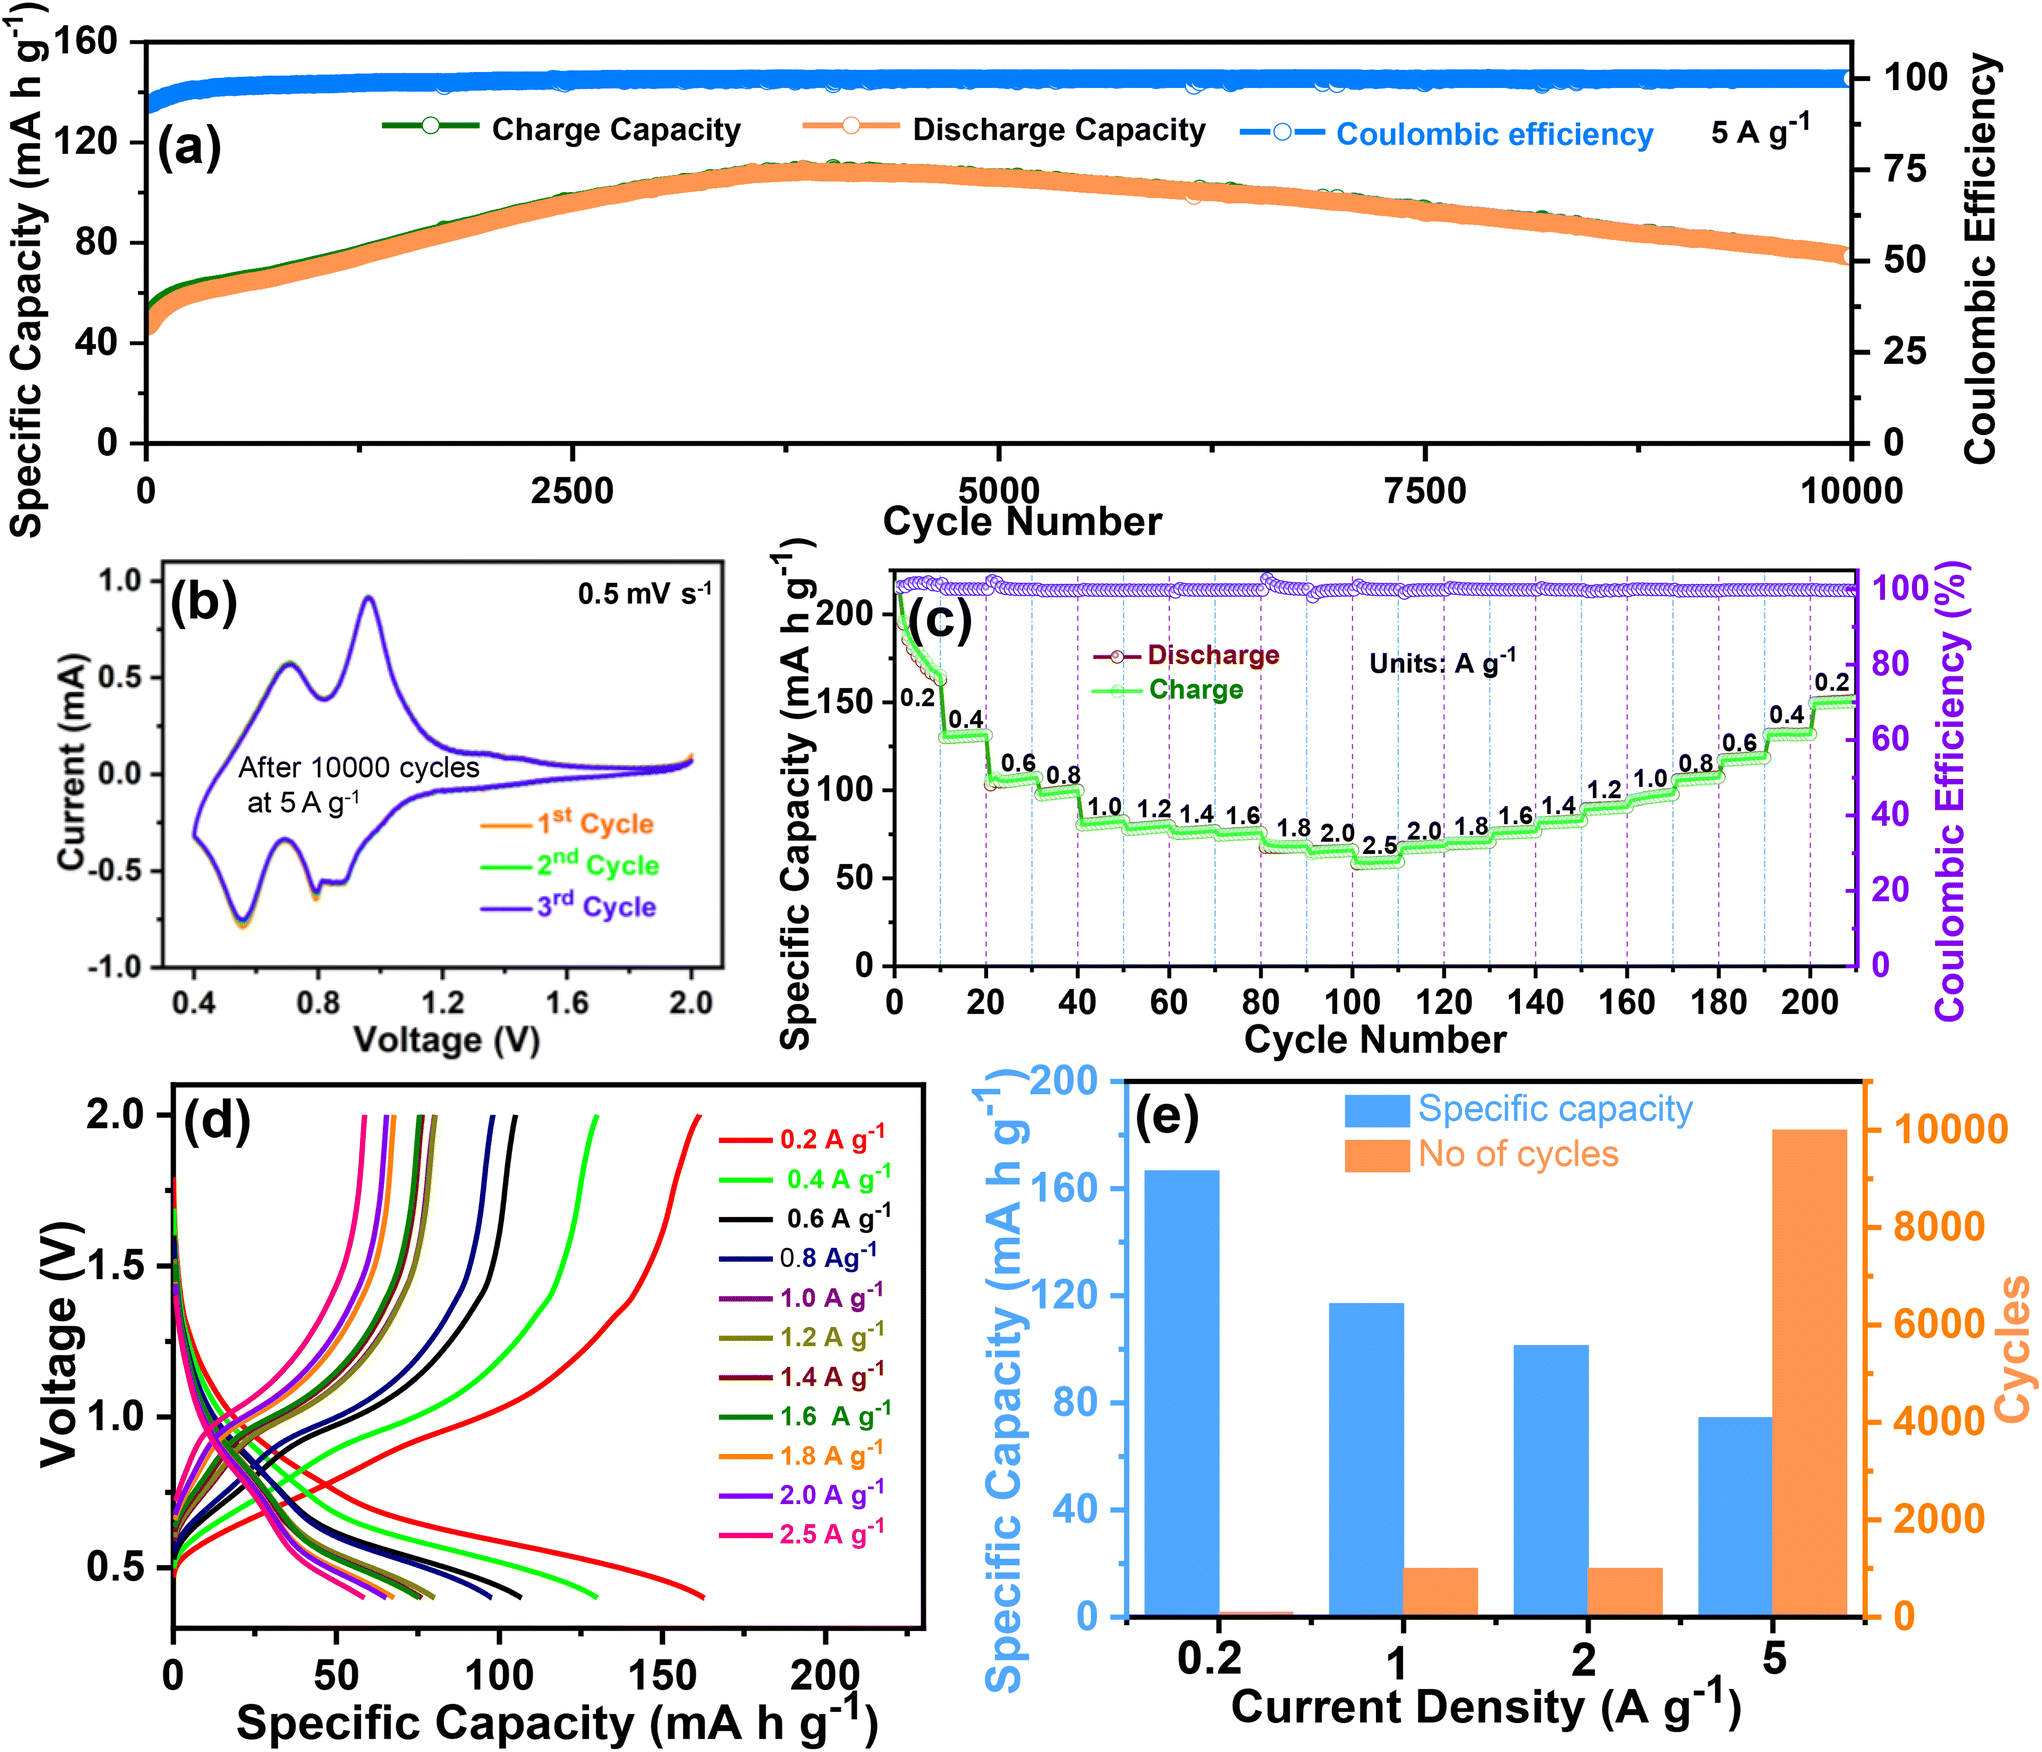 | ||
| Fig. 5 Cycling performance at 5 A g−1, (b) CV curves after the cycling test (at a scan rate of 0.5 mV s−1), (c) rate performance, (d) voltage profile curves at different scan rates, and (e) specific capacity vs. current density of the O–CuVSe composite cathode. | ||
To evaluate the durability and cycling stability, the cycling performance was measured at 1.5 A g−1 after the rate performance (Fig. 6(a)). The electrode exhibited a reversible capacity of 82 mA h g−1 after 1000 cycles and the CE almost approached 100%. The capacity of the electrode was found to be stable and its capacity retention reached 100%. This may be due to the slow penetration of the electrolyte and activation of the electrode material during the rate performance test. Interestingly, no capacity fading took place during the cycling even at different current densities, indicating excellent structural stability and superior electrochemical kinetics. The O–CuVSe composite cathode material provides the fast diffusion of the charge carriers owing to the pillaring effect of Cu ions and oxygen vacancy engineering. Further galvanostatic intermittent titration technique (GITT) was utilized to determine the diffusion coefficient of Zn2+ (DZn) in the O–CuVSe cathode material. The GITT curves were measured during the 10th charge/discharge cycle at a current density of 1 A g−1 with an interval time of 8 min, and then relaxed for 8 min to achieve voltage equilibrium, as shown in Fig. S3(a) of the ESI.† The Zn2+ diffusion coefficient can be calculated using the following equation:29,55,56
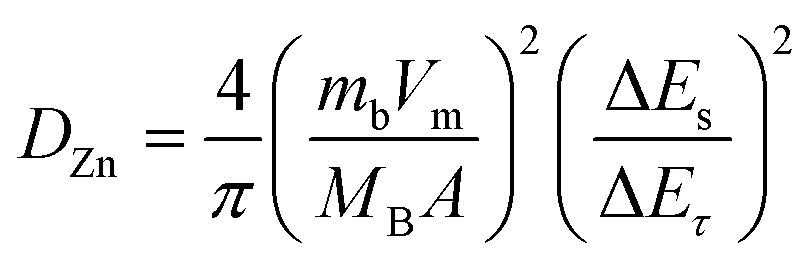 000 cycles with excellent specific capacity and capacity retention. The obtained electrochemical performance of the O–CuVSe cathode was compared with the V-based cathodes and other kinds of cathodes, including Mn-based materials and Prussian blue analogues, as shown in Table S1 of the ESI.† From Table S1,† Prussian blue analogues such as CuHCF, ZnHCF, and ZnHCF@MnO2 support the performance up to 2.0 V, but the specific capacity is not favorable and limited below 100 cycles. The Mn-based electrode materials were also supported up to 2.0 V, delivering good specific capacity, but the cycle life is limited to only a few cycles. However, the O–CuVSe composite cathode material exhibited an ultra-long life (10000 cycles) with excellent stability. Inspired by the above-obtained excellent electrochemical results, the fabricated Zn/O–CuVSe composite battery was used for various practical applications. Fig. 6(c) shows a photographic image of the CR2032 coin-type Zn/O–CuVSe composite battery without connection to the multimeter. The Zn/O–CuVSe composite battery displayed the open circuit voltage (OCV) of 1.044 V (Fig. 6(d)). As shown in the photographic images of Fig. 6(e) and (f), after charging to 2.0 V, the Zn/O–CuVSe composite battery successfully powered a toy motor fan. The Zn/O–CuVSe composite battery also powered a digital watch. Fig. 6(g) shows the photographic image of the Zn/O–CuVSe composite battery without connection, and Fig. 6(h–j) shows the photographic images of the battery successfully operating for 12 h without any deviation on the screen, which reveals the excellent energy storage performance of the battery for various practical applications.
 | ||
| Fig. 6 (a) Cycling performance of the O–CuVSe composite cathode at 1.5 A g−1. (b) Comparison of the electrochemical performances of the previously reported literature with the O–CuVSe composite cathode. (c and d) Photographic images of representing the OCV in the Zn/O–CuVSe composite battery. (e and f) Photographic images of the Zn/O–CuVSe composite battery powering a toy motor fan. (g–j) Photographic images of the Zn/O–CuVSe composite battery powering a digital watch. | ||
To verify the phase transformation of the O–CuVSe composite cathode, ex situ XRD measurements were performed at the 1st charge/discharge and 15th charge/discharge cycles, as shown in Fig. S4 of the ESI.† During the initial charge, a set of diffraction peaks were observed at 12.21°, 16.74°, 20.8°, 33.75°, and 36°, which represents the existence of the ZnyV2O5−x·nH2O phase (JCPDS no. 057-0572).13,70 The presence of the ZnyV2O5−x·nH2O phase is due to the displacement of some Cu2+ in the O–CuVSe composite during the co-insertion of Zn2+ and H2O, causing the transformation into ZnyV2O5−x·nH2O. The intensities of the peaks were reduced in the initial charge process, indicating the de-insertion of Zn2+ and some of the Zn2+ trapped inside the O–CuVSe structure. The characteristic peaks of copper vanadium selenide and copper selenide are also presented during the charge/discharge process, which suggests that a certain amount of Cu2+ is present in the electrode to improve the structural integrity during the charge/discharge process. During the 10th charge/discharge process, the characteristic peak intensity of the O–CuVSe composite gradually disappeared, indicating the transformation into O–VSe·nH2O. In addition, the diffraction peaks observed at 2θ of 25.7° and 43.3° are associated with graphitic carbon, which originates from the CFC substrate (JCPDS card no. 01-0640).5,71
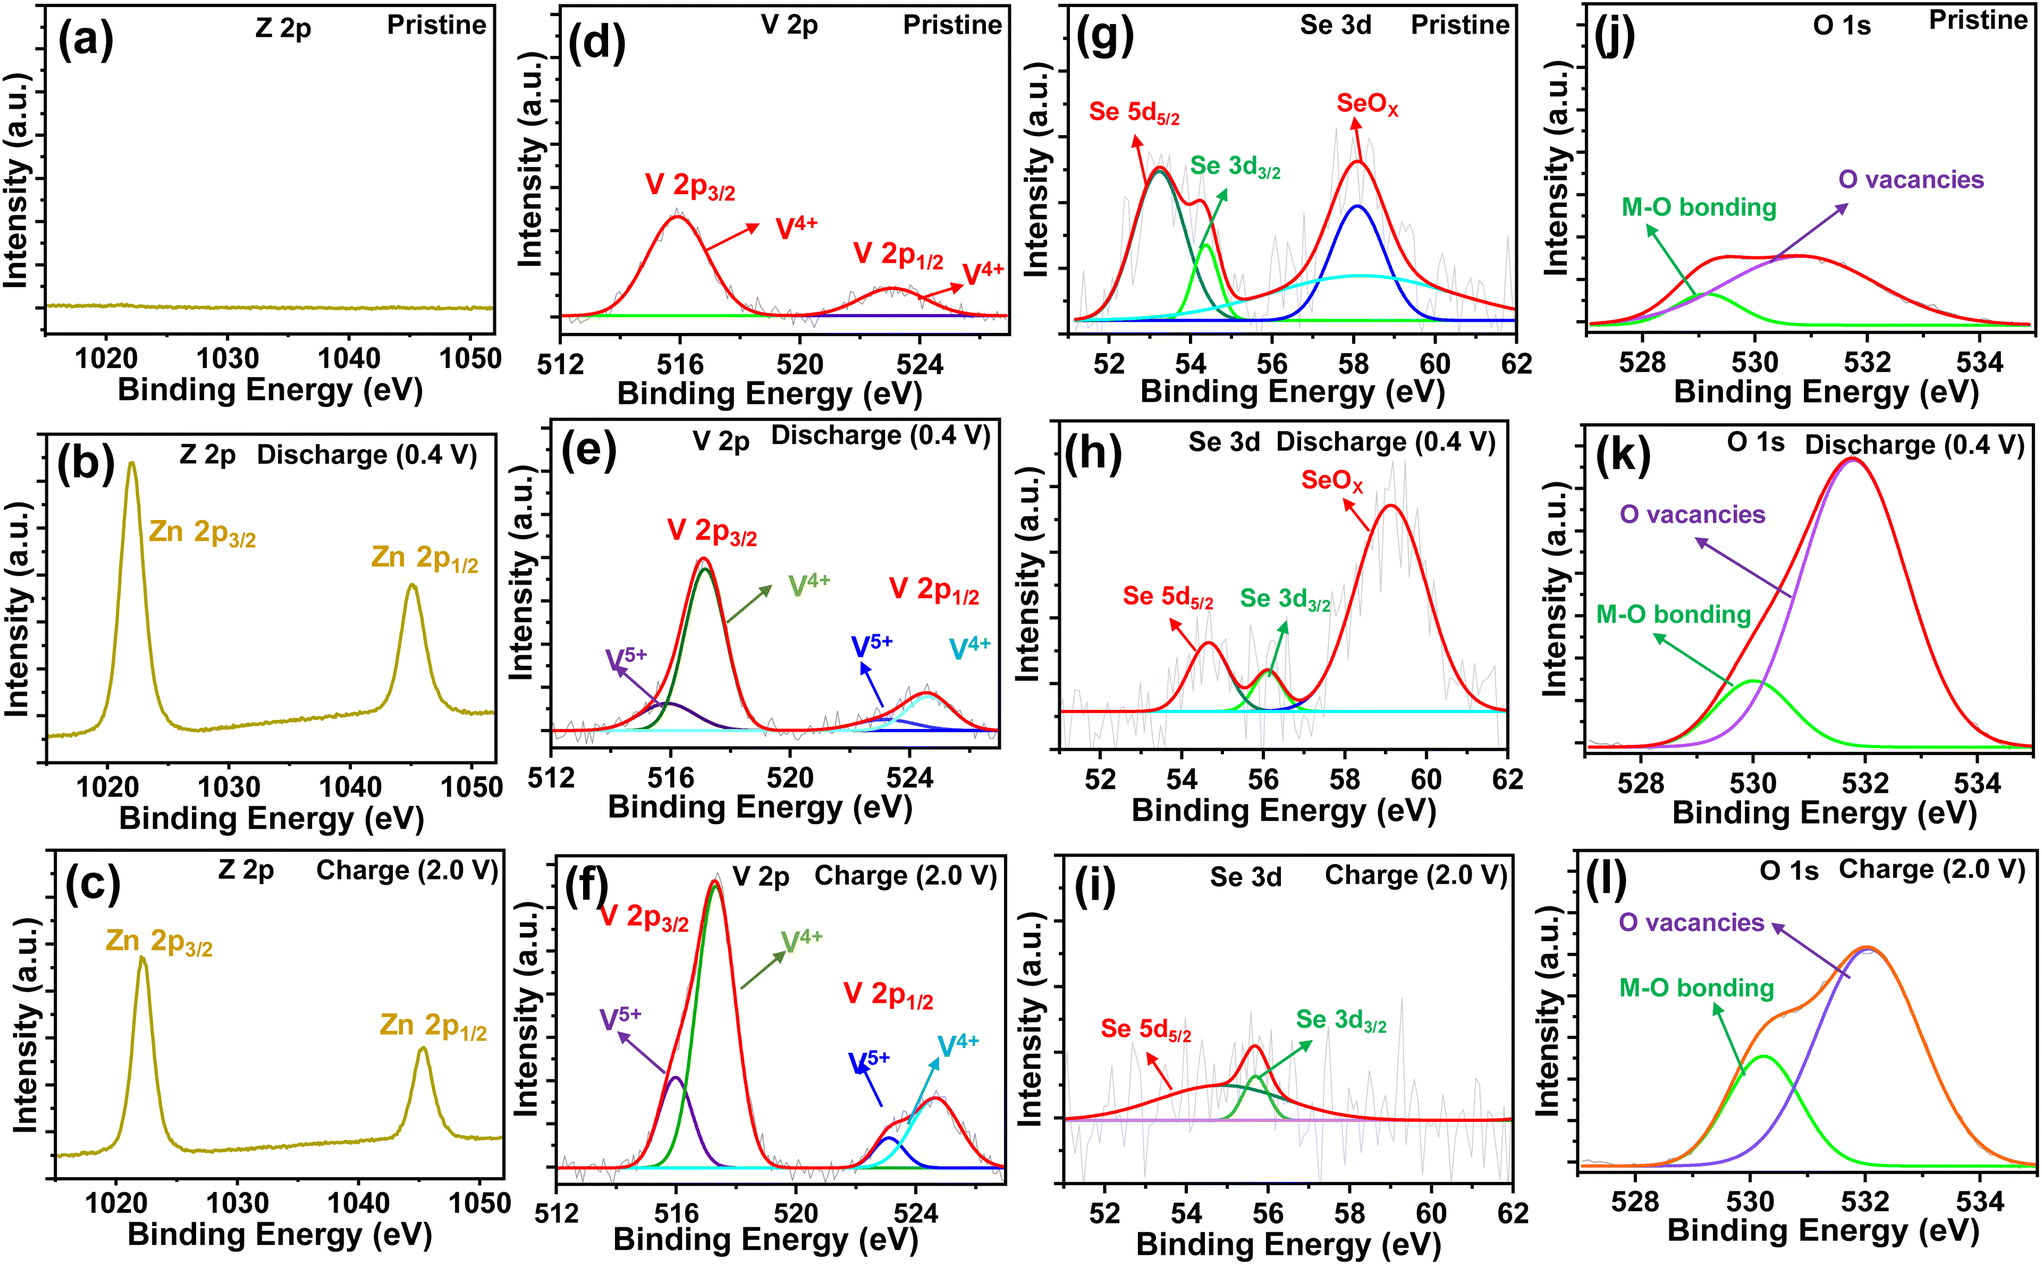
To understand the redox reaction mechanism in the O–CuVSe composite cathode, XPS measurements were carried out in the pristine, 15th charge (2.0 V), and 15th discharge (0.4 V) states. The XPS survey scan spectra of the electrodes in the pristine, charge, and discharge states are shown in Fig. S5 of the ESI.† All of the electrodes confirmed the presence of Cu, V, Se, and O elements. The intensity of the Se peaks is very weak, and the Cu peaks completely disappeared in the charge and discharge states. The C element was observed in all of the states, which arises from the CFC substrate. In addition, the S and F elements were observed in the charge and discharge states, which may be due to the formation of by-products during the cycling process. In a pristine state, no Zn 2p signals were observed (Fig. 7(a)). When discharged to 0.4 V (Fig. 7(b)), a pair of distinct high intense peaks of Z 2p were observed at 1022.3 eV (Zn 2p3/2) and 1045.4 eV (Zn 2p1/2), which indicates the insertion of Zn2+ into the cathode host. Meanwhile, the intensity of the Z 2p peaks was reduced during the charging process, indicating the extraction of Zn2+ from the cathode host, and a small amount of Zn2+ was also captured in the cathode host (Fig. 7(c)). The Cu 2p spectrum of the pristine sample exhibited two peaks at 931.5 eV (Cu 2p3/2) and 951.04 eV (Cu 2p1/2) which are assigned to the Cu2+ in CuO (Fig. S6(a) of the ESI†).72,73 Another two peaks at 933.62 eV (Cu 2p3/2) and 953.54 eV (Cu 2p1/2) are related to the Cu+ in Cu2O.73 The Cu signal completely disappeared in the charge and discharge states (Fig. S6(b) and (c)†). The high-resolution V 2p XPS spectrum of the pristine state is shown in Fig. 7(d). In the pristine state, the V 2p spectrum exhibited the peaks at 515.8 and 523 eV, corresponding to the V 2p3/2 and V 2p1/2 of V4+, respectively. In the charge and discharge states (Fig. 7(e) and (f)), the peaks appearing at 517.2 eV (V 2p3/2) and 524.6 eV (V 2p1/2) correspond to V5+, and the peaks at 515.98 eV (V 2p3/2) and 523.6 eV are associated with the presence of V4+.49,74 The valence states of the charge and discharge states are different from those of the pristine state, indicating that the phase transition occurred after the first charge. In the charge and discharge states, the V 2p spectrum exhibited the same valence states as the V4+/V5+, which indicates the excellent reversibility of the cathode material. The Se 3d spectrum of the electrode in the pristine state exhibited the characteristic peaks at 53.23 eV (3d5/2) and 54.35 eV (3d3/2), which indicates the existence of Se2− (Fig. 7(g)).75,76 In the discharge state (Fig. 7(h)), the characteristic peaks of Se 3d were shifted to 54.66 eV (3d3/2) and 56.1 eV (3d3/2), implying the presence of both Se2− and Se0, respectively.76 In the charge state (Fig. 7(i)), the valence states are quite different from their pristine state. This may be due to the insertion of Zn2+ into the cathode host. In the charge state, the characteristic peaks of Se 3d were observed at 54.66 eV (3 d5/2), and 55.7 eV (3 d3/2), revealing the existence of both Se2− and Se0, respectively. The valence states of the V 2p and Se 3d spectra in the charge and discharge states are the same and different from their pristine state. This means that the phase transition occurred after the first charge and it continued for the subsequent cycles. The new peak emerged at 58.04 eV for the pristine electrode and it was shifted to 59.0 eV during the discharge process. The observed additional peak exhibited the oxidized SeOx, whereas in the charge state, this peak completely disappeared. The disappearance of the SeOx characteristic peaks indicates that Se is not converted into oxide during the charging process. The O 1s spectra (Fig. 7(j–l)) in the pristine, charge, and discharge states represented the characteristic peaks between 529.2 and 530.2 eV, indicating the presence of metal–oxygen bonds [44]. In particular, the peaks observed between 530.89 and 532 eV revealed the successful formation of oxygen vacancies in the CuVSe (to form O–CuVSe) sample.46,77 The electrical conductivity of the CuVSe cathode can be altered due to the oxygen vacancies which act as open channels for the (de)-insertion of Zn2+.46
 | ||
| Fig. 7 Zp 2p XPS spectra: (a) pristine state, (b) discharge state, and (c) charge state. V 2p XPS spectra: (d) pristine state, (e) discharge state, and (f) charge state. Se 3d XPS spectra: (g) pristine state, (h) discharge state, and (i) charge state. O 1s XPS spectra: (j) pristine state, (k) discharge state, and (l) charge state. | ||
To evaluate the morphology of the O–CuVSe composite cathode material after the cycling process, the FE-SEM analysis was performed after the 1st charge/discharge, 15th charge/discharge, and 1000th charge cycles, as shown in Fig. 8(a–e). The morphology of the electrode after the cycling was completely different from that before the cycling, indicating that the structural reconstruction occurred after the 1st cycle. After the 1st charge/discharge, the morphology becomes interconnected spheres. During the 15th charge/discharge cycle, the nanosheets started to grow on the surface of CFC and minor particle-like structures also appeared. After the 1000 charge cycle, fine nanosheets were grown on the surface of the CFC. The nanosheets were well bonded with the CFC substrate, and a lot of pores were created between the sheets. Even after 1000 cycles, the nanosheets uniformly and densely grew over the surface of the CFC substrate. After 2000 cycles (at 2 A g−1) (Fig. S7 of the ESI†), there was no change in the morphology of the electrode material. The nanosheets were uniformly and tightly bonded with the substrate, which terminated the agglomeration of particles during the charge/discharge process and allowed for fast diffusion kinetics of ions during the cycling process. The morphology variation may be due to the phase transition of the electrode during the cycling process, leading to more internal stress on the nanostructures, which caused the damage and electrochemical re-construction of the electrode. However, after 10000 cycles (at 5 A g−1) (Fig. S8 of the ESI†), the nanosheets became flower-like structures. This may be ascribed to the aggregation of nanosheets during the cycling process, resulting in the formation of flower-like structures. Fig. 8(f–h) shows the schematic illustration for the morphology change after the cycling process. In particular, after several cycles, the morphology was completely changed into a sheet-like structure, and it was completely bonded with the CFC substrate.
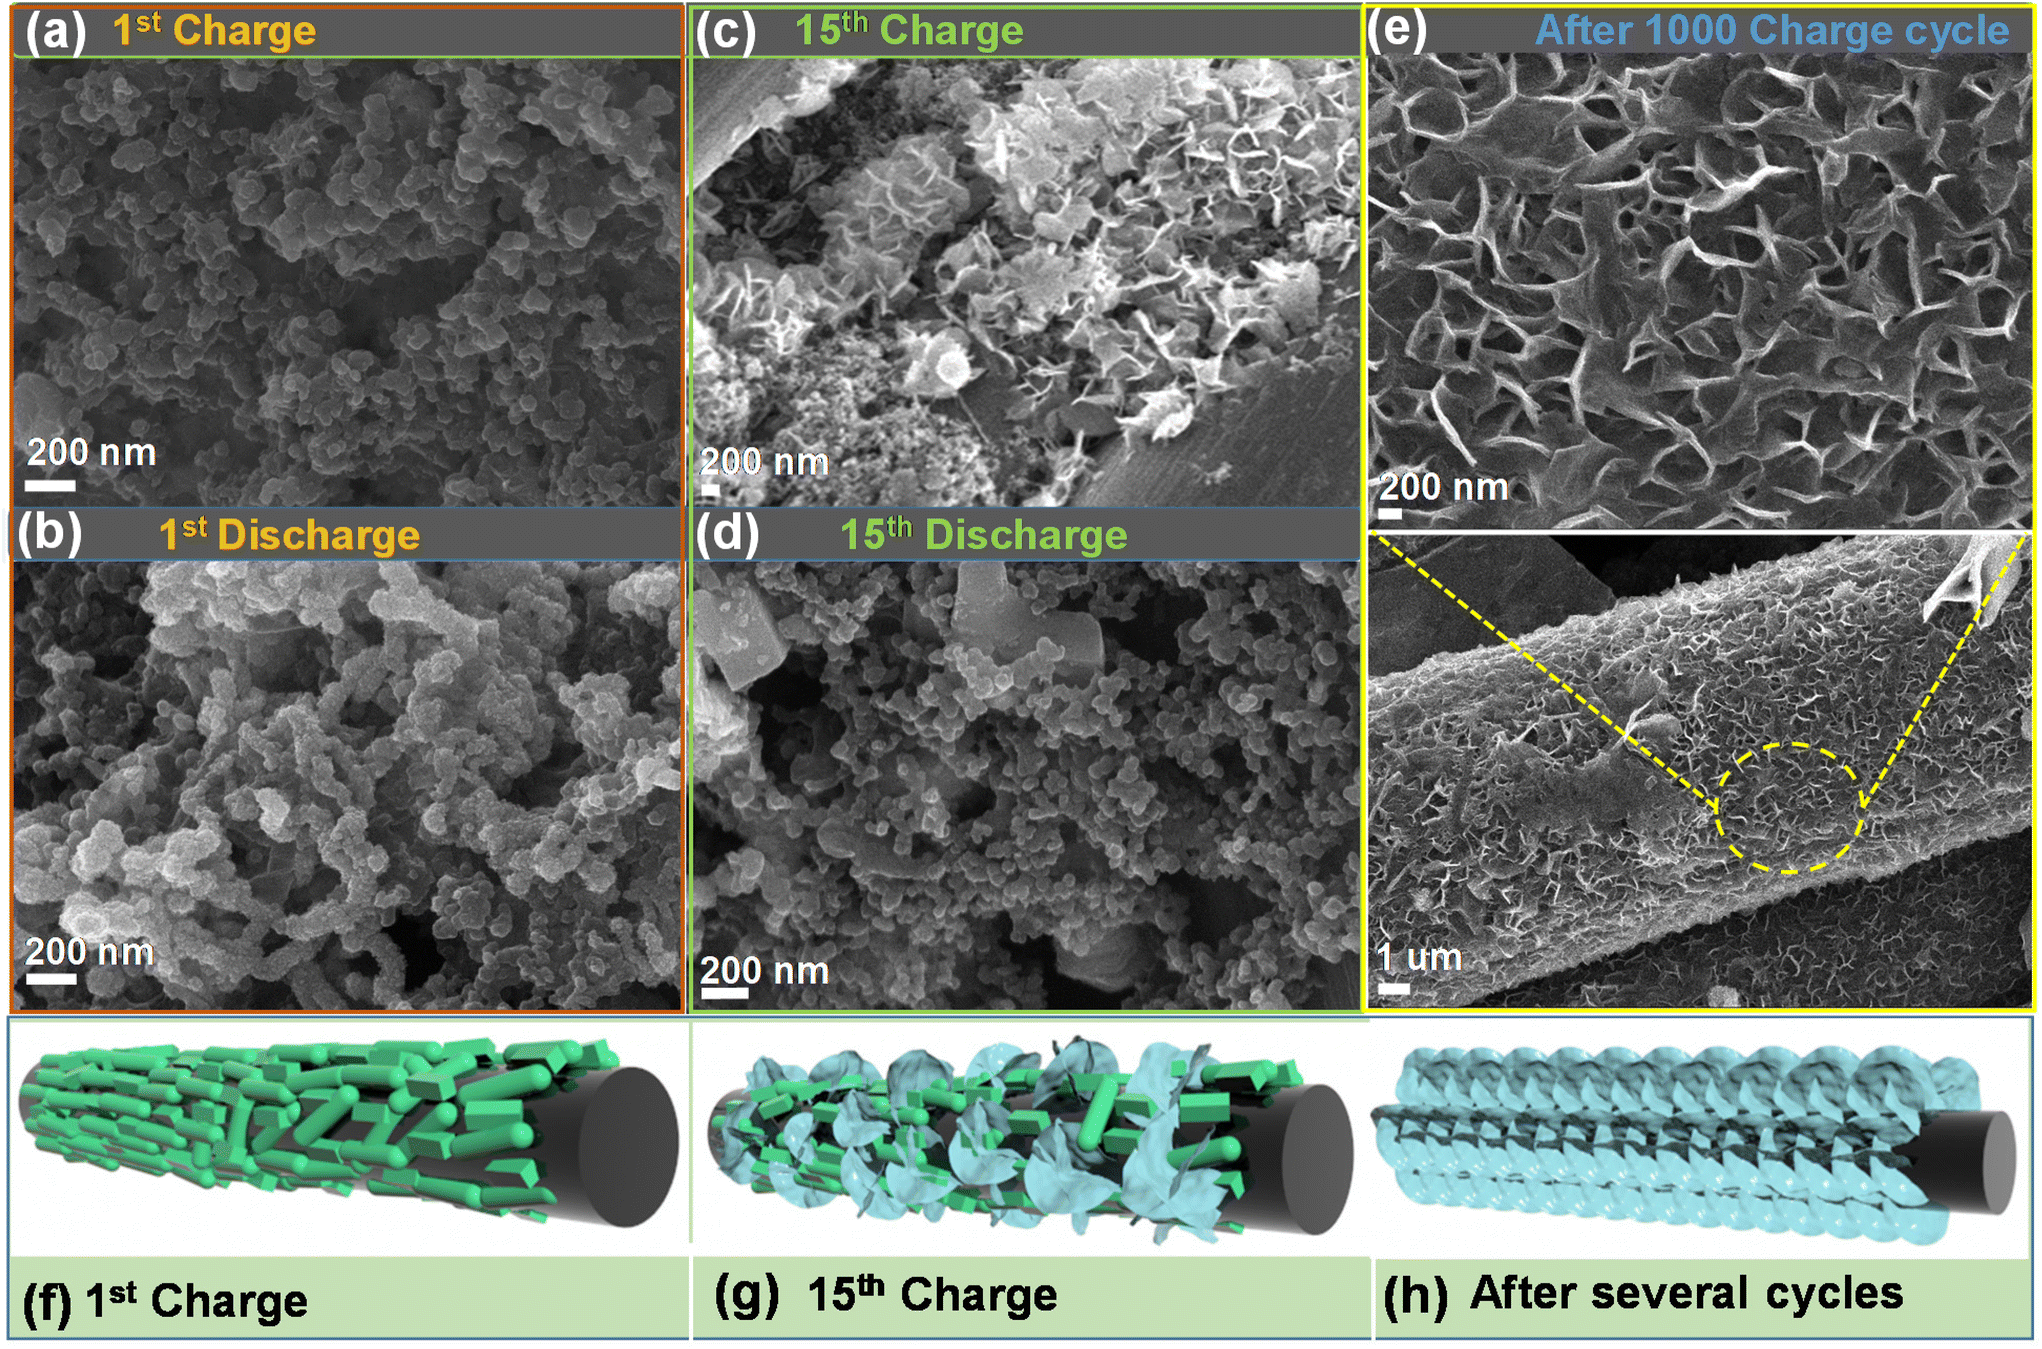 | ||
| Fig. 8 FE-SEM images of the O–CuVSe composite cathode measured after the (a) 1st charge, (b) 1st discharge, (c) 15th charge, (d) 15th discharge, and (e) 1000 charge cycles. (f–h) Schematic illustration for the morphology change during the cycling process. | ||
The observed excellent electrochemical performance of the O–CuVSe composite cathode is due to the following reasons. Firstly, the oxygen vacancies in the cathode can provide more open channels for the (de)-insertion of Zn2+, thus improving the Zi-ion storage performance. Second, the Cu-ion pillaring can accelerate the Zn2+ (de)-intercalation during the cycling process. Third, the morphology change into the nanosheet-like structure releases strain from the volume variation during the cycling process, absorbs sufficient electrolytes, and provides good contact at the electrode/electrolyte interface. Based on the above excellent electrochemical properties, the O–VSe nanostructures with Cu-ion pillaring (to form CuVSe) and oxygen vacancy feature (to form O–CuVSe) are anticipated to have high charge storage capability of the cathode to assemble the high-voltage and high-capacity AZiBs.
4. Conclusions
The O–CuVSe composite cathode material was prepared by a facile solvothermal method associated with further calcination at 500 °C. The synergic effect of Cu-ion pillaring, oxygen vacancy, and morphology evaluation upon cycling is the main reason for supporting the high voltage, superior cycling stability, and long-life span. The Cu-ion pillaring and oxygen defect engineering could enhance the electroactive sites, thus improving the electrochemical properties. Moreover, the morphology evaluation upon cycling simplifies the electrolyte access and improves the diffusion kinetics of ions. The obtained CV and ex situ XPS results indicated that the redox reaction occurred between V4+ and V5+, whereas the conversion mechanism between S0 and S2− was limited for a few cycles. Exploited from the above merits, the O–CuVSe composite cathode exhibited a reversible capacity of 154 mA h g−1 at 0.2 A g−1 over 100 cycles. The O–CuVSe composite cathode was operated at 1 and 2 A g−1 with no obvious capacity fading. Under a high current density of 5 A g−1, the capacity retention almost reached 100% over an ultra-long cycling life of 10000 cycles. The superior electrochemical performances in terms of excellent reversibility, long-term cycling stability, and good rate performance of the O–CuVSe composite electrode make them promising for designing advanced AZiBs for large-scale grid applications. This work could be extended to choose and construct other ideal high-performance cathode materials for AZiBs and other multivalent metal-ion storage systems.
Conflicts of interest
There are no conflicts to declare.Acknowledgements
This work was supported by the National Research Foundation of Korea (NRF) grant funded by the Korean government (MSIP) (No. 2018R1A6A1A03025708).References
- S. Pacala and R. Socolow, Science, 2004, 305, 968–972 CrossRef CAS PubMed.
- W. M. Zhang, X. L. Wu, J. S. Hu, Y. G. Guo and L. J. Wan, Adv. Funct. Mater., 2008, 18, 3941–3946 CrossRef CAS.
- J. Lu, I. Maggay and W. Liu, ChemComm, 2018, 54, 3094–3097 RSC.
- B. Dunn, H. Kamath and J.-M. Tarascon, Science, 2011, 334, 928–935 CrossRef CAS PubMed.
- D. Narsimulu, G. Nagaraju, S. C. Sekhar, B. Ramulu and J. S. Yu, Appl. Surf. Sci., 2021, 538, 148033 CrossRef CAS.
- N. Qiu, H. Chen, Z. Yang, Y. Zhu, W. Liu and Y. Wang, Chem. Commun., 2020, 56, 3785–3788 RSC.
- V. Soundharrajan, B. Sambandam, S. Kim, V. Mathew, J. Jo, S. Kim, J. Lee, S. Islam, K. Kim and Y.-K. Sun, ACS Energy Lett., 2018, 3, 1998–2004 CrossRef CAS.
- J. Ding, Z. Du, L. Gu, B. Li, L. Wang, S. Wang, Y. Gong and S. Yang, Adv. Mater., 2018, 30, 1800762 CrossRef PubMed.
- L. Kang, M. Cui, F. Jiang, Y. Gao, H. Luo, J. Liu, W. Liang and C. Zhi, Adv. Energy Mater., 2018, 8, 1801090 CrossRef.
- Y. Fu, Q. Wei, G. Zhang, X. Wang, J. Zhang, Y. Hu, D. Wang, L. Zuin, T. Zhou and Y. Wu, Adv. Energy Mater., 2018, 8, 1801445 CrossRef.
- X. Yuan, T. Sun, S. Zheng, J. Bao, J. Liang and Z. Tao, J. Mater. Chem. A, 2020, 8, 22686–22693 RSC.
- Z. Guo, Y. Ma, X. Dong, J. Huang, Y. Wang and Y. Xia, Angew. Chem., 2018, 130, 11911–11915 CrossRef.
- H. Luo, B. Wang, F. Wang, J. Yang, F. Wu, Y. Ning, Y. Zhou, D. Wang, H. Liu and S. Dou, ACS Nano, 2020, 14, 7328–7337 CrossRef CAS PubMed.
- M. S. Javed, H. Lei, Z. Wang, B.-T. Liu, X. Cai and W. Mai, Nano Energy, 2020, 70, 104573 CrossRef CAS.
- C. Wang, Y. Zeng, X. Xiao, S. Wu, G. Zhong, K. Xu, Z. Wei, W. Su and X. Lu, J. Energy Chem., 2020, 43, 182–187 CrossRef.
- H. Ge, X. Feng, D. Liu and Y. Zhang, Nano Res. Energy, 2023, 2, e9120039 Search PubMed.
- K. Zhu, T. Wu and K. Huang, ACS Nano, 2019, 13, 14447–14458 CrossRef CAS PubMed.
- Y. Zhang, A. Chen and J. Sun, J. Energy Chem., 2021, 54, 655–667 CrossRef CAS.
- T. Gupta, A. Kim, S. Phadke, S. Biswas, T. Luong, B. J. Hertzberg, M. Chamoun, K. Evans-Lutterodt and D. A. Steingart, J. Power Sources, 2016, 305, 22–29 CrossRef CAS.
- M. H. Alfaruqi, V. Mathew, J. Gim, S. Kim, J. Song, J. P. Baboo, S. H. Choi and J. Kim, Chem. Mater., 2015, 27, 3609–3620 CrossRef CAS.
- F. Wan and Z. Niu, Angew. Chem., 2019, 131, 16508–16517 CrossRef.
- T. Wei, Q. Li, G. Yang and C. Wang, J. Mater. Chem. A, 2018, 6, 20402–20410 RSC.
- S. Wang, Q. Wang, W. Zeng, M. Wang, L. Ruan and Y. Ma, Nano-Micro Lett., 2019, 11, 1–12 CrossRef CAS PubMed.
- S. Chen, R. Lan, J. Humphreys and S. Tao, Energy Storage Mater., 2020, 28, 205–215 CrossRef.
- M. Yan, P. He, Y. Chen, S. Wang, Q. Wei, K. Zhao, X. Xu, Q. An, Y. Shuang and Y. Shao, Adv. Mater., 2018, 30, 1703725 CrossRef PubMed.
- F. Wan, L. Zhang, X. Dai, X. Wang, Z. Niu and J. Chen, Nat. Commun., 2018, 9, 1–11 CrossRef CAS PubMed.
- Q. Li, K. Ma, G. Yang and C. Wang, Energy Storage Mater., 2020, 29, 246–253 CrossRef.
- M. Huang, J. Meng, Z. Huang, X. Wang and L. Mai, J. Mater. Chem. A, 2020, 8, 6631–6637 RSC.
- N. Zhang, M. Jia, Y. Dong, Y. Wang, J. Xu, Y. Liu, L. Jiao and F. Cheng, Adv. Funct. Mater., 2019, 29, 1807331 CrossRef.
- D. Narsimulu, A. K. Kakarla and J. S. Yu, J. Energy Chem., 2021, 58, 25–32 CrossRef CAS.
- S. C. Sekhar, B. Ramulu, D. Narsimulu, S. J. Arbaz and J. S. Yu, Small, 2020, 16, 2003983 CrossRef CAS PubMed.
- S. Chandra Sekhar, G. Nagaraju, D. Narsimulu, B. Ramulu, S. K. Hussain and J. S. Yu, ACS Appl. Mater. Interfaces, 2020, 12, 27074–27086 CrossRef CAS PubMed.
- A. K. Kakarla, D. Narsimulu, H. R. Patnam, R. Shanthappa and J. S. Yu, Int. J. Energy Res., 2022, 46, 13590–13601 CrossRef CAS.
- F. Liu, Z. Chen, G. Fang, Z. Wang, Y. Cai, B. Tang, J. Zhou and S. Liang, Nano-Micro Lett., 2019, 11, 1–11 CrossRef PubMed.
- W. Sun, G. Gao, K. Zhang, Y. Liu and G. Wu, Carbon, 2018, 132, 667–677 CrossRef CAS.
- Y. Yang, Y. Tang, G. Fang, L. Shan, J. Guo, W. Zhang, C. Wang, L. Wang, J. Zhou and S. Liang, Energy Environ. Sci., 2018, 11, 3157–3162 RSC.
- F. Ming, H. Liang, Y. Lei, S. Kandambeth, M. Eddaoudi and H. N. Alshareef, ACS Energy Lett., 2018, 3, 2602–2609 CrossRef CAS.
- C. Liu, Z. Neale, J. Zheng, X. Jia, J. Huang, M. Yan, M. Tian, M. Wang, J. Yang and G. Cao, Energy Environ. Sci., 2019, 12, 2273–2285 RSC.
- Y. Liu, Z. Pan, D. Tian, T. Hu, H. Jiang, J. Yang, J. Sun, J. Zheng, C. Meng and Y. Zhang, Chem. Eng. J., 2020, 399, 125842 CrossRef CAS.
- P. Hu, T. Zhu, X. Wang, X. Wei, M. Yan, J. Li, W. Luo, W. Yang, W. Zhang and L. Zhou, Nano Lett., 2018, 18, 1758–1763 CrossRef CAS PubMed.
- P. Wu, T. Xu, Y. Chen, Q. Yang, J. Wang, Y.-N. Liu and Y. Li, ACS Appl. Energy Mater., 2022, 5, 1656–1661 CrossRef CAS.
- S. Wei, S. Chen, X. Su, Z. Qi, C. Wang, B. Ganguli, P. Zhang, K. Zhu, Y. Cao and Q. He, Energy Environ. Sci., 2021, 14, 3954–3964 RSC.
- C. Xia, J. Guo, P. Li, X. Zhang and H. N. Alshareef, Angew. Chem., Int. Ed., 2018, 57, 3943–3948 CrossRef CAS PubMed.
- D. Kundu, B. D. Adams, V. Duffort, S. H. Vajargah and L. F. Nazar, Nat. Energy, 2016, 1, 1–8 Search PubMed.
- D. Bin, Y. Liu, B. Yang, J. Huang, X. Dong, X. Zhang, Y. Wang and Y. Xia, ACS Appl. Mater. Interfaces, 2019, 11, 20796–20803 CrossRef CAS PubMed.
- T. T. Nguyen, J. Balamurugan, D. H. Kim, N. H. Kim and J. H. Lee, Small, 2020, 16, 2004661 CrossRef CAS PubMed.
- R. Shanthappa, A. K. Kakarla, D. Narsimulu, H. Bandi and J. S. Yu, J. Alloys Compd., 2023, 935, 168102 CrossRef CAS.
- L. Wang, Z. Wu, M. Jiang, J. Lu, Q. Huang, Y. Zhang, L. Fu, M. Wu and Y. Wu, J. Mater. Chem. A, 2020, 8, 9313–9321 RSC.
- Y. Bai, H. Zhang, B. Xiang, X. Liang, J. Hao, C. Zhu and L. Yan, ACS Appl. Mater. Interfaces, 2021, 13, 23230–23238 CrossRef CAS PubMed.
- Z. Chen, P. Wang, Z. Ji, H. Wang, J. Liu, J. Wang, M. Hu and Y. Huang, Nano-Micro Lett., 2020, 12, 1–12 Search PubMed.
- S. Yang, H. Lv, Y. Wang, X. Guo, L. Zhao, H. Li and C. Zhi, Angew. Chem., Int. Ed., 2022, 61, e202209794 CAS.
- H. Cui, T. Wang, Z. Huang, G. Liang, Z. Chen, A. Chen, D. Wang, Q. Yang, H. Hong and J. Fan, Angew. Chem., Int. Ed., 2022, 61, e202203453 CAS.
- L. Ma, S. Chen, H. Li, Z. Ruan, Z. Tang, Z. Liu, Z. Wang, Y. Huang, Z. Pei and J. A. Zapien, Energy Environ. Sci., 2018, 11, 2521–2530 RSC.
- Z. Chen, F. Mo, T. Wang, Q. Yang, Z. Huang, D. Wang, G. Liang, A. Chen, Q. Li and Y. Guo, Energy Environ. Sci., 2021, 14, 2441–2450 RSC.
- N. Zhang, F. Cheng, Y. Liu, Q. Zhao, K. Lei, C. Chen, X. Liu and J. Chen, J. Am. Chem. Soc., 2016, 138, 12894–12901 CrossRef CAS PubMed.
- Y. Dong, S. Di, F. Zhang, X. Bian, Y. Wang, J. Xu, L. Wang, F. Cheng and N. Zhang, J. Mater. Chem. A, 2020, 8, 3252–3261 RSC.
- Y. Yang, J. Xiao, J. Cai, G. Wang, W. Du, Y. Zhang, X. Lu and C. C. Li, Adv. Funct. Mater., 2021, 31, 2005092 CrossRef CAS.
- J. Huang, Z. Wang, M. Hou, X. Dong, Y. Liu, Y. Wang and Y. Xia, Nat. Commun., 2018, 9, 1–8 CrossRef PubMed.
- B. Lee, H. R. Lee, H. Kim, K. Y. Chung, B. W. Cho and S. H. Oh, Chem. Commun., 2015, 51, 9265–9268 RSC.
- Y. Zhao, Y. Zhu, F. Jiang, Y. Li, Y. Meng, Y. Guo, Q. Li, Z. Huang, S. Zhang and R. Zhang, Angew. Chem., 2022, 134, e202111826 Search PubMed.
- Z. Wu, C. Lu, Y. Wang, L. Zhang, L. Jiang, W. Tian, C. Cai, Q. Gu, Z. Sun and L. Hu, Small, 2020, 16, 2000698 CrossRef CAS PubMed.
- D. Bin, Y. Wang, A. G. Tamirat, P. Zhu, B. Yang, J. Wang, J. Huang and Y. Xia, ACS Sustainable Chem. Eng., 2021, 9, 3223–3231 CrossRef CAS.
- T. Xu, M. Zhao, Z. Su, Z. Li, V. G. Pol and C.-T. Lo, Energy Fuels, 2021, 35, 16194–16201 CrossRef CAS.
- R. Venkatkarthick, N. Rodthongkum, X. Zhang, S. Wang, P. Pattananuwat, Y. Zhao, R. Liu and J. Qin, ACS Appl. Energy Mater., 2020, 3, 4677–4689 CrossRef CAS.
- Y. Xue, X. Shen, H. Zhou, J. Cao, J. Pu, Z. Ji, L. Kong and A. Yuan, Chem. Eng. J., 2022, 448, 137657 CrossRef CAS.
- P. Hu, T. Zhu, X. Wang, X. Zhou, X. Wei, X. Yao, W. Luo, C. Shi, K. A. Owusu and L. Zhou, Nano Energy, 2019, 58, 492–498 CrossRef CAS.
- G. Li, Z. Yang, Y. Jiang, C. Jin, W. Huang, X. Ding and Y. Huang, Nano Energy, 2016, 25, 211–217 CrossRef CAS.
- P. He, M. Yan, G. Zhang, R. Sun, L. Chen, Q. An and L. Mai, Adv. Energy Mater., 2017, 7, 1601920 CrossRef.
- S. Chen, Y. Zhang, H. Geng, Y. Yang, X. Rui and C. C. Li, J. Power Sources, 2019, 441, 227192 CrossRef CAS.
- J. Wu, Q. Kuang, K. Zhang, J. Feng, C. Huang, J. Li, Q. Fan, Y. Dong and Y. Zhao, Energy Storage Mater., 2021, 41, 297–309 CrossRef.
- D. Narsimulu, G. Nagaraju, S. C. Sekhar, B. Ramulu and J. S. Yu, Appl. Surf. Sci., 2019, 497, 143795 CrossRef CAS.
- W. Yang, J. Wang, W. Ma, C. Dong, G. Cheng and Z. Zhang, J. Power Sources, 2016, 333, 88–98 CrossRef CAS.
- E.-S. Kim, M.-C. Kim, S.-H. Moon, Y.-K. Shin, J.-E. Lee, S. Choi and K.-W. Park, J. Alloys Compd., 2019, 794, 84–93 CrossRef CAS.
- W. Li, K. Wang, S. Cheng and K. Jiang, Energy Storage Mater., 2018, 15, 14–21 CrossRef.
- T. Li, Q. Zhang, X. H. Wang, J. Luo, L. Shen, H. C. Fu, F. Gu, N. B. Li and H. Q. Luo, Nanoscale, 2021, 13, 17846–17853 RSC.
- J. Wang and F. Guan, CrystEngComm, 2020, 22, 68–73 RSC.
- S. K. Hussain, B. V. Krishna and J. S. Yu, J. Mater. Chem. A, 2022, 10, 23352–23365 RSC.
Footnote |
| † Electronic supplementary information (ESI) available. See DOI: https://doi.org/10.1039/d2nr06648c |
| This journal is © The Royal Society of Chemistry 2023 |