
 Open Access Article
 This Open Access Article is licensed under a
 Creative Commons Attribution 3.0 Unported Licence
A national crowdsourced network of low-cost fine particulate matter and aerosol optical depth monitors: results from the 2021 wildfire season in the United States†
Eric A.
Wendt
 a,
Bonne
Ford
b,
Michael
Cheeseman‡
b,
Zoey
Rosen
c,
Jeffrey R.
Pierce
b,
Shantanu H.
Jathar
a,
Christian
L'Orange
a,
Casey
Quinn
a,
Marilee
Long
c,
John
Mehaffy
ad,
Daniel D.
Miller-Lionberg
d,
David H.
Hagan
e and
John
Volckens
*a
a,
Bonne
Ford
b,
Michael
Cheeseman‡
b,
Zoey
Rosen
c,
Jeffrey R.
Pierce
b,
Shantanu H.
Jathar
a,
Christian
L'Orange
a,
Casey
Quinn
a,
Marilee
Long
c,
John
Mehaffy
ad,
Daniel D.
Miller-Lionberg
d,
David H.
Hagan
e and
John
Volckens
*a
aDepartment of Mechanical Engineering, Colorado State University, Fort Collins, Colorado 80523, USA. E-mail: john.volckens@colostate.edu
bDepartment of Atmospheric Science, Colorado State University, Fort Collins, Colorado 80523, USA
cDepartment of Journalism and Media Communication, Colorado State University, Fort Collins, CO 80523, USA
dAccess Sensor Technologies, LLC, Fort Collins, CO 80523, USA
eQuantAQ, Inc., Somerville, MA 02143, USA
First published on 18th September 2023
Abstract
Fine particulate matter (PM2.5) is a leading contributor to premature death, disease, and environmental degradation globally. Wildfire smoke is a primary source of air pollution in the United States. However, reference-grade ground monitors are cost prohibitive to deploy at the spatial scales needed to assess the variability of wildfire smoke. In many regions lacking adequate monitoring, health impact assessments and epidemiological studies on smoke may rely on satellite-based instruments, which estimate PM2.5 based on Aerosol Optical Depth (AOD). However, AOD measurements may not capture surface-level impacts; thus, measurements in under-monitored regions are necessary to interpret satellite observations. While low-cost PM2.5 sensors have been deployed at large scales, these sensors typically lack AOD measurement capability. In prior work, we designed the Aerosol Mass and Optical Depth (AMODv2) sampler, which can simultaneously measure PM2.5 (optical and gravimetric filter-based) and AOD. In this work, we distributed AMODv2s to volunteers at 31 locations in the contiguous United States, forming a nationwide network for the summer of 2021. A majority of our network was successful, with 86.6% of sampling periods resulting in a valid sample. We found our AOD sensors agreed closely with nearby (<25 km) reference monitor measurements (taken <180 seconds apart), with mean absolute error results of 0.03, 0.02, 0.02, and 0.03 at 440, 500, 675, and 870 nm, respectively. In a regional analysis of wildfire smoke, we observed elevated PM2.5 and AOD on smoky days at study sites in most regions, which led to similar PM2.5![[thin space (1/6-em)]](https://www.rsc.org/images/entities/char_2009.gif) :AOD ratios regardless of smoke. However, at the California study sites, median PM2.5 remained similar on smoky days relative to non-smoky days, while AOD increased, implying that the smoke may have been lofted above the surface during the study period. At the California study sites, the median PM2.5:AOD ratio was 67.2 μg m−3 on non-smoky days, compared with 30.2 μg m−3 on smoky days. At study sites in other regions, the average ratio was 24.7 to 33.5 μg m−3 on non-smoky days and 20.3 to 29.4 μg m−3 on smoky days. We show that paired PM2.5 and AOD measurements collected by a crowdsourced network can highlight anomalies in air quality during smoke events and provide insights into the relationship between satellite-based and ground-based air quality observations.
:AOD ratios regardless of smoke. However, at the California study sites, median PM2.5 remained similar on smoky days relative to non-smoky days, while AOD increased, implying that the smoke may have been lofted above the surface during the study period. At the California study sites, the median PM2.5:AOD ratio was 67.2 μg m−3 on non-smoky days, compared with 30.2 μg m−3 on smoky days. At study sites in other regions, the average ratio was 24.7 to 33.5 μg m−3 on non-smoky days and 20.3 to 29.4 μg m−3 on smoky days. We show that paired PM2.5 and AOD measurements collected by a crowdsourced network can highlight anomalies in air quality during smoke events and provide insights into the relationship between satellite-based and ground-based air quality observations.
Environmental significanceAmbient fine-particulate air pollution (PM2.5) is a leading risk factor for premature disease and death, globally, and a contributor to Earth's energy balance. Both satellite remote sensing and ground-based monitoring have a role to play in quantifying surface PM2.5 concentrations, but networks that monitor both aerosol optical depth (AOD; the satellite product) and PM2.5 mass (the ground-based monitor product) are sparse. Here, we demonstrate that a low-cost monitor for PM2.5 and AOD, when deployed in a national crowdsourced monitoring network, can provide valuable insights into air quality. |
1 Introduction
Fine particulate matter (PM2.5) air pollution is a leading contributor to human death and disease globally.1–4 PM2.5 can penetrate deep into the lungs, causing acute and chronic disease.5–8 Each year, millions of premature deaths worldwide are attributed to PM2.5 exposure.1,2 Ambient PM2.5 also impacts the Earth's climate by contributing to radiative climate forcing.9As a primary source of ambient PM2.5, smoke from wildfires has been linked to negative health outcomes.10–12 In the United States, studies have estimated that thousands to tens of thousands of premature deaths are attributable to wildfire smoke per year;13,14 worldwide, this estimate is on the order of hundreds of thousands.15 Wildfire smoke has also been linked to respiratory, cardiovascular, and asthma-related morbidity,16–18 resulting in thousands of hospital admissions per year.13,14,19,20
The air quality impacts of wildfire smoke plumes can vary considerably at relatively small spatial scales.21 In many areas affected by wildfire smoke, ground monitors are not distributed with sufficient spatial density for public health assessment (e.g., ref. 22 and 23) due to cost constraints. Satellite-based instruments, which can estimate ground-level PM2.5 at relatively high spatial resolution, are used for assessment in areas lacking sufficient ground monitors.24,25 Recent studies on the impact of wildfire smoke have incorporated data from satellite-based instruments in addition to surface monitors and simulation results from chemical transport models (CTMs).21,26–30 Observations from satellite-based instruments, such as the Moderate Resolution Imaging Spectrometer (MODIS), the Multi-angle Imaging SpectroRadiometer (MISR), and the Geostationary Operational Environmental Satellites (GOES) Advanced Baseline Imager (ABI),31–33 have been used to estimate ground-level PM2.5 by associating aerosol optical depth (AOD), a measure of light extinction through the atmosphere, with ground-level PM2.5.24,25,34–37 Often, these studies have translated AOD to PM2.5 using a spatially-resolved proportional relationship, expressed as follows:34,35
| PM2.5 = η·AOD | (1) |
Ground monitors can be used to constrain the uncertainties of satellite-based estimates by accurately measuring PM2.5 and AOD at the Earth's surface.24,25,37,40,41 Sun photometers measure AOD from the Earth's surface by quantifying the extinction of sunlight in the atmosphere due to atmospheric aerosols.42 The Aerosol Robotics Network (AERONET) consists of highly accurate sun photometers distributed across the planet, including hundreds of active sites in the contiguous United States.42 Ground-level PM2.5 can be measured by a variety of different methods. For example, PM2.5 can be measured gravimetrically by instruments that sample air at a known flow rate and isolate particles with diameters smaller than 2.5 μm from the flow stream,43,44 which are deposited on a filter; by using light-scattering sensors which estimate aerosol concentrations and size distributions based on how a controlled light source is scattered and absorbed by sampled air,45 or by beta attenuation monitors which estimate concentrations based on absorption of beta radiation. The Environmental Protection Agency (EPA) maintains the Air Quality System (AQS), which includes reference-quality gravimetric and light-scattering PM samplers (https://aqs.epa.gov/aqsweb/airdata.html). A complete evaluation of satellite-derived PM2.5 requires co-locating ground-based AOD and PM2.5 monitors. The Surface Particulate Matter Network (SPARTAN) features sites throughout the world where reference-quality AOD and PM2.5 monitors are co-located and operate simultaneously.46 SPARTAN and deployments of similar instruments have been used to evaluate satellite AOD and PM2.5 at specific sites.46,47 Due to the relatively high costs of reference equipment (>10000 USD for PM2.5 and >50000 USD for AERONET), there are relatively few active SPARTAN sites worldwide (∼20 active sites). Outside of specific field campaigns,48–50 AERONET monitors are rarely deployed long-term at sub-city scales, which may be necessary to capture the variability during wildfire smoke events.21 Lower-cost instruments have the potential to fill spatial gaps in ground monitoring networks left by reference monitors.51
Networks of low-cost nephelometers (e.g., the Plantower PMS5003) have been deployed to acquire ground-level PM2.5 data at spatial resolutions finer than what is available with regulatory networks.51–56 However, CF_1 PM2.5 concentrations from Plantower PMS5003 sensors are known to have a high bias at high concentrations and low bias at low concentrations, requiring calibration and field correction relative to reference methods.45,57–65 Networks of low-cost, hand-held sun photometers have been deployed in crowdsourced studies.61,62 However, these studies reported difficulties coordinating with study participants to take measurements during satellite overpasses in addition to using inconsistent measurement quality control practices.66 To date, crowdsourced deployments of low-cost aerosol pollution monitors have typically been limited to one measurement modality (PM2.5 or full atmospheric column AOD). This limitation motivated our work toward the development of novel, low-cost monitors capable of measuring both PM2.5 and AOD.67,68
In prior studies, we developed and tested a low-cost monitor for simultaneous measurement of AOD and PM2.5 called the Aerosol Mass and Optical Depth (AMOD) sampler.61,67,68 We deployed AMODv1 samplers in a crowdsourced network called Citizen Enabled Aerosol Measurements for Satellites (CEAMS) in northern Colorado and found that non-scientist volunteers could effectively operate the instruments to acquire data used to assess satellite measurements at relatively small spatial scales (<5 km).61 In a subsequent study, we developed and validated the AMODv2 sampler. The AMODv2 maintained the PM2.5 measurement capabilities of the AMODv1, while achieving longer runtimes through a larger battery, automated AOD measurement throughout daylight hours through a solar tracking system, and real-time data transmission through a Wi-Fi module.68
In this work, we describe a CEAMS deployment featuring a crowdsourced PM2.5 and AOD monitoring network of AMODv2s spanning the contiguous United States in the summer of 2021. We specifically focus our analysis on the regional variability of PM2.5 and AOD under the influence of wildfire smoke. First, we summarize the data collected by volunteers using AMODv2s. Second, we assess the performance of our AOD sensors in a crowdsourced context by comparing our results to nearby AERONET monitors. Third, we evaluate the regional variability of PM2.5 and AOD in the presence and absence of smoke. Finally, we highlight results from California, which exhibited unique smoke-dependent variability compared with the rest of the contiguous United States. With our crowdsourced network of low-cost PM2.5 and AOD monitors, we seek to expand the availability of ground-level PM2.5 measurements for direct application to Earth science and public health research, and to advance the understanding of the regional variability of PM2.5 and AOD toward improving satellite-based air quality monitoring.
2 Materials and methods
2.1 Nationwide crowdsourced monitoring network
Our CEAMS network consisted of 29 undergraduate students and two administrators from the Student Airborne Research Program (SARP) through the National Aeronautics and Space Administration (NASA). Participants operated AMODv2s at their homes or workplaces. A map illustrating the distribution of sampling locations is provided in Fig. 1. We partitioned sites in the contiguous United States into four regions: (1) California/West Coast, (2) Mountain West, (3) Midwest, and (4) Northeast (Fig. 1). The sampling campaign began on June 15, 2021, and ended on August 8, 2021.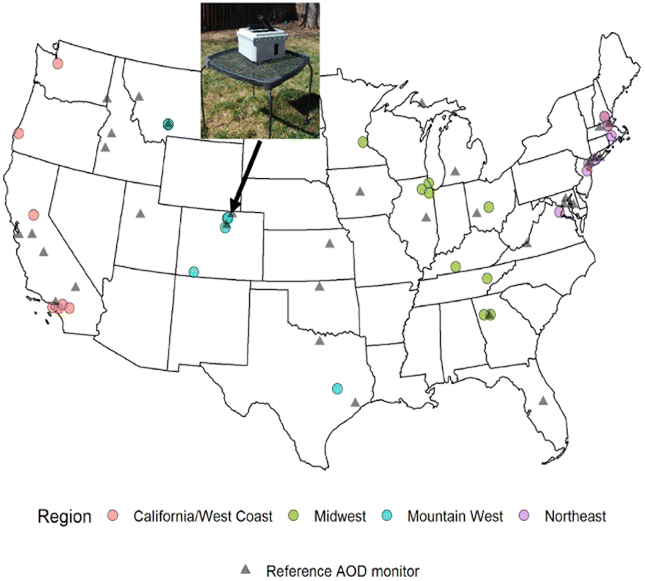 | ||
| Fig. 1 Locations of CEAMS AMOD and AERONET (reference AOD monitors) sites for summer 2021 field campaign. Sites are colored by region. An example photograph of an AMODv2 sampling AOD in Laporte, Colorado is provided. | ||
2.2 Participant training and AMODv2 operation
Here we summarize how participants operated the AMODv2 in our crowdsourced network. A detailed description of the instrument and prior validation work are provided in Wendt et al.68 The AMODv2 measures gravimetric, time-integrated PM2.5 mass concentration, real-time PM2.5 mass concentration, and AOD simultaneously.68 For gravimetric PM2.5, the AMODv2 sampled air at 1 L min−1 through a custom cyclone,43,44 which isolated PM2.5 from incoming flow. PM2.5 was continuously deposited on the filter until the conclusion of the sample, when the participant placed the filter cartridge in a sealed container and refrigerated the samples until the end of the campaign. AMODv2s also reported semi-continuous PM2.5 concentrations using a light-scattering PM2.5 sensor (Plantower PMS5003, Beijing, China). AOD was measured at 440 nm, 500 nm, 675 nm, and 870 nm semi-continuously (during daylight hours) by AMODv2s using a solar tracking subsystem.64 Instruments were programmed to report PM2.5 and AOD at each 20 minute mark throughout the day (e.g. 1:00, 1:20, 1:40, etc.). At night or when the sun was obstructed from view, only PM2.5 was reported. At the conclusion of each sampling period, participants brought their AMODv2 inside for charging and to initiate a wireless full-file data transfer via the smartphone application. The full log files contained meteorological (e.g., temperature, relative humidity, and barometric pressure) and device diagnostics (e.g., battery state of charge and wireless signal strength) data.68
We distributed AMODv2 sampling kits to study participants via mail. Each sampling kit included an AMODv2, eight pre-weighed gravimetric sampling filters, two pre-weighed blank filters, a charging cable, a user manual,68 a microSD card reader, and a sampler repair kit. The external housing of the AMODv2 is made from a weather resistant NEMA electrical enclosure. We trained participants on how to operate their AMODv2s in a series of online video training sessions. To prepare a sample, participants loaded a pre-weighed, 37 mm Teflon filter contained in a cartridge, which was linked to the sample file via a QR code.68 Participants then placed their AMODv2 in an outdoor location with, to the greatest extent possible, an unobstructed view of the sun during the day. Participants then initiated a 96 hour sampling run using our smartphone application.
Participants began their 96 hour filter samples each week on Tuesday morning and sampled through Saturday morning. We held online “office hours” on Mondays to diagnose issues and provide further instruction for interested participants. We assigned each participant a unique identification code to link their instrument with our project website (https://csu-ceams.com/). Participants with internet access connected their instruments to a Wi-Fi network using our smartphone application (“CEAMS”; available on the Apple App Store and Google Play). The website allowed for data visualization in real time. Participants without Wi-Fi access at the sampling location removed their sampler's microSD card at the end of each sampling period, downloaded their data, and emailed it; the data was subsequently uploaded to our server via FTP.
2.3 PM2.5 and AOD data processing and quality control
At the conclusion of the nationwide CEAMS campaign, participants mailed back their AMODv2s along with their filter samples. We first post-weighed sample filters and blanks. We evaluated the mass limit-of-detection as the mean change in filter blank mass plus three times the standard deviation of the blank filter masses. We discarded AMODv2 log files based on the validity of the accompanying filter samples. Filter samples with less mass than the limit-of-detection were not included in subsequent analyses (40 of 189 filters). We applied blank correction to filter masses by subtracting the mean blank mass from the mass of each sample filter from a given participant. As previously mentioned, the PM2.5 concentrations from Plantower PMS5003 sensors are known to have a high bias at high concentrations and a low bias at low concentrations. There are several different methods that are used to attempt to correct the bias (e.g., ref. 62–64 and 69). Here, we follow Ford et al.61 and Tryner et al.,45 by applying a correction to each PMS5003 CF1 PM2.5 measurement using the corresponding filter measurement. Specifically, we scaled each 2 minute PMS5003 PM2.5 measurement by the ratio between the corresponding 96 hour time-weighted average PM2.5 concentration measured via the filter sample and the 96 hour time-weighted average of all the Plantower PMS5003 PM2.5 measurements during the sampling period. Thus, the correction factor can be different for different locations/devices and for different sample periods but is a consistent scale factor per device sampling period.AOD measurements made in our study followed a triplet protocol. At each 20 minute mark, the AMODv2 AOD subsystem sampled sunlight intensity three times at 30 second intervals. Both the raw measurements and the triplet average were saved in the sample log file. We screened our triplet measurements for cloud contamination based on the AERONET cloud screening algorithm, which, in part, identifies measurements with intra-triplet variation above an empirically determined threshold.70,71 To account for differences in the electrical stability of our optical sensors compared with those in AERONET monitors, we derived our own empirical intra-triplet variability thresholds. Specifically, at AOD below 0.7, we classified triplets with maximum variability greater than 0.1 to be cloud contaminated. At AOD greater than or equal to 0.7, the threshold was set to 0.15. We also omitted incomplete triplets. For analysis of the PM2.5:AOD ratio, we used the 500 nm AOD channel. One unit (AD00073) had degraded 500 nm and 870 nm channels (noted from comparison with nearby AERONET AOD), while the 440 nm and 675 nm channels appeared to be functioning well. For this single unit, we used the Angstrom exponent calculated from the 440 nm and 675 nm channels to calculate the 500 nm AOD (Fig. S1†).
The gravimetric PM2.5 subsystem of the AMODv2 has been extensively evaluated in laboratory and field settings in prior work.43,44,67,72,73 The light-scattering PM2.5 subsystem has likewise undergone extensive laboratory and field evaluations.45,57–60,67,74 By contrast, prior to this work, the AOD subsystem had been evaluated only in controlled experiments,68 and not in a crowdsourced field campaign. To evaluate the performance of the AOD subsystem in our crowdsourced network, we compared valid AMODv2 AOD measurements with AERONET AOD measurements taken within 180 seconds and 25 km of each other. A total of four CEAMS/AERONET site pairs satisfied these criteria yielding 493 valid measurement pairs in total including all wavelengths.
We obtained daily smoke plume information from National Oceanic and Atmospheric Administration (NOAA) Hazardous Mapping System (HMS) Fire and Smoke Product.75 The HMS product identifies that there is smoke in the atmospheric column, without specifying where in the column the smoke is located.70 HMS smoke polygons have been used to designate potentially smoke-impacted days (e.g., ref. 28 and 76). CEAMS PM2.5 and AOD measurements occurring within the boundaries of daily smoke polygons, regardless of the intensity of smoke, were labelled as smoke impacted.
3 Results and discussion
3.1 Data overview
Participants in our nationwide CEAMS network collected a total of 192 unique log files using AMODv2 samplers in the summer of 2021. These log files included meteorological and quality-control data at 30 second intervals, along with PM2.5 and AOD measurements at 20 minute intervals. They also include summary runtime metrics such as total sampling time, total volume of air sampled, and the reason for runtime termination. Sampling runs concluded at the end of the specified 96 hour runtime or prematurely due to one of the following mechanisms: depleted battery, user-initiated manual shutdown, or unknown error. Based on prior testing,64 we suspect failures with unknown cause were most likely due to water damage from either heavy rain or placement of the AMODv2 within the spray reach of home irrigation systems. For a detailed analysis of prematurely terminated sampling runs, see Text S1 in the ESI.†Of the 192 sample log files, 189 had an accompanying filter returned at the end of the study. Only three were lost or damaged in the unloading process or in transit. In Fig. 2, we provide the distribution of sample runtimes associated with CEAMS log files labelled by failure mode and filter status. Filters from sampling periods that ended prematurely were only discarded if the filter mass concentration was below the limit of detection (LOD). We calculated the LOD from the 60 blank filters that were returned at the conclusion of the study. The LOD for filter samples was 17.3 μg, which translates to a time-averaged PM2.5 mass concentration of 3 μg m−3, based on a 96 h sample duration at 1 L min−1. This is slightly higher than expected from previous testing but may be due to inconsistent treatment of filters among participants. Of the returned filters, 149 (78.8%) contained PM2.5 mass in excess of the LOD.
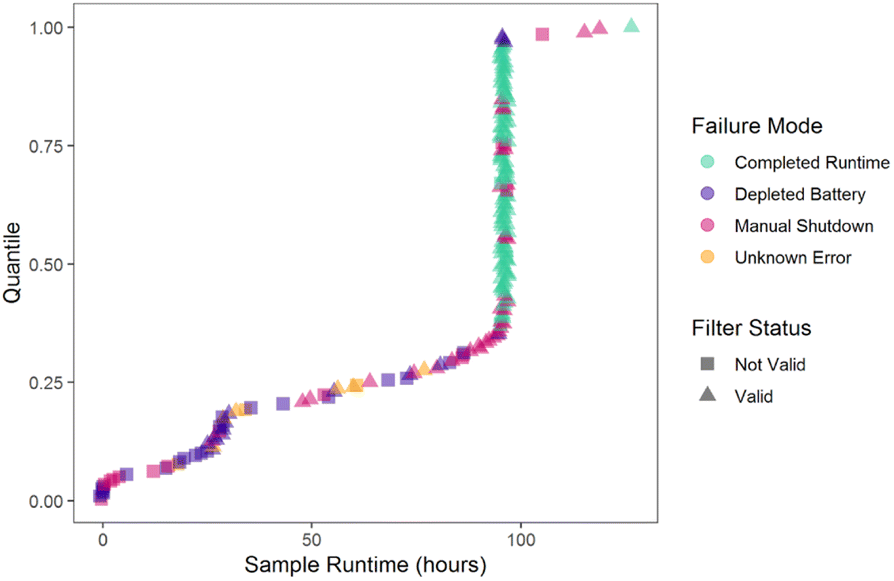 | ||
| Fig. 2 Distribution of CEAMS sample logs ordered by runtime with failure mode and filter status labeled. We introduced a horizontal random jitter with one-hour width for visualization purposes. Points labeled “Completed Runtime” completed the full 96 hour runtime without interruption. Sample runtimes above 96 hours were caused by participants shutting off their AMODv2 mid-sample and restarting it shortly thereafter. | ||
Of the 43071 total PMS5003 PM2.5 measurements collected, 41381 (96.2%) were classified as valid (values during the powering on procedure were excluded). Log files without a corresponding filter measurement were also excluded from all analyses, leaving a total of 38699 filter-corrected PMS5003 measurements. The mean ratio of the filter PM2.5 to Plantower PMS5003 PM2.5 (i.e., PMS5003 scaling factor) was 1.7 with a standard deviation of 1.9. This value of 1.7 suggests a low bias on average. However, this low bias is to be expected because concentrations were generally low across the whole campaign as shown in the PM2.5 distribution in Fig. 3a. Box and whisker plots of these PMS5003 scaling factors as a function of the number of smoke-impacted days are provided in Fig. S2,† and these correction-factor distributions for each individual AMODv2 device are provided in Fig. S3.† As shown in these figures, scaling factors were greater than one for sampling periods with no or few smoke days (which correspond to lower concentrations, Table 1) and less than one for sampling periods with more smoke days and higher concentrations, corroborating previous work showing a high bias at high concentrations and a low bias at low concentrations (e.g., ref. 45 and 57–62). For AOD measurements, there were 3658; 3760; 3681; and 3083 triplets marked as valid for 440 nm, 500 nm, 675 nm, and 870 nm channels; respectively. For additional information on AOD quality-control results, see Text S1 in the ESI.† In Fig. 3, we provide histograms illustrating the distributions of filter-corrected PMS5003 PM2.5 concentrations, AOD at 500 nm, and PM2.5:AOD ratios for all data from the study. In Fig. S4,† we provide histograms for the remaining three AOD wavelengths. Across all CEAMS measurements, the mean (median) values of PM2.5 concentrations, AOD at 500 nm, and PM2.5:AOD ratios were 9.6 (7.2) μg m−3, 0.24 (0.12), and 60.1 (37.9) μg m−3, respectively. These average results are of similar order of magnitude to those in preliminary SPARTAN sites in North America.46
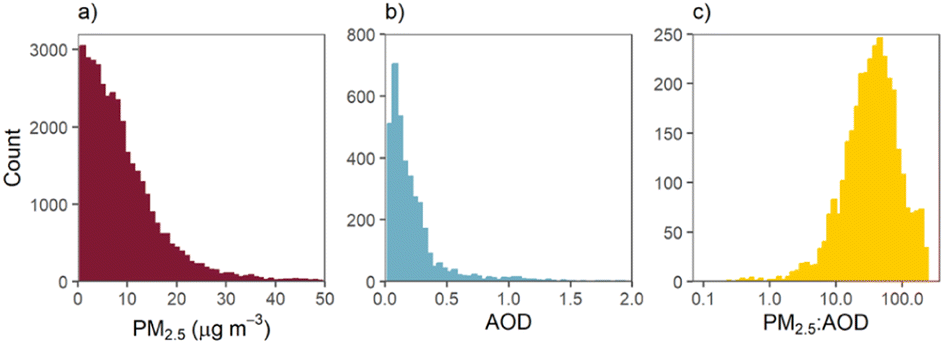 | ||
| Fig. 3 Histograms of (a) PM2.5, (b) AOD at 500 nm, and (c) PM2.5:AOD ratio for all valid measurements across all CEAMS sites for June–August 2021 deployment. Counts represent measurements collected at 20 minute intervals. | ||
:AOD ratio quantiles separated by HMS smoke status
| Region | HMS smoke designation | PM2.5 median (25%, 75%) (μg m−3) | AOD median (25%, 75%) (μg m−3) | PM2.5:AOD ratio median (25%, 75%) (μg m−3) |
|---|---|---|---|---|
| California | Not smoky | 7.1 (4.2, 10.5) | 0.098 (0.069, 0.15) | 67.2 (40.2, 109.6) |
| California | Smoky | 7.5 (4.0, 11.7) | 0.26 (0.15, 0.33) | 30.7 (16.4, 57.9) |
| Midwest | Not smoky | 3.47 (2.2, 6.3) | 0.16 (0.11, 0.19) | 25.4 (18.0, 37.7) |
| Midwest | Smoky | 7.21 (3.4, 11.3) | 0.30 (0.15, 0.56) | 24.2 (12.8, 42.1) |
| Mountain West | Not smoky | 4.23 (2.2, 7.6) | 0.11 (0.079, 0.17) | 33.5 (17.6, 53.8) |
| Mountain West | Smoky | 8.55 (4.9, 12.0) | 0.26 (0.18, 0.47) | 29.4 (19.1, 42.7) |
| Northeast | Not smoky | 4.1 (2.0, 9.5) | 0.18 (0.07, 0.28) | 24.7 (11.7, 47.9) |
| Northeast | Smoky | 10.2 (5.6, 16.0) | 0.51 (0.29, 0.85) | 20.3 (10.7, 38.7) |
3.2 In-field AERONET comparison
We analyze the bias and accuracy of crowdsourced AOD data from the relatively low-cost CEAMS instruments compared to reference AERONET monitors. In Fig. 4, we provide a scatter plot of CEAMS and AERONET AOD measurements by wavelength and HMS smoke designation. Paired measurements in Fig. 4 were located within 25 km and coincident within 180 seconds (example time series of two of these paired locations are shown in Fig. S5†).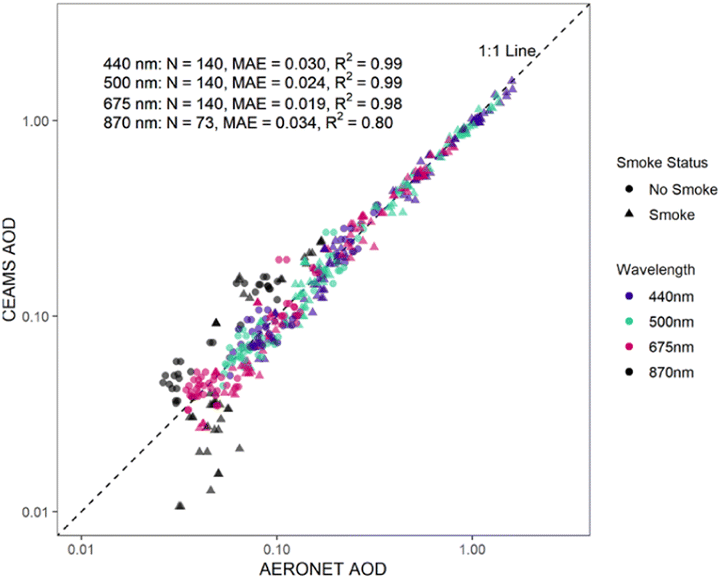 | ||
| Fig. 4 Scatter plot of CEAMS and AERONET AOD measurement pairs occurring within 180 seconds and 25 km of each other. N = number of paired triplicate measurement points; MAE = mean absolute error in dimensionless AOD units. Table with correlations for smoke and no smoke days is provided in Table S1.† | ||
AERONET AOD values ranged from 0.057 to 1.60 at 440 nm, 0.053 to 1.35 at 500 nm, 0.034 to 0.81 at 675 nm, and 0.026 to 0.17 at 870 nm. The mean absolute errors (mean normalized error, Fig. S6†) in AOD units for AMODv2s during the deployment were 0.030 at 440 nm (11%), 0.024 at 500 nm (11%), 0.019 at 675 nm (14%), and 0.034 at 870 nm (54%). These results are consistent with our prior study of AMODv2 accuracy,68 in which the mean absolute errors in AOD units were 0.04 at 440 nm, 0.06 at 500 nm, 0.03 at 675 nm, and 0.03 at 870 nm, calculated from a co-location (<1 km) with AERONET photometers in northern Colorado. These results indicate that crowdsourced AMODv2 measurements can achieve similar agreement with reference AERONET measurements across a broad range of AOD values.
We used monitors located within 25 km of each other for our analysis because we found that the agreement between CEAMS AOD and AERONET AOD varied as the distance between two monitors increased. In Fig. S5,† we illustrate how the mean normalized error varies inconsistently as the distance between the CEAMS and AERONET instruments increases. We observe relatively close agreement for measurements within 25 km of each other. Between 25 km and 37 km, the mean absolute percent error is elevated and then falls again between 37 km and 53 km (Fig. S6†). However, paired AMODv2 and AERONET AOD measurements from locations between 25 km and 37 km away from the nearest AERONET monitor were impacted by smoke, which may have larger gradients in AOD over these length scales. The relatively close agreement between AMODv2s and AERONET monitors separated by between 37 km and 53 km, of which measurements were primarily not smoke-impacted, indicates the presence of smoke can impact the agreement of AMODv2 and AERONET monitors within 53 km. For AMODv2 and AERONET monitors separated by more than 53 km, the mean absolute percent error was relatively high for all coincident measurements (Fig. S1†).
3.3 Regional variability of PM2.5 and AOD due to smoke
To assess the relationship between PM2.5 and AOD, we isolated measurements with valid filter-corrected PM2.5 and AOD at 500 nm, yielding a total of 3391 paired measurement data points. Each measurement included a region designation along with a binary HMS smoke designation (yes/no smoke). There were 1217 (655); 88 (194); 490 (412); and 158 (177) measurements with no smoke (yes smoke) according to HMS in California, the Midwest, the Mountain West, and the Northeast, respectively. In Fig. 5, we present box and whisker plots of PM2.5, AOD, and PM2.5:AOD ratio as functions of region and HMS smoke designation. We present summary statistics for CEAMS based on region and HMS smoke designation in Table 1.
 | ||
| Fig. 5 Box and whisker plots of PM2.5, AOD (500 nm), and PM2.5:AOD ratio (note logarithmic scale) separated by region and HMS smoke status. The box represents the 25th–75th percentile range with the line within the box denoting the median. The whiskers extend to 1.5 times the interquartile range, and data points outside of this range are represented as dots. Note that here we refer to the “California/West Coast” region as “California” because sites in Washington and Oregon did not collect valid AOD measurements. | ||
In the Midwest, Mountain West, and Northeast, median PM2.5 and AOD values were both higher on smoky days compared with non-smoky days during the summer of 2021 (Fig. 5). These simultaneous increases from smoke manifested in relatively stable PM2.5:AOD ratio values in those three regions regardless of the presence of smoke (Fig. 5 and Table 1). For sites in California, median AOD was elevated on days with an HMS smoke plume present compared to days without a smoke plume (Fig. 5). The magnitude of the median AOD increase was similar to the increase observed in the Midwest and Mountain West (Table 1). However, in California, PM2.5 concentrations were relatively unaffected by the presence of smoke, with the median concentration only 0.41 μg m−3 higher on smoky days compared to non-smoky days (as designated by the presence or absence of an HMS smoke polygon). Higher AOD with unaffected PM2.5 concentrations on smoky days in California manifested in the median PM2.5:AOD ratio being higher on non-smoky days compared to smoky days and suggested that smoke plumes were often lofted above the surface. Also of note, is that the non-smoky days in California had a higher ratio than all other regions on non-smoky days (67.2 μg m−3 compared to 24.7–33.5 μg m−3) and on smoky days (30.7 μg m−3 compared to 20.3–29.4 μg m−3). This could point to shallower boundary layers for our sampling locations in California that, coupled with potentially higher emission sources, may also explain the higher PM2.5 concentrations on non-smoky days compared to the other regions. As shown in,77 summertime planetary boundary layer heights along the California coast do appear to be shallower than many other regions across the CONUS. However, there is variability in the planetary boundary layer heights among different products with the greatest differences in the western US.77,78 In addition to differences in the boundary layer, there may be differences in aerosol composition and size due to the mixture of different emission sources at the sites in California.
In a decadal climatology (2008 to 2017) of the Northwest, Southwest, and Southeast regions of the United States, Bian et al.79 show that median PM2.5 concentrations were higher in the presence of wildfire smoke in all regions. Our results in the Midwest, Mountain West, and Northeast are consistent with this trend. However, in California, our results differ from climatological expectations for the Pacific West,79 with median PM2.5 concentrations remaining stable across smoky and non-smoky conditions. We found these anomalous results were driven primarily by four CEAMS locations in southern California (Fig. 1). In Fig. S6,† we present maps of fire locations and smoke plumes from the HMS product illustrating evolving smoke plumes in California for selected transition periods between smoky and non-smoky conditions. In Fig. 6, we present time series data from the four devices. In Southern California between July 5, 2021, and July 25, 2021, featuring transient wildfire smoke. A corresponding version of Fig. 6 for the CEAMS location in Sacramento, California, is provided in Fig. S7.†
 | ||
| Fig. 6 Time-series plots of PM2.5, AOD, Angstrom exponent, and PM2.5:AOD ratio from July 6, 2021, to July 24, 2021, from four CEAMS sites in Southern California, colored by HMS-derived smoke status. Measurements are from four AMODv2s (Fig. 1). Note that measurements on July 12, 2021, were from a single AMODv2 started early by the CEAMS participant. | ||
In the sampling periods of July 6 through July 10 and July 12 through 17, we observed similar week-to-week PM2.5 concentrations, despite the presence of wildfire smoke from July 12 through July 16 (Fig. 6). The presence of smoke was noted by HMS plumes (Fig. S8†) and corroborated by CALIPSO profiles (Fig. S9 and S10†). During these two sampling periods, the magnitude of AOD was affected by wildfire smoke, with AOD values increasing substantially during the smoky week relative to the non-smoky week (Fig. 6). In the July 20 through 24 sampling period, smoke impacted measurements were observed on July 23 (Fig. S8†). Between July 20 and July 24, PM2.5 concentrations in Southern California trended upward, without significantly deviating in magnitude from the previous two weeks. AOD reached its peak average magnitude on July 23 in the presence of wildfire smoke (Fig. 6). The site near Sacramento (not included in Southern California category) exhibited similar behavior during the first two weeks (Fig. S7†). However, on July 23 and 24, the site near Sacramento exhibited a prominent increase in both PM2.5 concentrations and AOD (Fig. S10†).
Prior studies using low-cost sensors in California during wildfire events have reported distinct increases in ground-level PM2.5 concentrations during wildfire smoke events.51,55 Using satellite-based measurements, Gupta et al.51 also observed a similar increase in AOD during the wildfire smoke event. We observed similar increases in both AOD and PM2.5 from our unit located near Sacramento on July 23 and 24 (Fig. S7†). However, in Southern California, only AOD was consistently higher on smoky days, with PM2.5 concentrations often remaining similar to levels on non-smoky days (Fig. 6). These results are consistent with smoke aloft during some wildfire smoke events specified by HMS. The two CALIPSO overpasses available during this time period (July 12 and 14, Fig. S9 and S10†) do suggest an elevated smoke layer. With smoke aloft, the AOD sensors would detect additional light diminution caused by suspended particles, where surface nephelometers would be minimally affected. In Fig. 7, we highlight potential smoke aloft in California by providing regional histograms for PM2.5:AOD ratios as a function of HMS smoke status.
 | ||
| Fig. 7 Regional density histograms for PM2.5:AOD ratio separated by HMS smoke status. Note that here we refer to the “California/West Coast” region as “California” because sites in Washington and Oregon did not collect valid AOD measurements. | ||
In the Midwest, Mountain West, and Northeast, distributions of PM2.5:AOD ratios were relatively consistent from non-smoky to smoky days (Fig. 7). In California, the distribution of PM2.5:AOD ratios on non-smoky days differed from other regions in our study. There were more instances of PM2.5:AOD ratios above 50 μg m−3 on non-smoky days in California than for all other regions and smoke statuses (Fig. 7). If the regional trend of similarity between smoky and non-smoky days held true in California, we would expect the distribution of PM2.5:AOD ratios on smoky days to skew high relative to other regions. However, we observed PM2.5:AOD ratios in California skewed relatively low on smoky days (Fig. 7). There could be some difference in the optical properties between fresh and aged smoke that may impact AOD differently near the source fires compared to downwind regions. However, like the daily results presented in Fig. 5, these results are consistent with smoke aloft events, where surface PM2.5 is relatively unaffected compared with AOD in the presence of elevated plumes. The presence of smoke aloft may introduce a positive bias to AOD-based PM2.5 quantification methods, including satellite-based instruments, if the vertical distribution of smoke is not accounted for.29,37 Our work highlights the utility of deploying co-located PM2.5 and AOD monitors during wildfire events to better distinguish lofted smoke from smoke at the surface.
3.4 Limitations
The primary limitation of this study was the relatively small number of sites in our national crowdsourced network. While we acquired substantially more PM2.5 and AOD measurements than in our previous local CEAMS deployment,59 our network was still not near the scale of networks of other low-cost air quality devices.49–54 While our instruments have more capabilities than a low-cost nephelometer (filter speciation capabilities in addition to multi-wavelength AOD), to better realize the advantages of low-cost monitors and crowdsourcing, future networks similar to CEAMS should feature more sites.In addition to a limited number of deployment sites, our results were also limited by AMODv2 failures due to damaged components and inconsistent operation. Eight of the sites (25%) did not contribute AOD measurements and were thus not included in the regional analyses. These instruments sustained damage to the AOD subsystem either during shipping or early in the deployment. The crowdsourcing aspect of this deployment also introduced unique difficulties, with 28.2% of premature shutdowns being caused by operator intervention. For example, two AMODv2s were stolen from participants' yards, prompting other participants to prematurely end some samples when they felt their AMODv2 was not in a secure location. Other reasons for early manual shutdowns included transportation of instruments mid-sample, uncertainty about inclement weather, and uncertainty about potentially malfunctioning components. These incomplete sampling attempts were discarded in the final analysis if they did not meet limit-of-detection thresholds for the filter samples. Irregularities in sampler operation have impacted prior studies involving crowdsourced data collection.66,67 In this study, however, we found that the increased degree of automation of the AMODv2 relative to the AMODv1 led to more reliable results from our participants.61 In future studies, we will continue to improve the usability and reliability of our sensors to reduce potential complications for participants.
For our in-field AERONET comparison, we are also limited by the number of participant sites that were within 25 km of an AERONET site. Prior validation of the AMOD AOD (e.g., ref. 61, 67 and 68) was all completed in Colorado. Thus, our analysis here, which included sites throughout the CONUS, does suggest that the AMOD provides valid AOD values without any regional bias. However, extensive validation of the coincident PM2.5, AOD, and PM2.5:AOD ratio from the AMOD has not been completed outside Colorado. Thus, future work could include these comparisons, which could also allow for further exploration of the impact of different emission sources and particle types.
4 Conclusions
Recent studies have leveraged crowdsourced networks of low-cost sensors toward a greater understanding of ambient air quality.51,55,61,66,80 In this study, we build upon these efforts by establishing a nationwide crowdsourced network of integrated PM2.5 and AOD monitors. AMODv2s performed similarly in our crowdsourced field campaign compared with laboratory validation experiments with respect to runtime reliability and AOD quality control.68 Compared with AERONET AOD, CEAMS network measurements had mean absolute errors of 0.030 at 440 nm, 0.024 at 500 nm, 0.019 at 675 nm, and 0.034 at 870 nm for measurements co-located within 25 km and coincident within 180 seconds. The magnitude of the agreement was similar to that of our prior instrument validation study co-locating (<500 m) AMODv2s with an AERONET monitor in northern Colorado.68Results from our network indicated that median PM2.5:AOD ratios varied regionally. Network sites in California had the highest PM2.5:AOD ratios on non-smoky days (median of 67.2 μg m−3) compared to the other regions (medians of 24.7–33.5 μg m−3). This could be due to differences in boundary layer heights, emission sources, or particle types. Future work should further explore drivers of the high ratios noted in California on non-smoky days as this has implications for air quality and exposure estimates. Although there were regional differences in PM2.5:AOD ratios on smoky and non-smoky days, our results indicate that ratios were relatively unimpacted by the presence or absence of smoke at sites in the Midwest, Mountain West, and Northeast regions of the United States, suggesting that climatological PM2.5:AOD ratios could be used to translate satellite AOD to surface concentrations in these downwind smoke regions. However, median PM2.5:AOD ratio was higher on smoke-free days in California relative to days with smoke present. In California, median PM2.5 concentration trends on smoky vs. non-smoky days differed from climatological expectations.79 These differences could be partially explained based on prior work, which found that an appreciable fraction of smoke plumes in California are injected into the free troposphere30 or could be due to changes in local meteorology on smoky days. Shifting wind patterns could alter not only the smoke concentration, but also the background concentration. Future work should further investigate the role of local meteorology on altering the composition and vertical distribution of pollutants during smoke events. Regardless, the results suggests that in source regions, a climatological PM2.5:AOD ratio could overestimate surface concentrations. Thus, our results from the Midwest, Mountain West, and Northeast regions provide empirical support for source-independent conversions from AOD to ground-level PM2.5 when smoke is not aloft; while our California sites suggest that smoke aloft can introduce source-dependent disparities, which would preclude the use of source-independent conversions of satellite AOD to ground-level PM2.5 concentrations. Real-time tools to evaluate vertical smoke distributions, including networks of low-cost AOD and PM2.5 sensors, could provide information regarding the uncertainty of AOD to ground-level PM2.5 conversions and provide information to better interpret satellite observations during smoke events.
We used data collected by participants to identify probable instances of smoke aloft (corroborated by satellite observations), which low-cost PM2.5 monitors alone could fail to properly characterize. Wildfire smoke events are often an impetus for the expansion of crowd-sourced, low-cost monitoring networks.81,82 As wildfire smoke events increase and networks of crowdsourced, low-cost PM2.5 monitors expand, further work in expanding access to co-located, low-cost AOD monitors could strengthen these networks' ability to monitor evolving smoke events and better inform participants and the general public about their local air quality.
Data availability
AMOD datasets collected for this campaign are available through Dryad: https://doi.org/10.5061/dryad.j9kd51chk.Author contributions
JV, JRP, SJ, ML, and BF designed the study and concept for this field campaign. EAW, CQ, CL, DDML, and JV designed the AMODv2. CQ designed the mobile application with design input from JV, EAW, BF, ZR, and ML. DH built the website with design input from JV, BF, ML, ZR, JRP, and CQ and implementation help from CL and CQ. EAW, CL, JM, MC, ZR, BF, and JV assembled AMODv2 instruments. JM and CL conducted the filter analysis. EAW, CL, and MC repaired damaged AMODv2 instruments. EAW, BF, MC, and ZR calibrated instruments. BF, ML, ZR, and JV coordinated the student-led network. BF, ZR, and EAW led participant communication and troubleshooting. EAW led the paper with BF, JRP, SJ, and JV; and all co-authors contributed to interpretation of results and paper editing.Conflicts of interest
There are no conflicts to declare.Acknowledgements
The authors wish to thank Todd Hochwitz (Zebulon Solutions LLC, Longmont, CO, USA) and Caroline Wendt for their contributions to this work. We thank Andeas Beyersdorf (California State University, Santa Barbara), Roya Behreini (University of California, Riverside), Emily Schaller (Heising-Simons Foundation), Melissa Yang (NASA), and Barry Lefer (NASA) for coordinating the SARP program and our collaboration therewith. We thank the students of SARP for collecting the data for this work. This research was supported by NASA grants 80NSSC18M0120 and 80NSSC21K0429.References
- M. Brauer, G. Freedman, J. Frostad, A. van Donkelaar, R. V. Martin, F. Dentener, R. van Dingenen, K. Estep, H. Amini, J. S. Apte, K. Balakrishnan, L. Barregard, D. Broday, V. Feigin, S. Ghosh, P. K. Hopke, L. D. Knibbs, Y. Kokubo, Y. Liu, S. Ma, L. Morawska, J. L. T. Sangrador, G. Shaddick, H. R. Anderson, T. Vos, M. H. Forouzanfar, R. T. Burnett and A. Cohen, Ambient Air Pollution Exposure Estimation for the Global Burden of Disease 2013, Environ. Sci. Technol., 2016, 50(1), 79–88 CrossRef CAS.
- M. H. Forouzanfar, L. Alexander and H. R. Anderson, et al., Global, regional, and national comparative risk assessment of 79 behavioural, environmental and occupational, and metabolic risks or clusters of risks in 188 countries, 1990–2013: a systematic analysis for the Global Burden of Disease Study 2013, Lancet, 2015, 386, 2287–2323 CrossRef.
- K. Vohra, A. Vodonos, J. Schwartz, E. A. Marais, M. P. Sulprizio and L. J. Mickley, Global mortality from outdoor fine particle pollution generated by fossil fuel combustion: Results from GEOS-Chem, Environ. Res., 2021, 195, 110754 CrossRef CAS PubMed.
- R. Fuller, P. J. Landrigan, K. Balakrishnan, G. Bathan, S. Bose-O'Reilly, M. Brauer, J. Caravanos, T. Chiles, A. Cohen, L. Corra, M. Cropper, G. Ferraro, J. Hanna, D. Hanrahan, H. Hu, D. Hunter, G. Janata, R. Kupka, B. Lanphear, M. Lichtveld, K. Martin, A. Mustapha, E. Sanchez-Triana, K. Sandilya, L. Schaefli, J. Shaw, J. Seddon, W. Suk, M. M. Téllez-Rojo and C. Yan, Pollution and health: a progress update, Lancet Planet. Health, 2022, 6, e535–e547 CrossRef.
- C. A. Pope 3rd and D. W. Dockery, Health effects of fine particulate air pollution: lines that connect, J. Air Waste Manage. Assoc., 2006, 56, 709–742 CrossRef PubMed.
- N. a. H. Janssen, P. Fischer, M. Marra, C. Ameling and F. R. Cassee, Short-term effects of PM2.5, PM10 and PM2.5-10 on daily mortality in The Netherlands, Sci. Total Environ., 2013, 463–464, 20–26 CrossRef CAS PubMed.
- S. Feng, D. Gao, F. Liao, F. Zhou and X. Wang, The health effects of ambient PM2.5 and potential mechanisms, Ecotoxicol. Environ. Saf., 2016, 128, 67–74 CrossRef CAS PubMed.
- I. Kim, K. Lee, S. Lee and S. D. Kim, Characteristics and health effects of PM2.5 emissions from various sources in Gwangju, South Korea, Sci. Total Environ., 2019, 696, 133890 CrossRef CAS.
- G. Myhre, D. Shindell, F.-M. Bréon, W. Collins, J. Fuglestvedt, J. Huang, D. Koch, J.-F. Lamarque, D. Lee, B. Mendoza, T. Nakajima, A. Robock, G. Stephens, T. Takemura and H. Zhang, in Climate Change 2013: The Physical Science Basis. Contribution of Working Group I to the Fifth Assessment Report of the Intergovernmental Panel on Climate Change, ed. T. F. Stocker, D. Qin, G.-K. Plattner, M. Tignor, S. K. Allen, J. Doschung, A. Nauels, Y. Xia, V. Bex and P. M. Midgley, Cambridge University Press, Cambridge, UK, 2013, pp. 659–740 Search PubMed.
- J. C. Liu, G. Pereira, S. A. Uhl, M. A. Bravo and M. L. Bell, A systematic review of the physical health impacts from non-occupational exposure to wildfire smoke, Environ. Res., 2015, 136, 120–132 CrossRef CAS.
- C. E. Reid, M. Brauer, F. H. Johnston, M. Jerrett, J. R. Balmes and C. T. Elliott, Critical Review of Health Impacts of Wildfire Smoke Exposure, Environ. Health Perspect., 2016, 124(9), 1334–1343 CrossRef PubMed.
- W. E. Cascio, Wildland fire smoke and human health, Sci. Total Environ., 2018, 624, 586–595 CrossRef CAS PubMed.
- B. Ford, M. Val Martin, S. E. Zelasky, E. V. Fischer, S. C. Anenberg, C. L. Heald and J. R. Pierce, Future Fire Impacts on Smoke Concentrations, Visibility, and Health in the Contiguous United States, GeoHealth, 2018, 2, 229–247 CrossRef CAS PubMed.
- K. O'Dell, K. Bilsback, B. Ford, S. E. Martenies, S. Magzamen, E. V. Fischer and J. R. Pierce, Estimated Mortality and Morbidity Attributable to Smoke Plumes in the United States: Not Just a Western US Problem, GeoHealth, 2021, 5, e2021GH000457 CrossRef.
- F. H. Johnston, S. B. Henderson, Y. Chen, J. T. Randerson, M. Marlier, R. S. DeFries, P. Kinney, D. M. J. S. Bowman and M. Brauer, Estimated Global Mortality Attributable to Smoke from Landscape Fires, Environ. Health Perspect., 2012, 120, 695–701 CrossRef.
- S. B. Henderson, M. Brauer, Y. C. MacNab and S. M. Kennedy, Three measures of forest fire smoke exposure and their associations with respiratory and cardiovascular health outcomes in a population-based cohort, Environ. Health Perspect., 2011, 119, 1266 CrossRef CAS.
- R. W. Gan, B. Ford, W. Lassman, G. Pfister, A. Vaidyanathan, E. Fischer, J. Volckens, J. R. Pierce and S. Magzamen, Comparison of wildfire smoke estimation methods and associations with cardiopulmonary-related hospital admissions, GeoHealth, 2017, 1, 122–136 CrossRef PubMed.
- N. B. Arriagada, A. J. Palmer, D. M. Bowman, G. G. Morgan, B. B. Jalaludin and F. H. Johnston, Unprecedented smoke-related health burden associated with the 2019–20 bushfires in eastern Australia, Med. J. Aust., 2020, 213(6), 282–283 CrossRef.
- J. E. Neumann, M. Amend, S. Anenberg, P. L. Kinney, M. Sarofim, J. Martinich, J. Lukens, J.-W. Xu and H. Roman, Estimating PM2.5-related premature mortality and morbidity associated with future wildfire emissions in the western US, Environ. Res. Lett., 2021, 16, 035019 CrossRef CAS.
- N. Fann, B. Alman, R. A. Broome, G. G. Morgan, F. H. Johnston, G. Pouliot and A. G. Rappold, The health impacts and economic value of wildland fire episodes in the U.S.: 2008–2012, Sci. Total Environ., 2018, 610–611, 802–809 CrossRef CAS PubMed.
- C. E. Reid, M. Jerrett, M. L. Petersen, G. G. Pfister, P. E. Morefield, I. B. Tager, S. M. Raffuse and J. R. Balmes, Spatiotemporal Prediction of Fine Particulate Matter During the 2008 Northern California Wildfires Using Machine Learning, Environ. Sci. Technol., 2015, 49, 3887–3896 CrossRef CAS PubMed.
- M. M. Kelp, S. Lin, J. N. Kutz and L. J. Mickley, A new approach for determining optimal placement of PM2.5 air quality sensors: case study for the contiguous United States, Environ. Res. Lett., 2022, 17, 034034 CrossRef.
- C. Lee, Impacts of multi-scale urban form on PM2.5 concentrations using continuous surface estimates with high-resolution in U.S. metropolitan areas, Landsc. Urban Plan., 2020, 204, 103935 CrossRef.
- A. van Donkelaar, R. V. Martin, M. Brauer, N. C. Hsu, R. A. Kahn, R. C. Levy, A. Lyapustin, A. M. Sayer and D. M. Winker, Global Estimates of Fine Particulate Matter using a Combined Geophysical-Statistical Method with Information from Satellites, Models, and Monitors, Environ. Sci. Technol., 2016, 50, 3762–3772 CrossRef CAS PubMed.
- M. S. Hammer, A. van Donkelaar, C. Li, A. Lyapustin, A. M. Sayer, N. C. Hsu, R. C. Levy, M. J. Garay, O. V. Kalashnikova, R. A. Kahn, M. Brauer, J. S. Apte, D. K. Henze, L. Zhang, Q. Zhang, B. Ford, J. R. Pierce and R. V. Martin, Global Estimates and Long-Term Trends of Fine Particulate Matter Concentrations (1998–2018), Environ. Sci. Technol., 2020, 54, 7879–7890 CrossRef CAS PubMed.
- W. Lassman, B. Ford, R. W. Gan, G. Pfister, S. Magzamen, E. V. Fischer and J. R. Pierce, Spatial and Temporal Estimates of Population Exposure to Wildfire Smoke during the Washington State 2012 Wildfire Season Using Blended Model, Satellite, and In Situ Data, GeoHealth, 2017, 1(3), 106–121 CrossRef PubMed.
- B. Ford, M. Burke, W. Lassman, G. Pfister and J. R. Pierce, Status update: is smoke on your mind? Using social media to assess smoke exposure, Atmos. Chem. Phys., 2017, 17, 7541–7554 CrossRef CAS.
- K. O'Dell, B. Ford, E. V. Fischer and J. R. Pierce, Contribution of Wildland-Fire Smoke to US PM2.5 and Its Influence on Recent Trends, Environ. Sci. Technol., 2019, 53, 1797–1804 CrossRef.
- S. E. Cleland, J. J. West, Y. Jia, S. Reid, S. Raffuse, S. O'Neill and M. L. Serre, Estimating Wildfire Smoke Concentrations during the October 2017 California Fires through BME Space/Time Data Fusion of Observed, Modeled, and Satellite-Derived PM2.5, Environ. Sci. Technol., 2020, 54, 13439–13447 CrossRef CAS PubMed.
- M. Cheeseman, B. Ford, J. Volckens, A. Lyapustin and J. R. Pierce, The Relationship Between MAIAC Smoke Plume Heights and Surface PM, Geophys. Res. Lett., 2020, 47, e2020GL088949 CrossRef.
- V. V. Salomonson, W. L. Barnes, P. W. Maymon, H. E. Montgomery and H. Ostrow, MODIS: advanced facility instrument for studies of the Earth as a system, IEEE Trans. Geosci. Remote Sens., 1989, 27, 145–153 CrossRef.
- D. J. Diner, J. C. Beckert, T. H. Reilly, C. J. Bruegge, J. E. Conel, R. A. Kahn, J. V. Martonchik, T. P. Ackerman, R. Davies, S. A. W. Gerstl, H. R. Gordon, J. P. Muller, R. B. Myneni, P. J. Sellers, B. Pinty and M. M. Verstraete, Multi-angle Imaging SpectroRadiometer (MISR) - Instrument description and experiment overview, IEEE Trans. Geosci. Remote Sens., 1998, 36, 1072–1087 CrossRef.
- H. Zhang and S. Kondragunta, Daily and Hourly Surface PM2.5 Estimation From Satellite AOD, Earth Space Sci., 2021, 8, e2020EA001599 CrossRef.
- Y. Liu, J. A. Sarnat, V. Kilaru, D. J. Jacob and P. Koutrakis, Estimating ground-level PM2.5 in the eastern United States using satellite remote sensing, Environ. Sci. Technol., 2005, 39, 3269–3278 CrossRef CAS.
- A. van Donkelaar, R. V. Martin and R. J. Park, Estimating ground-level PM2.5 using aerosol optical depth determined from satellite remote sensing, J. Geophys. Res.: Atmos., 2006, 111, D21201 CrossRef.
- A. van Donkelaar, R. Martin, C. Verduzco, M. Brauer, R. Kahn, R. Levy and P. Villeneuve, A Hybrid Approach for Predicting PM2.5 Exposure: van Donkelaar et al. Respond, Environ. Health Perspect., 2010, 118, a426 Search PubMed.
- A. van Donkelaar, R. V. Martin, A. N. Pasch, J. J. Szykman, L. Zhang, Y. X. Wang and D. Chen, Improving the accuracy of daily satellite-derived ground-level fine aerosol concentration estimates for North America, Environ. Sci. Technol., 2012, 46, 11971–11978 CrossRef CAS.
- B. Ford and C. L. Heald, Exploring the uncertainty associated with satellite-based estimates of premature mortality due to exposure to fine particulate matter, Atmos. Chem. Phys., 2016, 16, 3499–3523 CrossRef CAS PubMed.
- X. Jin, A. M. Fiore, G. Curci, A. Lyapustin, K. Civerolo, M. Ku, A. van Donkelaar and R. V. Martin, Assessing uncertainties of a geophysical approach to estimate surface fine particulate matter distributions from satellite-observed aerosol optical depth, Atmos. Chem. Phys., 2019, 19, 295–313 CrossRef CAS.
- A. van Donkelaar, R. V. Martin, R. J. D. Spurr, E. Drury, L. A. Remer, R. C. Levy and J. Wang, Optimal estimation for global ground-level fine particulate matter concentrations, J. Geophys. Res.: Atmos., 2013, 118, 5621–5636 CrossRef.
- A. M. Sayer, N. C. Hsu, C. Bettenhausen, M.-J. Jeong, B. N. Holben and J. Zhang, Global and regional evaluation of over-land spectral aerosol optical depth retrievals from SeaWiFS, Atmos. Meas. Tech., 2012, 5, 1761–1778 CrossRef.
- B. N. Holben, T. F. Eck, I. Slutsker, D. Tanré, J. P. Buis, A. Setzer, E. Vermote, J. A. Reagan, Y. J. Kaufman, T. Nakajima, F. Lavenu, I. Jankowiak and A. Smirnov, AERONET—A Federated Instrument Network and Data Archive for Aerosol Characterization, Remote Sens. Environ., 1998, 66, 1–16 CrossRef.
- J. Volckens, C. Quinn, D. Leith, J. Mehaffy, C. S. Henry and D. Miller-Lionberg, Development and Evaluation of an Ultrasonic Personal Aerosol Sampler (UPAS), Indoor Air, 2017, 27, 409–416 CrossRef CAS PubMed.
- S. Kelleher, C. Quinn, D. Miller-Lionberg and J. Volckens, A low-cost particulate matter (PM2.5) monitor for wildland fire smoke, Atmos. Meas. Tech., 2018, 11, 1087–1097 CrossRef.
- J. Tryner, C. L'Orange, J. Mehaffy, D. Miller-Lionberg, J. C. Hofstetter, A. Wilson and J. Volckens, Laboratory evaluation of low-cost PurpleAir PM monitors and in-field correction using co-located portable filter samplers, Atmos. Environ., 2020, 220, 117067 CrossRef CAS.
- G. Snider, C. L. Weagle, R. V. Martin, A. van Donkelaar, K. Conrad, D. Cunningham, C. Gordon, M. Zwicker, C. Akoshile, P. Artaxo, N. X. Anh, J. Brook, J. Dong, R. M. Garland, R. Greenwald, D. Griffith, K. He, B. N. Holben, R. Kahn, I. Koren, N. Lagrosas, P. Lestari, Z. Ma, J. Vanderlei Martins, E. J. Quel, Y. Rudich, A. Salam, S. N. Tripathi, C. Yu, Q. Zhang, Y. Zhang, M. Brauer, A. Cohen, M. D. Gibson and Y. Liu, SPARTAN: a global network to evaluate and enhance satellite-based estimates of ground-level particulate matter for global health applications, Atmos. Meas. Tech. Discuss., 2015, 7, 7569–7611 Search PubMed.
- M. Green, S. Kondragunta, P. Ciren and C. Xu, Comparison of GOES and MODIS Aerosol Optical Depth (AOD) to Aerosol Robotic Network (AERONET) AOD and IMPROVE PM2.5 Mass at Bondville, Illinois, J. Air Waste Manage. Assoc., 2009, 59, 1082–1091 CrossRef CAS PubMed.
- M. J. Garay, O. V. Kalashnikova and M. A. Bull, Development and assessment of a higher-spatial-resolution (4.4 km) MISR aerosol optical depth product using AERONET-DRAGON data, Atmos. Chem. Phys., 2017, 17, 5095–5106 CrossRef CAS.
- B. N. Holben, J. Kim, I. Sano, S. Mukai, T. F. Eck, D. M. Giles, J. S. Schafer, A. Sinyuk, I. Slutsker, A. Smirnov, M. Sorokin, B. E. Anderson, H. Che, M. Choi, J. H. Crawford, R. A. Ferrare, M. J. Garay, U. Jeong, M. Kim, W. Kim, N. Knox, Z. Li, H. S. Lim, Y. Liu, H. Maring, M. Nakata, K. E. Pickering, S. Piketh, J. Redemann, J. S. Reid, S. Salinas, S. Seo, F. Tan, S. N. Tripathi, O. B. Toon and Q. Xiao, An overview of mesoscale aerosol processes, comparisons, and validation studies from DRAGON networks, Atmos. Chem. Phys., 2018, 18, 655–671 CrossRef CAS.
- M. Sorek-Hamer, M. Franklin, K. Chau, M. Garay and O. Kalashnikova, Spatiotemporal Characteristics of the Association between AOD and PM over the California Central Valley, Remote Sens., 2020, 12, 685 CrossRef.
- P. Gupta, P. Doraiswamy, R. Levy, O. Pikelnaya, J. Maibach, B. Feenstra, A. Polidori, F. Kiros and K. C. Mills, Impact of California Fires on Local and Regional Air Quality: The Role of a Low-Cost Sensor Network and Satellite Observations, GeoHealth, 2018, 2, 172–181 CrossRef CAS PubMed.
- C. Lin, L. D. Labzovskii, H. W. Leung Mak, J. C. H. Fung, A. K. H. Lau, S. T. Kenea, M. Bilal, J. D. Vande Hey, X. Lu and J. Ma, Observation of PM2.5 using a combination of satellite remote sensing and low-cost sensor network in Siberian urban areas with limited reference monitoring, Atmos. Environ., 2020, 227, 117410 CrossRef CAS.
- J. Li, H. Zhang, C.-Y. Chao, C.-H. Chien, C.-Y. Wu, C. H. Luo, L.-J. Chen and P. Biswas, Integrating low-cost air quality sensor networks with fixed and satellite monitoring systems to study ground-level PM2.5, Atmos. Environ., 2020, 223, 117293 CrossRef CAS.
- M. Badura, I. Sówka, P. Szymański and P. Batog, Assessing the usefulness of dense sensor network for PM2.5 monitoring on an academic campus area, Sci. Total Environ., 2020, 722, 137867 CrossRef CAS.
- Y. Lu, G. Giuliano and R. Habre, Estimating hourly PM2.5 concentrations at the neighborhood scale using a low-cost air sensor network: A Los Angeles case study, Environ. Res., 2021, 195, 110653 CrossRef CAS.
- E. Chadwick, K. Le, Z. Pei, T. Sayahi, C. Rapp, A. E. Butterfield and K. E. Kelly, Technical note: Understanding the effect of COVID-19 on particle pollution using a low-cost sensor network, J. Aerosol Sci., 2021, 155, 105766 CrossRef CAS.
- K. E. Kelly, J. Whitaker, A. Petty, C. Widmer, A. Dybwad, D. Sleeth, R. Martin and A. Butterfield, Ambient and laboratory evaluation of a low-cost particulate matter sensor, Environ. Pollut., 2017, 221, 491–500 CrossRef CAS.
- M. Levy Zamora, F. Xiong, D. Gentner, B. Kerkez, J. Kohrman-Glaser and K. Koehler, Field and Laboratory Evaluations of the Low-Cost Plantower Particulate Matter Sensor, Environ. Sci. Technol., 2019, 53, 838–849 CrossRef CAS.
- T. Zheng, M. H. Bergin, K. K. Johnson, S. N. Tripathi, S. Shirodkar, M. S. Landis, R. Sutaria and D. E. Carlson, Field evaluation of low-cost particulate matter sensors in high- and low-concentration environments, Atmos. Meas. Tech., 2018, 11, 4823–4846 CrossRef CAS.
- T. Sayahi, A. Butterfield and K. E. Kelly, Long-term field evaluation of the Plantower PMS low-cost particulate matter sensors, Environ. Pollut., 2019, 245, 932–940 CrossRef CAS PubMed.
- B. Ford, J. R. Pierce, E. Wendt, M. Long, S. Jathar, J. Mehaffy, J. Tryner, C. Quinn, L. van Zyl, C. L'Orange, D. Miller-Lionberg and J. Volckens, A low-cost monitor for measurement of fine particulate matter and aerosol optical depth – Part 2: Citizen science pilot campaign in northern Colorado, Atmos. Meas. Tech. Discuss., 2019, 1–20 Search PubMed.
- K. K. Barkjohn, B. Gantt and A. L. Clements, Development and application of a United States-wide correction for PM2.5 data collected with the PurpleAir sensor, Atmos. Meas. Tech., 2021, 14, 4617–4637 CrossRef PubMed.
- K. K. Barkjohn, A. L. Holder, S. G. Frederick and A. L. Clements, Correction and Accuracy of PurpleAir PM2.5 Measurements for Extreme Wildfire Smoke, Sensors, 2022, 22, 9669 CrossRef PubMed.
- L. Wallace, J. Bi, W. R. Ott, J. Sarnat and Y. Liu, Calibration of low-cost PurpleAir outdoor monitors using an improved method of calculating PM2.5, Atmos. Environ., 2021, 256, 118432 CrossRef CAS.
- L. Wallace and T. Zhao, Spatial Variation of PM2.5 Indoors and Outdoors: Results from 261 Regulatory Monitors Compared to 14,000 Low-Cost Monitors in Three Western States over 4.7 Years, Sensors, 2023, 23, 4387 CrossRef PubMed.
- K. F. Boersma and J. P. de Vroom, Validation of MODIS aerosol observations over the Netherlands with GLOBE student measurements, J. Geophys. Res.: Atmos., 2006, 111, D20311 CrossRef.
- E. Wendt, C. W. Quinn, D. D. Miller-Lionberg, J. Tryner, C. L'Orange, B. Ford, A. P. Yalin, J. R. Pierce, S. Jathar and J. Volckens, A Low-Cost Monitor for Simultaneous Measurement of Fine Particulate Matter and Aerosol Optical Depth, Environ. Sci. Technol. Search PubMed.
- E. A. Wendt, C. Quinn, C. L'Orange, D. D. Miller-Lionberg, B. Ford, J. R. Pierce, J. Mehaffy, M. Cheeseman, S. H. Jathar, D. H. Hagan, Z. Rosen, M. Long and J. Volckens, A low-cost monitor for simultaneous measurement of fine particulate matter and aerosol optical depth – Part 3: automation and design improvements, Atmos. Meas. Tech., 2021, 14, 6023–6038 CrossRef CAS.
- L. Wallace, Cracking the code—matching a proprietary algorithm for a low-cost sensor measuring PM1 and PM2.5, Sci. Total Environ., 2023, 893, 164874 CrossRef CAS.
- A. Smirnov, B. N. Holben, T. F. Eck, O. Dubovik and I. Slutsker, Cloud-Screening and Quality Control Algorithms for the AERONET Database, Remote Sens. Environ., 2000, 73, 337–349 CrossRef.
- D. M. Giles, A. Sinyuk, M. G. Sorokin, J. S. Schafer, A. Smirnov, I. Slutsker, T. F. Eck, B. N. Holben, J. R. Lewis, J. R. Campbell, E. J. Welton, S. V. Korkin and A. I. Lyapustin, Advancements in the Aerosol Robotic Network (AERONET) Version 3 database – automated near-real-time quality control algorithm with improved cloud screening for Sun photometer aerosol optical depth (AOD) measurements, Atmos. Meas. Tech., 2019, 12, 169–209 CrossRef CAS.
- R. E. Arku, A. Birch, M. Shupler, S. Yusuf, P. Hystad and M. Brauer, Characterizing exposure to household air pollution within the Prospective Urban Rural Epidemiology (PURE) study, Environ. Int., 2018, 114, 307–317 CrossRef CAS PubMed.
- A. Pillarisetti, E. Carter, S. Rajkumar, B. N. Young, M. L. Benka-Coker, J. L. Peel, M. Johnson and M. L. Clark, Measuring personal exposure to fine particulate matter (PM2.5) among rural Honduran women: A field evaluation of the Ultrasonic Personal Aerosol Sampler (UPAS), Environ. Int., 2019, 123, 50–53 CrossRef CAS PubMed.
- F. M. J. Bulot, S. J. Johnston, P. J. Basford, N. H. C. Easton, M. Apetroaie-Cristea, G. L. Foster, A. K. R. Morris, S. J. Cox and M. Loxham, Long-term field comparison of multiple low-cost particulate matter sensors in an outdoor urban environment, Sci. Rep., 2019, 9, 1–13 CrossRef CAS PubMed.
- M. G. Ruminski, S. Kondragunta, R. R. Draxler and J. Zeng, Recent changes to the hazard mapping system, 15th International Emission Inventory Conference, New Orleans, LA, 2006 Search PubMed.
- S. J. Brey, M. Ruminski, S. A. Atwood and E. V. Fischer, Connecting smoke plumes to sources using Hazard Mapping System (HMS) smoke and fire location data over North America, Atmos. Chem. Phys., 2018, 18, 1745–1761 CrossRef CAS.
- Z. Ayazpour, S. Tao, D. Li, A. J. Scarino, R. E. Kuehn and K. Sun, Estimates of the spatially complete, observational-data-driven planetary boundary layer height over the contiguous United States, Atmos. Meas. Tech., 2023, 16, 563–580 CrossRef CAS.
- E. L. McGrath-Spangler and A. S. Denning, Estimates of North American summertime planetary boundary layer depths derived from space-borne lidar, J. Geophys. Res.: Atmos., 2012, 117, D15 CrossRef.
- Q. Bian, B. Ford, J. R. Pierce and S. M. Kreidenweis, A Decadal Climatology of Chemical, Physical, and Optical Properties of Ambient Smoke in the Western and Southeastern United States, J. Geophys. Res.: Atmos., 2020, 125, e2019JD031372 CrossRef CAS.
- K. O'Dell, B. Ford, J. Burkhardt, S. Magzamen, S. C. Anenberg, J. Bayham, E. V. Fischer and J. R. Pierce, Outside in: the relationship between indoor and outdoor particulate air quality during wildfire smoke events in western US cities, Environ. Res.: Health, 2022, 1, 015003 Search PubMed.
- B. Krebs, J. Burney, J. G. Zivin and M. Neidell, Using Crowd-Sourced Data to Assess the Temporal and Spatial Relationship between Indoor and Outdoor Particulate Matter, Environ. Sci. Technol., 2021, 55, 6107–6115 CrossRef CAS PubMed.
- W. W. Delp and B. C. Singer, Wildfire Smoke Adjustment Factors for Low-Cost and Professional PM2.5 Monitors with Optical Sensors, Sensors, 2020, 20, 3683 CrossRef PubMed.
Footnotes |
| † Electronic supplementary information (ESI) available. See DOI: https://doi.org/10.1039/d3ea00086a |
| ‡ Present address: I. M. Systems Group (NOAA NESDIS), College Park, MD, USA. |
| This journal is © The Royal Society of Chemistry 2023 |