Pt38 as a promising ethanol catalyst: a first principles study
Vagner Alexandre
Rigo
 *a and
Francesca
Baletto
 bc
bc
aDepartment of Natural Sciences, Universidade Tecnológica Federal do Paraná (UTFPR), Cornélio Procópio, 86300-000, Brazil. E-mail: vagnerrigo@utfpr.edu.br; Tel: +55 43 3133 3917
bPhysics Department, University of Milan, Via Celoria 16, 20133, Italy
cPhysics Department, King's College London, Strand WC2R 2LS, UK
First published on 9th January 2023
Abstract
This first-principles study predicts Pt38 nanoparticles as a catalyst for ethanol reactions. Starting from the adsorption properties, we shed light on the effectiveness of Pt-based nanoclusters as ethanol catalysts. First, the ethanol adsorption on Pt38 shows that the most stable site positions the molecule with the oxygen anchored on top of an edge, whereas CH3 is oriented towards the facet and the molecule remains in trans-symmetry. The ethanol–oxygen adsorbed on top of a facet Pt-atom offers the least stable configuration and the longer Pt–O distance (2.318 Å), while the shorter Pt–O distance (2.237 Å) is found when ethanol is on top of an edge site and the molecule is vertically oriented with Gauche symmetry. A shorter Pt–O distance correlates with higher radial breathing of the nanoparticle after ethanol adsorption. Atomic charge redistribution is calculated on all the considered systems and cases. In any event, we show that the Pt-anchor receives a charge, whilst oxygen–ethanol donates electrons. Orbital analysis shows that Pt-anchors and ethanol–oxygen atoms primarily exchange p-charge. Energy barriers associated with the ethanol bond cleavage show that the C–C bond break is slightly more favourable on Pt38 than on an extended Pt(111). In addition, we find that the cleavage of the hydroxyl O–H ethanol bond shows a higher energy barrier while the removal of an H-atom from the CH3 group is easier. These three facts indicate that the Pt38 nanoparticle enhances ethanol catalysis and hence is a good candidate for ethanol-based fuel cells.
1 Introduction
Global warming1,2 and the establishment of environmental targets2 have driven attention towards newer and cleaner energy sources. In this regard, the progressive adoption of renewable energy sources could help reduce CO2 emissions and help manage environmental pollution, but some practical issues remain, such as scale, cost, and efficiency associated with clean energy sources.3–6Ethanol, a plant-based fuel, represents a renewable alternative to replace fossil fuels. It is non-toxic and can be easily obtained from organic materials.6,7 A simple but central physical property of ethanol is that it remains liquid at ambient temperatures; so, the substitution of fossil fuels with ethanol could be implemented with minimal modifications to today's distribution networks.6 Additionally, the global prices of ethanol as a commodity have been gradually reduced over the past decades, achieving values that are competitive if not lower than gasoline.7
The conversion of ethanol into electricity represents a step forward in the worldwide fight to reduce CO2 emissions. In efficient ethanol-based fuel cells (EBFCs), electricity is produced from the chemical decomposition of ethanol molecules.8 EBFCs can offer the possibility to increase the energy efficiency of transport vehicles.6,8 Specifically, Pt-based nanocatalysts constitute efficient compounds to activate ethanol on anodes of EBFCs. However, the total charge per ethanol molecule obtained using Pt-based surfaces on anodes reaches roughly 1/3 of the feasible theoretical maximum.8–11 This typically occurs because the catalytic process terminates mainly with the formation of acetaldehyde (CH3 CHO) and acetic acid (CH3 COOH), which hinders the formation of the CO2 molecules required for the total oxidation process.8,10,12
Pt-nanoparticles (Pt-NPs) display a variety of facets and surface site coordination compared to extended surfaces.13–19 Recent findings show that these topological details could enhance the catalyst activity of Pt-NPs regarding the activation of organic compounds, as opposed to surfaces.17 This is supported by experimental results showing that ethanol catalysis increases when small-size Pt-nanoparticles are employed.11,20 Based on this, Pt-NPs represent an attractive possibility for increasing the efficiency of EBFCs.
This work predicts the activity of 38-atoms Pt-NPs as a catalyst for key ethanol reactions by means of first-principles calculations. We carefully map the adsorption of ethanol on Pt38, and we carry on energetic, structural, and charge analyses. Furthermore, we study some ethanol dissociation processes. Our results show interesting features with respect to (111) Pt-surfaces. Our findings indicate that Pt-NPs favour the cleavage of the C–C bond and the CH3 radical, but tend to prevent hydroxyl cleavage. Such information clearly suggests that Pt38 is a good candidate for enhancing ethanol catalysis within EBFCs.
2 Materials and methods
We employ the spin-polarized total-energy density functional theory (DFT) calculations21,22 processed through the Quantum ESPRESSO suite.23,24 The generalized gradient approximation of Perdew, Burke, and Ernzerhof (PBE)25 is adopted to describe the exchange-correlation interactions. The atomistic systems contain charge-neutral Pt, O, C, and H atoms, whose atomic numbers are 78, 8, 6, and 1, respectively. Ultrasoft pseudopotentials are used to describe core–valence electron interactions,26 and the electronic distribution of valence electrons 5d96s16p0, 2s22p4, 2s22p2, and 1s1 is considered for Pt, O, C, and H pseudopotentials, respectively. A plane-wave energy cutoff of 25 Ry and Gamma-point calculations are used for Brillouin-zone sampling, and a vacuum slab of at least 11 Å is adopted. The van der Waals dispersion interaction is described using the Grimme formulation (PBE + D3).27 All geometries are optimized using the Broyden–Fletcher–Goldfarb–Shanno (BFGS) method23,24,28,29 until forces on atoms are lower than 1 × 10⁻³ Ry Bohr−1 and the total energy difference between two consecutive self-consistent interactions changes less than 1 × 10⁻⁴ Ry. The maximum displacement of atoms between two minimization steps was set as 0.8 Bohr along the minimization process. The atomic charges are obtained through projection on atomic orbitals.30We consider a 38-atom truncated octahedron Pt-nanoparticle (Pt38). This structure is an Archimedean solid that obeys the Wulff theorem of shape stability of crystals.15,31 It is obtained by cutting a piece of a face-centered cubic Pt-bulk structure. According to the Wulff theorem, the further growth of the (100) and (111) facets respects the ratio between these surface energies. The final Pt38 structure does not present a central atom. For details about the shape and structure of nanoparticles, ref. 31 can be referred to. The rationale of this nanoparticle is twofold, delimited by both (100) and (111) types of facets, connected at the corners and edges by low coordination Pt-atoms. So, Pt38 offers a greater variety of surface sites to evaluate ethanol adsorption if compared to other intermediate-size structures, as the (111) delimited Pt55.15,16,32 Furthermore, compared to smaller and larger samples, intermediate-size Pt nanoparticles exhibit favourable adsorption and catalytic properties for ethanol molecules,12,20,33–36 with similar effects reported for water dissociation on Pt38 nanoparticles.37 Based on this, Pt38 represents a substrate for ethanol catalysis that deserves more attention. Studies regarding the adsorption of ethanol molecules on Pt-extended surfaces38–40 and nanoparticles16,19,41 confirmed that the adsorption of the ethanol–oxygen atom on top of a surface Pt-atom is energetically favourable, with adsorption on the low coordinated vertex sites representing relevant sites among nanoparticle from the energetic point of view. The orientation of the ethanol ethyl tail also plays a role, where configurations with the C–C bond oriented towards the Pt-surface, approaching the H-atoms in CH2 and CH3 to the top of Pt atoms, are the most stable structures. Since these conclusions are confirmed for some different sizes and specific shapes of nanoparticles,16,19,41 here we concentrated on evaluating the most relevant adsorption possibilities on Pt38 that keeps the ethanol oxygen atom on top of a Pt-atom. Both vertex and facet Pt-atoms are considered to adsorb the ethanol oxygen and the orientation of the C–C ethanol bond is evaluated along the edge and facet Pt-atoms and vertically oriented when the ethanol molecule presents the gauche symmetry. The entire optimization process was carried out for all proposed adsorbing configurations, and the actual results correspond to the optimized configurations. Fig. 1 presents the obtained adsorption sites on Pt38 following the full geometry optimization process. The adsorption energy, Eads, of ethanol on a nanoparticle is
| Eads = ESys − EPt38 − EMol, | (1) |
The Nudge Elastic Band method23,24 with the Climbing Image procedure was used to obtain the transition states. The initial and final images were kept fixed, and the images were connected by springs defined by a variable spring constant between 0.3 and 0.2 a.u. The path is optimized using the Broyden Second method42,43 until the intensity of the force orthogonal to the path was lower than 0.1 eV Å−1. Since the ethanol–Pt38 interaction occurs mainly through enthalpy-driven van der Waals interactions, zero point energy and temperature were not considered.
Rearrangements of the Pt38 structure after molecular adsorption are evaluated from the cluster's radial breathing. This quantity accounts for the variation of the radial position ri of the atom i with respect to the centre of mass of the nanoparticle, before and after the adsorption.
 | (2) |
 and
and  stand for the radial position of the atom i before and after adsorption, respectively.
The charge distribution is evaluated based on the charge difference for each atom i before and after EtOH adsorption,
 | (3) |
 and
and  are the charges of the atom i, before and after the adsorption, respectively.
3 Results
Fig. 1 shows the evaluated ethanol adsorption sites on Pt38. The different sites account for the most relevant chemical aspects of the molecule–Pt38 interaction. We interpret our results by reporting both the relative position of oxygen and the orientation of the CH3 group. Generally speaking, the adsorption of oxygen–ethanol on top of edge sites shortens the Pt–O distance (dPt–O), while dPt–O is longer when the oxygen lies on top of a facet Pt-atom. Specifically, Position 2 (Pos2) shows the molecule on the Gauche symmetry on top of an edge-Pt site, with the CH3-group far from the Pt38 surface. This site is characterised by the shortest distance between the oxygen–ethanol and surface-Pt atoms (2.2371 Å), between the evaluated sites. The positions Pos1, Pos3, Pos4 and Pos5 show the trans-ethanol falling on the surface, with the CH3 group close to a surface Pt-atom. Pos4 presents the oxygen–ethanol adsorbed on the centre of a facet and exhibits the longer Pt–O distance (2.3185 Å), with the oxygen–ethanol on top of a facet Pt-atom.Table 1 reports the adsorption energies and the intra-ethanol bond lengths upon adsorption. In general, the oxygen anchored on an edge Pt-atom represents the most stable position, but the orientation of the ethyl tail also interferes. In detail, Pos3 is the most stable site, followed by Pos5, while each presents the oxygen on top of an edge site and the ethyl tail toward the facet. Pos4 presents the higher Eads. Interestingly, the Gauche symmetry, where ethanol is adsorbed on the edge, as in the Pos2, is slightly higher in energy compared to other sites with the oxygen on the top edge. Notably, Pos2 presents the longest dC–C and dO–H, but the lowest dPt–O between the evaluated sites. The most stable site, Pos3, presents the longer dC–O. Together, these variations in bond length could give clues to the charge transfer between atoms, thereby helping to identify catalytic routes.
| Ads. site | E ads (eV) | d C–O (Å) | d C–C (Å) | d Pt–O (Å) | d O–H (Å) |
|---|---|---|---|---|---|
| Pos1 | −0.796 | 1.4761 | 1.5085 | 2.2558 | 0.9788 |
| Pos2 | −0.766 | 1.4761 | 1.5126 | 2.2370 | 0.9835 |
| Pos3 | −0.835 | 1.4795 | 1.5085 | 2.2519 | 0.9789 |
| Pos4 | −0.648 | 1.4702 | 1.5086 | 2.3185 | 0.9822 |
| Pos5 | −0.820 | 1.4788 | 1.5081 | 2.2725 | 0.9783 |
Fig. 2 represents the radial breathing of Pt38, according to eqn (2). The results show that the adsorption site and the ethanol orientation and symmetry affect the overall geometry, as expected. For every considered site, the Pt-anchor is pushed up upon adsorption. Among these, the Pt38 nanostructure undergoes fewer rearrangements when the molecule is adsorbed on the facet centre, as in a Pos4 site. The most significant modifications occur on Pos2, where the ethanol with Gauche symmetry is on top of an edge site. This information seems to indicate the strengthening of the Pt–O bond with the shortening of the Pt–O distance and a larger charge transfer.
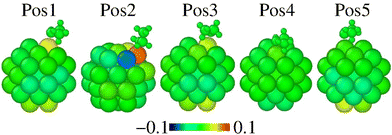 | ||
| Fig. 2 Radial breathing of Pt38 atoms of evaluated adsorption positions according to eqn (3). The scale bar is in Å units. The ethanol colors are meaningful and the molecule is shown in each adsorption position for reference. | ||
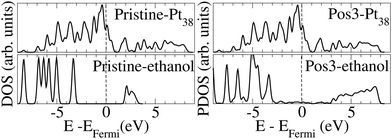
Fig. 3 presents the density of states (DOS) for the pristine Pt38 and ethanol molecules, and the projected density of states (PDOS) on Pt38 and the ethanol upon molecule adsorption on the most stable Pos3 configuration. We observed that the energy levels for Pt38 before and after ethanol adsorption spread between ∼−9 and ∼−9 eV. Before adsorption, the empty ethanol states are localized within 2–3 eV, while the occupied states are localized within ∼−3 and ∼−9 eV. Upon adsorption, the formation of the oxygen–Pt bond and charge transfer take place, and the unoccupied ethanol levels are shifted to ∼−3 to 8 eV. Such data indicate that part of the ethanol valence charge is transferred to Pt38 and that the molecule becomes positively charged. The valence band maximum for the pristine and adsorbed ethanol molecule is at the same position, but the narrower peak for the pristine, compared to the adsorbed one, indicates hybridization takes place after adsorption. Furthermore, the peak at ∼−4.5 eV, present for the Pt38 and the adsorbed ethanol, reveals the hybridization due to bond formation between the adsorbed molecule and the nanoparticle.
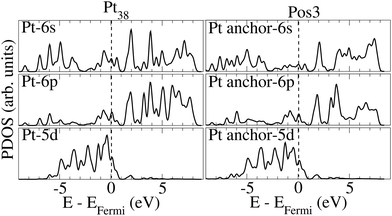
Fig. 4 presents the PDOSs for some orbitals of the Pt-anchor atom prior to and upon ethanol adsorption onto Pt38. Most of the occupied 6 s states of Pt-anchor reduce their intensity for Pos3 geometry, compared to the pristine nanoparticle, especially close to the Fermi level. The peak reduction of occupied states could indicate that the 6 s orbital acts as an electron donor. A similar effect is verified for the 5 d energy levels close to the Fermi level. On the other hand, the occupied 6 p orbitals between ∼−5 and ∼−7 eV increase.
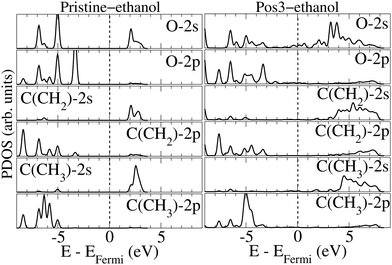
Fig. 5 presents the PDOSs of selected orbitals for the oxygen and carbon atoms in the ethanol molecule prior to and after adsorption on Pos3 geometry. The rsults reveal that the 2 s empty oxygen levels, concentrated between 3 and 4 eV before adsorption, spread from the Fermi level up to 8 eV when adsorbed. The introduction of peaks near 1 eV and 2 eV reveal that oxygen 2 s and Pt-anchor 6 s hybridization occurs. A similar situation is verified for the occupied levels, where a broad spread occurs upon adsorption for most levels. The occupied levels for the oxygen-2 p orbital present a broadening of the levels between ∼−7 eV and ∼−4.5 eV upon adsorption, but the introduction of some peaks, like ones at ∼−4.5 eV and ∼−0.5 eV, also indicates hybridization with Pt-anchor. Notably, the occupied 2 s and 2 p peaks related to oxygen present a reduction in intensity, whereas the empty peaks seem to enlarge, suggesting a charge donation upon ethanol adsorption. In the same direction, alterations could be found on levels related to 2 s and 2 p orbitals of ethanol carbon atoms as well. Upon adsorption, the 2 s and 2 p orbitals of carbon atom in CH2 radical increase below the Fermi level but diminish for the empty states, compared to the pristine-ethanol. In contrast, the 2 p orbital of the carbon atom in CH3 close to ∼−5.0 eV shows a notable intensity increase.
Fig. 6 presents the total and orbital charge redistribution upon ethanol adsorption, (Δqi), according to eqn (3). In any event, after the ethanol adsorption, a charge transference occurs. Regarding total charge, the Pt-anchor receives charge while the O-atom acts as a donor, in line with the results of Verga et al.19 Other details of note emerge from Fig. 6. First, the Pt-anchor located on an edge site receives more charge, compared to a facet adsorption site, like Pos4. This indicates a stronger chemical interaction when the oxygen is on top of an edge site. This observation aligns with the greater Pt–O bond distance and weaker Eads of Pos4. Second, the position of the CH3 on the Pt-NP seems to affect the charge redistribution. In this regard, the Pt-anchor receives more charge if ethanol is on Pos3 and Pos5, which presents CH3 on top of a facet. Furthermore, a charge gain occurs in all H-atoms of the CH3 group nearby a Pt-atom. This indicates that the H-atoms within the CH3 group are affected in different ways due to the proximity of Pt-atoms. Interestingly, the C-atom within the CH3 group donates charge upon adsorption only on the Pos2 site, but gains charge in all other positions. This contrasting charge transfer pattern on the CH3 group indicates that different adsorption sites could affect the ethanol bond cleavage differently. Notably, experiments under reactive conditions using sum frequency generation (SFG) vibrational spectroscopy suggested that the ethanol C–C bond is more perpendicular to the Pt surface in the gas phase, while the bond is approximately parallel to the surface in the liquid phase.44 Furthermore, the authors showed that the selectivity toward total oxidation toward CO2 is approximately 42% greater in the gas phase, whereas the selectivity toward incomplete oxidation toward acetaldehyde is almost 2% lower in the gas phase compared to the liquid one. Such pieces of information connect with the longest C–C bond obtained for the Pos2 adsorption site obtained in the present work (Table 1), indicating that this position may favor the selectivity toward C–C cleaving. The orbital charge analysis clarifies that the Pt-anchor receives a p-charge but donates s- and d-charges in all evaluated configurations. This fact implies a s → p and d → p charge transfer upon ethanol adsorption. In any event, we show that oxygen–ethanol losses primarily p-charge independently of the adsorption site feature. These findings are consistent with the DOS and PDOS analyses presented in Fig. 3 and 5.
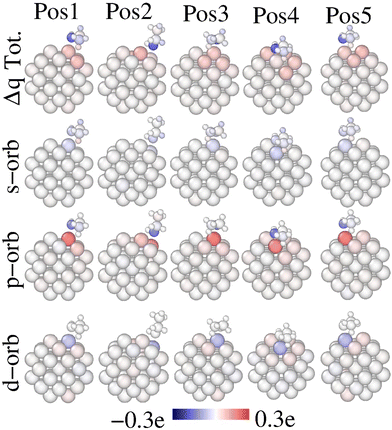 | ||
| Fig. 6 Charge redistribution upon ethanol adsorption for the evaluated sites, according to eqn (2). The total, s, p and d charge redistributions are shown in the first, second, third and fourth rows, respectively. Red color accounts for a charge gain of the atom upon ethanol adsorption, whereas, blue indicates a charge loss upon adsorption. | ||
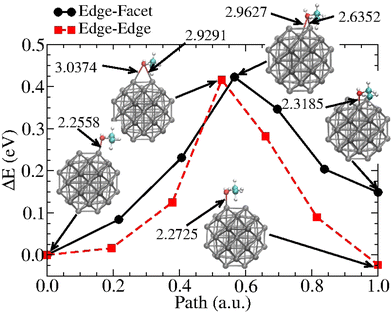
To better characterize the ethanol–nanoparticle energetics, we estimate the energy activation barriers involved in the displacement of the molecule along the Pt38 surface. This information is relevant for evaluating the diffusion of molecules on nanoparticles and could be useful for deriving an adjusted force field. The displacement of the ethanol molecule along with two neighbour edge sites and between an edge and a facet site was considered. Fig. 7 shows the obtained barriers. These results demonstrate that activation energies are similar along both paths (about 0.42 eV), and that at equilibrium and ambient temperatures, the Boltzmann weights related to the endpoint positions give the probability that finding the molecule on Pos1 is approximately 252.1 times greater than for Pos4. On the other hand, the probability of finding the ethanol on Pos5 is approximately 2.5 times that of Pos1. These results indicate the far greater likelihood of finding the ethanol adsorbed with oxygen on top of an edge site in a rarefied atmosphere at ambient temperature, as the orientation of the ethyl towards the facet centre also plays a role in stabilizing the system.
Since ethanol is a complex molecule, there are a number of different chemical routes to dissociate it. In most of the cases, the ethanol oxidation reaction terminates with the formation of acetic acid and acetaldehyde. This typically occurs when reactions are catalyzed by an extended Pt-surface.8–11,45 However, the promotion of the C–C bond cleavage towards CO2 production as a final outcome of the reaction could be enhanced using nanocatalysts. Considering that the straight, one-step, C–C bond cleavage of ethanol molecules is highly unlikely due to the high energy activation barrier, as shown on Pt-surfaces,45 here, we focus our attention on other key reactions leading to ethanol dissociation on Pt38.
Fig. 8 and Table 2 show the energy profiles related to ethanol dissociation. Selected results from the literature which consider extended Pt-surfaces are reported in Table 2 for easier comparison. The findings show that reactions starting from the ethanol H-atoms bonded to carbon atoms are favoured on Pt38. On the other hand, the cleavage of the hydroxyl O–H bond has a larger barrier (1.25 eV), compared to the extended (111) Pt-surface (0.88 eV). This represents an increase of approximately 42% in the energy cost associated with the O–H bond cleavage on the Pt-nanoparticles, compared to the surface. Furthermore, such an increment suggested that this reaction is unlikely to occur on Pt38. Other reactions toward the acetaldehyde (CH3 CHO), which requires hydroxyl cleavage, are unfavourable on Pt38 compared to Pt(111). However, the ethanol C–C bond cleavage is more favourable on Pt38 than on the (111) surface. Although the straight C–C bond cleavage is unlikely, the reduction of approximately 13% in the activation energy indicates a favourable C–C cleavage on Pt-nanoparticles. These results are aligned with the enhanced ethanol oxidation reaction reported on (100) terminated cubic nanoparticles, compared to (110), (111), (211), and (311) facets, as presented in a recent experimental study conducted by Wang et al.46 The energy activation barriers are reduced on Pt38 when the ethanol dissociation begins with the removal of an H-atom from the CH3 group. This information is consistent with the charge gain of the H-atom on CH3 located close to the nanoparticle surface, as in Pos1 of Fig. 6. The improvement in ethanol oxidation reaction on Pt38, with regard to the extended (111) Pt-surface, is consistent with experimental studies with smaller-size Pt-nanoparticles.47
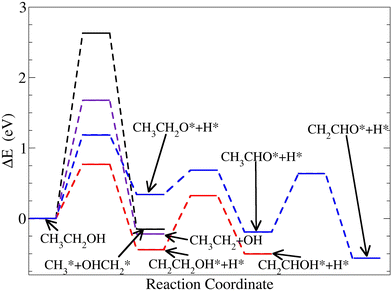 | ||
| Fig. 8 Energy profiles of the four alternative reaction pathways with an adsorbed ethanol starting on Pos3 on Pt38. | ||
4 Conclusions
One of the greatest challenges to increase the efficiency of EBFCs is finding a catalyst which can surpass the formation of acetaldehyde (CH3 CHO), hindering the formation of acetic acid (CH3 COOH). Indeed, CH3 CHO and CH3 COOH are the most common products during the dissociation of ethanol on extended Pt surfaces. Unfortunately, they are not the most desirable products,8,10 and better catalysts are needed. Anyone can easily notice that both products have the CH3 radical in their structure. Here we find that Pt-truncated octahedra as small as 38 atoms could solve the issue. Indeed, by first-principles calculations, we show that the activation of the CH3 group by removing H-atoms is more favourable on a Pt38 nanoparticle than on a flat, extended (111) Pt-surface, as shown in Fig. 7 and Table 2. Our results indicate that Pt-nanoclusters could be employed to increase the efficiency of EBFCs because they facilitate mechanisms toward the complete ethanol oxidation reaction.Author contributions
The authors contributed equally to this work. All authors have given approval to the final version of the manuscript.Conflicts of interest
There are no conflicts to declare.Acknowledgements
The authors acknowledge the computational support from ARCHER2, CENAPAD-SP, and CCCT-CP at UTFPR-CP.Notes and references
- N. G. Loeb, G. C. Johnson, T. J. Thorsen, J. M. Lyman, F. G. Rose and S. Kato, Geophys. Res. Lett., 2021, 48, e2021GL093047 CrossRef
.
- M. T. Richardson, Geophys. Res. Lett., 2022, 49, e2021GL095782 Search PubMed
.
- G. Li, M. Li, R. Taylor, Y. Hao, G. Besagni and C. N. Markides, Appl. Therm. Eng., 2022, 209, 118285 CrossRef
.
- A. Rahman, O. Farrok and M. M. Haque, Renewable Sustainable Energy Rev., 2022, 161, 112279 CrossRef
.
- M. Younas, S. Shafique, A. Hafeez, F. Javed and F. Rehman, Fuel, 2022, 316, 123317 CrossRef CAS
.
- S. P. S. Badwal, S. Giddey, A. Kulkarni, J. Goel and S. Basu, Appl. Energy, 2015, 145, 80–103 CrossRef CAS
.
- J. Goldemberg, Science, 2007, 315, 808–810 CrossRef CAS PubMed
.
- L. Yaqoob, T. Noor and N. Iqbal, RSC Adv., 2021, 11, 16768–16804 RSC
.
- L. An, T. S. Zhao, X. L. Zhou, L. Wei and X. H. Yan, RSC Adv., 2014, 4, 65031–65034 RSC
.
- L. An, T. Zhao and Y. Li, Renewable Sustainable Energy Rev., 2015, 50, 1462–1468 CrossRef CAS
.
- C.-L. Sun, J.-S. Tang, N. Brazeau, J.-J. Wu, S. Ntais, C.-W. Yin, H.-L. Chou and E. A. Baranova, Electrochim. Acta, 2015, 162, 282–289 CrossRef CAS
.
- A. B. D. M. Jacquot, M. Chatenet and C. Cremers, Phys. Chem. Chem. Phys., 2016, 18, 25169–25175 RSC
.
- K. Rossi, G. G. Asara and F. Baletto, ACS Catal., 2020, 10, 3911–3920 CrossRef CAS
.
- K. Rossi, G. G. Asara and F. Baletto, ChemPhysChem, 2019, 19, 3037–3044 CrossRef PubMed
.
- F. Baletto, J. Phys.: Condens. Matter, 2019, 113001 CrossRef PubMed
.
- V. A. Rigo, C. R. Miranda and F. Baletto, Eur. Phys. J. B, 2019, 92, 1 CrossRef CAS
.
- C. Li, K. Wang and D. Xie, Surf. Interfaces, 2022, 28, 101594 CrossRef CAS
.
- L. G. Verga, J. Aarons, M. Sarwar, D. Thompsett, A. Russell and C.-K. Skylaris, Phys. Chem. Chem. Phys., 2016, 18, 32713–32722 RSC
.
- L. G. Verga, A. E. Russell and C.-K. Skylaris, Phys. Chem. Chem. Phys., 2018, 20, 25918–25930 RSC
.
- J. Perez, V. A. Paganin and E. Antolini, J. Electroanal. Chem., 2011, 654, 108–115 CrossRef CAS
.
- P. Hohenberg and W. Kohn, Phys. Rev., 1964, 136, B864 CrossRef
.
- W. Kohn and L. J. Sham, Phys. Rev., 1965, 140, A1133 CrossRef
.
- P. Giannozzi, S. Baroni, N. Bonini, M. Calandra, R. Car, C. Cavazzoni, D. Ceresoli, G. L. Chiarotti, M. Cococcioni, I. Dabo, A. D. Corso, S. de Gironcoli, S. Fabris, G. Fratesi, R. Gebauer, U. Gerstmann, C. Gougoussis, A. Kokalj, M. Lazzeri, L. Martin-Samos, N. Marzari, F. Mauri, R. Mazzarello, S. Paolini, A. Pasquarello, L. Paulatto, C. Sbraccia, S. Scandolo, G. Sclauzero, A. P. Seitsonen, A. Smogunov, P. Umari and R. M. Wentzcovitch, J. Phys.: Condens. Matter, 2009, 21, 395502 CrossRef PubMed
.
- P. Giannozzi, O. Andreussi, T. Brumme, O. Bunau, M. B. Nardelli, M. Calandra, R. Car, C. Cavazzoni, D. Ceresoli, M. Cococcioni, N. Colonna, I. Carnimeo, A. D. Corso, S. de Gironcoli, P. Delugas, R. A. DiStasio, A. Ferretti, A. Floris, G. Fratesi, G. Fugallo, R. Gebauer, U. Gerstmann, F. Giustino, T. Gorni, J. Jia, M. Kawamura, H.-Y. Ko, A. Kokalj, E. Küçükbenli, M. Lazzeri, M. Marsili, N. Marzari, F. Mauri, N. L. Nguyen, H.-V. Nguyen, A. O. de-la Roza, L. Paulatto, S. Poncé, D. Rocca, R. Sabatini, B. Santra, M. Schlipf, A. P. Seitsonen, A. Smogunov, I. Timrov, T. Thonhauser, P. Umari, N. Vast, X. Wu and S. Baroni, J. Phys.: Condens. Matter, 2017, 29, 465901 CrossRef CAS PubMed
.
- J. P. Perdew, K. Burke and M. Ernzerhof, Phys. Rev. Lett., 1996, 77, 3865–3868 CrossRef CAS PubMed
.
- D. Vanderbilt, Phys. Rev. B: Condens. Matter Mater. Phys., 1990, 41, 7892–7895 CrossRef PubMed
.
- S. Grimme, J. Antony, S. Ehrlich and H. Krieg, J. Chem. Phys., 2010, 132, 154104 CrossRef PubMed
.
- S. R. Billeter, A. J. Turner and W. Thiel, Phys. Chem. Chem. Phys., 2000, 2, 2177–2186 RSC
.
- S. R. Billeter, A. Curioni and W. Andreoni, Comput. Mater. Sci., 2003, 27, 437–445 CrossRef
.
- P.-O. Löwdin, J. Chem. Phys., 1950, 18, 365–375 CrossRef
.
- L. D. Marks, J. Cryst. Growth, 1983, 61, 556–566 CrossRef CAS
.
-
F. Baletto, C. R. Miranda, V. A. Rigo and K. Rossi, Nanoalloys for energy applications, in Nanoalloys, ed. F. Calvo, Elsevier, Oxford, 2nd edn, 2020, pp. 347–380 Search PubMed
.
- T.-K. Yeh and C.-H. Chen, J. Power Sources, 2008, 184, 353–362 CrossRef
.
- C. Hu, Y. Zhou, M. Xiao and G. Yu, Int. J. Hydrogen Energy, 2020, 45, 4341–4354 CrossRef CAS
.
- A. von Weber and S. L. Anderson, Acc. Chem. Res., 2016, 49, 2632–2639 CrossRef CAS PubMed
.
- Y. Ma, C. Ricciuti, T. Miller, J. Kadlowec and H. Pearlman, Energy Fuels, 2008, 22, 3695–3700 CrossRef CAS
.
- J. L. C. Fajín, A. Bruix, M. N. D. S. Cordeiro, J. R. B. Gomes and F. Illas, J. Chem. Phys., 2012, 137, 034701 CrossRef PubMed
.
- A. O. Pereira and C. R. Miranda, Appl. Surf. Sci., 2014, 288, 564–571 CrossRef CAS
.
- P. Tereshchuk and J. L. F. Da Silva, J. Phys. Chem. C, 2012, 116, 24695–24705 CrossRef CAS
.
- R. L. H. Freire, A. Kiejnab and J. L. F. Da Silva, Phys. Chem. Chem. Phys., 2016, 18, 29526–29536 RSC
.
- L. Zibordi-Besse, P. Tereshchuk, A. S. Chaves and J. L. F. Da Silva, J. Phys. Chem. A, 2016, 120, 4231–4240 CrossRef CAS PubMed
.
- C. G. Broyden, J. E. J. Dennis and J. J. Moré, J. Inst. Maths. Appl., 1973, 12, 223–245 CrossRef
.
- G. Henkelman and H. Jónsson, J. Chem. Phys., 1999, 111, 7010 CrossRef CAS
.
- A. Sapi, F. Liu, X. Cai, C. M. Thompson, H. Wang, K. An, J. M. Krier and G. A. Somorjai, Nano Lett., 2014, 14, 6727–6730 CrossRef CAS PubMed
.
- H.-F. Wang and Z.-P. Liu, J. Am. Chem. Soc., 2008, 130, 10996–11004 CrossRef CAS PubMed
.
- Z.-d Wang, Y. Gan, Y.-l Mai, Y. Shi, S. Cao, Z.-x Lu, C.-q Guo, H. Tan and C.-f Yan, Anal. Chem., 2020, 92, 8046–8050 CrossRef CAS PubMed
.
- C. Hu, Y. Zhou, M. Xiao and G. Yu, Int. J. Hydrogen Energy, 2020, 45, 4341–4354 CrossRef CAS
.
| This journal is © the Owner Societies 2023 |


