 Open Access Article
Creative Commons Attribution 3.0 Unported Licence
Origin of the overall water splitting activity of Ta3N5 revealed by ultrafast transient absorption spectroscopy†
Dharmapura H. K.
Murthy
 a,
Hiroyuki
Matsuzaki
 *a,
Zheng
Wang
 b,
Yohichi
Suzuki
a,
Takashi
Hisatomi
 b,
Kazuhiko
Seki
 a,
Yasunobu
Inoue
cd,
Kazunari
Domen
 *bc and
Akihiro
Furube
 *ae
*ae
aNational Institute of Advanced Industrial Science and Technology (AIST), Tsukuba Central 2, 1-1-1 Umezono, Tsukuba, Ibaraki 305-8568, Japan. E-mail: hiroyuki-matsuzaki@aist.go.jp
bCentre for Energy & Environmental Science, Shinshu University, 4-17-1 Wakasato, Nagano-shi, Nagano 380-8553, Japan
cDepartment of Chemical System Engineering, School of Engineering, The University of Tokyo, 7-3-1 Hongo, Bunkyo-ku, Tokyo 113-8656, Japan. E-mail: domen@chemsys.t.u-tokyo.ac.jp
dJapan Technological Research Association of Artificial Photosynthetic Chemical Process (ARPChem), 2-11-9 Iwamotocho, Chiyoda-ku, Tokyo 101-0032, Japan
eDepartment of Optical Science, Tokushima University, 2-1 Minamijosanjima-cho, Tokushima 770-8506, Japan. E-mail: furube.akihiro@tokushima-u.ac.jp
First published on 25th April 2019
Abstract
Tantalum nitride (Ta3N5) is one of the few visible light absorbing photocatalysts capable of overall water splitting (OWS), by which the evolution of both H2 and O2 is possible. Despite favourable energetics, realizing the OWS or efficient H2 evolution in Ta3N5 prepared by the nitridation of tantalum oxide (Ta2O5) or Ta foil remains a challenge even after 15 years of intensive research. Recently our group demonstrated OWS in Ta3N5 when prepared by the short time nitridation of potassium tantalate (KTaO3). To obtain a mechanistic insight on the role of Ta precursor and nitridation time in realizing OWS, ultrafast dynamics of electrons (3435 nm probe) and holes (545 nm probe) is investigated using transient absorption spectroscopy. Electrons decay majorly by trapping in Ta3N5 prepared by the nitridation of Ta2O5, which do not show OWS. However, OWS activity in Ta3N5 prepared by 0.25 hour nitridation of KTaO3 is particularly favoured by the virtually absent electron and hole trapping. On further increasing the nitridation time of KTaO3 from 0.25 to 10 hour, trapping of both electron and hole is enhanced which concurrently results in a reduction of the OWS activity. Insights from correlating the synthesis conditions—structural defects—carrier dynamics—photocatalytic activity is of importance in designing novel photocatalysts to enhance solar fuel production.
1. Introduction
Considering ever increasing energy demand, there is an urgent need to promote and enhance the production of renewable energy sources. This approach will pay dividends in protecting our environment from a serious crisis. In this direction, using solar energy to generate H2 from water using a photocatalytic process constitutes one of the methods.1–9 Over the past decades, this approach has been intensively investigated to enhance the solar to hydrogen (STH) conversion efficiency. For the commercial use of the solar H2, a stable photocatalyst consistently demonstrating a higher STH efficiency is desired. To address this challenge, novel visible light absorbing photocatalysts are being synthesized and tested for photocatalytic water splitting activity.Tantalum nitride (Ta3N5) is an n-type, visible light absorbing nitride-based photocatalyst. The conduction band (CB) and valence band (VB) of Ta3N5 are characterized by the Ta 5d and N 2p orbitals, respectively.10,11 Ta3N5 is commonly prepared by the nitridation reaction of tantalum (Ta) precursors such as Ta foil or tantalum oxide (Ta2O5). The VB and CB positions in Ta3N5 are thermodynamically suitable to drive water oxidation and reduction to generate O2 and H2, respectively. Hence, Ta3N5 is capable of overall water splitting (OWS) upon one-step photoexcitation. However, Ta3N5 is usually known as a photoanode material with efficient O2 evolution,10,12–17 but not for either H2 evolution or OWS ability.
Recently, OWS activity with an apparent quantum efficiency (AQE) of 70% is demonstrated in an ultraviolet light absorbing SrTiO3 photocatalyst.18 As a further advancement, Ta3N5 forms one of the few promising visible light absorbing photocatalysts capable of OWS. Nevertheless, achieving OWS in Ta3N5 prepared by nitriding Ta foil or Ta2O5 still remains a challenge. Recently our group employed potassium tantalate (KTaO3) as a Ta precursor for the nitridation reaction to prepare Ta3N5. In this approach, Ta3N5 prepared by 0.25 hour nitridation of KTaO3 demonstrated the highest OWS activity. This is the first report on realizing visible light OWS activity without the need of sacrificial reagents for Ta3N5.19 However, the efficiency of OWS activity was found to decrease with increase in the nitridation time from 0.25 to 10 hour. These observations emphasize the need to elucidate the role of the Ta precursor and the nitridation time in determining the efficiency of OWS.
As stated earlier, the H2 evolution in Ta3N5 (prepared by the nitridation Ta foil or Ta2O5) is apparently less known and typically smaller when compared to O2 evolution. In a few reports that demonstrate H2 evolution in Ta3N5, the size of Ta3N5 particles was relatively small (between 5 to 8 nm (ref. 20) and in one case it is 2 nm (ref. 21)). In addition to the smaller size, Ta3N5 particles were typically present in a composite form with either SiO2 (ref. 20) or graphene oxide.21 In these reports, the effect of size on the band bending/optical properties and the expected electronic interaction between the Ta3N5 with the counterpart in the composite is not considered. In another report showing H2 evolution, the surface of the Ta3N5 was modified with magnesium layer.22 Thus, without the modification of either structural/surface properties of Ta3N5 or by inducing electronic interaction with another material, H2 evolution was not realized. Based on these observations, it is agreeable to state that efficient generation of H2 in Ta3N5 is fundamentally less pronounced compared to O2.10,21,23 However, the origin of this observation is unclear.
A key approach to examine the role of Ta precursor and the nitridation time on the efficiency of OWS is investigating the decay dynamics of photogenerated charge carriers. Whilst there has been extensive research/progress in the development of Ta3N5 from the materials perspective, the dynamics of photogenerated charge carriers and its impact on the efficiency of the photocatalytic reaction have not been explored. The fundamental process in OWS in Ta3N5 is the generation of electron–hole pairs upon absorption of light. Then, these carriers must migrate towards the surface of the Ta3N5 to get involved in the reaction with water. However, due to structural/electronic defects in Ta3N5, efficient charge transport towards the surface is affected by the undesirable trapping and/or recombination. To unveil these photoinduced processes in detail, femtosecond time-resolved diffuse reflectance (fs-TDR) spectroscopy is employed, which is a pump–probe method. Here, excitation of Ta3N5 with an ultrafast laser pulse leads to the formation of holes and electrons in the VB and CB, respectively. The dynamics of these transient species can be followed by monitoring their transient absorption spectrum using an optical probe pulse from visible to infrared. This technique has been widely used to examine charge carrier dynamics in various types of photocatalysts and to correlate the obtained photophysical parameters with that of photocatalytic efficiency.24–29 Note that TDR is essentially similar to the transient absorption spectroscopy (TAS) except that the TA signal in the former is monitored in diffuse reflection mode because of the opaque nature of the Ta3N5 powder samples. The ultrafast dynamics of electrons and holes and their decay pathway was found to be strongly influenced by the Ta precursor used to prepare Ta3N5 and the nitridation time. Results from this systematic investigation help in understanding the structure–property relationship and provide rational insights on Ta3N5 material design to improve the efficiency of OWS. As mentioned earlier, this work provides mechanistic insight on explaining OWS through charge carrier dynamics, while a comprehensive study of the morphological characterization and photocatalytic performance is reported elsewhere.19
2. Results and discussion
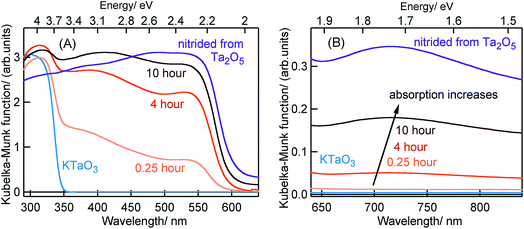
Fig. 1 shows the ground-state optical absorption spectra for the Ta3N5 prepared by nitridation of Ta2O5 or KTaO3 in both visible and NIR region. The absorption peak at 545 nm (Fig. 1A) is attributed to the fundamental transition (N 2p to Ta 5d) in Ta3N5. Though the magnitude of absorption at 545 nm increases with nitridation time, the energetic position was not influenced by the choice of Ta precursor or the nitridation time. As shown in Fig. 1B, an enhancement in the magnitude of NIR absorption is noticed with an increase in the nitridation time from 0.25 to 10 hour indicating the presence of defect states within the bandgap of Ta3N5. For Ta3N5 prepared by 0.25 hour nitridation of KTaO3, noticing a virtually absent NIR absorption suggests a significant reduction in the concentration of defect states. This conclusion is in good agreement with our previous study using scanning transmission electron microscopy (STEM), which revealed the single-crystal nature of this sample.19 Previous reports have different opinions in relating the NIR absorption with the electronic nature of these defect states.17,30–33 Hence, we consider that the NIR absorption in Ta3N5 is due to the formation of defects related to charged nitrogen vacancies and/or reduced Ta vacancy.In the following parts, Section 2.1 will correlate the charge carrier dynamics in Ta3N5 synthesized by the nitridation of Ta2O5 and KTaO3 (0.25 hour). In Section 2.2, the effect of KTaO3 nitridation time on the charge carrier dynamics in Ta3N5 will be presented. In the last Section 2.3, plausible approaches to enhance the efficiency of OWS in Ta3N5 will be outlined.
2.1 Origin of overall water splitting in Ta3N5 prepared by the 0.25 hour nitridation of KTaO3
The efficiency of OWS was found to be highest in Ta3N5 prepared by 0.25 hour nitridation of KTaO3. On the other hand, 0.25 hour nitridation of Ta2O5 neither forms Ta3N5 phase nor shows the OWS. To understand the origin of OWS activity, charge carrier dynamics is compared between the Ta3N5 prepared by 0.25 hour nitridation of KTaO3 and long-time nitridation of Ta2O5. We selectively monitor the dynamics of free electrons and VB holes at 3435 and 545 nm wavelengths, respectively. The responsible optical transitions probed at these wavelengths are depicted in Scheme 1. It has been consistently demonstrated that probing at 3435 nm (IR region) typically monitors the intra-band transition close to the CB levels. Thus, 3435 nm probe offers unique information on the dynamics of free/shallowly trapped electrons.24,29,34,35 With regard to the hole dynamics, 545 nm probe is employed. As depicted in Fig. 1A, the absorption peak observed at 545 nm is due to the bandgap transition from N 2p (VB) to Ta 5d (CB). Monitoring the dynamics at 545 nm yields direct information on the occupancy of holes in the VB, where the recovery of the ground-state bleaching signal offers information on the hole dynamics.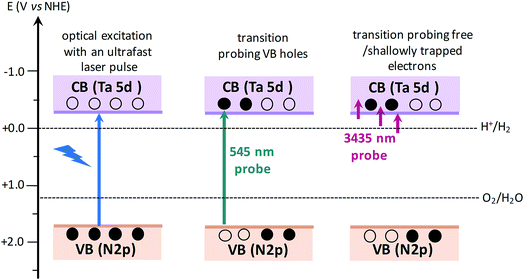 | ||
| Scheme 1 Schematics illustrating the nature of electronic transitions responsible for the transient absorption signal when probed at 545 and 3435 nm, corresponding to VB holes and free electrons, respectively. When the VB holes are formed due to light absorption, a ground-state bleaching signal is expected at 545 nm probe. The redox potentials of H2 and O2 evolution reaction15,36 with respect to CB and VB positions of Ta3N5 shows the capability of Ta3N5 to participate in overall water splitting. | ||
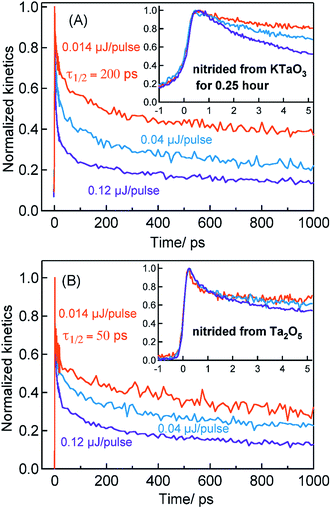
Considering the TA signal is monitored in the diffuse reflection mode in the current study, a direct comparison of the signal magnitude is not straightforward due to the likely differences in the scattering/surface properties of different types of powder samples under study. Hence, we primarily rely on the decay dynamics rather than the signal magnitude while comparing between two different samples. The TA signal magnitude at 3435 nm probe for Ta3N5 prepared by 0.25 hour nitridation of KTaO3 can be found in ESI (Fig. S2).† To understand the decay pathways of free electrons in Ta3N5 (0.25 hour nitridation of KTaO3), the effect of pump fluence on the half lifetime, τ1/2, (i.e., the time at which initial concentration of photogenerated electrons reach to half of its initial value) is compared. The τ1/2 value decreases from 200 to 5 ps upon increasing the fluence from 0.014 to 0.12 μJ per pulse. A qualitatively similar observation is noticed also for hole dynamics probed at 545 nm (Fig. S3†). Thus, the dynamics of both electron and hole is very sensitive to pump fluence from early ps time. In addition, matching of both free electron and hole dynamics is noticed (Fig. S4†). Fitting the transients in Fig. 2A to a second-order type recombination model showed good agreement (Fig. S5†). Taking these observations collectively, it is inferred that photogenerated carriers in Ta3N5 (0.25 hour nitridation of KTaO3) decay primarily via second-order type recombination of free (untrapped) electrons with holes. If the charge carriers decay via trapping to defect states (generally related to first-order type recombination), fluence-independent dynamics is expected, which is however not observed.
Fig. 2B displays the normalized electron kinetics in Ta3N5 prepared by the nitridation of Ta2O5. The TA signal magnitude at 3435 nm probe for Ta3N5 prepared by nitridation of Ta2O5 can be found in ESI (Fig. S2).† Despite increasing the pump fluence by a factor of approximately nine, the electron dynamics in early 5 ps (Fig. 2B inset) is virtually unaffected suggesting the occurrence of electron trapping. A similar observation is noticed also at 580 nm pump (Fig. S6†). The τ1/2 value in Fig. 2B decreases from 50 to 7 ps upon increasing the fluence from 0.014 to 0.12 μJ per pulse. A matching between the free electron and hole dynamics was not observed (Fig. S7†) and the transients could not be fitted to the second-order type electron–hole recombination model (Fig. S5†). Combining these observations, it is concluded that the major part of electrons in Ta3N5 prepared by the nitridation of Ta2O5 decays via trapping rather than second-order type direct electron–hole recombination.
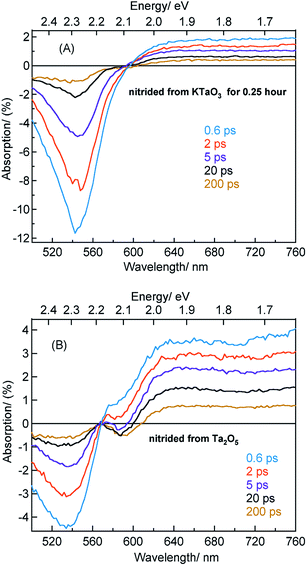
The beaching signal at 545 nm is due to the depopulation of the ground state due to band gap transition (Fig. 1A and Scheme 1) and is correlated to the VB free hole dynamics. The second bleaching (negative) signal at 590 nm probe cannot be explained unless considering the possibility of an optical transition from a filled defect state. To this end, the electronic transition from a positively charged nitrogen vacancies  to the CB is tentatively proposed. A previous prediction using first principles density functional theory calculations is in good agreement with this assignment.30,37 However, this transition is not discernible in Fig. 1A, which is likely due to low absorption coefficient typical to transitions involving defect states. By correlating the energetic positions of bleaching at 590 nm with 545 nm, the
  states are situated at 0.17 eV above the VB maxima. When holes from the VB are trapped to
  states,
  is converted to
  or
or  , which reduces the density of
  states. As a result, possibility of the
  to the CB optical transition at 590 nm reduces and eventually shows bleaching signal (Fig. S10†). We observe the 590 nm bleaching already at 0.6 ps delay time which indicates the ultrafast hole trapping process from the VB to
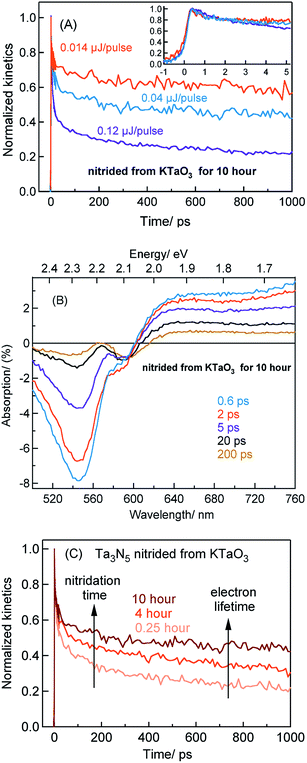
  . Thus, the presence of hole trapping process can be tentatively related to 590 nm bleaching. In an earlier report from Ziani et al. also observed the bleaching signal at 590 nm for Ta3N5 (nitrided from Ta foil) thin films.38 In a recent microsecond TAS study, trapped holes are found to be probed at 590 nm in Ta3N5 (nitrided from Ta2O5).34 Combining these observations, the presence of bleaching signal at 590 nm can be correlated to the formation of hole trapping nitrogen vacancies above the VB. The broad positive TA signal between 650 to 750 nm is tentatively assigned to shallowly trapped electrons (Fig. S11†) and will be discussed in Section 2.2.
Fig. 4A shows the TA spectra of Ta3N5 prepared by the nitridation of KTaO3 for 0.25 hour. The free VB hole dynamics shows time-dependent change as observed at 545 nm bleaching. The virtually absent second bleaching at 590 nm indicates that the density of  defect states is too low to promote hole trapping. This conclusion is in good agreement with noticing a pronounced pump fluence dependent free VB hole dynamics probed at 545 nm (Fig. S3†). The occurrence of hole trapping is found to be an incompetent process in Ta3N5 prepared by 0.25 hour nitridation of KTaO3.
Fig. 4B shows the TA spectra of Ta3N5 prepared by the nitridation of Ta2O5, which is different compared to Fig. 4A in terms of the second bleaching signal at 590 nm in addition to the one at 545 nm. Effect of pump fluence on the dynamics of VB free holes (545 nm probe) is found to be less prominent particularly in early 5 ps time scale (Fig. S12†). This observation suggests the presence of hole trapping  defect states above the VB. Noticing the pronounced second bleaching signal at 590 nm with time indeed support the occurrence of hole trapping. In short, the presence of second bleaching at 590 nm indicates an enhancement in the formation of hole trapping
  defect states.
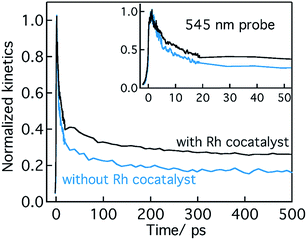
Conclusion from Section 2.1 is briefly summarized as follows. Depending on the Ta precursor employed for the nitridation reaction to prepare Ta3N5, a distinctive electron and hole dynamics is rationalized. In Ta3N5 prepared by the nitridation of Ta2O5, trapping of both electrons and holes is observed. In particular, due to efficient electron trapping, electron transfer to the Rh cocatalyst is not observed which is essential to realize H2 evolution and consequently OWS activity.
In the case of Ta3N5 prepared by the 0.25 hour nitridation of KTaO3, charge carriers are free and the decay is primarily via second-order recombination between CB electrons and VB holes. The decay of both electrons and holes by trapping is found to be ineffective. This conclusion is in good agreement with noticing virtually absent ground-state NIR absorption (Fig. 1B) and with the single-crystal nature of the Ta3N5 without surface defects.19 Hence, efficient migration of both electrons and holes toward the surface is ensured eventually prompting the OWS activity.
2.2 The effect of nitridation time on the charge carrier dynamics in Ta3N5 prepared by the nitridation of KTaO3
The efficiency of OWS is found to be high for 0.25 hour nitrided Ta3N5. However, the OWS activity was reduced by a factor of approximately five with an increase in the nitridation time from 0.25 to 10 hour.19 Hence, investigating the effect of nitridation time on the carrier dynamics is essential to understand the origin of this phenomena. defect states. A similar observation is also noticed for Ta3N5 prepared by 4 hours nitridation of KTaO3 (Fig. S15†). To rule out any potential contribution to the bleaching signal at 590 from the unreacted KTaO3, TA spectra of KTaO3 is recorded. As expected, no such distinct bleaching signal at 590 nm reminiscent to that of Ta3N5 is detected for KTaO3 (Fig. S16†).
To further rationalize the effect of nitridation time on the hole trapping process, the electron lifetime probed at 3435 nm is compared as a function of KTaO3 nitridation time. As shown in Fig. 5C, the electron lifetime gets longer with an increase in the nitridation time. This observation can be explained as follows. Due to hole trapping, fewer holes are available for electrons to decay by recombination and hence a longer electron lifetime can be expected. Thus, from Fig. 5B and C, an enhancement in the efficiency of hole trapping process with an increase in the nitridation time is inferred.
Note that, we have not considered the effect of dark carrier (which depends on the relative position of Fermi level with respect to the CB and the defect density) on the decay dynamics of electrons and holes in Ta3N5 prepared by the nitridation of KTaO3. This is due to experimental difficulty in determining the precise concentration of dark carrier or Fermi level position in these powder samples which is in a composite form with KTaO3. In this regard, a further systematic investigation of the effect of nitridation time on the relative shift in the Fermi level (with respect to the CB) and determining the corresponding dark carrier density would be helpful.
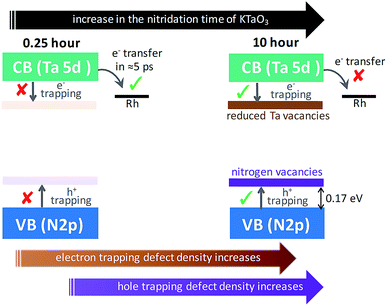
To put the results from Fig. 5 in perspective, it is instructive to understand the plausible mechanism by which defects are formed and their relation with the nitridation time. In this regard, a tentative model is proposed. The temperature employed during the nitridation reaction of KTaO3 is 1173 K. The nitrogen source used for nitriding the Ta precursor is NH3 gas, which decomposes into N2 and H2 under the experimental condition. Ideally, the Ta 5d orbital of the CB is present in Ta5+ states, which ensures to maintain charge neutrality and avoid electron trapping. However, during the nitridation reaction, the time exposed to H2 increases with nitridation time. This H2 gas acts as a reducing agent to convert the Ta5+ states to form Ta4+ and/or Ta3+, which are proposed to act as electrons trapping centres. This notion is in agreement with a previous report demonstrating the formation of reduced Ta vacancies using synchrotron-excited X-ray photoelectron spectroscopy (XPS).39 Similarly, the formation of nitrogen  vacancies which are associated to hole trapping centres becomes inevitable, particularly for nitridation time exceeding 0.25 hour. Maintaining the ideal Ta3N5 stoichiometric ratio via synchronous substitution of nitrogen to oxygen (present in Ta precursor) is the key to control the defect formation.
Based on the conclusions drawn from Fig. 5, the formation of both electron and hole trapping centres within the bandgap of Ta3N5 is pronounced with an increase in the nitridation time. The efficiency of charge transport from the bulk to the surface is negatively affected by carrier trapping. As a consequence, inefficient electron transfer to the Rh cocatalyst is observed and the number of free carriers available at the surface of Ta3N5 for photocatalytic reaction will be reduced. Due to these two combined effects, the efficiency of OWS is found to be reduced with increase in the nitridation time from 0.25 to 10 hour (Scheme 2). From our previous STEM study, the location of charge trapping defects in long time (>0.25 hour) nitrided Ta3N5 is found to be predominantly on the surface of Ta3N5.19 Hence, removing these surface defect states either by chemical treatment or by surface modification may further enhance the efficiency of OWS activity for long-time nitrided Ta3N5. A future work is necessary to unravel the electronic nature of the bulk and surface defect states in detail.
2.3 How to further enhance the OWS activity of Ta3N5 (0.25 hour nitrided from KTaO3) under the visible light?
The AQE value at 500 nm is ten times smaller compared to 420 nm.19 Hence, one of the challenges is to enhance the AQE under visible light excitation. To discern whether the low AQE in visible light is due to inefficient charge generation, free electron dynamics (3435 nm probe) is compared between 580 and 440 nm excitation (Fig. S17†). At 580 nm excitation, a similarity in terms of both carrier lifetime and pump fluence dependence is noticed to that of 440 nm pump. In addition, electron transfer to the Rh cocatalyst is also noticed at 580 nm pump (Fig. S18†). Besides that, Ta3N5 is widely considered to have an indirect bandgap. Note that 580 nm pump is very close to the band edge of the Ta3N5, however, neither free electron lifetime nor electron photogeneration is affected. Hence, indirect bandgap nature of the Ta3N5 does not sufficiently explain the lower activity under the visible light excitation. Alternatively, the absorption coefficient value of Ta3N5 at 530 nm is lower by a factor of five compared to 400 nm.31,40,41 Upon 0.25 hour nitridation of KTaO3, the actual amount of Ta3N5 phase formed on KTaO3 is ≈2%.19 Thus, a low AQE in the visible region is attributed to a combination of the lower absorption coefficient and the presence of only 2% of Ta3N5 which can potentially absorb visible light, but not due to inefficient charge photogeneration. Thus, increasing the effective density of Ta3N5 on KTaO3 is expected to further improve the AQE under visible light excitation. To this end, multiple nitridation of KTaO3 (while keeping the nitridation time as 0.25 hour) to expose the unreacted KTaO3 surface in the direction of NH3 flow forms one of the approaches.3. Conclusions
A detailed ultrafast TAS study allowed us to elucidate a correlation between the synthesis procedure – structural defects – carrier dynamics – efficiency of OWS. Selectively probing the dynamics of electrons and holes allowed us to develop a phenomenological model that describes the role of Ta precursor employed to prepare Ta3N5 and the effect of nitridation time in the context of OWS.In addition to H2 evolution being fundamentally low compared to O2, the OWS has not been realized for Ta3N5 prepared by nitriding Ta2O5. The answer to this longstanding question was found to originate from the absence of electron transfer to the Rh cocatalyst by the virtue of efficient electron trapping.
When Ta3N5 is prepared by employing KTaO3 as a Ta precursor for nitridation reaction, OWS was observed for the first time. For 0.25 hour nitrided Ta3N5, which shows the highest OWS activity, charge carriers decayed by second-order type electron–hole recombination but not by trapping. Due to single-crystal and defect-free nature of 0.25 hour nitrided Ta3N5, efficient migration of both electrons and holes towards the surface was achieved. Thus, to realize OWS, avoiding carrier trapping process was found to be indispensable.
When the nitridation time of KTaO3 was increased from 0.25 to 10 hour, the efficiency of OWS reduced by a factor of approximately five. This was attributed to the formation of defects which promoted both electron and hole trapping eventually affecting the efficient migration of charge carriers to the surface. These transient optical studies yielded key insights into the factors determining the efficiency of solar driven OWS by Ta3N5.
4. Experimental section
4.1 Synthesis of Ta3N5 by the nitridation of KTaO3
KTaO3 particles were fabricated by a conventional solid-state reaction method. Ta2O5 (99.9%; Kojundo Chemical Laboratory Co., Ltd.) and K2CO3 (99.5%; Kanto Chemical Co., Inc.) were mixed at a Ta![[thin space (1/6-em)]](https://www.rsc.org/images/entities/char_2009.gif) :
:![[thin space (1/6-em)]](https://www.rsc.org/images/entities/char_2009.gif) K molar ratio of 1
K molar ratio of 1![[thin space (1/6-em)]](https://www.rsc.org/images/entities/char_2009.gif) :
:![[thin space (1/6-em)]](https://www.rsc.org/images/entities/char_2009.gif) 1.05. Excess K was added to compensate for losses by volatilization at high temperatures. The mixture was thoroughly ground in an agate mortar for 90 min in the presence of a small amount of ethanol as a dispersant. After drying, the resulting mixture was transferred into an alumina crucible and calcined at 1173 K for 1 hour and then at 1423 K for 10 hour in static air. The KTaO3 obtained in this manner was washed with ultrapure water at 343 K for 2 hour and centrifuged twice to remove any residual K2CO3. The powder was then completely dried by heating at 343 K overnight. Subsequently, the as-prepared KTaO3 was subjected to a nitridation process to obtain Ta3N5 grown on KTaO3. KTaO3 (0.5 g) was transferred into an alumina tube and nitrided at 1173 K for 0.25, 4 and 10 hour under a flow of NH3 gas at 100 mL min−1.
1.05. Excess K was added to compensate for losses by volatilization at high temperatures. The mixture was thoroughly ground in an agate mortar for 90 min in the presence of a small amount of ethanol as a dispersant. After drying, the resulting mixture was transferred into an alumina crucible and calcined at 1173 K for 1 hour and then at 1423 K for 10 hour in static air. The KTaO3 obtained in this manner was washed with ultrapure water at 343 K for 2 hour and centrifuged twice to remove any residual K2CO3. The powder was then completely dried by heating at 343 K overnight. Subsequently, the as-prepared KTaO3 was subjected to a nitridation process to obtain Ta3N5 grown on KTaO3. KTaO3 (0.5 g) was transferred into an alumina tube and nitrided at 1173 K for 0.25, 4 and 10 hour under a flow of NH3 gas at 100 mL min−1.
4.2 Synthesis of Ta3N5 by the nitridation of Ta2O5
The commercially available Ta2O5 (99.9%; Kojundo Chemical Laboratory Co., Ltd.) was subjected to the nitridation at 1173 K for 20 hours under a flow of NH3 gas at 100 mL min−1.4.3 Photodeposition of a Rh cocatalyst on Ta3N5
A Rh cocatalyst for H2 evolution was loaded on Ta3N5 photocatalysts by a previously-reported photodeposition process.19 A Rh core was photodeposited using RhCl3·3H2O (Kanto Chemical Co., Inc.) as the metal precursor. This was accomplished by dispersing the photocatalyst powder in 150 mL of an aqueous methanol solution (10 vol%) containing the metal precursor. The pH of this solution was not adjusted but the temperature was maintained at 288 K by circulating cooling water. The suspension was evacuated to completely remove dissolved air and then exposed to visible light (λ ≥ 420 nm) with continuous stirring. The photodeposition of Rh was conducted approximately for 3 hours.4.4 Femtosecond time-resolved diffuse reflectance (TDR) spectroscopy
In fs-transient diffuse reflectance (fs-TDR) measurements, a femtosecond Ti:sapphire laser with a regenerative amplifier (Spectra-Physics, Solstice, wavelength of 800 nm, pulse width of 100 fs, pulse energy of 3.5 mJ per pulse, and repetition rate of 1 kHz) was used as a light source. The output from the laser was split into four paths for the excitation of two optical parametric amplifiers (OPAs: Spectra-Physics, TOPAS Prime), the white-light-continuum generation by focusing the fundamental light (800 nm) into a sapphire plate, and the second and third harmonic generations of the fundamental light (800 nm) by using BBO (β-BaB2O4) crystals. For generating the 440 or 580 nm pump pulse, light from one of the OPA was used. For the probe pulse, a white light continuum covering from 500 nm to 1600 nm and a 3435 nm probe light generated from the other OPA with a difference-frequency generation crystal was used. The time resolution of the system was about 140 fs. The powder samples are taken in 1 mm quartz cuvettes. The diameter of the pump beam on the sample was about 0.5 mm as observed with a charge-coupled-device (CCD) camera. Amplified Si photodetector is used to measure the TA spectra in the visible region. Liquid-nitrogen-cooled mercury-cadmium-telluride (HgCdTe) photodetector is used for IR probe (3435 nm) experiments. The diffusely reflected light from the sample was passed through a grating monochromator (Princeton Instruments, Acton SP2150) for data acquisition. The transient absorption intensity of the TDR measurements is presented as percentage absorption, where absorption (%) = 100(1 − R/R0), using R and R0 as the intensities of the diffusely reflected light with and without excitation, respectively. A more detailed description of the fs-TDR setup is available elsewhere.42,434.5 X-ray photoelectron spectroscopy (XPS)
The XPS spectra were obtained using X-ray photoelectron ULVAC-PHI, INC PHI Quantera 2 spectrometer.Conflicts of interest
There are no conflicts of interest to declare.Acknowledgements
This work is supported by the “Research Project for Future Development: Artificial Photosynthetic Chemical Process (ARPChem)” (METI/NEDO, Japan: 2012-2022).References
- M. G. Walter, E. L. Warren, J. R. McKone, S. W. Boettcher, Q. X. Mi, E. A. Santori and N. S. Lewis, Chem. Rev., 2010, 110, 6446–6473 CrossRef CAS PubMed
.
- X. B. Chen, S. H. Shen, L. J. Guo and S. S. Mao, Chem. Rev., 2010, 110, 6503–6570 CrossRef CAS PubMed
.
- F. E. Osterloh, Chem. Soc. Rev., 2013, 42, 2294–2320 RSC
.
- Q. Wang, T. Hisatomi, Q. X. Jia, H. Tokudome, M. Zhong, C. Z. Wang, Z. H. Pan, T. Takata, M. Nakabayashi, N. Shibata, Y. B. Li, I. D. Sharp, A. Kudo, T. Yamada and K. Domen, Nat. Mater., 2016, 15, 611–615 CrossRef CAS PubMed
.
- T. Yamada and K. Domen, ChemEngineering, 2018, 2, 36, DOI:10.3390/chemengineering2030036
.
- T. Hisatomi, J. Kubota and K. Domen, Chem. Soc. Rev., 2014, 43, 7520–7535 RSC
.
- A. Kudo and Y. Miseki, Chem. Soc. Rev., 2009, 38, 253–278 RSC
.
- Q. Wang, T. Hisatomi, M. Katayama, T. Takata, T. Minegishi, A. Kudo, T. Yamada and K. Domen, Faraday Discuss., 2017, 197, 491–504 RSC
.
- D. M. Fabian, S. Hu, N. Singh, F. A. Houle, T. Hisatomi, K. Domen, F. E. Osterlohf and S. Ardo, Energy Environ. Sci., 2015, 8, 2825–2850 RSC
.
- E. Nurlaela, A. Ziani and K. Takanabe, Mater. Renew. Sustain. Energy, 2016, 5, 18, DOI:10.1007/s40243-40016-40083-z
.
- C. Zhen, R. Z. Chen, L. Z. Wang, G. Liu and H. M. Cheng, J. Mater. Chem. A, 2016, 4, 2783–2800 RSC
.
- G. J. Liu, S. Ye, P. L. Yan, F. Q. Xiong, P. Fu, Z. L. Wang, Z. Chen, J. Y. Shi and C. Li, Energy Environ. Sci., 2016, 9, 1327–1334 RSC
.
- X. J. Feng, T. J. LaTempa, J. I. Basham, G. K. Mor, O. K. Varghese and C. A. Grimes, Nano Lett., 2010, 10, 948–952 CrossRef CAS PubMed
.
- M. Harb, P. Sautet, E. Nurlaela, P. Raybaud, L. Cavallo, K. Domen, J. M. Basseta and K. Takanabe, Phys. Chem. Chem. Phys., 2014, 16, 20548–20560 RSC
.
- W. J. Chun, A. Ishikawa, H. Fujisawa, T. Takata, J. N. Kondo, M. Hara, M. Kawai, Y. Matsumoto and K. Domen, J. Phys. Chem. B, 2003, 107, 1798–1803 CrossRef CAS
.
- M. Zhong, T. Hisatomi, Y. Sasaki, S. Suzuki, K. Teshima, M. Nakabayashi, N. Shibata, H. Nishiyama, M. Katayama, T. Yamada and K. Domen, Angew. Chem., Int. Ed., 2017, 56, 4739–4743 CrossRef CAS PubMed
.
- Y. W. Wang, D. Z. Zhu and X. X. Xu, ACS Appl. Mater. Interfaces, 2016, 8, 35407–35418 CrossRef CAS PubMed
.
- T. H. Chiang, H. Lyu, T. Hisatomi, Y. Goto, T. Takata, M. Katayama, T. Minegishi and K. Domen, ACS Catal., 2018, 8, 2782–2788 CrossRef CAS
.
- Z. Wang, Y. Inoue, T. Hisatomi, R. Ishikawa, Q. Wang, T. Takata, S. Chen, N. Shibata, Y. Ikuhara and K. Domen, Nat. Catal., 2018, 1, 756–763 CrossRef
.
- X. Liu, L. Zhao, K. Domen and K. Takanabe, Mater. Res. Bull., 2014, 49, 58–65 CrossRef CAS
.
- M. Xiao, B. Luo, M. Q. Lyu, S. C. Wang and L. Z. Wang, Adv. Energy Mater., 2018, 8, 8 Search PubMed
.
- S. S. Chen, Y. Qi, Q. Ding, Z. Li, J. Y. Cui, F. X. Zhang and C. Li, J. Catal., 2016, 339, 77–83 CrossRef CAS
.
- K. Maeda, N. Nishimura and K. Domen, Appl. Catal., A, 2009, 370, 88–92 CrossRef CAS
.
- Y. Suzuki, D. H. K. Murthy, H. Matsuzaki, A. Furube, Q. Wang, T. Hisatomi, K. Domen and K. Seki, J. Phys. Chem. C, 2017, 121, 19044–19052 CrossRef CAS
.
- S. R. Pendlebury, X. L. Wang, F. Le Formal, M. Cornuz, A. Kafizas, S. D. Tilley, M. Gratzel and J. R. Durrant, J. Am. Chem. Soc., 2014, 136, 9854–9857 CrossRef CAS PubMed
.
- R. B. Singh, H. Matsuzaki, Y. Suzuki, K. Seki, T. Minegishi, T. Hisatomi, K. Domen and A. Furube, J. Am. Chem. Soc., 2014, 136, 17324–17331 CrossRef CAS PubMed
.
- A. Furube, T. Asahi, H. Masuhara, H. Yamashita and M. Anpo, J. Phys. Chem. B, 1999, 103, 3120–3127 CrossRef CAS
.
- R. Godin, Y. Wang, M. A. Zwijnenburg, J. W. Tang and J. R. Durrant, J. Am. Chem. Soc., 2017, 139, 5216–5224 CrossRef CAS PubMed
.
- D. H. K. Murthy, H. Matsuzaki, Q. Wang, Y. Suzuki, K. Seki, T. Hisatomi, T. Yamada, A. Kudo, K. Domen and A. Furube, Sustainable Energy Fuels, 2019, 3, 208–218 RSC
.
- T. Jing, Y. Dai, X. C. Ma, W. Wei and B. B. Huang, RSC Adv., 2015, 5, 59390–59397 RSC
.
- B. A. Pinaud, P. C. K. Vesborg and T. F. Jaramillo, J. Phys. Chem. C, 2012, 116, 15918–15924 CrossRef CAS
.
- B. A. Pinaud, A. Vailionis and T. F. Jaramillo, Chem. Mater., 2014, 26, 1576–1582 CrossRef CAS
.
- J. J. Wang, A. B. Ma, Z. S. Li, J. H. Jiang, J. Y. Feng and Z. G. Zou, Phys. Chem. Chem. Phys., 2015, 17, 23265–23272 RSC
.
- J. J. M. Vequizo, M. Hojamberdiev, K. Teshima and A. Yamakata, J. Photochem. Photobiol., A, 2018, 358, 315–319 CrossRef CAS
.
- A. Yamakata, J. J. M. Vequizo and M. Kawaguchi, J. Phys. Chem. C, 2015, 119, 1880–1885 CrossRef CAS
.
- E. Nurlaela, Y. Sasaki, M. Nakabayashi, N. Shibata, T. Yamada and K. Domen, J. Mater. Chem. A, 2018, 6, 15265–15273 RSC
.
- J. J. Wang, A. B. Ma, Z. S. Li, J. H. Jiang, J. Y. Feng and Z. G. Zou, Phys. Chem. Chem. Phys., 2015, 17, 8166–8171 RSC
.
- A. Ziani, E. Nurlaela, D. S. Dhawale, D. A. Silva, E. Alarousu, O. F. Mohammed and K. Takanabe, Phys. Chem. Chem. Phys., 2015, 17, 2670–2677 RSC
.
- S. Khan, M. J. L. Santos, C. F. Malfatti, J. Dupont and S. R. Teixeira, Chem.–Eur. J., 2016, 22, 18501–18511 CrossRef CAS PubMed
.
- J. M. Morbec, I. Narkeviciute, T. F. Jaramillo and G. Galli, Phys. Rev. B: Condens. Matter Mater. Phys., 2014, 90, 10 CrossRef
.
- H. Hajibabaei, O. Zandi and T. W. Hamann, Chem. Sci., 2016, 7, 6760–6767 RSC
.
- T. Asahi, A. Furube, H. Fukumura, M. Ichikawa and H. Masuhara, Rev. Sci. Instrum., 1998, 69, 361–371 CrossRef CAS
.
- A. Furube, Z. S. Wang, K. Sunahara, K. Hara, R. Katoh and M. Tachiya, J. Am. Chem. Soc., 2010, 132, 6614–6615 CrossRef CAS PubMed
.
Footnote |
| † Electronic supplementary information (ESI) available. See DOI: 10.1039/c9sc00217k |
| This journal is © The Royal Society of Chemistry 2019 |

