 Open Access Article
Laboratory of the future: a modular flow platform with multiple integrated PAT tools for multistep reactions†
Peter
Sagmeister
ab,
Jason D.
Williams
 ab,
Christopher A.
Hone
 ab and
C. Oliver
Kappe
 *ab
*ab
aCenter for Continuous Synthesis and Processing (CCFLOW), Research Center Pharmaceutical Engineering (RCPE), Inffeldgasse 13, 8010 Graz, Austria
bInstitute of Chemistry, University of Graz, NAWI Graz, Heinrichstrasse 28, A-8010 Graz, Austria. E-mail: oliver.kappe@uni-graz.at
First published on 8th April 2019
Abstract
Currently, the monitoring of multistep continuous flow processes by multiple analytical sources is still seen as a resource intensive and specialized activity. In this article, the coupling of a modular microreactor platform with real-time monitoring by inline IR and NMR, in addition to online UPLC, is described. Using this platform, we rapidly generated experimental data (17 iterations in under 2 hours) to access information on the different chemical species at multiple points within the reactor and to generate process understanding. We highlight the application of the platform in the optimization of a multistep organolithium transformation. The optimized continuous flow conditions were demonstrated in a scale-out experiment with in-process monitoring to afford the desired product in 70% isolated yield and provided a throughput of 4.2 g h−1.
Introduction
In recent years, emerging technologies for reaction data acquisition, processing and control have started to transform pharmaceutical process development into an increasingly data-rich area of science.1 Pharmaceutical manufacturers have begun adopting the ethos of “Industry 4.0”, whereby simulation, system integration and the generation of large datasets are key enablers for a greater focus on quality, safety, cost effectiveness and sustainability.2 Fully embracing these technological advancements promises significant improvements in terms of the speed and reliability by which chemical processes are developed and performed. The recent Quality by Design (QbD) initiative from pharmaceutical regulatory authorities encourages manufacturers to design and control processes based on having thorough reaction understanding.3 Critical to this initiative is the real-time acquisition of data for chemical process development and in-process monitoring by process analytical technology (PAT).4There is a current paradigm shift in the pharmaceutical industry from traditional batch manufacturing to continuous processing for the preparation of active pharmaceutical ingredients (APIs),5 which has been supported by the increased availability and implementation of PAT.6 Recent reviews have highlighted the successful implementation of PAT within continuous flow environments.7 PAT has been utilized within continuous flow systems for enabling feedback loops for process control,8 black box optimization such as Design of Experiments (DoE) and automated self-optimization,9 kinetic model discrimination and parameter estimation,10 and to guide drug discovery programmes.11 The most commonly used real-time inline PAT tools are UV/Vis,12 Raman,13 IR,14 and NMR.15 Recently, their use has become more popular, partly due to increased commercial availability of benchtop devices and flow-through cells. In addition, the utilization of integrated chromatographic analysis techniques, such as high/ultra performance liquid chromatography (HPLC/UPLC),16 and GC,17 within continuous flow platforms has also been described.18 However, in these instances additional sample preparation is often required before sample injection. It is still commonplace to perform all of these analytical techniques offline, within both academic and industrial laboratories.19 In these cases, time is wasted with sample preparation and the analyzed sample is not always representative of the reaction performance. Processes which utilize real-time analysis will lead to a faster and often more reliable process optimization as compared to cases using only offline analysis.
The aforementioned examples demonstrate that the integration of a single analytical instrument within a continuous flow system for analysis of a single-step reaction is now well established within the continuous processing community. However, a key benefit of flow chemistry is the ability to perform complex multistep transformations within an integrated continuous flow system without manual intervention.20 Currently, there is limited precedent for combining different reactor modules and analytics without interruption into a fully integrated continuous process. Continuous flow technology is often inflexible and compatibility issues arise between different steps. Reaction analysis at multiple points within a continuous flow system by different techniques is vital for expeditious parameter optimization and effective control over process performance to fully realize multistep transformations. Existing studies of multistep continuous flow transformations generally use different PAT instruments in separated continuous flow steps.21
Carefully designed continuous flow reactors have been shown to bestow significant benefits for improving reaction performance in a variety of systems; particularly those which are mixing sensitive, highly exothermic, or involve short-lived intermediates.22 Accordingly, modular reactor systems consisting of multiple discrete units are most suited to these applications, since each “module” can be optimized to suit the required chemistry and reconfigured to fit a myriad of different reaction systems.23
Significant improvements can be observed for reactions using organometallic reagents performed within microreactor systems due to their enhanced heat and mass transfer characteristics,24 but organometallic reagents can pose significant processing challenges caused by moisture sensitivity and solid formation within the reactor channels.25 In a batch reactor, this type of reaction is generally conducted at cryogenic temperatures, but flow processing can be tolerant of higher temperatures.26 Our current research interests led us to investigate the integration of multiple PAT instruments (IR, NMR and UPLC) within a modular flow reactor system for the monitoring of a challenging multistep organometallic transformation.
Results and discussion
Model reaction and reactor system
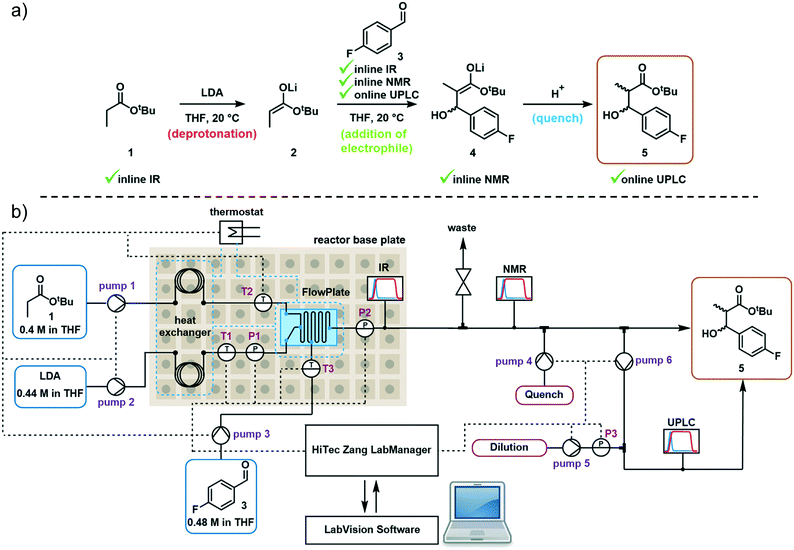
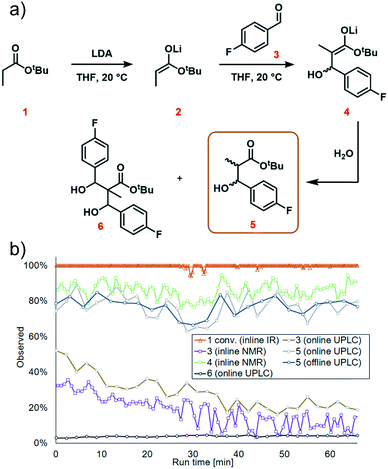
The first step in the model reaction is the generation of enolate 2 by deprotonation of tert-butyl propionate 1 with lithium diisopropylamide (LDA) (Fig. 1a). The enolate 2 is then reacted with 4-fluorobenzaldehyde 3 to generate the metallated intermediate 4. A subsequent in situ quench with water affords the desired product 5. This type of chemistry is widely used in target-oriented synthesis, including that of medicinally relevant compounds.27The continuous flow setup utilized a Modular MicroReaction System (MMRS) equipped with a Lonza FlowPlate® Lab reactor, manufactured by Ehrfeld Mikrotechnik.28 The system is designed to be reconfigured for use in multiple distinct applications, but can also be scaled up in a facile manner.28e,f Initially, a FlowPlate reactor with a minimum diameter of 0.2 mm and total volume 0.44 mL was used in this study. In the flow setup (Fig. 1b) four syringe pumps (HiTec Zang SyrDos2) were used to introduce the feed solutions. Feed solutions were comprised of: (1) 0.4 M solution of substrate 1 and internal standard (biphenyl) in THF, (2) 0.44 M solution of LDA in THF,29 (3) 0.48 M solution of 4-fluorobenzaldehyde 3 in THF, and (4) water. Substrate 1 and LDA solutions were mixed first to form the enolate 2 within the FlowPlate, with a residence time of approximately 5 seconds. Subsequently, the aldehyde 3 solution was introduced into the FlowPlate, reacting for an additional 80 seconds prior to the quench. The residence time for the quench corresponded to approximately 18 seconds. The effluent from the FlowPlate was passed through an IR flow-through cell (Ehrfeld Mikrotechnik) for inline IR analysis (ReactIR 15 DiComp probe, Mettler-Toledo). The reaction mixture was then passed through an inline flow cell (0.8 mL internal volume) for monitoring by a benchtop NMR spectrometer (Spinsolve Ultra 43 MHz, Magritek). Water was then introduced to quench the reaction mixture and the outlet mixture was collected. UPLC analysis was conducted online after the introduction of water and offline by sampling the fractionated reactor output. In the case of online analysis, a subsample of process stream was diverted and then diluted by H2O/MeCN. Subsequently an internal 6-port valve (2.6 μL injection volume) injected aliquots of the diluted stream onto the LC column. The pumps and sensors within the continuous flow setup were connected to a HiTec Zang LabManager unit and controlled by LabVision software.
Monitoring deprotonation using inline IR
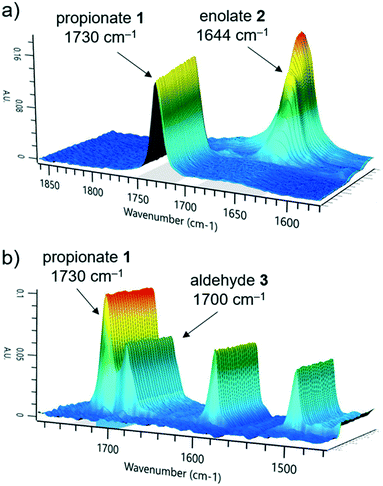
The first reaction step involves the formation of enolate intermediate 2, via irreversible deprotonation by LDA. As demonstrated in numerous examples, ReactIR is known to be a suitable method for quantification of enolate formation, by observing the disappearance of the distinctive carbonyl signal.30 The IR probe was integrated into the modular flow reactor system by means of an adaptor, functioning as a small volume flow-through cell (ESI† Fig. S10). When using this type of cell, precautions must be taken to prevent bubble accumulation on the probe tip. In the event of trapped air, high flow rates (>10 mL min−1) must be used to restore standard analytical function.Initial tests confirmed the expected suitability of the analytical device for this purpose, where the tert-butyl propionate starting material 1 was observed (C![[double bond, length as m-dash]](https://www.rsc.org/images/entities/char_e001.gif) O stretch at 1730 cm−1). Introduction of the LDA stream induced complete deprotonation, even at the shortest attempted residence time of 3.9 seconds (ESI† Table S1). A concentration vs. response curve of propionate 1 revealed its limit of quantification to be around 10% of the initial concentration used, implying a degree of confidence in the successful deprotonation of >90% starting material, throughout the course of reaction monitoring. Although the enolate 2 could also be observed (1644 cm−1, Fig. 2a), its quantification in the acquisition rate of 15 seconds allows for timely parameter correction in the event of any process disturbance.
O stretch at 1730 cm−1). Introduction of the LDA stream induced complete deprotonation, even at the shortest attempted residence time of 3.9 seconds (ESI† Table S1). A concentration vs. response curve of propionate 1 revealed its limit of quantification to be around 10% of the initial concentration used, implying a degree of confidence in the successful deprotonation of >90% starting material, throughout the course of reaction monitoring. Although the enolate 2 could also be observed (1644 cm−1, Fig. 2a), its quantification in the acquisition rate of 15 seconds allows for timely parameter correction in the event of any process disturbance.
We observed that the electrophile, 4-fluorobenzaldehyde 3, had a similar C![[double bond, length as m-dash]](https://www.rsc.org/images/entities/char_e001.gif) O stretch at 1700 cm−1 (Fig. 2b), showing partial overlap with the propionate 1 peak. Nevertheless, it was possible to treat these in isolation and obtain a concentration of both components, by comparison of the peak height versus a two-point baseline. Following reaction with electrophile 3, no additional carbonyl stretch was observed, indicating that the deprotonated intermediate was lithium enolate 4, rather than the analogous lithium alkoxide species. This had the implication that quantification of 4 could not be achieved at this stage due to multiple overlapping signals, but instead required an alternative analytical technique.
O stretch at 1700 cm−1 (Fig. 2b), showing partial overlap with the propionate 1 peak. Nevertheless, it was possible to treat these in isolation and obtain a concentration of both components, by comparison of the peak height versus a two-point baseline. Following reaction with electrophile 3, no additional carbonyl stretch was observed, indicating that the deprotonated intermediate was lithium enolate 4, rather than the analogous lithium alkoxide species. This had the implication that quantification of 4 could not be achieved at this stage due to multiple overlapping signals, but instead required an alternative analytical technique.
Monitoring electrophile addition using inline NMR
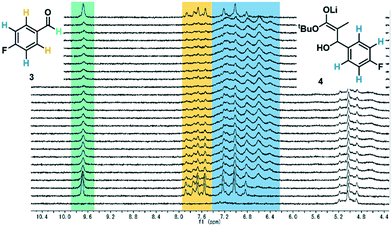
After exiting the IR flow cell, the extent of reaction with the electrophile 3 could be assessed using a benchtop NMR, equipped with a glass flow-through cell (volume = 0.8 mL, ESI† Fig. S15). To enable effective real-time reaction monitoring, the data acquisition period, regulated in this case by the number of scans, must be minimized. Accordingly, very good separation of signals is required. Initially it was intended that 19F NMR could be used as a straightforward and quantitative method of measuring conversion of electrophile 3 to the product enolate 4. The level of noise in the baseline for these measurements, however, meant that at this reaction concentration (0.13 M), the two species could not be quantified with a sufficient degree of accuracy (ESI† Fig. S17).Instead, 1H NMR was utilized, with 4 scans per data point, which resulted in a relatively fast acquisition time of 43 seconds. Herein, the aldehyde peak of the electrophile 3 (9.7 ppm) was sufficiently separated from all other reaction components. Furthermore, one set of aryl peaks from the aldehyde 3 could be distinguished from those of intermediate 4, meaning that product quantification was also possible in this manner (Fig. 3), and was found to provide similar results compared to those based on the aldehyde proton (ESI† Fig. S18).
Monitoring final reaction composition by online UPLC
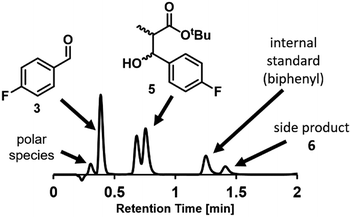
Chromatographic analytical methods, by their nature, provide less time-precise data than inline methods. However, the key advantage of chromatographic techniques is that components are separated prior to analysis by a detector, thus providing a detailed overview of final product composition. As evidenced by the significant amount of work invested into developing reproducible and transferrable equipment for liquid chromatography sample preparation,19a integrating this type of online analysis is not a trivial task. In order to achieve “real-time” data as far as possible, high sample throughput was required. This high throughput analysis was possible through the utilization of UPLC, wherein excellent compound separation was achieved whilst maintaining rapid chromatographic runs.To enable sample injections in quick succession, an isocratic elution method was developed, obviating any column equilibration between injections.31 With a trifluoroacetic acid-modified solvent system, clear separation of the aldehyde starting material 3 and desired product 5 could be achieved within 1 minute. Indeed, this method was even found to be sufficient to give some separation between the two product diastereomers, bestowing an additional level of analytical detail (Fig. 4). Within the present study, the diastereomeric ratio was observed to be 1![[thin space (1/6-em)]](https://www.rsc.org/images/entities/char_2009.gif) :
:![[thin space (1/6-em)]](https://www.rsc.org/images/entities/char_2009.gif) 1.2 for all experiments, but this analytical method could also be used in studies aiming to achieve a different ratio. The analysis time was increased to 2 minutes to allow the inclusion of an internal standard (biphenyl), detection of a less polar side product 6, and to ensure that there was no carryover between injections.
1.2 for all experiments, but this analytical method could also be used in studies aiming to achieve a different ratio. The analysis time was increased to 2 minutes to allow the inclusion of an internal standard (biphenyl), detection of a less polar side product 6, and to ensure that there was no carryover between injections.
The higher sensitivity of UPLC means that it also tolerates a far lower analyte concentration compared to traditional HPLC methods.31 Despite the use of a small volume sample loop (2.6 μL, ESI† Fig. S26), significant further dilution was required to reach a suitable concentration. Method development using the autosampler showed that injections of 3 nmol were acceptable, implying that a dilution factor of ∼100 from the process stream was required. Multiple solutions to this challenge were explored (ESI† section 2.9), but the most reliable was deemed to be the use of a low volume piston (HPLC) pump to continuously sub-sample the process stream, followed by an additional dilution pump (Fig. 5). When paired with an internal standard, this method enabled accurate analysis, providing results every 2 minutes which were found to be equivalent to those obtained by offline analysis (ESI† Fig. S35). Due to the low flow rate of this subsample stream (0.02 mL min−1), the relatively small volume between the process stream and UPLC injection caused a major delay in obtaining representative data. Thus, a “flush” script was incorporated between injections (ESI† Fig. S23), to increase the flow rate for a short time and ensure that sample injections were representative of the process stream.
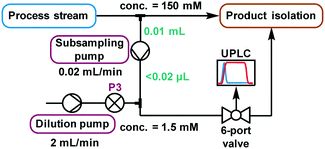 | ||
| Fig. 5 A schematic representation of the continuous subsampling and dilution setup used for online UPLC analysis, via automated sample injections. | ||
Pressure and pumping stability
Upon operating the reactor system for an extended period, setbacks were caused by inconsistent delivery of reagents, whereby the IR trace displayed pulses allowing up to 50% propionate starting material 1 to remain (ESI† Fig. S4). When crosschecking the IR data with the pressure profile, it was found that this timing matched to the pump syringe interchanges. The pump performance was measured by a Coriolis mass flow controller to allow fine tuning of the pump parameters (ESI† Fig. S3). The ideal values were found to be different in the case of each individual pump, but provided pulsation-free operation once corrected.Furthermore, analysis of pressure readings taken during operation revealed an unstable profile (ESI† Fig. S7), whereby the pressure was observed in some cases to increase by over 20 bar, due to partial channel blockages. We propose that the blockages were caused by lithium salt precipitation. In most cases, the resulting increase in pressure relieved the blockage after some time, restoring the system pressure to a normal level. Nevertheless, partial blockages are detrimental to long-term reaction stability, accelerating pump wear, but also restricting reagent flow and inhibiting mixing. Eventually, complete blockages will occur and require temporary shutdown of the process. In a manufacturing environment this type of failure could require diversion of vast amounts of material to waste (particularly during the process restart phase), resulting in supply chain complications and loss of capital.
For all subsequent experiments a reactor plate with wider channels (0.5 mm minimum diameter) and larger volume (1.63 mL) was installed (ESI† Fig. S6). Within this reactor configuration, the residence time for the deprotonation changed to approximately 11 seconds and there was an additional 99 seconds after the addition of the electrophile prior to the quench. The residence time for the quench was approximately 18 seconds. With this new reactor plate, no further blockage issues were observed, resulting in a stable pressure profile.
Reaction optimization experiments
With the incorporation of all three PAT instruments it was envisaged that the large volume of data would enable optimization of reaction parameters within a short period. This was initiated as a one-factor-at-a-time study, examining the effect of reaction temperature (0–40 °C), aldehyde 3 loading (1–1.2 equiv.) and LDA loading (1–1.2 equiv.).The process was found to operate most favorably at 20 °C. Warming to 40 °C was anticipated to improve solubility of lithium salts and reduce the likelihood of precipitation, but had a detrimental effect on product 5 formation. Operation of organometallic reactions, which usually require cryogenic conditions in batch, at closer to ambient temperature has been demonstrated to have the potential to save significant quantities of energy when considered on an industrial scale.32
Subsequently, the responses from the optimization experiments were fitted to polynomials models using a statistical experimental design software package (Modde v11). Models were fitted from the NMR and UPLC data for both aldehyde 3 and desired product 5 by using multiple linear regression (ESI† section 3). Models were generated by including all main, square and interaction terms and then non-significant terms were removed. A good fit was achieved for all the models with R2 values of 0.74 (3, NMR), 0.89 (3, UPLC), 0.93 (5, NMR) and 0.84 (5, UPLC). These models also showed a moderate to good level of predictability with Q2 values of 0.50 (3, NMR), 0.79 (3, UPLC), 0.66 (5, NMR) and 0.66 (5, UPLC). Aldehyde 3 equivalents were demonstrated to have no influence on the desired product 5 yield over the range of equivalents explored. Increasing LDA equivalents was shown to have positive influence on the product 5 yield. A negative squared term for the effect of temperature was observed, describing the increase in yield of 5 from 0 to 20 °C and the decrease from 20 to 40 °C. A model was also successfully fitted for side product formation based on using the UPLC data (ESI† Fig. S39). The models were subsequently used to explore the experimental design space (Fig. 6).
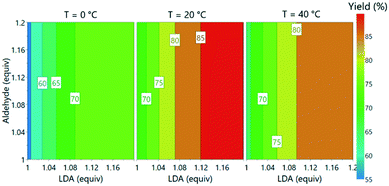 | ||
| Fig. 6 Contour plot of predicted product yields from model fitted using the experimental data from offline UPLC analysis. | ||
Scale-out synthesis with in-process monitoring
We next turned our attention to exemplifying the in-process monitoring capabilities of the reactor platform and demonstrating the stability of the system over a prolonged operation time. We selected 20 °C, 1.2 equiv. aldehyde and 1.1 equiv. LDA as the conditions for the scale-out run. For full experimental details, see ESI† page S35. We decided to implement conditions which were sub-optimal because we wanted to demonstrate process monitoring for all chemical species, thus we used conditions where aldehyde 3 and the side product 6 were present in the system. After around 30 minutes, a dark color was observed at the mixing point of LDA with tert-butyl propionate 1 in the FlowPlate (ESI† Fig. S42). This appearance could be explained by “gumming”, which is a known phenomenon in organometallic reactions in flow and can be tolerated indefinitely, provided there is no further disturbance.33 Although this was observed to grow in size over time, it had no effect on the extent of deprotonation observed at the IR probe. Furthermore, the additional information obtained by sensors positioned throughout the reactor system illustrated a stable process, with no significant changes in temperature or pressure.Complete deprotonation of the ester 1 was observed across almost the entire reaction period, implying that reagent delivery was consistent with negligible influence of any flow rate variation (Fig. 7b, red line). When two brief disturbances were observed (at 29 and 32 min), a 5% decrease in the extent of ester 1 deprotonation caused a 10% reduction in yield for a period of almost 10 minutes. This significant effect caused by such a minor deviation emphasizes the sensitivity of the process to minor changes, and the power of real-time reaction monitoring.
UPLC analysis showed a 70–85% yield of desired product 5 throughout the duration of the experiment (Fig. 7b, green line), corresponding well with the predicted values from the previously generated polynomial models. NMR monitoring, however, provided a consistently higher value of 85–90% for enolate 4. This discrepancy is thought to arise from the poor differentiation between desired intermediate 4versus side product 6 by NMR. This side product arises from addition of the product enolate 4 to a second molecule of electrophile (ESI† section 4.2), and its increase throughout the reaction corresponds with a decrease in aldehyde 3. This highlights the power of UPLC as a quantitative analytical technique, for its resolution between numerous chemical species. Despite the discrepancy in absolute values, the observed trends by both techniques were essentially identical, providing further confidence in the acquired data.
The scaled-out continuous flow process was successfully operated over a 70 min time period. 4.9 g of desired product was isolated after purification by column chromatography, corresponding to a 70% yield and productivity of 4.2 g h−1.
Conclusions
In conclusion, we have demonstrated the integration of three distinct inline/online analytical instruments within a modular reactor system, for the optimization and in-process monitoring of a multistep organometallic reaction. This modular flow reactor has enabled real-time reaction monitoring with numerous sensors, alongside an integrated control system. The deprotonation of tert-butyl propionate 1 by LDA was monitored using inline ReactIR, where disappearance of the ester C![[double bond, length as m-dash]](https://www.rsc.org/images/entities/char_e001.gif) O stretch could be clearly quantified. Subsequently, progress of lithium enolate addition to the electrophile 3 was monitored by inline NMR, using the aldehyde proton and aryl protons as distinct markers. The final reaction performance was quantified by online UPLC, which was enabled by a custom-built continuous subsampling-dilution system.
O stretch could be clearly quantified. Subsequently, progress of lithium enolate addition to the electrophile 3 was monitored by inline NMR, using the aldehyde proton and aryl protons as distinct markers. The final reaction performance was quantified by online UPLC, which was enabled by a custom-built continuous subsampling-dilution system.
The large volume of data was exploited for rapid exploration of reaction parameters, mapping the experimental space. A good fit was obtained for all polynomial models generated, allowing an estimation of the impact that small variations in each parameter will have upon the overall reaction performance. The process was scaled out, using the integrated sensors and inline/online analytics to monitor each reaction step. After 70 min processing time, 4.9 g of material was isolated, with a productivity of 4.2 g h−1.
The developed reactor platform with integrated PAT supports a data rich laboratory environment for real-time multistep reaction monitoring; of critical importance in fulfilling the ethos of Industry 4.0 for continuous processing and the laboratories of tomorrow within the pharmaceutical and fine chemical industries. Ongoing work within our research group will further improve and expand the platform.
Conflicts of interest
There are no conflicts to declare.Acknowledgements
The authors gratefully acknowledge funding by Land Steiermark/Zukunftsfonds Steiermark (No. 9003) for acquiring the infrastructure used in this work. The CCFLOW Project (Austrian Research Promotion Agency FFG No. 862766) is funded through the Austrian COMET Program by the Austrian Federal Ministry of Transport, Innovation and Technology (BMVIT), the Austrian Federal Ministry of Science, Research and Economy (BMWFW), and by the State of Styria (Styrian Funding Agency SFG).Notes and references
- S. Caron and N. M. Thomson, J. Org. Chem., 2015, 80, 2943–2958 CrossRef CAS PubMed.
- B. Ding, Process Saf. Environ. Prot., 2018, 119, 115–130 CrossRef CAS.
- S. L. Lee, T. F. O. Connor, X. Yang, C. N. Cruz, L. X. Yu and J. Woodcock, J. Pharm. Innov., 2015, 10, 191–199 CrossRef.
- (a) A. Chanda, A. M. Daly, D. A. Foley, M. A. Lapack, S. Mukherjee, J. D. Orr, G. L. Reid, D. R. Thompson and H. W. Ward, Org. Process Res. Dev., 2015, 19, 63–83 CrossRef CAS; (b) S. Bordawekar, A. Chanda, A. M. Daly, A. W. Garrett, J. P. Higgins, M. A. LaPack, T. D. Maloney, J. Morgado, S. Mukherjee, J. D. Orr, G. L. Reid, B.-S. Yang and H. W. Ward, Org. Process Res. Dev., 2015, 19, 1174–1185 CrossRef CAS; (c) J. P. McMullen and K. F. Jensen, Annu. Rev. Anal. Chem., 2010, 3, 19–42 CrossRef CAS PubMed.
- For general flow reviews, see: (a) B. Gutmann, D. Cantillo and C. O. Kappe, Angew. Chem., Int. Ed., 2015, 54, 6688–6728 CrossRef CAS PubMed; (b) R. Porta, M. Benagila and A. Puglisi, Org. Process Res. Dev., 2016, 20, 2–25 CrossRef CAS; (c) M. B. Plutschack, B. Pieber, K. Gilmore and P. H. Seeberger, Chem. Rev., 2017, 117, 11796–11893 CrossRef CAS PubMed; (d) R. Gérardy, N. Emmanuel, T. Toupy, V.-E. Kassin, N. N. Tshibalonza, M. Schmitz and J.-C. M. Monbaliu, Eur. J. Org. Chem., 2018, 2301–2351 CrossRef.
- F. F. Gouveia, J. P. Rahbek, A. R. Mortensen, M. T. Pedersen, P. M. Felizardo, R. Bro and M. J. Mealy, Anal. Bioanal. Chem., 2017, 409, 821–832 CrossRef CAS PubMed.
- (a) S. V. Ley, D. E. Fitzpatrick, R. J. Ingham and R. M. Myers, Angew. Chem., Int. Ed., 2015, 54, 3449–3464 CrossRef CAS PubMed; (b) G. A. Price, D. Mallik and M. G. Organ, J. Flow Chem., 2017, 7, 82–86 CrossRef CAS.
- D. E. Fitzpatrick and S. V. Ley, Tetrahedron, 2018, 74, 3087–3100 CrossRef CAS.
- (a) V. Sans and L. Cronin, Chem. Soc. Rev., 2016, 45, 2032–2043 RSC; (b) D. C. Fabry, E. Sugiono and M. Rueping, React. Chem. Eng., 2016, 1, 129–133 RSC; (c) A. Gioiello, V. Mancino, P. Filipponi, S. Mostarda and B. Cerra, J. Flow Chem., 2017, 6, 167–180 CrossRef; (d) N. Holmes, G. R. Akien, R. J. D. Savage, C. Stanetty, I. R. Baxendale, A. J. Blacker, B. A. Taylor, R. L. Woodward, R. E. Meadows and R. A. Bourne, React. Chem. Eng., 2016, 1, 96–100 RSC.
- B. J. Reizman and K. F. Jensen, Acc. Chem. Res., 2016, 49, 1786–1796 CrossRef CAS PubMed.
- M. Baumann, Org. Biomol. Chem., 2018, 16, 5946–5954 RSC.
- (a) F. Benito-Lopez, W. Verboom, M. Kakuta, J. G. E. Gardeniers, R. J. M. Egberink, E. R. Oosterbroek, A. van den Berg and D. N. Reinhoudt, Chem. Commun., 2005, 2857–2859 RSC; (b) J. Yue, F. H. Falke, J. C. Schouten and T. Alexander Nijhuis, Lab Chip, 2013, 13, 4855–4863 RSC.
- (a) S.-A. Leung, R. F. Winkle, R. C. R. Wootton and A. J. deMello, Analyst, 2005, 130, 46–51 RSC; (b) S. Mozharov, A. Nordon, D. Littlejohn, C. Wiles, P. Watts, P. Dallin and J. M. Girkin, J. Am. Chem. Soc., 2011, 133, 3601–3608 CrossRef CAS PubMed; (c) T. A. Hamlin and N. E. Leadbeater, Beilstein J. Org. Chem., 2013, 9, 1843–1852 CrossRef PubMed; (d) G. Chaplain, S. J. Haswell, P. D. I. Fletcher, S. M. Kelly and A. Mansfield, Aust. J. Chem., 2013, 66, 208–212 CrossRef CAS.
- (a) C. F. Carter, H. Lange, S. V. Ley, I. R. Baxendale, B. Wittkamp, J. G. Goode and N. L. Gaunt, Org. Process Res. Dev., 2010, 14, 393–404 CrossRef CAS; (b) R. J. Ingham, C. Battilocchio, J. M. Hawkins and S. V. Ley, Beilstein J. Org. Chem., 2014, 10, 641–652 CrossRef PubMed; (c) R. Galaverna, M. C. Breitkreitz and J. C. Pastre, ACS Sustainable Chem. Eng., 2018, 6, 4220–4230 CrossRef CAS; (d) M. Rueping, T. Bootwicha and E. Sugiono, Beilstein J. Org. Chem., 2012, 8, 300–307 CrossRef CAS PubMed; (e) A. Hafner and S. V. Ley, Synlett, 2015, 26, 1470–1474 CrossRef CAS; (f) T. Brodmann, P. Koos, A. Metzger, P. Knochel and S. V. Ley, Org. Process Res. Dev., 2012, 16, 1102–1113 CrossRef CAS; (g) A. E. Cervera-Padrell, J. P. Nielsen, M. Jønch Pedersen, K. Müller Christensen, A. R. Mortensen, T. Skovby, K. Dam-Johansen, S. Kiil and K. V. Gernaey, Org. Process Res. Dev., 2012, 16, 901–914 CrossRef CAS; (h) Z. Qian, I. R. Baxendale and S. V. Ley, Chem. – Eur. J., 2010, 16, 12342–12348 CrossRef CAS PubMed; (i) C. Battilocchio, B. J. Deadman, N. Nikbin, M. O. Kitching, I. R. Baxendale and S. V. Ley, Chem. – Eur. J., 2013, 19, 7917–7930 CrossRef CAS PubMed; (j) H. Lange, C. F. Carter, M. D. Hopkin, A. Burke, J. G. Goode, I. R. Baxendale and S. V. Ley, Chem. Sci., 2011, 2, 765–769 RSC; (k) R. A. Skilton, A. J. Parrott, M. W. George, M. Poliakoff and R. A. Bourne, Appl. Spectrosc., 2013, 67, 1127–1131 CrossRef CAS PubMed.
- (a) M. V. Gomez and A. de la Hoz, Beilstein J. Org. Chem., 2017, 13, 285–300 CrossRef CAS PubMed; (b) P. Giraudeau and F. X. Felpin, React. Chem. Eng., 2018, 3, 399–413 RSC; (c) B. Musio, E. Gala and S. V. Ley, ACS Sustainable Chem. Eng., 2018, 6, 1489–1495 CrossRef CAS; (d) C. M. Archambault and N. E. Leadbeater, RSC Adv., 2016, 6, 101171–101177 RSC; (e) T. H. Rehm, C. Hofmann, D. Reinhard, H.-J. Kost, P. Löb, M. Besold, K. Welzel, J. Barten, A. Didenko, D. V. Sevenard, B. Lix, A. R. Hillson and S. D. Riegel, React. Chem. Eng., 2017, 2, 315–323 RSC; (f) M. V. Gomez and A. de la Hoz, Beilstein J. Org. Chem., 2017, 13, 285–300 CrossRef CAS PubMed; (g) B. Ahmed-Omer, E. Sliwinski, J. P. Cerroti and S. V. Ley, Org. Process Res. Dev., 2016, 20, 1603–1614 CrossRef CAS; (h) D. Cortés-Borda, E. Wimmer, B. Gouilleux, E. Barré, N. Oger, L. Goulamaly, L. Peault, B. Charrier, C. Truchet, P. Giraudeau, M. Rodriguez-Zubiri, E. Le Grognec and F.-X. Felpin, J. Org. Chem., 2018, 83, 14286–14299 CrossRef PubMed.
- (a) J. P. McMullen and K. F. Jensen, Org. Process Res. Dev., 2010, 14, 1169–1176 CrossRef CAS; (b) B. J. Reizman and K. F. Jensen, Org. Process Res. Dev., 2012, 16, 1770–1782 CrossRef CAS; (c) C. A. Hone, N. Holmes, G. R. Akien, R. A. Bourne and F. L. Muller, React. Chem. Eng., 2017, 2, 103–108 RSC; (d) M. I. Jeraal, N. Holmes, G. R. Akien and R. A. Bourne, Tetrahedron, 2018, 74, 3158–3164 CrossRef CAS; (e) M. Escribà-Gelonch, E. Shahbazali, M. Honing and V. Hessel, Tetrahedron, 2018, 74, 3143–3151 CrossRef; (f) N. Holmes, G. R. Akien, A. J. Blacker, R. L. Woodward, R. E. Meadows and R. A. Bourne, React. Chem. Eng., 2016, 1, 366–371 RSC; (g) see ref. 15h.
- (a) A. J. Parrott, R. A. Bourne, G. R. Akien, D. J. Irvine and M. Poliakoff, Angew. Chem., Int. Ed., 2011, 50, 3788–3792 CrossRef CAS PubMed; (b) E. S. Streng, D. S. Lee, M. W. George and M. Poliakoff, Beilstein J. Org. Chem., 2017, 13, 329–337 CrossRef CAS PubMed.
- For a standardized definition of the classifiers inline, online, atline, and offline in Process Analytical Technology (PAT), see: C. Minnich, S. Hardy and S. Krämer, Chem. Ing. Tech., 2016, 88, 694–697 CrossRef CAS , Note that these terms are often used inconsistently in the literature.
- (a) G. R. Lambertus, L. P. Webster, T. M. Braden, B. M. Campbell, J. McClary Groh, T. D. Maloney, P. Milenbaugh, R. D. Spencer and M. D. Johnson, Org. Process Res. Dev., 2019, 23, 189–210 CrossRef CAS; (b) J. C. McWilliams, A. D. Allian, S. M. Opalka, S. A. May, M. Journet and T. M. Braden, Org. Process Res. Dev., 2018, 22, 1143–1166 CrossRef CAS.
- (a) D. T. McQuade and P. H. Seeberger, J. Org. Chem., 2013, 78, 6384–6389 CrossRef CAS PubMed; (b) J. Britton, K. A. Stubbs, G. A. Weiss and C. L. Raston, Chem. – Eur. J., 2017, 23, 13270–13278 CrossRef CAS PubMed; (c) D. Webb and T. F. Jamison, Chem. Sci., 2010, 1, 675–680 RSC; (d) J. Wegner, S. Ceylan and A. Kirschning, Adv. Synth. Catal., 2012, 354, 17–57 CrossRef CAS; (e) B. Pieber, K. Gilmore and P. H. Seeberger, J. Flow Chem., 2017, 7, 129–136 CrossRef CAS.
- (a) E. Godineau, C. Battilocchio, M. Lehmann, S. V. Ley, R. Labes, L. Birnoschi, S. Subramanian, C. S. Prasanna, A. Gorde, M. Kalbagh, V. Khade, A. Scherrer, A. Cornelius and C. O'Sullivan, Org. Process Res. Dev., 2018, 22, 955–996 CrossRef CAS; (b) see ref. 15(h).
- M. Movsisyan, E. I. P. Delbeke, J. K. E. T. Berton, C. Battilocchio, S. V. Ley and C. V. Stevens, Chem. Soc. Rev., 2016, 45, 4892–4928 RSC.
- A.-C. Bédard, A. Adamo, K. C. Aroh, M. G. Russell, A. A. Bedermann, J. Torosian, B. Yue, K. F. Jensen and T. F. Jamison, Science, 2018, 361, 1220–1225 CrossRef PubMed.
- L. Degennaro, C. Carlucci, S. De Angelis and R. Luisi, J. Flow Chem., 2016, 6, 136–166 CrossRef CAS.
- T. L. Rathman and J. A. Schwindeman, Org. Process Res. Dev., 2014, 18, 1192–1210 CrossRef CAS.
- A. Nagaki, C. Matsuo, S. Kim, Kodai Saito, A. Miyazaki and J. Yoshida, Angew. Chem., Int. Ed., 2012, 51, 3245–3248 CrossRef CAS PubMed.
- A batch synthesis for the multistep transformation studied is reported by: K. Shibatomi, K. Kitahara, N. Sasaki, Y. Kawasaki, I. Fujisawa and S. Iwasa, Nat. Commun., 2017, 8, 15600–15606 CrossRef PubMed.
- (a) D. M. Roberge, M. Gottsponer, M. Eyholzer and N. Kockmann, Chim. Oggi, 2009, 27, 8–11 CAS; (b) P. Plouffe, A. Macchi and D. M. Roberge, Org. Process Res. Dev., 2014, 18, 1286–1294 CrossRef CAS; (c) P. Plouffe, D. M. Roberge and A. Macchi, Chem. Eng. J., 2016, 300, 9–19 CrossRef CAS; (d) E. Mielke, D. M. Roberge and A. Macchi, J. Flow Chem., 2016, 6, 279–287 CrossRef CAS; (e) P. Plouffe, M. Bittel, J. Sieber, D. M. Roberge and A. Macchi, Chem. Eng. Sci., 2016, 143, 216–225 CrossRef CAS; (f) K. S. Elvira, X. Casadevall i Solvas, R. C. R. Wootton and A. J. deMello, Nat. Chem., 2013, 5, 905–915 CrossRef CAS PubMed; (g) E. Mielke, P. Plouffe, N. Koushik, M. Eyholzer, M. Gottsponer, N. Kockmann, A. Macchi and D. M. Roberge, React. Chem. Eng., 2017, 2, 763–775 RSC.
- For the synthesis of LDA in flow, see: T. von Keutz, F. J. Strauss, D. Cantillo and C. O. Kappe, Tetrahedron, 2018, 74, 3113–3117 CrossRef CAS and references cited therein.
- J. N. Payette and H. Yamamoto, J. Am. Chem. Soc., 2008, 130, 12276–12278 CrossRef CAS PubMed.
- A. B. Santanilla, E. L. Regalado, T. Pereira, M. Shevlin, K. Bateman, L. Campeau, J. Schneeweis, S. Berritt, Z. Shi, P. Nantermet, Y. Liu, R. Helmy, C. J. Welch, P. Vachal, I. W. Davies, T. Cernak and S. D. Dreher, Science, 2015, 347, 49–53 CrossRef PubMed.
- T. Noël, Y. Su and V. Hessel, Top. Organomet. Chem., 2015, 57, 1–41 CrossRef.
- H. Usutani, T. Nihei, C. D. Papageorgiou and D. G. Cork, Org. Process Res. Dev., 2017, 21, 669–673 CrossRef CAS.
Footnote |
| † Electronic supplementary information (ESI) available. See DOI: 10.1039/c9re00087a |
| This journal is © The Royal Society of Chemistry 2019 |

