
Microwave-assisted digestion using diluted acid and base solutions for plant analysis by ICP OES
Juan A. V. A.
Barros
a,
Paulino F.
de Souza
b,
Daniela
Schiavo
c and
Joaquim A.
Nóbrega
*a
aGrupo de Análise Instrumental Aplicada, Departamento de Química, Universidade Federal de São Carlos, P.O. Box 676, São Carlos, SP 13560-970, Brazil. E-mail: djan@terra.com.br; Fax: +55 16 33518350; Tel: +55 16 33518058
bCentro de Tecnologia Canavieira, Piracicaba, SP, Brazil
cAgilent Technologies, São Paulo, SP, Brazil
First published on 21st September 2015
Abstract
A new sample preparation procedure for the determination of Si in plant materials by ICP OES is proposed. A two-step digestion procedure employing diluted solutions of HNO3 (1.0 mol L−1) and NaOH (1.5 mol L−1) was applied for digesting plant samples. Limits of detection and quantification for Si were 56 and 186 μg g−1, respectively. A comparative study was done to evaluate the accuracy of the developed procedure by comparing the results obtained for Si in five sugar cane leaf samples with those obtained by micro-energy dispersive X-ray fluorescence (μED-XRF) and according to a t-test the results agreed at the 95% confidence level. To verify the versatility of the procedure, Si, Al, B, Ca, Cu, Fe, K, Mg, Mn, Mo, S, and Zn were simultaneously determined in plant materials. The analytes were quantified in four certified reference materials: apple leaves (NIST 1515), tomato leaves (NIST 1573), white cabbage powder (BCR-679), and bush branches and leaves (NCS DC 73349) for accuracy assessment. All recoveries were in the range of 91.0–109% and all results agreed at the 95% confidence level (t-test) with certified concentrations. Foliar diagnosis was performed to demonstrate the applicability of the developed procedure for leaves of sugar cane, corn, soy and alfalfa. The proposed procedure is simple, versatile, reliable and safe for the determination of Si, macro- and micro-nutrients in plants by ICP OES.
1. Introduction
Silicon is an element of utmost importance in numerous biochemical, geochemical, and surface processes. Plants that grow in silicate rich soils can exhibit up to 100-fold the usual concentration of phosphorus,1 and therefore plants can absorb Si in the same amount in which macronutrients are absorbed.2,3 Plants obtain Si in the form of monosilicic acid (H4SiO4), which is formed from the reaction between mineral silica (SiO2) in soil and water.1,4Some of the beneficial effects of using Si as an additive in plants include: increased mechanical strength and resistance to biotic and abiotic stress,3,5 such as exposure to ions formed by Al, Fe, and Mn,6 increased absorption of phosphorus and resistance to climatic conditions.7 Silicon can be considered as a potent nutritional additive to plants; however, its absence does not prevent their growth or natural development. There is a growing trend in analytical chemistry towards the determination of Si in plants and several investigations have been presented.8–11
Several procedures are described in the literature for sample preparation of plant materials. The use of open vessel systems is commonly described;12–14 however, the use of those systems has some drawbacks, being prone to contamination and generally high volumes of concentrated acids are needed. On the other hand, there are numerous advantages reported in the literature regarding the use of microwave-assisted procedures10,11,15,16 in which closed vessels are used. The main advantage of microwave-assisted procedures is the possibility of working with low volumes of diluted acid solutions and consequently better control of the analytical blank solutions is achieved.16
After microwave-assisted acid digestion of plant materials, precipitated silica (SiO2) is found at the bottom of the digestion vessel, and the use of hydrofluoric acid (HF) during the sample preparation procedure for dissolving SiO2 is usually reported.9,11,17,18 The addition of HF implies a second digestion step, in which boric acid (H3BO3) is added to the digestate for masking the remaining fluoride ions. This procedure has been applied for determining 30 elements in plant materials by ICP-MS, but results were not satisfactory for Si and it was impossible to check its accuracy because of the lack of CRMs with certified Si concentrations.11
The solubility of SiO2 does not change significantly in the pH range of 2–9; however, it increases abruptly at pH values higher than 9 due to the formation of silicate ions.4,19–21 Considering the behaviour of Si in alkaline medium, an alternative to the use of HF is alkaline solubilization of SiO2.
Some authors8,22 have described the use of a combination of concentrated NaOH solutions and H2O2 to digest plant materials. A two-step procedure, in which acid digestion of plant materials was followed by alkaline dissolution of Si and analyte determination via ICP OES, was investigated.10 However, difficulties in applying the procedure proposed by Haysom and Zofia10 are also reported in the literature.8
Even though some of the above-mentioned procedures were effective in Si solubilization, the use of concentrated NaOH solutions makes difficult their implementation in routine analysis because of deterioration of quartz components of ICP OES, and, depending on the configuration of the torch, central tube tip blockage due to salt deposits may be a limitation.16 The use of high concentrations of NaOH also could lead to contamination of the digests leading to inaccurate results for some important elements, such as Ca, Fe, K, Mg and Mn. Sodium is well-known as an easily ionisable element (EIE) and introducing large quantities of Na into an argon plasma could lead to suppression or enhancement of emission signals compromising the accuracy.23,24
Thus, the main goal of the study here described was the development of a sample preparation procedure, which allows quantitative Si digestion and solubilisation in plant materials followed by determination using ICP OES. The capability of the developed procedure for multielement analysis was also evaluated.
2. Experimental
2.1. Equipment
Acid and alkaline decomposition steps were carried out in TFM™-PTFE digestion vessels (DAP-100®) by using a microwave oven (Speed Wave Four, Berghof Analytik, Chemnitz-Germany). All measurements were performed with an Agilent 5100 ICP OES with Dichroic Spectral Combiner (DSC) technology (Agilent Technologies, Mulgrave, Australia). The Synchronous Vertical Dual View (SVDV) mode was selected for data acquisition; in this mode, data from both axial and radial views are simultaneously obtained. Plasma operating conditions and parameters of the sample introduction system are shown in Table 1. The method accuracy was checked by comparing the results with those obtained by direct analysis using micro-energy dispersive X-ray fluorescence (μED-XRF). A μEDX-1300 micro-fluorescence spectrometer (Shimadzu, Kyoto, Japan) was used and the operational conditions are described in Table 1.| Method | Instrument parameter | Operational conditions |
|---|---|---|
| ICP OES | RF applied power (kW) | 1.5 |
| Argon auxiliary flow rate (L min−1) | 1.0 | |
| Argon plasma flow rate (L min−1) | 12 | |
| Argon nebulizer flow rate (L min−1) | 0.60 | |
| Nebulizer type | Seaspray® | |
| Nebulization chamber | Single-pass cyclonic | |
| Reading time (s) | 20 | |
| Replicates | 3 | |
| Sample uptake delay (s) | 15 | |
| Stabilization time (s) | 15 | |
| μED-XRF | Acquisition time (s) | 10 |
| Pass (μm) | 100 | |
| Number of spots | 30 | |
| Beam diameter (μm) | 50 | |
| Current (μA) | 100 | |
| Tension (kV) | 50 | |
| Detector | Si(Li) semiconductor | |
| Si line (keV) | Kα = 1.74 | |
| X-Ray | Rh tube | |
| Acquisition region (keV) | 0–40 |
2.2. Reagents and reference solutions
All solutions were prepared with ultrapure water (resistivity ≥ 18.2 MΩ cm Millipore, Bedford, MA, USA) in polypropylene flasks. All materials used were previously decontaminated in 10% v/v HNO3 for 24 h and rinsed with deionized water before use. Sub-boiling nitric acid was obtained from a distillation apparatus (Milestone, Sorisole, Italy). Alkaline solutions were prepared by dissolving an appropriate amount of NaOH (PA-ACS ≥ 97%, Synth, Diadema, SP, Brazil) pellets with deionized water. Monoelement stock solutions of 1000 mg L−1 Al, B, Ca, Cu, Fe, K, Mg, Mn, Mo, S, Si and Zn (Fluka, Buchs St. Gallen, Switzerland) were diluted and used to prepare multielement analytical calibration solutions.Calibration solutions for Ca, K, Mg, S and Si were prepared with analyte concentrations in the range of 1.0 to 75.0 mg L−1. A volume of 375 μL of HNO3 14 mol L−1 and 2.5 mL of NaOH 1.5 mol L−1 were added to each standard. Calibration solutions in the range of 1.0 to 3000 μg L−1 for Al, B, Cu, Fe, Mn, Mo and Zn were prepared and 750 μL aliquot of HNO3 14 mol L−1 followed by 5 mL of NaOH 1.5 mol L−1 were added to each standard.
2.3. Certified reference materials and samples
The following certified reference materials (CRMs) were used to evaluate the accuracy of the developed procedure: apple leaves NIST 1515, tomato leaves NIST 1573 (National Institute of Standards and Technology, Gaithersburg, MD, USA), white cabbage powder BCR-679 (Institute for Reference Materials and Measurements, Geel, Belgium), and bush branches and leaves NCS DC 73349 (National Analysis Center for Iron & Steel, Beijing, China).Six different species of sugar cane leaves were provided by the Sugarcane Technology Center in Piracicaba (SP, Brazil). These samples have Si concentrations previously determined by LIBS25 and μED-XRF. Samples of leaves and corn roots, alfalfa, and soy leaves were obtained from Embrapa Southeast Livestock in São Carlos (SP, Brazil). For each sample, forty leaves were collected. Each leaf had the central nervure removed and discarded. The leaves were washed with deionized water and dried at 65 °C for 72 h in a forced air oven. Samples were ground in a cutting mill fitted with a 20 mesh sieve.
2.4. Sample preparation
In Fig. 1 a schematic representation of the proposed sample preparation procedure is shown. The digestion procedure was carried out in two steps. First, sample masses of 100 mg were microwave-assisted digested using 5 mL of HNO3 1 mol L−1 plus 5 mL of H2O2 (30% v/v). The heating program was performed in six steps: (1) 5 min to reach 120 °C; (2) 5 min at 120 °C; (3) 5 min to reach 160 °C; (4) 5 min at 160 °C; (5) 3 min to reach 230 °C; and (6) 5 min at 230 °C. The vessels were then removed from the microwave rotor and cooled down to room temperature. After cooling, the vessels were opened and a volume of 5 mL of NaOH 1.5 mol L−1 was added to each vessel. The vessels were then closed and a second heating program was applied in four steps: (1) 5 min to reach 150 °C; (2) 5 min at 150 °C; (3) 5 min to reach 230 °C; and (4) 10 min at 230 °C. A 1305 W applied power was used in both heating programs. After cooling down the vessels were opened and digests were quantitatively transferred to 50 mL polyethylene tubes and 750 μL of HNO3 14 mol L−1 was added. Final volumes were made up to 50.0 mL. Aluminium, B, Cu, Fe, Mn, Mo and Zn were determined in these solutions. A second set of solutions were prepared with a further 2-fold dilution. Calcium, K, Mg, S and Si were determined in these more diluted solutions.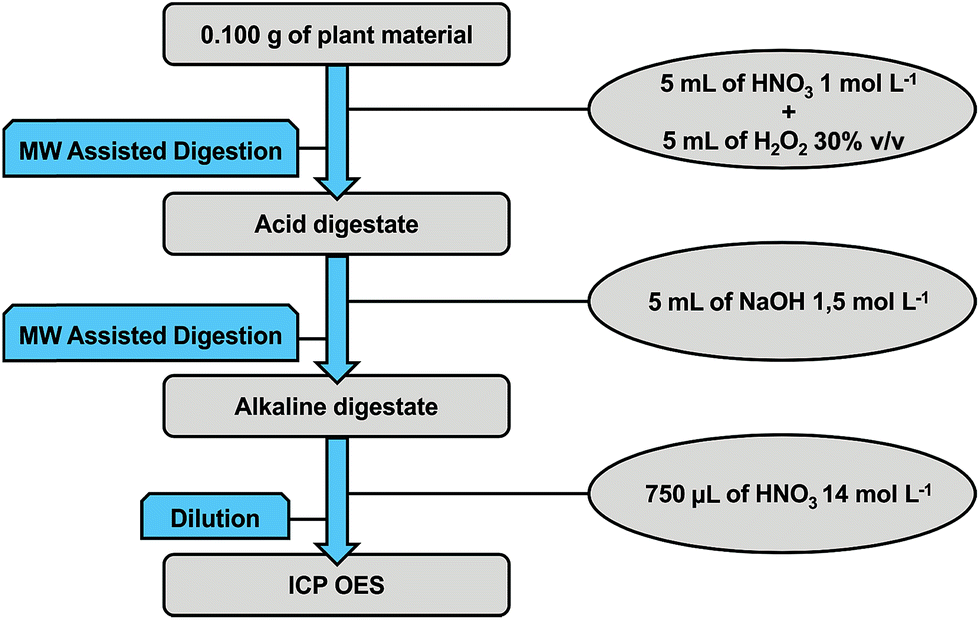 | ||
| Fig. 1 General scheme of the developed sample preparation procedure for Si determination in plant materials. | ||
For the μED-XRF analysis, 0.5 g of cryogenically ground sugar cane leaf samples were pelleted by applying 8 t cm−2 of pressure for 5 min. Pellets of 15 mm of diameter by 2 mm of thickness were obtained.
3. Results and discussion
3.1. Optimizing sample preparation procedures
Considering all negative effects caused by the introduction of high concentrations of Na into the plasma, six experiments were performed in order to optimize the sample preparation procedure aiming at maximum efficiency for SiO2 solubilization by using low concentrations of HNO3 and NaOH solutions. Another important aspect evaluated was the need for conducting the procedure in two steps, the first step being an acid decomposition and the second one an alkaline dissolution.Former procedures described in the literature usually are performed in one-step with highly concentrated NaOH solutions and H2O2 for sample decomposition;22,26 however, we have experienced problems with these procedures. In more than one occasion, uncontrolled exothermic reactions occurred leading to melting of the microwave vessel walls. We also have tried a single step digestion with a low concentration of NaOH, i.e. 2.0 mol L−1, in this case the digestion was ineffective for digesting organic compounds.
One sugar cane leaf sample with 9.77 ± 0.07 mg g−1 Si was selected and used in the optimization experiments. Experiments 1–3 were performed using a solution of 2 mol L−1 HNO3 in the first digestion step and solutions containing 7.5, 3.75 and 2.5 mol L−1 NaOH in the second step. Experiments 4–6 were done using 1 mol L−1 HNO3 in the first digestion step and 2.0, 1.5 and 1.0 mol L−1 NaOH solutions in the second step. In each experiment, samples were digested in triplicate. Table 2 contains Si concentrations obtained in experiments 1–6 and the experimental conditions applied in each experiment. Silicon concentrations in experiments 1–5 were in the range of 9.67–10.0 mg g−1 and the RSD values were in the range of 0.02–0.16%. The conditions used in experiment 6 led to a lower concentration for Si (8.05 mg g−1). This is related to the low concentration of NaOH in the final digests when compared to the high concentration of Si in the sample; however, it seems possible to further reduce the NaOH concentration when working with plant materials containing low concentrations of Si. Since there were no differences (t-test; 95% confidence level) among the results obtained in experiments 1 to 5, we adopted conditions used in experiment 5 because it requires the lowest concentration of NaOH to dissolve SiO2 and led to better precision. A comparison among the procedures described in the literature regarding the determination of Si in plant matrices and the procedure here proposed is shown in Table 3.
| Experiment | Reagent volume and concentrations | Si concentration (mg g−1) | Determined concentration (mg g−1) |
|---|---|---|---|
| a Obtained by μED-XRF. | |||
| 1 | 5 mL of HNO3 2 mol L−1; 5 mL of H2O2 30% v/v; 5 mL of NaOH 7.5 mol L−1 | 9.77 ± 0.07a | 9.90 ± 0.20 |
| 2 | 5 mL of HNO3 2 mol L−1; 5 mL of H2O2 30% v/v; 5 mL of NaOH 3.25 mol L−1 | 9.79 ± 0.14 | |
| 3 | 5 mL of HNO3 2 mol L−1; 5 mL of H2O2 30% v/v; 5 mL of NaOH 2.5 mol L−1 | 10.0 ± 0.18 | |
| 4 | 5 mL of HNO3 1 mol L−1; 5 mL of H2O2 30% v/v; 5 mL of NaOH 2.0 mol L−1 | 9.87 ± 0.41 | |
| 5 | 5 mL of HNO3 1 mol L−1; 5 mL of H2O2 30% v/v; 5 mL of NaOH 1.5 mol L−1 | 9.67 ± 0.10 | |
| 6 | 5 mL of HNO3 1 mol L−1; 5 mL of H2O2 30% v/v; 5 mL of NaOH 1.0 mol L−1 | 8.05 ± 0.16 | |
| Sample | Procedure | Determination method | Reference |
|---|---|---|---|
| NIST SRM 1515; NIST SRM 1575 | Microwave-assisted digestion of 0.5 g of sample with 5.0 mL of HNO3 14 mol L−1 and 0.1 mL of HF | ICP-MS | 11 |
| Rice straw samples | Autoclave-induced digestion of 0.1 g with 2 mL of H2O2 and 4.5 mL of NaOH 12.5 mol L−1 | UV-Vis spectrophotometry | 22 |
| Rice straw and sugar cane leaves | A mass of 0.1 g of plant material was oven-induced digested with 2 mL of H2O2, 4 mL of NaOH 12.5 mol L−1 and 5 drops of octyl-alcohol. After digestion, 1 mL of NH4F 5 × 10⁻³ mol L−1 was added to the digestates | UV-Vis spectrophotometry and ICP OES | 8 |
| Rice straw, sugar cane, mixed pasture | A mass of 0.2 g of plant material was microwave-assisted acid digested in two steps using 3 mL of HNO3 14 mol L−1 and 2 mL of H2O2 in the first step, and alkaline digested with 10 mL of NaOH 2.5 mol L−1 in the second step | ICP OES | 10 |
| Sugar cane leaves, soy leaves, corn leaves and roots. | A mass of 100 mg of plant material were microwave-assisted acid digested with 5 mL of HNO3 1 mol L−1 and 5 mL of H2O2 30% v/v in the first step and alkaline digested in the second step with 5 mL of NaOH 1.5 mol L−1 | ICP OES | This work |
3.2. Analytical figures of merit
The performance of the proposed procedure was evaluated by analysing reference solutions of Si. Short time intervals in each analysis were achieved when the SVDV mode is adopted. In the so-called SVDV mode, emission data from both radial and axial views are obtained simultaneously.The calibration curve was linear in the range of 1 to 75 mg L−1 and a linear correlation coefficient of 0.9999 was attained. The corresponding linear equation to the calibration graph was I = 2408.40C + 598.53 (where I is the intensity in counts per second and C is the concentration of Si in mg L−1). Considering the background equivalent concentrations (BECs) and relative standard deviations (RSDs) for 10 consecutive measurements of the blanks, a limit of detection (LOD) of 0.06 μg L−1 and a limit of quantification (LOQ) of 0.21 μg L−1 were established. Ten digestion blanks were prepared and considering the mass of sample and dilutions, a LOD of 56 μg kg−1 and a LOQ of 186 μg kg−1 were obtained.
3.3. Evaluation of multielement determination capability
Although the main goal of this work was the development of a simple and green procedure for determining Si in plants, foliar diagnosis cannot be restricted to one element. Considering its attractiveness for application in routine analysis laboratories, an analytical procedure must be versatile, allowing the analyst to determine important macro- and micro-nutrients. Thus, we evaluated the applicability of the developed procedure for determining Al, B, Ca, Cu, Fe, K, Mg, Mn, Mo, S, and Zn in plants. Table 4 contains LODs and LOQs for these elements. It is noticeable that high limits of detection (2585 μg g−1) and quantification (8615 μg g−1) were obtained for K; this is caused by the high content of K in the NaOH reagent (≥0.3% m/m); however, K is a macronutrient and the normal concentration of K in healthy plants is in the range of 15![[thin space (1/6-em)]](https://www.rsc.org/images/entities/char_2009.gif) 000–55000 μg kg−1.27
000–55000 μg kg−1.27
| Element | Emission line (nm) | BEC (μg L−1) | LOD (μg g−1) | LOQ (μg g−1) |
|---|---|---|---|---|
| Al | 237.312 | 77.8 | 9.5 | 31.8 |
| B | 249.678 | 8.15 | 1.6 | 5.2 |
| Ca | 422.673 | 0.14 | 137 | 456 |
| Cu | 223.009 | 4.10 | 0.8 | 2.6 |
| Fe | 259.940 | 23.0 | 3.8 | 12.7 |
| K | 404.721 | 0.49 | 2585 | 8615 |
| Mg | 285.213 | 0.01 | 3.5 | 12 |
| Mn | 293.305 | 1.71 | 1.5 | 5.1 |
| Mo | 281.615 | 2.70 | 0.3 | 1.0 |
| S | 181.972 | 3.14 | 164 | 547 |
| Si | 250.690 | 0.06 | 56 | 186 |
| Zn | 213.857 | 15.0 | 3.0 | 9.9 |
3.4. Comparative study: silicon determination in sugar cane samples
A comparative study was done to evaluate the accuracy of the developed sample preparation procedure. Five sugar cane samples (SCL 1–5) had Si concentrations determined by μED-XRF and by ICP OES using the proposed sample preparation procedure. The linear regression method was used to associate the results obtained by both methods, and a graphical representation as well as the obtained equation are shown in Fig. 2. The calculated correlation coefficient of 0.9934 evidenced a good correlation among the results when comparing ICP OES with μED-XRF (Fig. 2). The confidence intervals at the 95% confidence level for the slope and linear coefficient for the equation were calculated as being 1.35 ± 0.30 and −1.90 ± 1.96, respectively, showing that systematic errors did not occur when comparing both methods. According to a t-test there were no significant differences among the results at the 95% confidence level. The coefficient variation (CV) obtained for the proposed procedure (n = 3 digests) ranged from 0.2 to 1.80%, while the CV obtained with μED-XRF (n = 30 spots, 100 μm pass) ranged from 0.7 to 1.80%.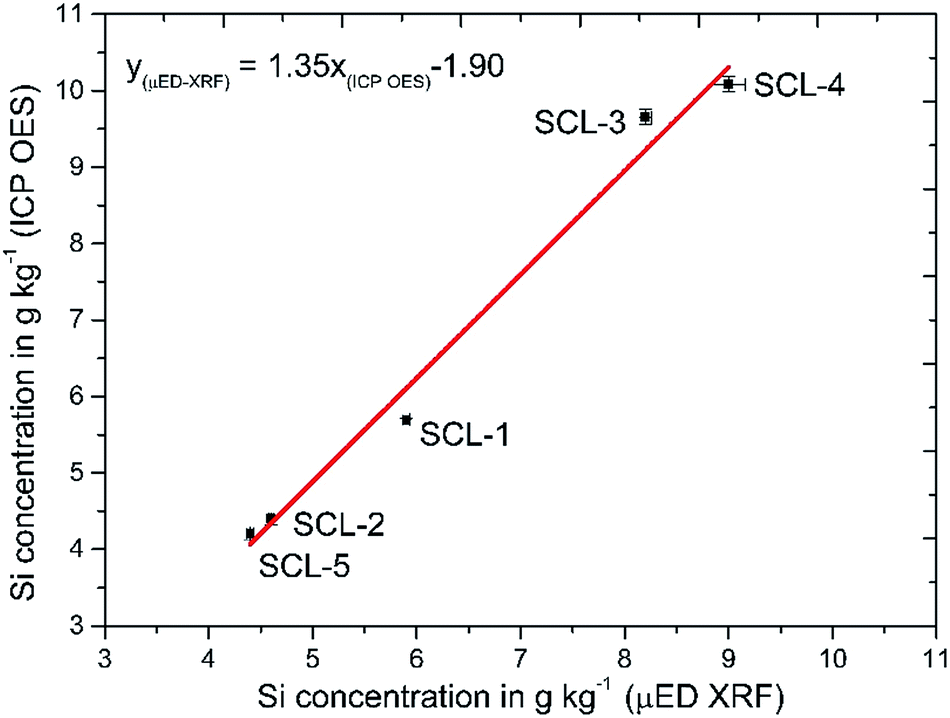 | ||
| Fig. 2 Correlation among Si concentrations in five sugar cane leaves (SCL 1–5) determined by ICP OES using the developed digestion procedure and μED-XRF. | ||
3.5. Determination of Al, B, Ca, Cu, Fe, K, Mg, Mn, Mo, S, Si and Zn in plant materials
Silicon was determined in three CRMs, i.e. NIST 1515, NCS DC 73349 and NIST 1573a, and a wide range of concentrations were found (400–6000 μg g−1); however, it was not detected in the BCR 679. Only the NCS DC 73349 CRM had a certified concentration of Si, and the recovery for this analyte was 95.2%, also the standard deviation obtained with the proposed procedure was lower than the one certified. According to the certificate of analysis, the reference value was obtained by colorimetry (molybdenum blue method), gravimetry and X-ray fluorescence spectrometry.To verify the accuracy of the procedure for determining Al, B, Ca, Cu, Fe, K, Mg, Mn, Mo, S, and Zn in plants, these analytes were also determined in the above mentioned CRMs and results are shown in Table 5. Analyte recoveries were in the range of 91.0 to 109% for all CRMs. There is no statistical difference among certified concentrations and those ones obtained by applying the proposed procedure (t-test; 95% confidence level).
| Analyte | NIST 1515 | NCS DC 73349 | ||||
|---|---|---|---|---|---|---|
| Found (μg g−1) | Certified (μg g−1) | Recovery (%) | Found (μg g−1) | Certified (μg g−1) | Recovery (%) | |
| a Indicative values. | ||||||
| Al | 330 ± 4.0 | 286 ± 9 | 115 | 1999 ± 80 | 2000 ± 300 | 99 |
| B | 29.3 ± 0.3 | 27 ± 2 | 108 | 41 ± 1 | 38 ± 6 | 108 |
| Ca | 14411 ± 106 |
15260 ± 150 |
94.4 | 15594 ± 89 |
16800 ± 1100 |
92.6 |
| Cu | 5.80 ± 0.2 | 5.64 ± 0.24 | 103 | 6.57 ± 0.1 | 6.6 ± 0.08 | 99.6 |
| Fe | 83 ± 7 | 83 ± 5 | 100 | 1036 ± 27 | 1070 ± 57 | 96.8 |
| K | 15108 ± 927 |
16100 ± 200 |
94 | 9934 ± 185 | 9200 ± 1000 | 108 |
| Mg | 2854 ± 6.0 | 2710 ± 80 | 102 | 4839 ± 219 | 4800 ± 400 | 101 |
| Mn | 53 ± 4 | 54 ± 3 | 98 | 66 ± 1.7 | 61 ± 5 | 109 |
| Mo | <LOD | <LOD | <LOD | <LOD | <LOD | <LOD |
| S | 1786 ± 51 | 1800a | 99.2 | 6877 ± 50 | 7300 ± 600 | 94.2 |
| Si | 400 ± 0.04 | NA | — | 5610 ± 5.61 | 6000 ± 700 | 95.2 |
| Zn | 12.5 ± 0.6 | 12.5 ± 0.3 | 100 | 56.6 ± 0.99 | 55 ± 4 | 103 |
| Analyte | NIST 1573a | BCR 679 | ||||
|---|---|---|---|---|---|---|
| Found (μg g−1) | Certified (μg g−1) | Recovery (%) | Found (μg g−1) | Certified (μg g−1) | Recovery (%) | |
| Al | 629 ± 37 | 598 ± 12 | 105 | 125 | NA | — |
| B | 32.8 ± 1.6 | 33.3 ± 0.7 | 98.6 | 30.2 ± 2.0 | 27.7 ± 1.9a | 109 |
| Ca | 49960 ± 302 |
50500 ± 900 |
99 | 8068 ± 177 | 7768 ± 655a | 104 |
| Cu | 4.61 ± 0.30 | 4.70 ± 0.14 | 98.0 | 3.00 ± 0.1 | 2.89 ± 0.1 | 105 |
| Fe | 332 ± 5 | 368 ± 7 | 90.2 | 58.3 ± 0.4 | 55 ± 2.5 | 106 |
| K | 29273 ± 785 |
27000 ± 500 |
108 | 36421 ± 690 |
NA | — |
| Mg | 12043 ± 1173 |
12000a |
104 | 1399 ± 53 | 1362 ± 127a | 103 |
| Mn | 230 ± 7 | 246 ± 8 | 93.7 | 14.4 ± 0.02 | 13.3 ± 0.5 | 109 |
| Mo | <LOD | <LOD | <LOD | 14.8 ± 2.4 | 14.8 ± 0.5 | 100 |
| S | 9195 ± 376 | 9600a | 95.8 | 7.2 ± 0.1 | NA | — |
| Si | 1800 ± 0.2 | NA | — | <LOD | NA | <LOD |
| Zn | 28.1 ± 0.6 | 30.9 ± 0.7 | 91.0 | 80.6 ± 0.4 | 79.7 ± 2.7 | 101 |
The procedure here proposed was applied to the determination of several analytes in leaves of corn, sugar cane, soy, alfalfa, and corn roots (Table 6). It is important to mention that these samples were cultivated in a dark-red latosoil with a high content of organic matter. Soils had pH corrected with limestone. Samples were obtained from farms located in São Carlos (SP, Brazil) and Piracicaba (SP, Brazil); both cities are within a distance of 105 km apart so the regional setting in both of these locations is similar. The weather conditions from both cities are characterized as tropical of altitude, since both cities are located at approximately 550–900 m above sea level.
| Sample | Analyte concentration in μg g−1 | |||||||||||
|---|---|---|---|---|---|---|---|---|---|---|---|---|
| Al | B | Ca | Cu | Fe | K | Mg | Mn | Mo | S | Si | Zn | |
| Sugarcane leaves (1) | 323 ± 0.3 | 5.74 ± 0.1 | 5252 ± 186 | 4.42 ± 0.1 | 225 ± 4.6 | 13072 ± 165 |
1810 ± 42 | 47.5 ± 1.4 | 8.70 ± 4.2 | 2033 ± 4.3 | 5701 ± 12 | 17.3 ± 0.3 |
| Sugarcane leaves (2) | 236 ± 0.1 | 2.78 ± 0.1 | 2178 ± 31 | 3.72 ± 0.1 | 129 ± 1.5 | 13634 ± 199 |
907 ± 13 | 76 ± 1.6 | 2.48 ± 1.1 | 1314 ± 13 | 4404 ± 46 | 14.1 ± 0.2 |
| Sugarcane leaves (3) | 206 ± 0.01 | 3.75 ± 0.2 | 5890 ± 40 | 3.54 ± 0.1 | 153 ± 2.4 | 11452 ± 125 |
2825 ± 30 | 36.7 ± 0.6 | 1.17 ± 0.3 | 2257 ± 38 | 9654 ± 58 | 19.9 ± 0.2 |
| Sugarcane leaves (4) | 300 ± 0.02 | 3.04 ± 0.1 | 4286 ± 21 | 4.01 ± 0.1 | 223 ± 4 | 9350 ± 27 | 2762 ± 8 | 50.2 ± 0.2 | 5.36 ± 0.7 | 1720 ± 10 | 10083 ± 63 |
19.3 ± 0.1 |
| Sugarcane leaves (5) | 113 ± 0.01 | 2.34 ± 0.1 | 2640 ± 104 | 4.95 ± 0.2 | 99.4 ± 5.4 | 13410 ± 2003 |
1514 ± 61 | 53.6 ± 2.4 | 2.62 ± 0.8 | 1604 ± 6 | 4206 ± 64 | 16.8 ± 0.3 |
| Sugarcane leaves (6) | 194 ± 0.01 | 3.61 ± 0.04 | 3220 ± 33 | 4.35 ± 0.05 | 112 ± 1.8 | 9780 ± 130 | 1350 ± 10 | 70.3 ± 2.5 | 3.98 ± 1.7 | 1600 ± 6.6 | 56.3 ± 4.7 | 16.9 ± 0.2 |
| Corn roots | 48 ± 0.01 | 16.0 ± 0.3 | 4961 ± 64 | 3.28 ± 0.1 | 16 ± 0.3 | 39177 ± 1247 |
2467 ± 45 | 28.8 ± 8.5 | 3.85 ± 0.6 | 2802 ± 141 | 444 ± 9.0 | 12.5 ± 0.7 |
| Corn leaves | 63 ± 0.08 | 46.3 ± 1.2 | 3021 ± 13 | 2.95 ± 0.1 | 46 ± 1.2 | 30881 ± 2996 |
1420 ± 20 | 46.7 ± 0.7 | 7.59 ± 2.0 | 1478 ± 33 | 450 ± 6.0 | 16.2 ± 2.2 |
| Soy leaves | 300 ± 12 | 29.4 ± 0.03 | 12838 ± 128 |
11.2 ± 0.1 | 277 ± 12 | 22581 ± 391 |
3199 ± 59 | 53.6 ± 0.5 | 1.88 ± 0.2 | 2460 ± 22 | 5725 ± 99 | 34.5 ± 0.1 |
| Alfalfa leaves | 1183 ± 58 | 39.7 ± 0.3 | 10858 ± 43 |
12.2 ± 0.3 | 458 ± 13 | 30092 ± 1685 |
2770 ± 96 | 36.2 ± 0.1 | 5.18 ± 2.0 | 2245 ± 61 | 465 ± 39 | 32.8 ± 0.6 |
4. Conclusions
A new procedure for determining Si in plants using microwave-assisted two-step digestion and ICP OES was proposed. The best results were obtained when HNO3 and NaOH solutions contained as low as 1.0 and 1.5 mol L−1 concentrations, respectively.Considering the figures of merit, the use of diluted solutions of NaOH for sample preparation is a feasible alternative since it minimizes contamination from NaOH reagent, allowing the determination of other important macro- and micro-nutrients.
A comparison among the results obtained with μED-XRF and the proposed procedure demonstrated that there is a high correlation among the Si concentrations obtained by both methods. The procedure was successfully applied to the simultaneous determination of Si, Al, B, Ca, Cu, Fe, K, Mg, Mn, Mo, S, and Zn in four CRMs and in a variety of ten different plant samples. Analyte recoveries and RSDs were in acceptable ranges. Low standard errors were obtained when the above-mentioned analytes were determined in all samples.
The developed procedure is simple, safe and reliable. It shows significant improvements when compared to the procedures described in the literature without adding any amount of HF.
Acknowledgements
The authors express their gratitude to the Coordenação de Aperfeiçoamento de Pessoal de Nível Superior (CAPES) for the researchship provided to J. A. V. A. B. We are grateful to Agilent Technologies Inc. for the loan of the ICP OES, to the Centro de Tecnologia Canavieira S.A. (Piracicaba-SP) and Embrapa Southeast Livestock in São Carlos (SP, Brazil) for providing plant samples. The authors are also thankful to Professor Francisco José Krug from the Centro de Energia Nuclear na Agricultura (CENA, USP, Piracicaba, SP, Brazil), Professor Carlos Ernesto G. R. Schaefer from the Federal University of Viçosa (Viçosa, MG, Brazil), Dr Gabriel Gustinelli Arantes de Carvalho, Dr Lidiane Cristina Nunes and Dr Marcelo Braga Bueno Guerra (CENA, USP) for providing μED-XRF data and the NCS CRM material.References
- Silicon in agriculture, ed. L. E. Datnoff, G. H. Snyder and G. H. Korndörfer, Elsevier B.V., Amsterdam, 1st edn, 2001 Search PubMed.
- J. F. Ma and N. Yamaji, Trends Plant Sci., 2006, 11, 392–397 CrossRef CAS PubMed.
- Y. Liang, W. Sun, Y. G. Zhu and P. Christie, Environ. Pollut., 2007, 147, 422–428 CrossRef CAS PubMed.
- S. M. Elgawhary and W. L. Lindsay, Soil Sci. Soc. Am. Proc., 1972, 36, 439–442 CrossRef CAS.
- F. Fauteux, W. Rémus-Borel, J. G. Menzies and R. R. Bélanger, FEMS Microbiol. Lett., 2005, 249, 1–6 CrossRef CAS PubMed.
- P. Mehrabanjoubani, A. Abdolzadeh and H. R. Sadeghipour, Pedosphere, 2015, 25, 192–201 CrossRef.
- M. Goto, H. Ehara, S. Karita, K. Takabe, N. Ogawa, Y. Yamada, S. Ogawa and M. Sani, Plant Sci., 2002, 164, 349–356 CrossRef.
- J. E. Kraska and G. A. Breitenbeck, Commun. Soil Sci. Plant Anal., 2010, 41, 2075–2085 CrossRef CAS PubMed.
- S. Reidinger, M. H. Ramsey and S. E. Hartley, New Phytol., 2012, 195, 699–706 CrossRef CAS PubMed.
- M. B. Haysom and A. O. Zofia, Commun. Soil Sci. Plant Anal., 2006, 37, 2299–2306 CrossRef CAS PubMed.
- X. Feng, S. Wu, A. Wharmby and A. Wittmeier, J. Anal. At. Spectrom., 1999, 14, 939–946 RSC.
- S. R. Oliveira, J. A. Gomes Neto, J. A. Nóbrega and B. T. Jones, Spectrochim. Acta, Part B, 2010, 65, 316–320 CrossRef PubMed.
- L. C. Azeredo, M. A. A. Azeredo, R. N. Castro, M. F. C. Saldanha and D. V. Perez, Spectrochim. Acta, Part B, 2002, 57, 2181–2185 CrossRef.
- L. Huang, R. W. Bell, B. Dell and J. Woodward, Commun. Soil Sci. Plant Anal., 2004, 35, 427–440 CrossRef CAS PubMed.
- J. Sucharová and I. Suchara, Anal. Chim. Acta, 2006, 576, 163–176 CrossRef PubMed.
- G. C. L. Araújo, M. H. Gonzalez, A. G. Ferreira, A. R. A. Nogueira and J. A. Nóbrega, Spectrochim. Acta, Part B, 2002, 57, 2121–2132 CrossRef.
- A. Krushevska, A. Lasztity, M. Kotrebai and R. M. Barnes, J. Anal. At. Spectrom., 1996, 11, 343–352 RSC.
- A. Krushevska and R. M. Barnes, J. Anal. At. Spectrom., 1994, 9, 981–984 RSC.
- P. Bennett and D. I. Siegel, Nature, 1987, 326, 684–686 CrossRef CAS PubMed.
- B. A. Fleming and D. A. Crerar, Geothermics, 1982, 11, 15–29 CrossRef CAS.
- G. B. Alexander, W. M. Heston and R. K. Iler, J. Phys. Chem., 1954, 58, 453–455 CrossRef CAS.
- C. L. Elliott and G. H. Snyder, J. Agric. Food Chem., 1991, 39, 1118–1119 CrossRef CAS.
- J. R. Dean, Practical Inductively Coupled Plasma Spectroscopy, John Wiley & Sons Ltd, 1st edn, 2005 Search PubMed.
- M. Thompson, J. N. Walsh, S. J. Walton and G. E. M. Hall, Handbook of Inductively Coupled Plasma Spectrometry, Chapman and Hall, New York, 2nd edn, 1989 Search PubMed.
- P. F. de Souza, D. Santos, G. G. A. de Carvalho, L. C. Nunes, M. da Silva Gomes, M. B. B. Guerra and F. J. Krug, Spectrochim. Acta, Part B, 2013, 83–84, 61–65 CrossRef PubMed.
- D. Wei-min, Z. H. Ke-qin, D. Bin-wu, S. Cheng-xiao, Z. H. Kang-le, C. Run and Z. H. Jie-yun, Ric. Sci., 2005, 12, 145–147 Search PubMed.
- R. D. Munson, in Handbook of Reference Methods for Plant Analysis, ed. Y. P. Kalra, 1st edn, 1998, vol. 38, pp. 1–25 Search PubMed.
| This journal is © The Royal Society of Chemistry 2016 |