 Open Access Article
Lanthanide-mediated tuning of electronic and magnetic properties in heterotrimetallic cyclooctatetraenyl multidecker self-assemblies†
Zheng
Zhou
 a,
James
McNeely
b,
Joshua
Greenough
a,
Zheng
Wei
a,
James
McNeely
b,
Joshua
Greenough
a,
Zheng
Wei
 a,
Haixiang
Han
c,
Mathieu
Rouzières
d,
Andrey Yu.
Rogachev
*e,
Rodolphe
Clérac
 *d and
Marina A.
Petrukhina
 *a
*a
aDepartment of Chemistry, University at Albany, State University of New York, Albany, NY 12222, USA. E-mail: mpetrukhina@albany.edu
bDepartment of Chemistry, Boston University, Boston, MA, USA
cDepartment of Materials Science and Engineering, Cornell University, Ithaca, New York 14853, USA
dUniv. of Bordeaux, CNRS, Centre de Recherche Paul Pascal, UMR 5031, F-33600, Pessac, France. E-mail: clerac@crpp-bordeaux.cnrs.fr
eDepartment of Chemistry, Illinois Institute of Technology, Chicago, IL 60616, USA. E-mail: andrey.rogachev@iit.edu; andrey.rogachev@gmail.com
First published on 14th March 2022
Abstract
The synthesis of a novel family of homoleptic COT-based heterotrimetallic self-assemblies bearing the formula [LnKCa(COT)3(THF)3] (Ln(III) = Gd, Tb, Dy, Ho, Er, Tm, and Yb) is reported followed by their X-ray crystallographic and magnetic characterization. All crystals conform to the monoclinic P21/c space group with a slight compression of the unit cell from 3396.4(2) Å3 to 3373.2(4) Å3 along the series. All complexes exhibit a triple-decker structure having the Ln(III) and K(I) ions sandwiched by three COT2− ligands with an end-bound {Ca2+(THF)3} moiety to form a non-linear (153.5°) arrangement of three different metals. The COT2− ligands act in a η8-mode with respect to all metal centers. A detailed structural comparison of this unique set of heterotrimetallic complexes has revealed consistent trends along the series. From Gd to Yb, the Ln to ring-centroid distance decreases from 1.961(3) Å to 1.827(2) Å. In contrast, the separation of K(I) and Ca(II) ions from the COT-centroid (2.443(3) and 1.914(3) Å, respectively) is not affected by the change of Ln(III) ions. The magnetic property investigation of the [LnKCa(COT)3(THF)3] series (Ln(III) = Gd, Tb, Dy, Ho, Er, and Tm) reveals that the Dy, Er, and Tm complexes display slow relaxation of their magnetization, in other words, single-molecule magnet (SMM) properties. This behaviour is dominated by thermally activated (Orbach-like) and quantum tunneling processes for [DyKCa(COT)3(THF)3] in contrast to [ErKCa(COT)3(THF)3], in which the thermally activated and Raman processes appear to be relevant. Details of the electronic structures and magnetic properties of these complexes are further clarified with the help of DFT and ab initio theoretical calculations.
Introduction
In recent decades, the design of structural platforms capable of supporting target mixed-metal ion combinations attracted significant interest of synthetic and materials chemists from both fundamental and applied perspectives.1–4 This attention is not surprising, given the near-infinite number of possible combinations of metals, ligands, and their spatial-orientations. It is precisely this diversity of constitutional and structural possibilities that has given rise to a wide range of physical properties and applications such as single-molecule magnets (SMMs),5–9 luminescence,10,11 and catalysis.12,13 Importantly, with powerful design concepts, the properties of individual metal centers can be modulated through variations of experimental conditions and the structural environment,14–16 thus entailing novel responsive compounds, which exhibit properties superior in complexity to their homometallic analogues and lower-nuclearity cognates.17,18Despite the expected diversity of high-nuclearity (three or more metal centers) heterometallic complexes, a search of the literature reveals that nearly all reported examples rely on oxygen or nitrogen-based ligands.6,16,19–21 The vast majority of structurally characterized complexes fall into the broad family of coordination polymers,22,23 with most of the remaining structural scaffolds being either multinuclear metal clusters24 or supramolecular networks.15 Often these structurally complex architectures have been shown to evade rational design,25 thus thwarting control of their physical properties, particularly in regards to magnetism. This leaves a gap in our fundamental understanding of how multiple metals of different natures interact in an organometallic environment.
One ligand that has shown particular viability for the construction of heterometallic organometallic complexes is the aromatic 10 π electron cyclooctatetraenyl (COT2−) ligand.26 The success of COT2− arises from its high rotational symmetry27 and unique ability to bind to metal ions that span a wide range of ionic radii from as large as 1.38 Å (K(I))28 to as small as 0.605 Å (V(IV)).29 These favorable properties resulted in the broad use of COT2− in the synthesis of new organometallic complexes of lanthanides.28,30–32 The interplay of the different oxidation states of lanthanides and the ratio between Ln and COT2− ligands has been efficiently utilized in the preparation of many Ln–COT complexes with interesting magnetic properties,32,33 including remarkable mixed-ligand SMMs.33–37
Considering homometallic organometallic complexes, Ln(IV) ions prefer to be sandwiched by two COT2− rings (1![[thin space (1/6-em)]](https://www.rsc.org/images/entities/char_2009.gif) :
:![[thin space (1/6-em)]](https://www.rsc.org/images/entities/char_2009.gif) 2 ratio, Scheme 1a), as in Ce(COT)2.38 Complexes of Ln(III) ions with COT2− of a 2
2 ratio, Scheme 1a), as in Ce(COT)2.38 Complexes of Ln(III) ions with COT2− of a 2![[thin space (1/6-em)]](https://www.rsc.org/images/entities/char_2009.gif) :
:![[thin space (1/6-em)]](https://www.rsc.org/images/entities/char_2009.gif) 3 composition (Scheme 1b) are well known,31,32,39 with some new members of this type having recently been synthesized and structurally characterized by our group.40 Furthermore, the addition of substituents to COT ligands has been used to modulate the geometry of such complexes,41 further enhancing their SMM behaviour.39,42 In addition, a series of the Ln(II)-based 1D polymers with a 1
3 composition (Scheme 1b) are well known,31,32,39 with some new members of this type having recently been synthesized and structurally characterized by our group.40 Furthermore, the addition of substituents to COT ligands has been used to modulate the geometry of such complexes,41 further enhancing their SMM behaviour.39,42 In addition, a series of the Ln(II)-based 1D polymers with a 1![[thin space (1/6-em)]](https://www.rsc.org/images/entities/char_2009.gif) :
:![[thin space (1/6-em)]](https://www.rsc.org/images/entities/char_2009.gif) 1 ratio to COT2− has been reported,43 but their crystal structures remain unknown.
1 ratio to COT2− has been reported,43 but their crystal structures remain unknown.
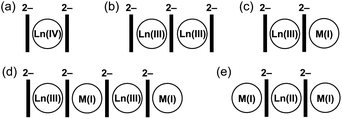 | ||
| Scheme 1 Depiction of crystallographically characterized homoleptic Ln complexes with the COT2− ligand. | ||
Switching to bimetallic complexes, the 1![[thin space (1/6-em)]](https://www.rsc.org/images/entities/char_2009.gif) :
:![[thin space (1/6-em)]](https://www.rsc.org/images/entities/char_2009.gif) 1 ratio of Ln(III)
1 ratio of Ln(III)![[thin space (1/6-em)]](https://www.rsc.org/images/entities/char_2009.gif) :
:![[thin space (1/6-em)]](https://www.rsc.org/images/entities/char_2009.gif) K(I) allows balancing the negative charge of COT2− and has been realized in two general structural types. The most popular structural motif is represented by the anionic sandwich [Ln(COT)2]− with a contact or solvent-separated M(I) ion (Scheme 1c).44 In 2013, a report on the SMM properties of K[Er(COT)2] drove strong attention to this type of complex.45 In parallel, the use of bulky COT ligands in such structures has been shown to improve magnetic behaviour.39,42,46 The second structural type is based on Ln(III)–K(I)–Ln(III)–K(I) tetranuclear species (Scheme 1d), which was initially synthesized and structurally characterized back in 1991
K(I) allows balancing the negative charge of COT2− and has been realized in two general structural types. The most popular structural motif is represented by the anionic sandwich [Ln(COT)2]− with a contact or solvent-separated M(I) ion (Scheme 1c).44 In 2013, a report on the SMM properties of K[Er(COT)2] drove strong attention to this type of complex.45 In parallel, the use of bulky COT ligands in such structures has been shown to improve magnetic behaviour.39,42,46 The second structural type is based on Ln(III)–K(I)–Ln(III)–K(I) tetranuclear species (Scheme 1d), which was initially synthesized and structurally characterized back in 1991![[thin space (1/6-em)]](https://www.rsc.org/images/entities/char_2009.gif) 28 and further investigated due to their SMM properties in 2014.42 For bimetallic combinations with Ln(II), several products were reported (Scheme 1e),47–50 in which Eu(II), Tm(II), or Yb(II) is sandwiched by two COT2− anions, and the negative charge is balanced by the side-binding of two M(I) ions.
28 and further investigated due to their SMM properties in 2014.42 For bimetallic combinations with Ln(II), several products were reported (Scheme 1e),47–50 in which Eu(II), Tm(II), or Yb(II) is sandwiched by two COT2− anions, and the negative charge is balanced by the side-binding of two M(I) ions.
To date, the highest energy barriers of the Orbach relaxation for the COT-based SMMs have been observed in mononuclear Ln complexes and can be attributed to a fine refinement of their crystal field and local symmetry.51–54 Although assembling larger molecules containing multiple metal centers is very challenging, such extension could facilitate exchange coupling between metal centers and further enhance magnetic properties.39,55 Furthermore, introducing more paramagnetic ions could increase the total magnetic moment, which could also improve the blocking temperature of lanthanide-based SMMs.42
Until now, there have been no COT-based heterotrimetallic complexes reported. Inspired by the above seminal studies, we decided to gradually add structural complexity by increasing the number of unique metal centers from two to three. We targeted the preparation of novel heterotrimetallic homoleptic cyclooctatetraenyl compounds and used Ca(II) as a source of M(II) in addition to Ln(III) and K(I). Herein, we report the synthesis and full characterization of the first heterotrimetallic cyclooctatetraenyl complexes bearing the formula [LnKCa(COT)3(THF)3] (Ln = Gd, Tb, Dy, Ho, Er, Tm, and Yb). Their X-ray crystallographic analysis revealed unique structural features and systematic trends along the series. The magnetic properties of the new set of complexes have been investigated, revealing the SMM behaviour of the Dy, Er, and Tm analogues.
Results and discussion
The preparation of this new class of compounds has been achieved by a facile one-pot synthesis (Scheme 2). The solution of K2COT (3 eq.) was added dropwise to an equimolar mixture of LnCl3 (Ln = Gd, Tb, Dy, Ho, Er, Tm, and Yb) and CaI2 in THF at room temperature. The reaction was allowed to proceed to completion over 24 hours. After removal of the KI and KCl salts by filtration, the products were crystallized using slow diffusion of hexanes to the THF filtrate. Plate-shaped crystals were isolated in good yield after several days (see the ESI† for more details). The X-ray diffraction study confirmed that products are isostructural and conform to a monoclinic P21/c space group (Table S8†). Notably, as the ionic radius decreases from Gd to Yb, the unit cell undergoes slight compression with the volume changing from 3396.4(2) to 3373.2(4) Å3, which is consistent with the observed shortening of the a and c axes.All complexes contain three metal centers with a ratio of 1![[thin space (1/6-em)]](https://www.rsc.org/images/entities/char_2009.gif) :
:![[thin space (1/6-em)]](https://www.rsc.org/images/entities/char_2009.gif) 1
1![[thin space (1/6-em)]](https://www.rsc.org/images/entities/char_2009.gif) :
:![[thin space (1/6-em)]](https://www.rsc.org/images/entities/char_2009.gif) 1 to form [LnKCa(COT)3(THF)3] (Ln = Gd (1-Gd), Tb (2-Tb), Dy (3-Dy), Ho (4-Ho), Er (5-Er), Tm (6-Tm), and Yb (7-Yb)). The phase purity of 1–7 has been proven by X-ray powder diffraction using Le Bail fit (Fig. S2–S8, Tables S1–S7†). The infrared spectra of the crystalline solids show their close similarity for the series with major bands at 677, 876, 888, and 1030 cm−1 (Fig. S1†).
1 to form [LnKCa(COT)3(THF)3] (Ln = Gd (1-Gd), Tb (2-Tb), Dy (3-Dy), Ho (4-Ho), Er (5-Er), Tm (6-Tm), and Yb (7-Yb)). The phase purity of 1–7 has been proven by X-ray powder diffraction using Le Bail fit (Fig. S2–S8, Tables S1–S7†). The infrared spectra of the crystalline solids show their close similarity for the series with major bands at 677, 876, 888, and 1030 cm−1 (Fig. S1†).
Crystallographic study
Since Dy(III) and Er(III) complexes usually exhibit an interesting magnetic response such as SMM properties, we first performed a detailed structural analysis of 3-Dy and 5-Er and then used them for comparison with the [LnKCa(COT)3(THF)3] series. In the crystal structures of 3-Dy (Fig. 1a and b) and 5-Er (Fig. S13†), the Dy(III) or Er(III) ion is sandwiched by two η8-coordinated COT2− ligands (COT1 and COT2), with the two rings being almost parallel to each other (0.9° and 0.8°, respectively). This small deviation is commonly seen in [Ln(COT)2]− complexes with a tilting angle up to 7.9°.28,31,40,42,45,47 The Dy–C (2.614(8)–2.683(7) Å) and Er–C (2.593(2)–2.644(2) Å) distances are close (Table 1) to those reported in the literature.33,39,45,46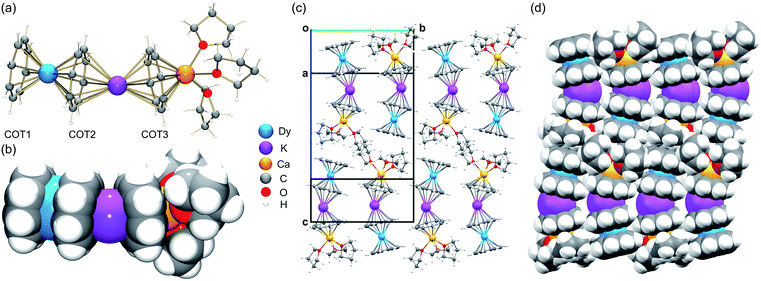 | ||
| Fig. 1 Crystal structure and solid-state packing of [DyKCa(COT)3(THF)3] (3-Dy) at 100 K: (a and c) ball-and-stick and (b and d) space-filling models. | ||
| 1-Gd | 2-Tb | 3-Dy | 4-Ho | 5-Er | 6-Tm | 7-Yb | |
|---|---|---|---|---|---|---|---|
| a Values are averaged. b The ionic radii correspond to the coordination number 8. | |||||||
| Ionic radius56 | 1.053 | 1.040 | 1.027 | 1.015 | 1.004 | 0.994 | 0.985 |
| Ln–COT1 | 1.913(3) | 1.891(2) | 1.874(8) | 1.859(3) | 1.846(2) | 1.832(2) | 1.827(2) |
| Ln–COT2 | 1.961(3) | 1.939(2) | 1.923(8) | 1.907(3) | 1.896(2) | 1.881(2) | 1.871(2) |
| K–COT2 | 2.479(3) | 2.476(2) | 2.478(8) | 2.476(3) | 2.475(2) | 2.476(2) | 2.478(2) |
| K–COT3 | 2.409(3) | 2.407(2) | 2.408(8) | 2.407(3) | 2.408(2) | 2.409(2) | 2.407(2) |
| Ca–COT3 | 1.915(2) | 1.914(2) | 1.912(8) | 1.914(2) | 1.913(2) | 1.916(2) | 1.913(2) |
| ∠Ln–K–Ca | 153.47(2) | 153.56(1) | 153.52(5) | 153.56(2) | 153.59(1) | 153.62(1) | 153.62(1) |
In the solid-state structures of 3-Dy (Fig. 1c and d) and 5-Er (Fig. S16†), some weak C–H⋯π interactions can be identified along the c axis between the open-ended COT1 decks and coordinated THF molecules from neighboring molecules, with the shortest distances of 2.708(5)–2.751(5) Å and 2.693(2)–2.731(2) Å, respectively. The resulting 1D columns are packed in opposite directions with no significant interactions found between the adjacent columns.
A detailed structural comparison of the extended family of complexes 1–7 (see Fig. S9–S15† for analogous complexes) was carried out, revealing consistent trends along the series (Table 1 and Fig. 2).56 From 1-Gd to 7-Yb, the Ln to ring-centroid distance systematically decreases from 1.913(3) Å to 1.827(2) Å and from 1.961(3) Å to 1.871(2) Å (for COT1 and COT2, respectively), which is consistent with the decrease of the Ln(III) ionic radius.56 The Ln(III) ion sits closer to COT1 than COT2, with the Ln–COTcentroid bond length difference averaging at 0.048 Å. In contrast, the K–COTcentroid and Ca–COT3centroid (averaged to 1.914(3) Å) distances are not affected by the change of Ln(III) ions. As mentioned, the K(I) to the COT3-centroid distance (averaged to 2.477(3) Å) is shorter than that to COT2 (averaged to 2.408(3) Å). The average Ln–K–Ca angle is 153.6°, which is not affected by the change of lanthanide ions in this series. In the solid-state structures of 1–7 (Fig. S16†), 1D columns are formed along the c axis through weak C–H⋯π interactions between COT1 and THF from adjacent molecules (2.692(1)–2.751(5) Å, Table S11†), with no noticeable interactions found between the adjacent columns. The intramolecular Ln–K and Ca–K distances for this series are 4.348(2)–4.440(2) Å and 4.319(2)–4.323(2) Å, respectively (Table S12†). The shortest intermolecular Ln–Ln distances between the columns range from 9.260(2) to 9.277(2) Å. The solid-state packing in 1–7 is tight with the void space (averaged to 11.8 Å3) being similar for the whole family.
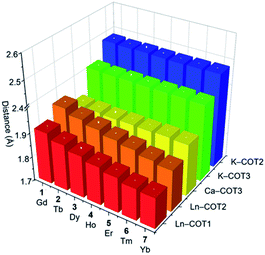 | ||
| Fig. 2 A 3D chart of the selected M–COTcentroid distances (Å) tabulated in Table 1 for 1–7. | ||
Photoluminescence properties
The heterotrimetallic [LnKCa(COT)3(THF)3] scaffold exhibits great flexibility in accommodating a variety of different lanthanide ions, providing a unique platform for the investigation of the relationship between the lanthanide metal center and optical properties. In this respect, it offers the feasibility to tune the electronic structure of such heterotrimetallic compounds by choosing an appropriate lanthanide metal, since a significant contribution comes from their 4f orbitals. Based on photoluminescence spectroscopy investigation, compounds 1–7 feature similar PL and PLE profiles (Fig. 3). The main excitation wavelengths for this series fall into a relatively narrow range between 308 and 362 nm, whereas the corresponding emission peaks vary broadly from 390 to 592 nm, depending on the lanthanide ion. Specifically, complexes 3–7 (Dy, Ho, Er, Tm, and Yb) demonstrate typical sharp emission profiles with relatively small Stokes shifts ranging from 40 to 82 nm. This stems from the evidence that the optical responses of lanthanide complexes are associated with electron transitions within the 4fn orbitals, which are shielded by the filled 5s2 and 5p2 orbitals. As a result, the ligand field strength cannot significantly affect the energy, thus leading to a small Stokes shift.57,58 In contrast, complexes 1-Gd and 2-Tb exhibit larger Stokes shifts of 230 and 251 nm, respectively. This can be associated with the special position Tb holds among the lanthanide series, as the photoluminescence of Tb-containing complexes results from the 4f–5d transition, while ligand-to-metal charge-transfer (LMCT) is the main driving force for others.59,60 Similar observations have also been reported for other Tb and Gd-complexes.61 For example, upon excitation at 350 nm, complex [Tb(Cp)3(THF)] (Cp = cyclopentadienyl) displays a broad photoluminescence band from 545 to 555 nm.62 Similarly, the [Tb(hfa)3(tppo)2] (hfa = hexafluoroacetylacetonate, tppo = triphenylphosphine oxide) complex synthesized by Hasegawa and co-workers displays photoluminescence at 548 nm upon excitation at 350 nm.63 The versatility of lanthanide ions results in their unique electronic structures, which can be further used to tune the optical properties, suggesting potential applications in photocatalysis, sensing, and bio-imaging.64,65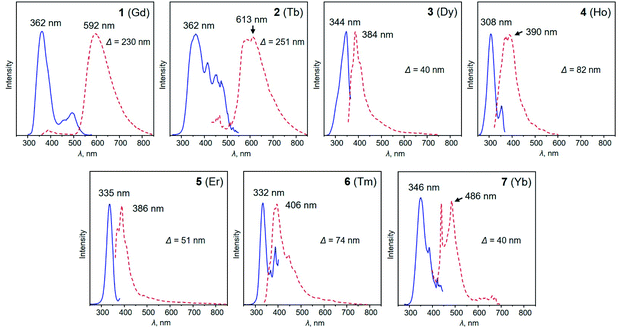 | ||
| Fig. 3 Photoluminescence excitation (PLE, blue lines) and photoluminescence emission (PL, red dotted lines) spectra of 1–7 in THF at 20 °C. | ||
Magnetic properties
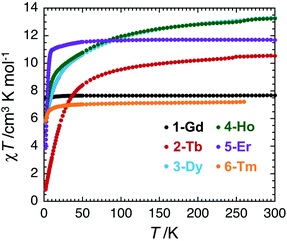
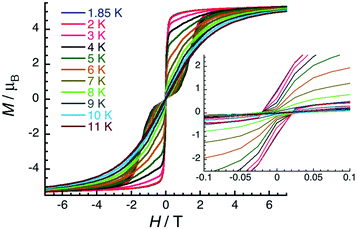
The magnetic properties of complexes 1–6 were studied using dc and ac susceptibility measurements (see the ESI† for more details). Around room temperature, the χT product values are 7.7, 10.5, 13.3, 13.3, 11.7 and 7.2 cm3 K mol−1, respectively, which is coherent with the presence of a single paramagnetic lanthanide site from Gd(III) to Tm(III) (Fig. 4).66 While the χT value remains quasi constant down to 1.85 K (7.6 cm3 K mol−1) for 1-Gd, it shows a more or less marked decrease depending on the Ln(III) center in the experimental temperature window of measurements and reaches the values of 0.86 cm3 K mol−1 for 2-Tb, 5.76 cm3 K mol−1 for 3-Dy, 6.05 cm3 K mol−1 for 4-Ho, 3.88 cm3 K mol−1 for 5-Er, and 5.91 cm3 K mol−1 for 6-Tm at 1.85 K. These thermal variations of the χT product confirm the expected presence of a crystal-field splitting for the Tb(III), Dy(III), Ho(III), Er(III), and Tm(III) complexes and a simple Curie paramagnetic behaviour for the Gd(III) analogue.66 The field dependence of magnetisation was also measured below 8 K (between 0 and 7 T), as shown in Fig. S17–S22.† Under 7 T at 1.85 K, the magnetisations of 1-Gd, 5-Er, and 6-Tm are close to saturation, while an absence of saturation is clearly observed for 2-Tb, 3-Dy, and 4-Ho containing the most magnetically anisotropic Ln(III) ions, reaching values of 3.13, 5.52, and 6.28 μB, respectively.Slow dynamics or blocking of magnetisation was detected by dc measurements only for the Er(III) complex (5-Er), which is commonly seen in the reported Er–COT complexes.33,36,42,45,67–69 Field-dependent magnetisation experiments revealed a typical butterfly shaped magnetic hysteretic loop below 10 K (Fig. 5). The magnetisation at 1.85 K and 7 T clearly saturates to a value of 5.29 μB. In the reported [Er2(COT′′)3] (COT′′ = 1,4-bis(trimethylsilyl) cyclooctatetraene) complex, a significant magnetic interaction between two close Er(III) ions (Er–Er: 4.11 Å) is observed, resulting in an s-shaped hysteresis loop that closes at 12 K.42 In contrast, a similar butterfly shaped hysteresis of [K2Er2(COT)4(THF)4] below 12 K is indicative of very weak interactions between the Er(III) ions (Er–Er: 8.12 Å).42 Hence, the dynamic relaxation process of 5-Er should not be influenced by the Er⋯Er magnetic interactions based on the long Er–Er distance (9.26 Å) and thus, the relaxation originates from a magnetically isolated Er(III) center.
Ac susceptibility was measured for these compounds in order to probe the magnetisation dynamics and determine the characteristic relaxation time among this family of complexes. As shown in the following, strong temperature, dc field and frequency dependencies of the ac susceptibility, i.e. SMM properties, are observed for 3-Dy, 5-Er, and 6-Tm, while no out-of-phase (χ′′) signal is detected for the other analogues. It can be noted here that the magnetic properties of 2-Tb are comparable to the reported Tb-sandwich with the substituted COT ligands, [Li(DME)3][Tb(COT′′)2],70 where no indication of slow magnetic relaxation or hysteresis was observed.
For the Dy(III) complex (3-Dy), a single relaxation mode is observed around 2100 Hz at 1.8 K (Fig. 6). This mode is relatively temperature independent up to 3.5 K, as expected for a magnetisation relaxation dominated by quantum tunnelling effects. Above this temperature, the relaxation is temperature dependent and reaches the limit of the experimental ac frequency window (10 kHz) around 7 K. When applying a magnetic field at 5 K, the characteristic relaxation frequency of the relaxation mode shifts from 3500 Hz in zero-dc field to 420 Hz at 0.1 T (Fig. S24 and S25†). The relaxation time of the magnetisation, τ, and its estimated standard deviation (ESD) were deduced as a function of the applied dc-field at 5 K and as a function of the temperature at 0 and 0.1 T (Fig. S29†) from the experimental χ′ versus ν and χ′′ versus ν data (Fig. 6, S23 and S26†) fitted to the generalised Debye model.71,72
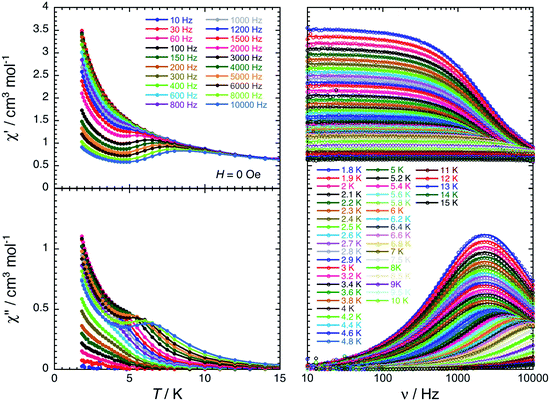 | ||
| Fig. 6 In-phase (top) and out-of-phase (bottom) components of the molar ac magnetic susceptibility of 3-Dy measured as a function of temperature at different frequencies (left) and as a function of frequency at different temperatures (right) in zero dc-field. The solid lines on the left plots are a guides for the eye. The solid lines on the right plots are the generalized Debye fits71,72 of the experimental ac susceptibility data (open dots). | ||
Paramagnetic relaxation is a well-known phenomenon,73 which finds its origin in four main mechanisms: Raman,74 direct,73 thermally activated (Arrhenius or Orbach-like)73,75 and quantum tunnelling of the magnetisation (QTM)76–79 processes. Based on the analysis of the relaxation time variations (Fig. S29, see the ESI for equations and detailed discussion, Fig. S28–S30†), both Orbach-like and QTM relaxation mechanisms seem to be present in 3-Dy. Indeed, the dc-field dependence of τ above 0.1 T could only be potentially reproduced by an Orbach-like relaxation, while at low fields below 0.05 T, the relaxation time is compatible with an H2 variation expected for QTM or Raman mechanisms. Nevertheless, considering both field and temperature dependences of τ, the modelling of the experimental data favors Orbach-like and QTM relaxations (see the ESI†). It is important to note that the origin of the Orbach-like relaxation with an estimated energy gap of about 43 K is not obvious for a mononuclear Dy complex, and it should certainly be challenged in following theoretical studies (vide infra). Even if the relaxation time can be fitted well with the experimental data using five adjustable parameters (Fig. S29†) and similar approaches have already been used for Dy–COT analogous SMMs,33,39 the physics of the present dynamics might be better described by alternative models, and thus the current analysis should be taken with great caution as any similar modelling of the relaxation for SMMs.
For the Er(III) complex (5-Er), the dynamics of the magnetisation is slow enough to be detectable by dc magnetic measurements below 10 K (Fig. 5). Above this temperature, the relaxation time reaches the experimental time scale accessible by the ac susceptibility measurements and thus it can be accurately measured for complex 5-Er. As shown in Fig. 7, the single relaxation mode observed at 11 K around 0.018 Hz is strongly temperature-dependent and reaches 10 kHz around 37 K. When applying a magnetic field at 27 K, the characteristic frequency of the relaxation mode stays unchanged suggesting that the magnetisation relaxation is dominated by an Orbach-like process in this temperature range. Nevertheless, the ln(τ) vs. T−1 plot (Fig. S30†) is not perfectly linear revealing a departure from a simple thermally activated process. A second relaxation pathway should thus be considered. In zero-dc field, only Raman and QTM are active processes but only a model considering Raman and Orbach-like relaxations was able to fit all the experimental data (Fig. S30†).45 It is worth mentioning that the characteristics of the Orbach-like process (Δ/kB = 287(16) K) are indeed similar to those estimated in the related Er–COT complexes.33,42,45
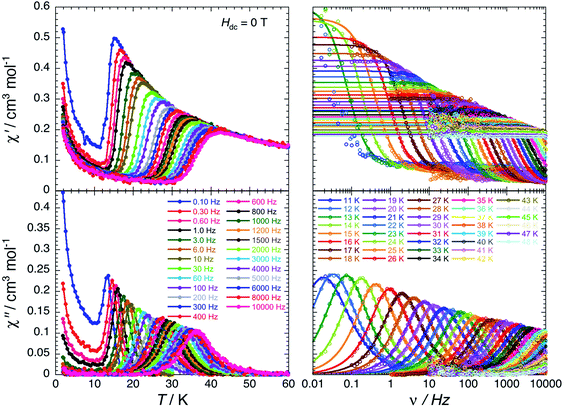 | ||
| Fig. 7 In-phase (top) and out-of-phase (bottom) components of the molar ac magnetic susceptibility of 5-Er measured as a function of temperature at different frequencies (left) and as a function of frequency at different temperatures (right) in zero dc-field. The solid lines on the left plots are a guide for the eye. The solid lines on the right plots are the generalized Debye fits71,72 of the experimental ac susceptibility data (open dots). | ||
In the case of the Tm(III) analogue (6-Tm), ac measurements reveal a broad relaxation mode (Fig. S31 and S32†), which is weakly temperature dependent and disappears rapidly when a magnetic field is applied suggesting a dominant quantum relaxation.
Thus, despite structural similarity of complexes 1–7, variations in magnetic behaviour have been clearly observed, prompting comprehensive theoretical investigation of the electronic structures and magnetic properties.
Calculations of electronic structures and magnetic properties
In order to gain further insights into the periodic trends observed in the electronic structures and magnetic properties of the target systems, DFT and ab initio calculations were performed with the ORCA80–82 electronic structure suite. First, we analysed the correlation between geometrical and electronic structures by considering nephelauxetic and relativistic nephelauxetic reductions for the series using strongly correlated multireference perturbation theory of the second order in the NEVPT2 variant (Fig. 8). A similar approach has been recently used by Aravena et al.83 It can be seen that both reductions increase when moving from 1-Gd to 7-Yb, which suggests that the covalency is slightly decreased across the series as the ionic radius is reduced.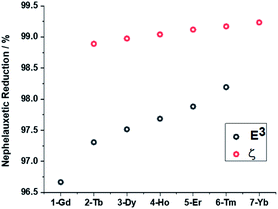 | ||
| Fig. 8 Nephelauxetic (black) and relativistic nephelauxetic reductions (red) calculated at the NEVPT2(n,7) level. | ||
The trend is also supported by atomic charges and atomic orbital populations calculated within the NBO/NPA framework at both PBE0 and CASSCF(n,7) levels (Table 2). Both sets suggest that the covalent component of the bonding is best described as the interaction between the π-system of the COT ligand and the Ln 5d shell, although the strength of these bondings appeared to be nearly constant from 1-Gd to 6-Tm. Average CCOT1–Ln Wiberg bond orders (WBOs) of 0.19–0.20 are observed for 1–6, with corresponding WBOs of 0.15–0.16 for CCOT2–Ln bonding contacts. The tendency in bond orders correlates well with that observed in natural charges of the Ln centers (Table 2). The nature of the bonding was further confirmed by the second-order perturbation analysis of the Fock matrix in the NBO basis. It was found that the population of 5d shell along the series correlates with the donor–acceptor stabilization energies between the π-system of COT and the 5d atomic orbitals of Ln.
| System | CASSCF(n,7) | DFT | ||||||
|---|---|---|---|---|---|---|---|---|
| Charge | 4f | 5d | 6s | Charge | 4f | 5d | 6s | |
| 1-Gd | 1.50 | 7.01 | 1.32 | 0.11 | 1.31 | 7.06 | 1.44 | 0.11 |
| 2-Tb | 1.47 | 8.01 | 1.34 | 0.11 | 1.28 | 8.08 | 1.45 | 0.12 |
| 3-Dy | 1.47 | 9.01 | 1.34 | 0.12 | 1.27 | 9.09 | 1.44 | 0.12 |
| 4-Ho | 1.47 | 10.01 | 1.34 | 0.12 | 1.29 | 10.05 | 1.46 | 0.12 |
| 5-Er | 1.46 | 11.00 | 1.34 | 0.12 | 1.29 | 11.05 | 1.46 | 0.12 |
| 6-Tm | 1.46 | 12.00 | 1.35 | 0.12 | 1.27 | 12.08 | 1.45 | 0.13 |
| 7-Yb | 1.47 | 13.00 | 1.34 | 0.12 | 1.22 | 13.21 | 1.36 | 0.13 |
Notably, calculations clearly indicated 7-Yb as an outlier. A large increase in excess 4f population and a corresponding decrease in the 5d occupation were observed for this system. Looking at the donor–acceptor interactions between the Yb(III) center and the COT2− π-systems, two notably occupied formally virtual lone valence orbitals, namely 5d–4f hybrids, were found (Fig. 9), thus showing an involvement of the f-shell in the bonding. The second-order delocalization stabilization energy imparted by COT2− π-orbitals to these two acceptors was calculated to be 4.2 kcal mol−1.
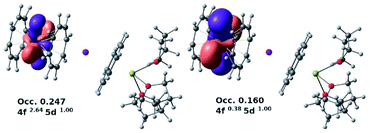 | ||
| Fig. 9 Two notably occupied formally virtual lone valence 5d–4f hybrid orbitals for the 7-Yb system (PBE0/SARC2-ZORA-QZVP/ZORA). | ||
This unusual electronic structure of 7-Yb was further confirmed by ab initio ligand field theory (AILFT84) analysis of the systems. The 4f shell splitting diagrams computed at the NEVPT2(n,7)/QDPT level of theory are presented in Fig. 10. Notably, a striking discontinuity in the progression of the E2u (based on the D8h symmetry) energy was observed for 7-Yb. The MAD of these orbital energies for 1-Gd to 6-Tm is 52 cm−1 when referring to the barycenter. In the case of 7-Yb, however, this is more than 660 cm−1 above the 1–6 barycenter. This strongly hints at orbital interactions with the shell.
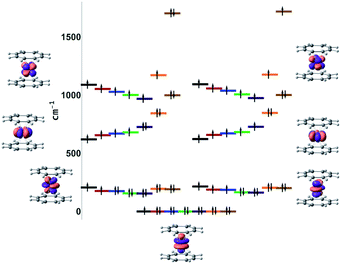 | ||
| Fig. 10 NEVPT2(n,7)/QDPT AILFT f-orbital splitting (black = Gd, red = Tb, blue = Dy, green = Ho, purple = Er, orange = Tm, brown = Yb). | ||
Importantly, calculations of the magnetic properties performed at the NEVPT2(n,7)/QDPT level showed good agreement with experimental results (see Fig. S33–S38†). The calculated room temperature χT products of 7.8, 11.2, 13.8, 13.4, 11.1, and 6.5 cm3 K mol−1 for 1–6, respectively, agree well with experimentally measured values of 7.7, 10.5, 13.3, 13.3, 11.7, and 7.2 cm3 K mol−1 for the corresponding systems. The reduction in magnetisation at lower temperatures is also reproduced by the computational model. These reductions are due to depopulation of excited levels, and their reproduction clearly indicates that the theoretical model used in this study correctly captures the splitting in the ground state manifold.
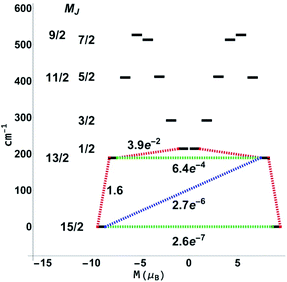
For the next step, the CASSCF(n,7)/QDPT/SINGLE_ANISO85–87 approach was used to investigate the ground state multiplets of the series in order to shed light on the relaxation mechanisms for 3-Dy and 5-Er. Notably, the blocking diagram for 5-Er (Fig. 11) with an energy gap of 272 K between the MJ = 15/2 and MJ = 13/2 state is similar to the diagram recently reported by Ungur et al.33 for the highly symmetrical Ln–COT2− sandwich-like systems. The transverse moments connecting the Jz = 15 to Jz = −15, −13 states are very small, thus suggesting extremely small Orbach and QTM rates and increasing the blocking temperature. This argument is also bolstered by the axiality of the effective g-values for the Jz = ±15, ±13 multiplets (see the ESI, Table S14†).
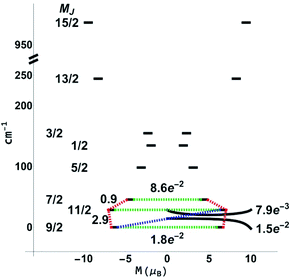
While the features of the multiplet spectrum for 3-Dy with an energy gap of 41 K between the ground and the first excited microstates (Fig. 12) are qualitatively similar to those reported by Ungur et al. for the symmetric Dy–COT2− complexes, the QTM and Orbach transverse moments calculated in this work are ∼½ of those calculated in ref. 87. Given that the spin-relaxation processes approximately scale as the square of the transverse moment connecting states, the Orbach and QTM rates in the 3-Dy system can be reliably considered as ∼¼ of those in the symmetric Dy–COT2− molecular species. This reduction in QTM and Orbach rates gives a direct support to the enhanced energy gap derived in this study.
Conclusions
A novel family of homoleptic cyclooctatetraenyl heterotrimetallic complexes, [LnKCa(COT)3(THF)3], has been synthesized and fully characterized using X-ray diffraction, spectroscopy and magnetic susceptibility measurements. Their unique triple-decker molecular structure with Ln(III) and K(I) ions sandwiched by three COT2− ligands with an end-bound {Ca2+(THF)3} moiety adopts a bent arrangement of three different metals. Systematic changes in the geometrical parameters are clearly observed along the series, consistent with the ionic radii decrease from Gd to Yb. The magnetic properties study of the [LnKCa(COT)3(THF)3] family (Ln(III) = Gd, Tb, Dy, Ho, Er, and Tm) revealed the single-molecule magnet (SMM) properties of the Dy, Er, and Tm analogues. Theoretical modeling at the density functional and ab initio levels of theory allowed a clear establishment of the magneto-structural correlations, thus bridging geometrical parameters, electronic structures and magnetic behavior of these unique heterotrimetallic triple-decker COT complexes. Competition between the Orbach relaxation mechanism and quantum tunneling of magnetisation was investigated with the help of multireference perturbation theory followed by the construction of corresponding blocking diagrams. The multifaceted nature of magnetic relaxation in these systems was confirmed, thus being in a good agreement with experimental observations. The accuracy of theoretical calculations was supported by precise reproduction of experimental χT curves.Importantly, the new heterotrimetallic scaffold accommodating axially aligned metal ions from groups 1, 2 and 3 in three different oxidation states provide new synthetic strategies for building multimetallic SMMs and tuning their intramolecular magnetic interactions. The designed structural organization of the heterotrimetallic complexes suggests that the controlled replacement or elimination of the THF molecules could be the first step toward one-dimensional organometallic frameworks with bridging COT ligands. For the next step, title trimetallic oligomers could serve as unique precursors for controlled metal replacement of the M(I) and M(II) sites to afford polymeric or hetero-spin {Ln(COT)M(COT)}n chains incorporating 3d or 4d metal ions that could display unusual and advanced SMM behaviour.72
Data availability
The datasets supporting this article have been uploaded as part of ESI.†Author contributions
Z. Z. synthesized the series of complexes, completed their characterization and structural description, and contributed to the draft preparation; J. G. assisted with characterization and contributed to the draft preparation; Z. W. performed the X-ray data collection and refinement; H. H. carried photoluminescence study and drafted the corresponding section; A. Yu. R. supervised the theoretical part of this study; J. M. carried out DFT and ab initio calculations; A. Yu. R. and J. M. designed theoretical experiments and performed analysis of the results; R. C. and M. R. performed, analyzed, and modeled the magnetic susceptibility data; M. A. P. conceived, supervised and led this collaborative work to completion; A. Yu. R., R. C. and M. A. P. wrote the manuscript with the support and contribution of all co-authors.Conflicts of interest
There are no conflicts to declare.Acknowledgements
Financial support of this work from the U.S. National Science Foundation, CHE-2003411, is gratefully acknowledged (M. A. P.). R. C. thanks the University of Bordeaux, the Région Nouvelle Aquitaine, Quantum Matter Bordeaux, the GdR MCM-2 (Magnétisme et Commutation Moléculaires) and the Centre National de la Recherche Scientifique (CNRS).Notes and references
- G. A. Timco, T. B. Faust, F. Tuna and R. E. P. Winpenny, Chem. Soc. Rev., 2011, 40, 3067–3075 RSC.
- G. Kumar and R. Gupta, Chem. Soc. Rev., 2013, 42, 9403–9453 RSC.
- R. J. Wilson, N. Lichtenberger, B. Weinert and S. Dehnen, Chem. Rev., 2019, 119, 8506–8554 CrossRef CAS PubMed.
- J. A. Chipman and J. F. Berry, Chem. Rev., 2020, 120, 2409–2447 CrossRef CAS PubMed.
- D. N. Woodruff, R. E. P. Winpenny and R. A. Layfield, Chem. Rev., 2013, 113, 5110–5148 CrossRef CAS PubMed.
- C. Papatriantafyllopoulou, E. E. Moushi, G. Christou and A. J. Tasiopoulos, Chem. Soc. Rev., 2016, 45, 1597–1628 RSC.
- R. Sessoli and A. K. Powell, Coord. Chem. Rev., 2009, 253, 2328–2341 CrossRef CAS.
- F.-S. Guo, A. K. Bar and R. A. Layfield, Chem. Rev., 2019, 119, 8479–8505 CrossRef CAS PubMed.
- C. A. Gould, K. R. McClain, D. Reta, J. G. C. Kragskow, D. A. Marchiori, E. Lachman, E. S. Choi, J. G. Analytis, R. D. Britt, N. F. Chilton, B. G. Harvey and J. R. Long, Science, 2022, 375, 198–202 CrossRef CAS PubMed.
- S. Das, K. S. Bejoymohandas, A. Dey, S. Biswas, M. L. P. Reddy, R. Morales, E. Ruiz, S. Titos-Padilla, E. Colacio and V. Chandrasekhar, Chem.–Eur. J., 2015, 21, 6449–6464 CrossRef CAS PubMed.
- K. Kumar, S. Chorazy, K. Nakabayashi, H. Sato, B. Sieklucka and S. Ohkoshi, J. Mater. Chem. C, 2018, 6, 8372–8384 RSC.
- J. A. Mata, F. E. Hahn and E. Peris, Chem. Sci., 2014, 5, 1723–1732 RSC.
- P. Buchwalter, J. Rosé and P. Braunstein, Chem. Rev., 2015, 115, 28–126 CrossRef CAS PubMed.
- K. L. Harriman and M. Murugesu, Acc. Chem. Res., 2016, 49, 1158–1167 CrossRef CAS PubMed.
- T. J. Sørensen and S. Faulkner, Acc. Chem. Res., 2018, 51, 2493–2501 CrossRef PubMed.
- M. Pan, W.-M. Liao, S.-Y. Yin, S.-S. Sun and C.-Y. Su, Chem. Rev., 2018, 118, 8889–8935 CrossRef CAS PubMed.
- M. Zhu, L. Li and J.-P. Sutter, Inorg. Chem. Front., 2016, 3, 994–1003 RSC.
- O. A. Ejegbavwo, A. A. Berseneva, C. R. Martin, G. A. Leith, S. Pandey, A. J. Brandt, K. C. Park, A. Mathur, S. Farzandh, V. V. Klepov, B. J. Heiser, M. Chandrashekhar, S. G. Karakalos, M. D. Smith, S. R. Phillpot, S. Garashchuk, D. A. Chen and N. B. Shustova, Chem. Sci., 2020, 11, 7379–7389 RSC.
- L. V. Meyer, F. Schönfeld and K. Müller-Buschbaum, Chem. Commun., 2014, 50, 8093–8108 RSC.
- H. Han, J. C. Carozza, A. P. Colliton, Y. Zhang, Z. Wei, A. S. Filatov, Y. S. Chen, M. Alkan, A. Y. Rogachev and E. V. Dikarev, Angew. Chem., 2020, 132, 9711–9717 CrossRef.
- H. Han, J. C. Carozza, Z. Zhou, Y. Zhang, Z. Wei, A. M. Abakumov, A. S. Filatov, Y.-S. Chen, D. J. SantaLucia, J. F. Berry and E. V. Dikarev, J. Am. Chem. Soc., 2020, 142, 12767–12776 CrossRef CAS PubMed.
- W. Liu, Y. Song, Y. Li, Y. Zou, D. Dang, C. Ni and Q. Meng, Chem. Commun., 2004, 2348–2349 RSC.
- Y. Song, C.-B. Tian, Z.-F. Wu and X.-Y. Huang, New J. Chem., 2018, 42, 5096–5101 RSC.
- M. Shieh, S.-F. Lin, Y.-W. Guo, M.-H. Hsu and Y.-W. Lai, Organometallics, 2004, 23, 5182–5187 CrossRef CAS.
- X.-Y. Chang, G.-T. Xu, B. Cao, J.-Y. Wang, J.-S. Huang and C.-M. Che, Chem. Sci., 2017, 8, 7815–7820 RSC.
- T. J. Katz, J. Am. Chem. Soc., 1960, 82, 3784–3785 CrossRef CAS.
- T. Nishinaga, T. Ohmae and M. Iyoda, Symmetry, 2010, 2, 76–97 CrossRef CAS.
- J. Xia, Z. Jin and W. Chen, J. Chem. Soc., Chem. Commun., 1991, 1214–1215 RSC.
- R. G. Swisher, E. Sinn, G. A. Brewer and R. N. Grimes, J. Am. Chem. Soc., 1983, 105, 2079–2080 CrossRef CAS.
- R. G. Hayes and J. L. Thomas, J. Am. Chem. Soc., 1969, 91, 6876 CrossRef CAS.
- C. W. DeKock, S. R. Ely, T. E. Hopkins and M. A. Brault, Inorg. Chem., 1978, 17, 625–631 CrossRef CAS.
- P. Poremba and F. T. Edelmann, J. Organomet. Chem., 1998, 553, 393–395 CrossRef CAS.
- L. Ungur, J. J. Le Roy, I. Korobkov, M. Murugesu and L. F. Chibotaru, Angew. Chem., Int. Ed., 2014, 53, 4413–4417 CrossRef CAS PubMed.
- J. D. Hilgar, M. G. Bernbeck, B. S. Flores and J. D. Rinehart, Chem. Sci., 2018, 9, 7204–7209 RSC.
- S.-D. Jiang, B. W. Wang, H. L. Sun, Z. M. Wang and S. Gao, J. Am. Chem. Soc., 2011, 133, 4730–4733 CrossRef CAS PubMed.
- S.-M. Chen, J. Xiong, Y.-Q. Zhang, Q. Yuan, B.-W. Wang and S. Gao, Chem. Sci., 2018, 9, 7540–7545 RSC.
- L. Münzfeld, C. Schoo, S. Bestgen, E. Moreno-Pineda, R. Köppe, M. Ruben and P. W. Roesky, Nat. Commun., 2019, 10, 3135 CrossRef PubMed.
- A. Greco, S. Cesca and W. Bertolini, J. Organomet. Chem., 1976, 113, 321–330 CrossRef CAS.
- J. J. Le Roy, M. Jeletic, S. I. Gorelsky, I. Korobkov, L. Ungur, L. F. Chibotaru and M. Murugesu, J. Am. Chem. Soc., 2013, 135, 3502–3510 CrossRef CAS PubMed.
- J. Greenough, Z. Zhou, Z. Wei and M. A. Petrukhina, Dalton Trans., 2019, 48, 5614–5620 RSC.
- V. Lorenz, S. Blaurock, C. G. Hrib and F. T. Edelmann, Organometallics, 2010, 29, 4787–4789 CrossRef CAS.
- J. J. Le Roy, L. Ungur, I. Korobkov, L. F. Chibotaru and M. Murugesu, J. Am. Chem. Soc., 2014, 136, 8003–8010 CrossRef CAS PubMed.
- T. Tsuji, N. Hosoya, S. Fukazawa, R. Sugiyama, T. Iwasa, H. Tsunoyama, H. Hamaki, N. Tokitoh and A. Nakajima, J. Phys. Chem. C, 2014, 118, 5896–5907 CrossRef CAS.
- K. O. Hodgson, F. Mares, D. F. Starks and A. Streitwieser, J. Am. Chem. Soc., 1973, 95, 8650–8658 CrossRef CAS.
- K. R. Meihaus and J. R. Long, J. Am. Chem. Soc., 2013, 135, 17952–17957 CrossRef CAS PubMed.
- M. Jeletic, P.-H. Lin, J. J. Le Roy, I. Korobkov, S. I. Gorelsky and M. Murugesu, J. Am. Chem. Soc., 2011, 133, 19286–19289 CrossRef CAS PubMed.
- S. A. Kinsley, A. Streitwieser and A. Zalkin, Organometallics, 1985, 4, 52–57 CrossRef CAS.
- W. J. Evans, J. L. Shreeve and J. W. Ziller, Polyhedron, 1995, 14, 2945–2951 CrossRef CAS.
- K. Kawasaki, R. Sugiyama, T. Tsuji, T. Iwasa, H. Tsunoyama, Y. Mizuhata, N. Tokitoh and A. Nakajima, Chem. Commun., 2017, 53, 6557–6560 RSC.
- J. Moutet, J. Schleinitz, L. La Droitte, M. Tricoire, F. Pointillart, F. Gendron, T. Simler, C. Clavaguéra, B. Le Guennic, O. Cador and G. Nocton, Angew. Chem., Int. Ed., 2021, 60, 6042–6046 CrossRef CAS.
- C. A. P. Goodwin, F. Ortu, D. Reta, N. F. Chilton and D. P. Mills, Nature, 2017, 548, 439–442 CrossRef CAS PubMed.
- F.-S. Guo, B. M. Day, Y.-C. Chen, M.-L. Tong, A. Mansikkamäki and R. A. Layfield, Angew. Chem., Int. Ed., 2017, 56, 11445–11449 CrossRef CAS PubMed.
- F.-S. Guo, B. M. Day, Y.-C. Chen, M.-L. Tong, A. Mansikkamäki and R. A. Layfield, Science, 2018, 362, 1400–1403 CrossRef CAS PubMed.
- C. A. Gould, K. R. McClain, J. M. Yu, T. J. Groshens, F. Furche, B. G. Harvey and J. R. Long, J. Am. Chem. Soc., 2019, 141, 12967–12973 CrossRef CAS PubMed.
- J. D. Rinehart, M. Fang, W. J. Evans and J. R. Long, J. Am. Chem. Soc., 2011, 133, 14236–14239 CrossRef CAS PubMed.
- R. D. Shannon, Acta Crystallogr., Sect. A: Cryst. Phys., Diffr., Theor. Gen. Crystallogr., 1976, 32, 751–767 CrossRef.
- Y. Hasegawa, Bull. Chem. Soc. Jpn., 2014, 87, 1029–1057 CrossRef CAS.
- Y. Hasegawa, Y. Kitagawa and T. Nakanishi, NPG Asia Mater., 2018, 10, 52–70 CrossRef CAS.
- S. Faulkner, S. J. A. Pope and B. P. Burton-Pye, Appl. Spectrosc. Rev., 2005, 40, 1–31 CrossRef CAS.
- P. P. Ferreira da Rosa, Y. Kitagawa and Y. Hasegawa, Coord. Chem. Rev., 2020, 406, 213153 CrossRef CAS.
- M. Bortoluzzi, G. Paolucci, S. Polizzi, L. Bellotto, F. Enrichi, S. Ciorba and B. S. Richards, Inorg. Chem. Commun., 2011, 14, 1762–1766 CrossRef CAS.
- H. G. Brittain, J. H. Meadows and W. J. Evans, Organometallics, 1983, 2, 1661–1665 CrossRef CAS.
- K. Yanagisawa, T. Nakanishi, Y. Kitagawa, T. Seki, T. Akama, M. Kobayashi, T. Taketsugu, H. Ito, K. Fushimi and Y. Hasegawa, Eur. J. Inorg. Chem., 2015, 2015, 4769–4774 CrossRef CAS.
- J.-C. G. Bünzli, Chem. Rev., 2010, 110, 2729–2755 CrossRef PubMed.
- Y. Qiao and E. J. Schelter, Acc. Chem. Res., 2018, 51, 2926–2936 CrossRef CAS PubMed.
- L. Sorace and D. Gatteschi, in Lanthanides and Actinides in Molecular Magnetism, ed. R. A. Layfield and M. Murugesu, Wiley, Weinheim, 2015 Search PubMed.
- S. D. Jiang, S. S. Liu, L. N. Zhou, B. W. Wang, Z. M. Wang and S. Gao, Inorg. Chem., 2012, 51, 3079–3087 CrossRef CAS PubMed.
- J. J. Le Roy, I. Korobkov and M. Murugesu, Chem. Commun., 2014, 50, 1602–1604 RSC.
- J. D. Hilgar, B. S. Flores and J. D. Rinehart, Chem. Commun., 2017, 53, 7322–7324 RSC.
- V. Lorenz, P. Liebing, M. Böhme, A. Buchholz, W. Plass, N. Geue, L. Hilfert, S. Busse, F. Engelhardt, C. G. Hrib and F. T. Edelmann, Eur. J. Inorg. Chem., 2017, 4840–4849 CrossRef CAS.
- K. S. Cole and R. H. Cole, J. Chem. Phys., 1941, 9, 341–351 CrossRef CAS.
- D. Reta and N. F. Chilton, Phys. Chem. Chem. Phys., 2019, 21, 23567–23575 RSC.
- K. N. Shrivastava, Phys. Status Solidi B, 1983, 117, 437–458 CrossRef CAS.
- J. H. Van Vleck, Phys. Rev., 1940, 57, 426–447 CrossRef CAS.
- W. Wernsdorfer, M. Murugesu, A. J. Tasiopoulos and G. Christou, Phys. Rev. B: Condens. Matter Mater. Phys., 2005, 72, 212406 CrossRef.
- A. Abragam and B. Bleaney, Electron Paramagnetic Resonance of Transition Ions, Dover, New York, 1986 Search PubMed.
- L. Lecren, W. Wernsdorfer, Y.-G. Li, O. Roubeau, H. Miyasaka and R. Clérac, J. Am. Chem. Soc., 2005, 127, 11311–11317 CrossRef CAS PubMed.
- D. Gatteschi, R. Sessoli and J. Villain, Molecular Nanomagnets, Oxford University Press, Oxford, 2006 Search PubMed.
- M. Ding, A. K. Hickey, M. Pink, J. Telser, D. L. Tierney, M. Amoza, M. Rouzières, T. J. Ozumerzifon, W. A. Hoffert, M. P. Shores, E. Ruiz, R. Clérac and J. M. Smith, Chem.–Eur. J., 2019, 25, 10625–10632 CrossRef CAS PubMed.
- F. Neese, Wiley Interdiscip. Rev. Comput. Mol. Sci., 2012, 2, 73–78 CrossRef CAS.
- F. Neese, Wiley Interdiscip. Rev. Comput. Mol. Sci., 2018, 8, e1327 Search PubMed.
- F. Neese, F. Wennmohs, U. Becker and C. Riplinger, J. Chem. Phys., 2020, 152, 224108 CrossRef CAS PubMed.
- D. Aravena, M. Atanasov and F. Neese, Inorg. Chem., 2016, 55, 4457–4469 CrossRef CAS PubMed.
- M. Atanasov, D. Ganyushin, K. Sivalingam and F. Neese, in Molecular Electronic Structures of Transition Metal Complexes II, Springer, Berlin, Heidelberg, 2012, pp. 149–220 Search PubMed.
- L. F. Chibotaru and L. Ungur, J. Chem. Phys., 2012, 137, 064112 CrossRef CAS PubMed.
- N. Iwahara, L. Ungur and L. F. Chibotaru, Phys. Rev. B, 2018, 98, 054436 CrossRef CAS.
- L. Ungur and L. F. Chibotaru, Chem.–Eur. J., 2017, 23, 3708–3718 CrossRef CAS PubMed.
Footnote |
| † Electronic supplementary information (ESI) available: Details of preparation, X-ray diffraction, ATR-IR, and magnetic studies. CCDC 2090491–2090497. For ESI and crystallographic data in CIF or other electronic format see DOI: 10.1039/d2sc00631f |
| This journal is © The Royal Society of Chemistry 2022 |


