
Ru nanoparticles supported on alginate-derived graphene as hybrid electrodes for the hydrogen evolution reaction†
Laura
Mallón
 ab,
Christian
Cerezo-Navarrete
c,
Nuria
Romero‡
a,
Marta
Puche
c,
Jordi
García-Antón
a,
Roger
Bofill
*a,
Karine
Philippot
*b,
Luis M.
Martínez-Prieto
*c and
Xavier
Sala
*a
ab,
Christian
Cerezo-Navarrete
c,
Nuria
Romero‡
a,
Marta
Puche
c,
Jordi
García-Antón
a,
Roger
Bofill
*a,
Karine
Philippot
*b,
Luis M.
Martínez-Prieto
*c and
Xavier
Sala
*a
aDepartament de Química, Universitat Autònoma de Barcelona, Cerdanyola del Vallès, Barcelona 08193, Spain. E-mail: xavier.Sala@uab.cat; Roger.Bofill@uab.cat
bCNRS, LCC (Laboratoire de Chimie de Coordination), UPR8241, Université de Toulouse, UPS, INPT, Toulouse cedex 4 F-31077, France. E-mail: karine.Philippot@lcc-toulouse.fr
cITQ, Instituto de Tecnología Química, Universitat Politècnica de València (UPV), Av. de los Naranjos S/N, Valencia 46022, Spain. E-mail: luismiguel.martinez@csic.es
First published on 17th November 2021
Abstract
The development of organic–inorganic hybrid materials for redox catalysis is key to access new energy conversion schemes and the sustainable production of dihydrogen. Here, bare and P-doped graphene arising from the pyrolysis of biomass (alginate from marine algae) has been used as a support for the growth and stabilization of ultra-small Ru/RuO2 NPs through organometallic synthesis. P-doped graphene allows obtaining smaller and better dispersed NPs in hybrid electrodes of lower roughness and electroactive surface area. Electrochemical activation of the as-synthesised supported nanoparticles by reduction of the passivating RuO2 layer generates excellent HER electrocatalysts under acidic conditions (η10 of 29 mV and 15 mV for the bare and P-doped electrodes, respectively). P doping, identified as surface phosphates by 31P solid state NMR, induces improvement of all HER benchmarking parameters studied, including overpotential and exchange and specific current densities. All studied materials show excellent long-term stability and selectivity for hydrogen generation with no sign of deactivation after 12 h under turnover conditions and almost quantitative faradaic efficiencies.
Introduction
The still massive consumption of fossil fuels triggers global warming through greenhouse gas (GHG) emissions and threatens both our lifestyle and the sustainability of our planet.1 Thus, the development of renewable carbon-neutral fuels has become urgent and one of the pivotal societal challenges in the 21st century. In this regard, the renewable production of H2 through water splitting (WS, H2O → H2 + 1/2O2) triggered by renewable energy sources (e.g. renewable electricity from sunlight or wind) is an appealing and clean alternative to steam reforming methods, which rely on fossil fuels and are intensive GHG emitters.2 However, both WS half reactions, namely hydrogen and oxygen evolution reactions (HER and OER, respectively), occur through large activation energy barriers and, therefore, at high overpotentials. Thus, the development of highly active, sustainable and durable electrocatalysts, able to accelerate these reactions and lower the required overpotentials, is still a key challenge at the core of clean H2 production from water.Nanoparticles (NPs), with a high surface-to-volume ratio and tuneable surface properties, are interesting systems in (electro)catalysis and WS. In this respect, we have recently shown how the bottom-up synthesis of Ru NPs through the organometallic approach under mild conditions3,4 allows obtaining ultra-small NPs with narrow size-distributions and controllable surface environments, which have a strong impact in their catalytic performance in both the HER5–7 and the OER.8,9
The immobilization of NPs onto electrodes such as highly conductive carbon-based materials or oxides/metal oxides is a common way to improve (a) their long-term stability, preventing their agglomeration and sintering under catalytic conditions, and (b) their electron-transfer rates in practical electrodes. In this context, carbon-based (nano)materials (i.e. graphene) have shown to be excellent choices due to their high electrical conductivity and long-term stability together with a versatile morphology and rich surface chemistry.10 Heteroatom-doping (i.e. N, S, P, O, etc.) of these carbon-based (nano)materials proved to be a powerful strategy not only to tune the physicochemical properties of the conductive supports themselves (i.e. electrical conductivity of the C-based nanomaterials) but also to influence the properties and affinity of the nanoparticles deposited at their surface.6,11 The presence of doping heteroatoms thus influences the activity, selectivity and long-term stability of the resulting hybrid electrocatalysts, and represents an interesting strategy to fine-tune their overall performance.12
With far higher surface area and charge carrier mobility than related graphitic materials,13 graphene has emerged in recent years as a paradigmatic 2D carbon-support in electrocatalysis. However, practical application of graphene-based hybrid electrocatalysts relies on the development of scalable and sustainable methods to produce this carbon-nanomaterial. In this regard, graphene production through biomass carbonization, a waste-treatment technology, is an attractive method to reduce electrode costs and increase the sustainability of electrode production.14
Herein, we report the preparation of hybrid nanomaterials via the growth of ultra-small Ru NPs through organometallic synthesis on bare/P-doped graphene supports obtained from biomass (alginate from marine algae), and their evaluation as HER electrocatalysts under acidic conditions.
Results and discussion
Synthesis and characterization
Biomass-derived bare and P-doped graphene supports (G and P-G, respectively) where prepared by pyrolysis of alginate and phosphate-modified alginate at 900 °C, respectively, following reported methods.15,16 Decomposition of the [Ru(COD)(COT)] (COD: cyclooctadiene and COT: cyclooctatriene) organometallic precursor under mild conditions (3 bar H2, r.t., 20 h) in the presence of G or P-G supports, previously ultrasonicated in THF, yielded the graphene-supported Ru NPs (Ru/G and Ru/P-G) (Fig. 1, top).17,18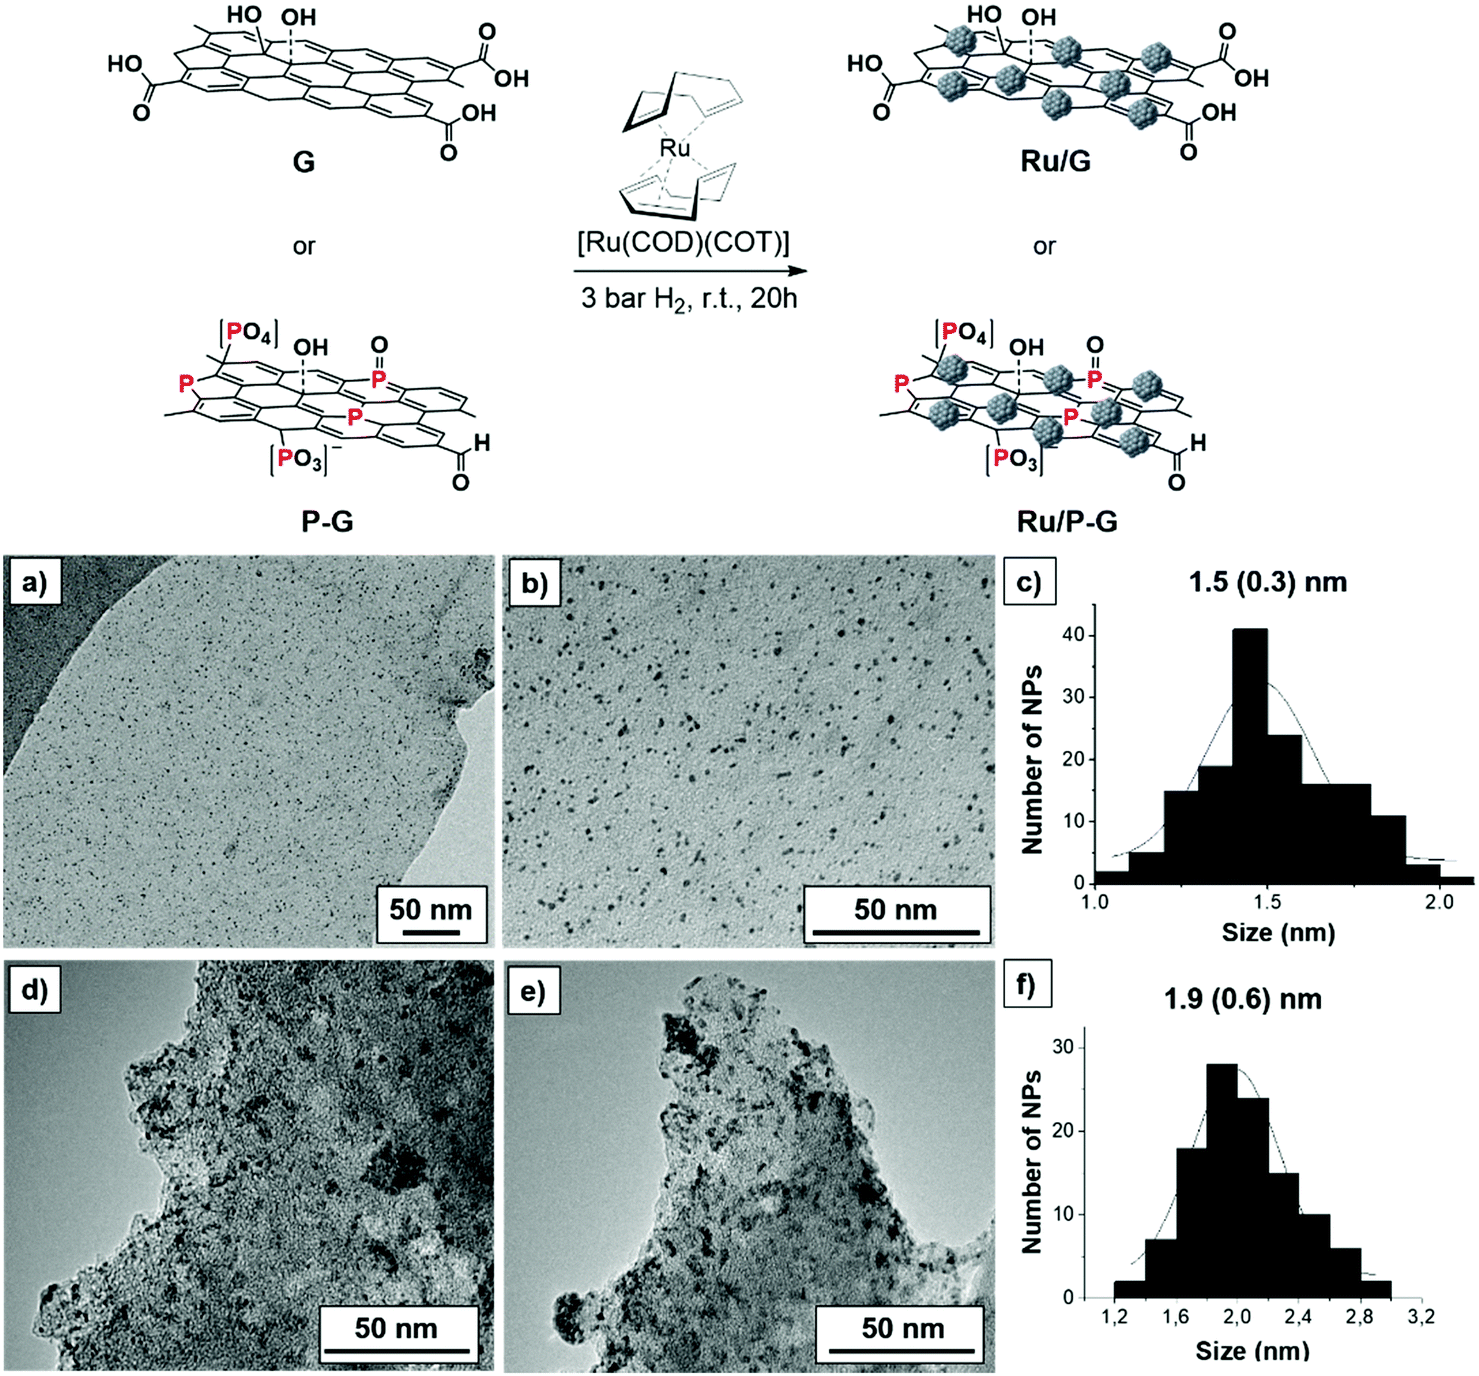 | ||
| Fig. 1 Top: Synthesis of Ru/G and Ru/P-G following the organometallic approach. Bottom: TEM images and size distribution histograms of Ru/P-G (a–c) and Ru/G (d–f). | ||
After an optimized digestion process (see the Experimental Section), inductively coupled plasma atomic emission spectroscopy (ICP–AES) analysis showed a metal content of 2.6 wt% and 3.3 wt% for Ru/G and Ru/P-G, respectively.
The two samples where then analysed by transition electron microscopy (TEM). As shown in Fig. 1a–c, Ru/P-G revealed spherical, well distributed and monodispersed NPs with a mean diameter of 1.5 ± 0.3 nm. In contrast, the use of non-doped graphene (G) as a support yielded slightly larger (1.9 ± 0.6 nm) and more aggregated NPs (Fig. 1d–f). The difference in size and dispersion suggests that phosphorous atoms present in the P-doped graphene facilitate the formation and stabilization of smaller Ru NPs, as previously observed in similar N-doped graphene systems.17,18Fig. 1 and Fig. S1 (see the ESI†) also allow one to infer the different exfoliation degree of the two supports (G and P-G). The presence of phosphate and sodium ions during the preparation of P-G seems to facilitate the separation of the carbon sheets, yielding a more exfoliated graphene support. The lower roughness of the P-G material (vs.G) has been later corroborated by electrochemical measurements (ECSA and RF, see Table 1 below).
| Entry | Electrode | Ø (nm) | Ru (wt%) | η 10 (mV) | Tafel slope (b) (mV dec−1) | j 0 (mA cm−2) | ECSA (cm2) | RF | |j s |(η=100 mV) (mA cm−2) |
|---|---|---|---|---|---|---|---|---|---|
| 1 | G | 19.6 | 279.4 | ||||||
| 2 | Ru/G | 1.9 ± 0.6 | 2.6 | 233 | 146 | 0.25 | 27.6 | 393.9 | 0.005 |
| 3 | Ru/G-r | — | — | 29 | 48 | 2.50 | 41.9 | 598.9 | 0.184 |
| 4 | P-G | 3.6 | 51.8 | ||||||
| 5 | Ru/P-G | 1.5 ± 0.3 | 3.3 | 243 | 128 | 0.13 | 4.6 | 66.1 | 0.032 |
| 6 | Ru/P-G-r | — | — | 15 | 49 | 4.97 | 21.4 | 305.1 | 0.883 |
High-resolution TEM (HRTEM) images and electron diffraction patterns confirmed the crystallinity of the Ru NPs in both Ru/G and Ru/P-G. From the HRTEM micrograph of Ru/P-G, measurement of interplanar distances (see the ESI,† Fig. S2a) provided values of 0.21 and 0.23 nm, in agreement with the (002), (100) and (100) atomic planes of the hexagonal compact crystalline (hcp) structure of bulk ruthenium.
Raman spectroscopy was used to analyse and study the properties of graphene materials, both starting supports, as well as Ru/G and Ru/P-G catalysts. In all samples, two bands at ca. 1360 cm−1 (band D) and ca. 1600 cm−1 (band G) were observed, together with a broad peak centred at ca. 3000 cm−1 (band 2D′), which is related to a high exfoliation degree (see the ESI,† Fig. S3 and S4). The ratio of intensities of D and G bands (ID/IG) is a key parameter to determine the percentage of defects on graphene supports, which are excellent anchoring points for metal NPs, improving their stabilization.19 As shown in Fig. S3a and S4a (ESI†), P-G presents a higher ID/IG ratio than G (2.39 for G and 2.81 for P-G), thus indicating the presence of more defect sites on the P-doped support. Moreover, the incorporation of Ru NPs on graphene supports led to a slight decrease in the two ID/IG ratios, indicating a higher sp2 domain due to the growth of Ru NPs over the defects (see the ESI,† Fig. S3b and S4b).20
X-Ray photoelectron spectroscopy (XPS) analysis was performed on both graphene supports (G and P-G) and obtained hybrid nanomaterials (Ru/G and Ru/P-G) to determine the chemical composition and the nature of the C, P and Ru species present (Fig. 2 and Fig. S5, ESI†). The C 1s signals of G and P-G appear as broad bands at a binding energy (BE) of 284.5 eV, which can be deconvoluted into three components (see the ESI,† Fig. S5a and b). The main peak at 284.5 eV (orange) is assigned to the carbon atoms of graphitic layers (sp2). The peak at ca. 286.4–286.2 eV (green) is attributed to carbon atoms bonded to P and those present in epoxides or tertiary alcohols. The last peak centred at ca. 288.9–288.6 eV (blue) corresponds to carboxylic groups.21 Similarly, the P 2p signal of P-G is the result of the convolution of two components (see the ESI,† Fig. S5c), a major peak at 132.9 eV corresponding to P atoms bonded to oxygen (blue curve), and a lower intensity one at 131.8 eV (green curve), for P–C bonds. These peaks were previously identified in similar P-doped graphenes15 and fit well with the results obtained by FT-IR, where the characteristic P–O/P![[double bond, length as m-dash]](https://www.rsc.org/images/entities/char_e001.gif) O stretching band is observed at ca. 1160–1252 cm−1 for this support (see the ESI,† Fig. S6). In addition, the stretching vibration associated with aromatic CC bonds from the graphene sheet appears at ca. 1600 cm−1. Analysis of the P 2p signal allowed us to determine the P content in the doped support P-G, namely 1.15 at%.
O stretching band is observed at ca. 1160–1252 cm−1 for this support (see the ESI,† Fig. S6). In addition, the stretching vibration associated with aromatic CC bonds from the graphene sheet appears at ca. 1600 cm−1. Analysis of the P 2p signal allowed us to determine the P content in the doped support P-G, namely 1.15 at%.
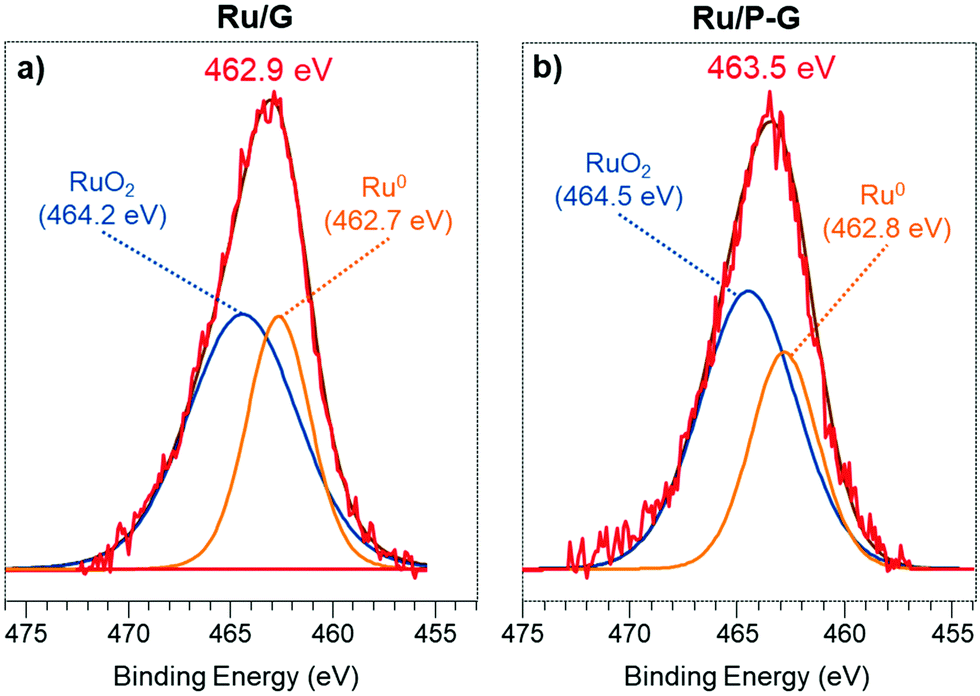 | ||
| Fig. 2 XPS signal of the Ru 3p band of as-synthesized Ru/G (a) and Ru/P-G (b). | ||
Since the overlapping between the Ru 3d and C 1s signals makes their deconvolution and interpretation difficult, the different oxidation states of Ru in Ru/P-G and Ru/G were identified upon analysing the Ru 3p region. Fig. 2a displays the Ru 3p3/2 signal of the as-synthesized Ru/G, at a BE of 462.9 eV. The deconvolution of this signal reveals two contributions, a major one at 464.2 eV, attributed to RuIV and characteristic of RuO2, and a secondary one at 462.7 eV corresponding to Ru0. The as-synthesized Ru/G surface approximately contains 64% of Ru(IV) and 36% of Ru0. Similarly, the Ru 3p3/2 signal of Ru/P-G (Fig. 2b) presents a peak of BE at 463.5 eV, also containing two contributions, at 464.5 eV (RuO2) and 462.8 eV (Ru0). The surface of the as-synthesized Ru/P-G contains ca. 65% of Ru(IV) and 35% of Ru0.
31P solid state NMR confirmed the presence of the dopant atoms in the P-doped graphene material and allowed us to determine their chemical nature. The 31P MAS NMR spectra of both P-G and Ru/P-G display a broad peak between 10 and −40 ppm (see the ESI,† Fig. S7), as the result of the overlapped signals of phosphonate (7 to 10 ppm),22 phosphate (ca. 0 ppm),22 methaphosphate (−3 to −7 ppm),23 elemental phosphorous (−14 to −17 ppm)23 and/or polyphosphate (−22 ppm).24 Elemental phosphorous comes from the reduction of the phosphate by carbon at high temperature during the pyrolysis of the P-doped graphene.23 The presence of metaphosphate and polyphosphate groups could derive from the condensation of Na2HPO4 at 900 °C.23 Thus, most P–O bonds observed by XPS are due to phosphate-like structures.
Electrocatalytic performance in the HER
The HER performance of Ru/G and Ru/P-G was evaluated in 1 M H2SO4 aqueous solution after their dispersion in THF (2 mg mL−1) and drop-casting onto a glassy carbon rotating disk electrode (GC-RDE). A three-electrode configuration was used with the drop-casted GC-RDE as the working electrode, and a SCE (saturated calomel electrode, KCl sat.) and a Pt wire as reference (RE) and counter (CE) electrodes, respectively. The polarization curves of Ru/G and Ru/P-G at t = 0 s are shown in Fig. 3 (bold lines). A change in the current density is observed when scanning towards reductive potentials, which is attributed to their catalytic activity to reduce protons to H2.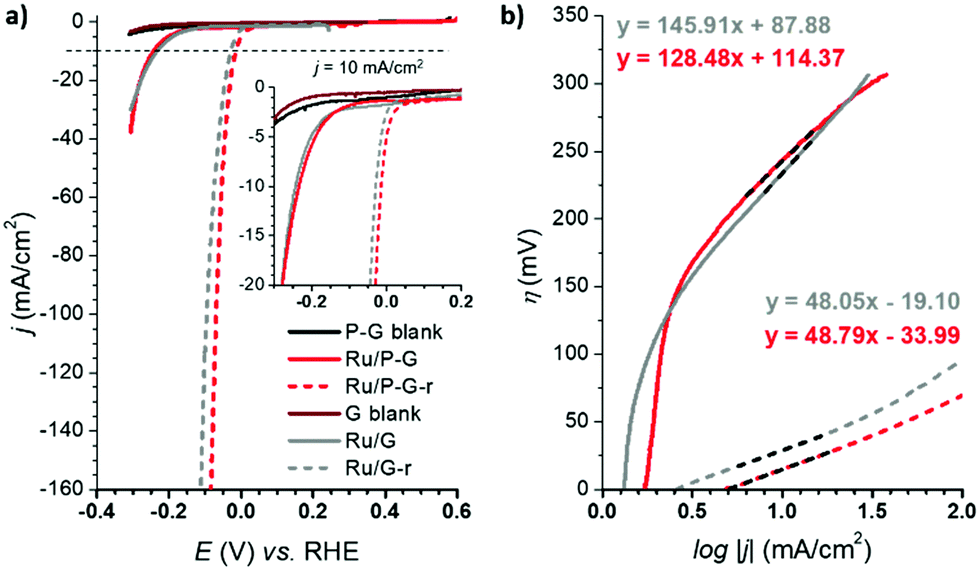 | ||
| Fig. 3 (a) Polarization curves of Ru/G (grey line), Ru/P-G (red line) before (bold) and after (dashed) a reductive process at j = −10 mA cm−2 in 1 M H2SO4. G (wine line) and P-G (black line) blanks are also shown. (b) Tafel plots of Ru/G, Ru/G-r, Ru/P-G and Ru/P-G-r in 1 M H2SO4. Same colour code as in (a). | ||
The catalytic performance was significantly improved after a current-controlled bulk electrolysis at j = −10 mA cm−2 for ca. 12–20 h (Fig. 3a, dashed lines). As presented in Fig. 3 and Table 1, whereas Ru/G and Ru/P-G show a η10 of 233 mV and 243 mV, respectively, a shift in the polarization curves is observed after the reductive process, improving the η10 to 29 mV and 15 mV, respectively. This behaviour is attributed to a change in the oxidation state of surface Ru atoms of the NPs: the partially oxidized surface of the as-synthesized NPs (see XPS analysis, Fig. 2) is reduced to metallic Ru when subjected to a reductive treatment. The reduced species Ru/G-r and Ru/P-G-r are more active in HER than their as-synthesised counterparts Ru/G and Ru/P-G, displaying higher current densities and lower overpotentials. We previously reported a deep study of the proposed RuO2/Ru interconversion with 4-phenylpyridne stabilized RuNPs,5 confirming by XPS a total disappearance of the RuO2 peak under reductive catalytic conditions.
The difference in nature and in catalytic performance between the as-synthesised samples and their reduced analogoes was also evidenced through the Tafel plots (Fig. 3b), obtaining improved overall kinetics with the reduced systems. The Tafel slope (b) allows defining the rate determining step (rds) of the catalytic reaction. Both Ru/G and Ru/P-G show a Tafel slope close to 120 mV, a consistent value with the Volmer step as rds (adsorption of H+ to form the M–H species on the NPs, typically b ≈ 120 mV dec−1). In contrast, Ru/G-r and Ru/P-G-r show a Tafel slope of 48 mV dec−1 and 49 mV dec−1, respectively, suggesting that the HER follows the Volmer–Heyrovsky mechanism with the Heyrovsky step (H2 electro-desorption with a proton from the solution, b ≈ 40 mV dec−1) as the slowest path in the HER process.
The electrocatalytic performance of all the systems has been then compared by following the benchmarking methodology reported by Jaramillo et al.25 First, the double-layer capacitance (CDL) was estimated from the capacitive current in a non-faradaic region using eqn (1) shown below. Then, the electrochemically active surface area (ECSA) and roughness factor (RF) of all electrodes and supports were calculated from the obtained CDL (see the ESI,† Fig. S8 and S9) according to eqn (2) and (3).
| i = νCDL | (1) |
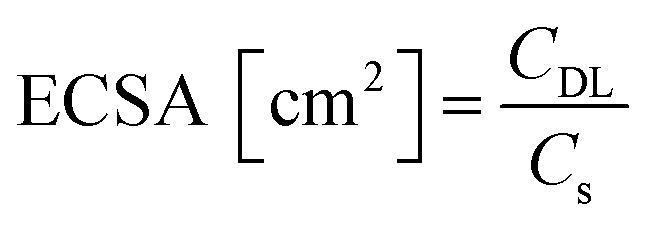 | (2) |
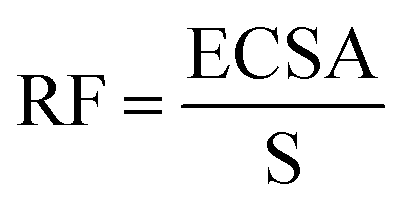 | (3) |
The ECSA value allows calculating the specific current density (js) of the electrodes, which is the current density per “real” electroactive area at a given overpotential. Thus, the current density, js, normalized per ECSA at η = 100 mV, has been calculated for all the Ru materials before and after the reductive treatment/activation, as well as for the bare supports (i.e.G and P-G). The obtained results are summarized in Table 1. Regarding the bare supports, ECSA and RF data support the higher roughness of the non-doped support G (RF of 279.43 for Gvs. 51.76 for P-G) already observed by TEM (see the ESI,† Fig. S1). Introduction of Ru NPs onto the carbon supports slightly increases the RF values in both cases (Table 1, entries 2 and 6). Activation of the hybrid electrodes Ru/G and Ru/P-G under reductive conditions (current-controlled bulk electrolysis at j = −10 mA cm−2 for ca. 12–20 hours) substantially increases the ECSA and RF values of both electrodes (compare entries 2, 3 and 5, 6). This increment may arise from surface changes in both the carbon supports and the Ru NPs (reduction process from Ru(IV) to Ru0). The activated P-doped electrode, Ru/P-G-r, shows the highest HER activity among the tested electrodes (entry 6), with a very low η10 of 15 mV, the highest exchange current density (j0) and a specific current density 5 times higher than that of its non-doped counterpart Ru/G-r. For comparison purposes, the most relevant HER benchmarking parameters for the hybrid electrocatalysts developed in this work are collected in Table S1 (see the ESI†) together with those of reported graphene-supported Ru-based systems and metal-free graphene-based materials. As can be inferred from the collected data, Ru/G-r and Ru/P-G-r show way higher HER performance than bare graphene-based electrodes and lie among the three state-of-the-art Ru-based systems.
Long-term stability is, together with kinetics, a key parameter for a catalyst to be potentially relevant in the HER. Thus, in a current controlled experiment (i.e. chronopotentiometry), Ru/G-r and Ru/P-G-r electrodes were held at a constant current density of j = −10 mA cm−2 for 12 h while monitoring the change in the required overpotential. Both systems showed almost no change for η10 and almost identical LSV polarization curves before and after 12 h under catalytic turnover (Fig. 4).
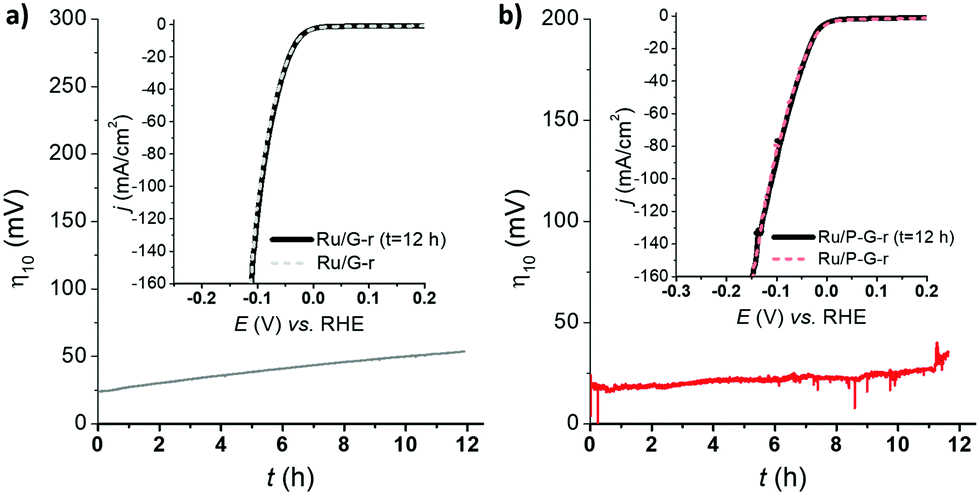 | ||
| Fig. 4 LSV of Ru/G-r (a) and Ru/P-G-r (b) before (dashed lines) and after (solid lines) a 12 h chronopotentiometry experiment at j = −10 mA cm−2.26 | ||
Finally, a faradaic efficiency of 97–98% was determined by quantifying the H2 evolved by the systems during a 20 min chronoamperometry using a H2-Clark electrode and comparing with the maximum theoretical amount of H2 calculated from the total charge passed through each respective electrode (Fig. 5). This result confirms the production of H2 as the sole reaction taking place.
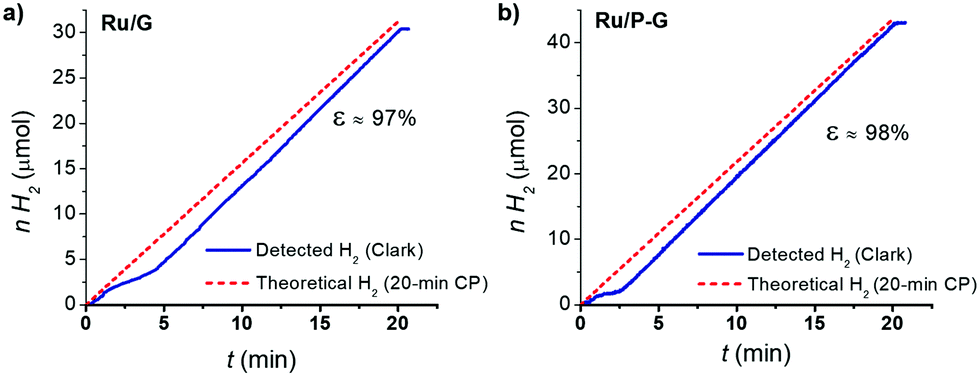 | ||
| Fig. 5 H2-monitored current-controlled bulk electrolysis of Ru/G (a) and Ru/P-G (b) in 1 M H2SO4. The produced H2 was quantified in the gas phase using a Clark-type electrode. | ||
The fate of the hybrid electrodes under turnover conditions has been studied by TEM after performing a 2 h CP to each system (j = −10 mA cm−2). Each material was recovered from the electrode by sonication in THF and drop-casting onto a TEM grid. Interestingly, the presence of small NPs onto the graphene supports is still visible (see the ESI,† Fig. S10 and S11). Moreover, the reductive potential applied for 2 h did not change significantly the size and morphology of the Ru NPs. In order to verify the nature of the NPs on-top of the graphene supports, EDX analysis of Ru/P-G has been performed after 2 h under catalytic conditions (see the ESI,† Fig. S12). The results confirm the presence of Ru in the sample, therefore corroborating the TEM data, and highlighting the stability of the supported Ru NPs after short-term catalytic turnover.
Conclusions
Bare and P-doped graphenes arising from the pyrolysis of biomass (alginate from marine algae) were used as a support for the growth and stabilization of ultra-small Ru/RuO2 NPs through organometallic synthesis. Compared to the bare counterpart, P-doped graphene allowed obtaining smaller and better dispersed NPs in hybrid electrodes of lower roughness and electroactive surface area. Electrochemical activation of the supported nanocatalysts by reduction of the passivating RuO2 layer offers excellent HER electrocatalysts under acidic conditions (η10 of 29 mV and 15 mV for the bare and P-doped electrodes, respectively). P doping, identified as surface phosphates by 31P solid state NMR, induces a general improvement of all HER benchmarking parameters determined, including overpotential (η10) and exchange (j0) and specific (js) current densities. All studied systems show excellent long-term stability and selectivity for hydrogen generation with no sign of deactivation after 12 h under turnover conditions and quasi quantitative faradaic efficiencies. Altogether, this work evidences how the combination of an efficient nanocatalyst synthesis method with the doping of graphene supports provides performant hybrid electrodes for the production of hydrogen.Experimental section
General procedures and starting materials
Most of the chemical operations were carried out using standard Schlenk tubes, Fischer–Porter bottle techniques under a nitrogen atmosphere or in a glovebox under a nitrogen atmosphere. Tetrahydrofuran (THF) was purified before use by distillation under an argon atmosphere through filtration in the column of a solvent purification system (SPS). The organometallic precursor, [Ru(COD)(COT)], was purchased from Nanomeps (Toulouse), and alginic acid sodium salt and sodium phosphate dibasic from Sigma Aldrich. All reagents were used without purification.![[thin space (1/6-em)]](https://www.rsc.org/images/entities/char_2009.gif) :1) and then, the solution was sonicated for 90 minutes. Then, the samples were digested at 180 °C for 15. Finally, they were cooled down to room temperature, diluted with 100 mL of water and afterwards analyzed using ICP–AES.
:1) and then, the solution was sonicated for 90 minutes. Then, the samples were digested at 180 °C for 15. Finally, they were cooled down to room temperature, diluted with 100 mL of water and afterwards analyzed using ICP–AES.
Synthesis of graphenes
O).
Synthesis of graphene-supported Ru NPs
Electrochemical measurements
All the electrochemical experiments were performed with a BioLogic SP-150 potentiostat. The solutions were degassed previous to the electrochemical analysis with an Ar flow. Ohmic potential (IR) drop was automatically corrected at 85% using the Biologic EC-Lab software for linear sweep voltammetry. 1 M H2SO4 solution was prepared by mixing 56.1 mL of 95–97% H2SO4 with Milli-Q water up to 1 L. A glassy carbon rotating disk electrode (RDE, Φ = 0.3 cm, S = 0.07 cm2) was used as the working electrode. The electrode preparation started from a 2 mg mL−1 dispersion of each material by adding 1 mg of Ru material in 0.5 mL of THF. Long-time sonication was avoided to prevent NP aggregation over the C support. Then, an aliquot of 5 μL was drop-casted on the surface of the GC/RDE (S = 0.07 cm2), and dried. A 5 μL-drop of Nafion (0.02% w/w in water and 1-propanol) was finally added and dried prior to the electrochemical measurements. The RDE was rotated at 3000 rpm in order to ensure complete removal of in situ formed H2 bubbles during catalytic turnover. A Pt wire was used as the counter electrode (CE) and a standard calomel electrode (SCE, Hg/Hg2Cl2, KCl sat.) was used as a reference electrode (RE). The potentials reported versus a normal hydrogen electrode were transformed as follows (ENHE = ESCE + E0SCE), where E0SCE = 0.244 V.A 10 mL two-compartment cell with a proton exchange membrane between the two compartments was used for faradaic efficiencies calculation. The CE was placed in one compartment and the WE and RE were placed in the other one together with the H2 Clark electrode. Both compartments were filled with ca. 7 mL of 1 M H2SO4 solution and equipped with a stirring bar. Prior to each measurement, both compartments were purged with Ar. Unisense H2-NP Clark electrode was used to measure the hydrogen evolved in the gas phase during chronopotentiometry. The Clark electrode was calibrated by adding different volumes of 99% pure hydrogen at the end of the experiment.
Double-layer capacitance (CDL) and electrochemically active surface area (ECSA) determination: CDL was estimated by performing CV measurements with different scan rates. A non-faradaic region was chosen from the LSV (typically a 0.1 V window about OCP), where no redox process takes place and all the measured current is due to double-layer charging. Based on this assumption, the charging current (ic) can be calculated as the product of the electrochemical double-layer capacitance (CDL) by the scan rate (ν). Plotting ic as a function of ν yields a straight line with slope equal to CDL. In this way, 8 different scan rates were used (5, 10, 25, 50, 75, 100, 250 and 500 mV s−1), holding the working electrode at each potential vertex for 10 seconds prior to the next step. The ECSA was obtained by dividing the calculated capacitance by a tabulated value (CS = specific capacitance) that depends on the material used and the solution (for C, in 1 M H2SO4CS = 13–17 μF cm−2). The roughness factor (RF) was calculated by dividing the ECSA by the geometrical surface area (S) of the RDE.
Author contributions
L. M. performed the electrochemical experiments and characterization of the electrodes after catalysis and participated in writing – review and editing. C. C-N. and M. P. performed the synthesis and structural/spectroscopic characterization of the hybrid electrodes. N. R. coordinated the tasks between researchers and participated in writing – review and editing. R. B., K. P. and J. G.-A. supervised the project and participated in writing – review and editing. X. S. and L. M. M.-P. conceived the idea of the project and wrote the original draft with input from other authors. All authors contributed to the design of the experiments, analysis of the results and preparation of the manuscript.Conflicts of interest
There are no conflicts to declare.Acknowledgements
The authors thank Instituto de Tecnología Química (ITQ), Consejo Superior de Investigaciones Científicas (CSIC), Universitat Politècnica de València (UPV), and Universitat Autonoma de Barcelona for the facilities. Electron Microscopy Service of the UPV for TEM facilities and J. A. Vidal-Moya (ITQ, CSIC-UPV) for NMR measurements are also thanked. We also gratefully acknowledge Prof. A. Corma for his contribution to this research. C. C.-N. acknowledges Generalitat Valenciana predoctoral fellowship (GVA: ACIF/2019/076) and L. M. the UAB for a PhD grant. This work was financially supported by the MINECO/FEDER project PID2019-104171RB-I00. J. G.-A. acknowledges the Serra Húnter Program. CNRS and Université de Toulouse-Paul Sabatier are also acknowledged.References
- Intergovernmental Panel on Climate Change. Global Warming of 1.5 °C (IPCC, 2018).
- M. A. Rosen and S. Koohi-Fayegh, Energy Ecol. Environ., 2016, 1, 10–29 CrossRef.
- C. Amiens, D. Ciuculescu-Pradines and K. Philippot, Coord. Chem. Rev., 2016, 308, 409–432 CrossRef CAS.
- L. M. Martínez-Prieto and B. Chaudret, Acc. Chem. Res., 2018, 51, 376–384 CrossRef PubMed.
- J. Creus, S. Drouet, S. Suriñach, P. Lecante, R. Poteau, K. Philippot, J. García-Antón and X. Sala, ACS Catal., 2018, 8, 11094–11102 CrossRef CAS.
- J. Creus, J. De Tovar, N. Romero, J. García-Antón, K. Philippot, R. Bofill and X. Sala, ChemSusChem, 2019, 12, 2493–2514 CrossRef CAS PubMed.
- N. Romero, R. Barrach, L. Gil, S. Drouet, I. Salmeron-Sànchez, O. Illa, K. Philippot, M. Natali, J. García-Antón and X. Sala, Sustainable Energy Fuels, 2020, 4, 4170–4178 RSC.
- L. Mallón, N. Romero, A. Giménez, E. M. Morales, J. Alemán, R. Más-Ballesté, R. Bofill, K. Philippot, J. García-Antón and X. Sala, Catal. Sci. Technol., 2020, 10, 4513–4521 RSC.
- J. De Tovar, N. Romero, S. Denisov, R. Bofill, C. Gimbert-Suriñach, D. Ciuculescu-Pradines, S. Drouet, A. Llobet, P. Lecante, Z. Freixa, N. McClenaghan, C. Amiens, J. García-Antón, K. Philippot and X. Sala, Mater. Today Energy, 2018, 9, 506–515 CrossRef.
- J. Zhang, Z. Xia and L. Dai, Sci. Adv., 2015, 1, e1500564 CrossRef PubMed.
- A. Bähr, G.-H. Moon and H. Tüysüz, ACS Appl. Energy Mater., 2019, 2, 6672–6680 CrossRef.
- L. Wang, Z. Sofer and M. Pumera, ACS Nano, 2020, 14, 21–52 CrossRef CAS PubMed.
- A. Ambrosi, C. K. Chua, A. Bonanni and M. Pumera, Chem. Rev., 2014, 114, 7150–7188 CrossRef CAS PubMed.
- D. D. Ouyang, L. B. Hu, G. Wang, B. Dai, F. Yu and L. L. Zhang, New Carbon Mater., 2021, 36, 350–372 CrossRef.
- M. Latorre-Sánchez, A. Primo and H. García, Angew. Chem., Int. Ed., 2013, 52, 11813–11816 CrossRef PubMed.
- M.-M. Trandafir, M. Florea, F. Neaţu, A. Primo, V. I. Parvulescu and H. García, ChemSusChem, 2016, 9, 1565–1569 CrossRef CAS PubMed.
- L. M. Martínez-Prieto, M. Puche, C. Cerezo-Navarrete and B. Chaudret, J. Catal., 2019, 377, 429–437 CrossRef.
- C. Cerezo-Navarrete, Y. Mathieu, M. Puche, C. Morales, P. Concepción, L. M. Martínez-Prieto and A. Corma, Catal. Sci. Technol., 2021, 11, 494–505 RSC.
- S. Navalon, A. Dhakshinamoorthy, M. Alvaro and H. Garcia, Coord. Chem. Rev., 2016, 312, 99–148 CrossRef CAS.
- S. Stankovich, D. A. Dikin, R. D. Piner, K. A. Kohlhaas, A. Kleinhammes, Y. Jia, Y. Wu, S. T. Nguyen and R. S. Ruoff, Carbon, 2007, 45, 1558–1565 CrossRef CAS.
- Graphene Oxide: Fundamentals and Applications, ed. A. M. Dimiev and S. Eigler, John Wiley & Sons, Ltd, 1st edn, 2017 Search PubMed.
- A. M. Puziy, O. I. Poddubnaya, R. P. Socha, J. Gurgul and M. Wisniewski, Carbon, 2008, 46, 2113–2123 CrossRef CAS.
- R. Fu, L. Liu, W. Huang and P. Sun, J. Appl. Polym. Sci., 2003, 87, 2253–2261 CrossRef CAS.
- M. Hupfer, B. Ruübe and P. Schmieder, Limnol. Oceanogr., 2004, 49, 1–10 CrossRef CAS.
- C. L. McCrory, S. Jung, I. M. Ferrer, S. M. Chatman, J. C. Peters and T. F. Jaramillo, J. Am. Chem. Soc., 2015, 137, 4347–4357 CrossRef CAS PubMed.
- The observed increase of η10 over time during chronopotentiometry experiments is due to the accumulation of H2 bubbles onto the surface of the employed carbon electrodes.
- T. Suoranta, M. Niemelä and P. Perämäki, Talanta, 2014, 119, 425–429 CrossRef CAS PubMed.
Footnotes |
| † Electronic supplementary information (ESI) available. See DOI: 10.1039/d1nj05215b |
| ‡ Actual address: CNRS, LCC (Laboratoire de Chimie de Coordination), UPR8241, Université de Toulouse, UPS, INPT, Toulouse cedex 4 F-31077, France. |
| This journal is © The Royal Society of Chemistry and the Centre National de la Recherche Scientifique 2022 |