Automated determination of n-cyanobiphenyl and n-cyanobiphenyl binary mixtures elastic constants in the nematic phase from molecular simulation†
Jiale
Shi‡
 ,
Hythem
Sidky‡
and
Jonathan K.
Whitmer
 *
*
Department of Chemical and Biomolecular Engineering, University of Notre Dame, Notre Dame, IN 46556, France. E-mail: jwhitme1@nd.edu
First published on 12th June 2020
Abstract
New applications of liquid crystalline materials have increased the need for precise engineering of elastic properties. Recently, Sidky et al. [H. Sidky, J. J. de Pablo, and J. K. Whitmer Phys. Rev. Lett., 2018, 120, 107801] presented methods by which the elastic coefficients of molecular models with atomistic detail can be accurately calculated, demonstrating the result for the ubiquitous mesogen 5CB. However, it is beneficial to future applications to demonstrate how the process may be refined into a precise tool for engineering functional materials. In this work, these techniques are applied to the homologous series of nCB materials and their binary mixtures, focusing on the standard bend, twist, and splay deformations, using an automated process. Our results show exceptional agreement with published experimental measurements for the nCBs and present a path forward to computational molecular engineering of liquid crystal elasticity for novel molecules and mixtures.
Design, System, ApplicationLiquid crystalline materials are widely used in industry, and continue to find new uses in technology in custom switchable materials which make use of the molecules' unique optical and geometric properties. Central to each of these applications are the elastic moduli which define the tendency of a liquid crystalline material to resist orientational deformations brought on by surface interactions, electric and magnetic fields, or coupling to mechanical stresses. Here we build on recent results examining the elastic constants of 5CB and extend it to nCB molecules using an efficient, automated formalism. This work opens the door to computational investigations of elastic moduli as a tool for computational molecular engineering targeting bespoke elastic properties in pure nematic phases and mixtures. |
Introduction
Liquid crystals (LC) are a class of fluids which exhibit long-range orientational ordering and a resistance to spontaneous deformation.1 While traditionally used in display technologies,2 advances in both our understanding of elasticity and material fabrication have opened up many new and interesting applications where the unique properties of LCs can be exploited. Chemoresponsive LCs have been designed to respond to targeted chemical species, which can be quantified through polarized optical microscopy.3 LC elastomeric materials can function as elements in soft robots and sensors.4 Topological defects and inclusion formation in LCs have also been used as templates for molecular self-assembly.5 Many of these novel applications rely on the interplay between external, boundary and elastic restoring forces, which is dictated by both the absolute magnitudes and ratios of the elastic constants.Advances in atomistic simulations have made it possible to gain an unprecedented level of detail into the molecular underpinnings of liquid crystalline behavior which can be rigorously verified against experiment.6,7 By understanding the role of molecular features such as conformational flexibility and charge distribution, new LCs can be engineered in silico to have highly specific thermophysical properties necessary for biosensing, templating, and other emerging technologies. Until recently,8 it was not possible to economically predict the elastic properties of molecular LCs and thus made it extremely difficult to engineer novel LCs for these applications.
The work of Sidky, et al.8 was a crucial first step in this process, as there it was demonstrated how molecular simulations may be used as a tool to predict the bulk elastic moduli of the molecular liquid crystal models, focusing on the ubiquitous 4-pentyl-4′-cyanobiphenyl, more commonly known as 5CB. There, it was also shown that the saddle-splay elastic constant k24, difficult to obtain in experiments, could be directly measured, and this revealed the underlying positive definite nature of the mode in contradiction to recent experimental suggestions based on indirect observation.9–13 The stability of 5CB and its homologues, in addition to their achromic appearance and strong positive dielectric anisotropy, has made them widely used in research14,15 and industrial applications.1,2 Importantly, their elastic properties have been well-characterized through experiment.16–19 Molecular models have also been parameterized to reproduce basic thermodynamic properties such as density, orientational order, and phase transitions.20–23
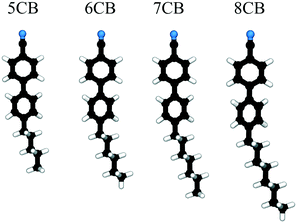
The focus of this work is on automating the process of determining elastic constants, building on the methodology proposed in ref. 8 to the homologous series of n-cyanobiphenyls (nCBs) 6CB, 7CB, and 8CB as well as their mixtures. The mesogens in this series are illustrated in Fig. 1. We seek to predict the splay, twist, and bend elastic moduli of nCB nematogens through an automated version of the prior algorithms8 in order to test the limits and robustness of our methods. This represents a step towards an ultimate goal of computationally-guided LC engineering, and extends the characterization of the elastic properties of existing LC forcefields. We restrict ourselves to the three bulk elastic constants because they are directly measurable in experiment and their behavior is generally well-understood. Although there are minimal structural differences between this series of molecules, the extended alkyl chain has a strong effect on ordering, which gives rise to the “odd–even” effect as the homologous series is ascended.16,17,20,24 Though the number n is arbitrary, for n < 5 nematic phases are not observed, while for n > 7, the LC will also admit a smectic phase.
In practical applications, liquid crystal devices tend to utilize mixtures of liquid crystal molecules. Liquid crystals mixtures can be formulated to have a broad nematic phase range, elastic response and dielectric anisotropies which are distinct compared to the components. Elasticity, in particular, is important in determining equilibrium morphologies and material responses. Despite this importance, limited knowledge exists about the connections between microscopic composition and macroscopic elastic response in liquid crystal blends. Therefore, in this work, we use a representative binary mixture with mole fractions x5CB = 0.5 and x8CB = 0.5 to explore the splay, twist, and bend moduli of mixtures. We explore the connections between microscopic composition and macroscopic elastic response of liquid crystal blends. This further extends the robustness of our methods.
Methods
The computational methods used here follow ref. 8 closely. For completeness, we will provide a brief summary and highlight the differences. The linear-order elastic free energy density of a uniaxial nematic, absent of any molecular polarity or chirality, may be represented in the Frank–Oseen form.25 | (1) |
The nCB molecules are represented using the united atom forcefield parameterized by Tiberio et al.20 After preparing an initial configuration for each molecule type, the process of obtaining elastic constant estimates is entirely automated. Each pure cyanobiphenyl system contains 400 molecules, and is initially prepared by running 100 nanosecond NPT simulations at 1 bar in Gromacs 5.1.3.26 For binary mixtures, the system contains 200 cyanobiphenyl A and 200 cyanobiphenyl B. The temperatures examined are between TNI and TNI – 20 K. The transition temperature is independently determined by performing an initial simulation sweep centered on the values reported in ref. 20, and determining when the equilibrium value of the nematic order parameter S exceeds 0.1; the measured TNI correspond to those reported in the previous paper. The equilibration time is considerably less than the 400 ns used for 5CB in our previous work, though a reasonable length is necessary to allow for elastic constant prediction at this scale. A Langevin thermostat and Parrinello–Rahman barostat with τp = 5 picoseconds are used with a time step of 2 fs for all simulations.
In accordance with ref. 8, the average volume at the each temperature is obtained in the initial round of simulations, and configurations with this volume are automatically drawn from the completed NPT trajectories and used to initiate a second round of NVT simulations with edge restrictions applied using a harmonic restraint having modulus k = 105 kJ mol−1 which serves to align the molecules along the ẑ axis. For these simulations we utilize the same timestep as in the constant-pressure case. Four uncorrelated instances are generated at each simulated temperature to function as independent walkers during the elastic measurement, and enhance the convergence of the free energy measurement. The number of independent walkers is known from prior experience to provide sufficient coverage of local free energy landscape, though this number can be tuned to a particular application based on the computational resources available. The simulations at this step were carried out for 400 ns, considerably less than the 1 timescale of the previous study.8 We arrived at this number through experimentation, but feel that it is entirely appropriate for most calamitic-type nematogens. Importantly, this step may be trivially parallelized to increase the speed of convergence to the underlying free energy landscape and improve the accuracy of the calculations.
The final step involves estimating the elastic constants from a biased simulation. With edge restrictions in place which align the molecules along the ẑ axis, a deformation ξ is applied in the central region according to the elastic mode desired. We take ξ to be ∂nx/∂x for splay, ∂ny/∂x for twist, and ∂nz/∂z for bend. Parabolic free energy profiles obtained via the adaptive biasing force method27,28 (ABF) as implemented in SSAGES 0.6 (ref. 29) are used to extract the final elastic constant as  where γ is a geometric factor accounting for the finite restriction and deformation regions.30 To assist readers in reproducing our results, we have posted relevant scripts and Gromacs and SSAGES runfiles in a free online repository located at https://github.com/shijiale0609/atomistic_elastics.
Results and discussion
While data for nCB molecules is more sparse than that for 5CB, a few measurements are available in the literature. We compare all of our calculations to experimental data from ref. 16 and 19; other measurements such as those reported in ref. 17 were not used due to substantial deviations from other reported measurements.Fig. 2 shows the elastic constant predictions for 6CB. The computed values are in good agreement with experiment across the reported temperature range. The values for k33 in particular, match the experimental data very well. While k11 is systematically higher than reported experiments, the computed values fall within the typical range variability of experimental measurements reported for 6CB.16 Twist elastic constants show a larger positive drift away from experimental data as temperature decreases, but remain significantly smaller than the other moduli, as expected, which results in a negative deviation of kii/k22. For this measurement, there is minimal noise observed in our data for kii with decreasing T − TNI, and the trendline is reasonably smooth and monotonic.
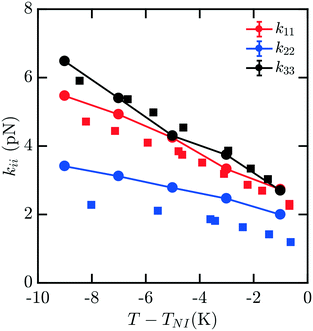 | ||
| Fig. 2 Bulk elastic constants for 6CB (circles) obtained from molecular simulation. Experimental data obtained from ref. 16 (squares). All elastic constants show good general agreement, with k33 exhibiting the least deviation from experiment and k22 showing positive deviation, particularly at low temperatures. | ||
The elastic constants for 7CB are shown in Fig. 3. Close to the phase transition temperature TIN, all kii are in excellent agreement with experimental data. At lower temperature, k11, k22, k33 show a positive deviation. But simulated elastic moduli keep the relationship that k33 > k11 > k22. For this measurement, there is still minimal noise observed in our data for kii with decreasing T − TIN, and the trendline keeps reasonably smooth and monotonic. We note that in this case, a systematic overshoot occurs for all kii relative to the data of ref. 16, similar to what was observed in ref. 8. When considering the behavior relative to the other mesogens modeled here, there is a possibility of an odd–even effect in this overshoot relative to experiments which examined all four homologues.16
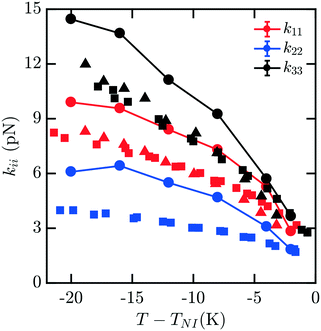 | ||
| Fig. 3 Bulk elastic constants for 7CB (circles) obtained from molecular simulation. Experimental data obtained from ref. 16 (squares) and 19 (triangles). At low temperature, k11, k22, k33 show a positive deviation. But simulated elastic moduli keep the relationship that k33 > k11 > k22. | ||
Fig. 4 shows the elastic moduli for 8CB. For T − TNI between −6 K and 0 K (comprising the nematic phase), the simulated elastic constants are in excellent agreement with experimental data. It is well known that 8CB exhibits a smectic A–nematic transition at approximately 7 K below TNI, which results in a divergence of k22 and k33.16 The formation of layers along the nematic axis permits only deformations which are curl-free.31 This gives rise to a power-law scaling relation with a critical exponent of v ≈ 0.67.32 However, as the experimental k33 and k22 begin to diverge near the smectic A–nematic transition, we see that our simulated results do not exhibit the same behavior. It is clear that our measurements are not indicative of the presence of a smectic phase within our simulations.
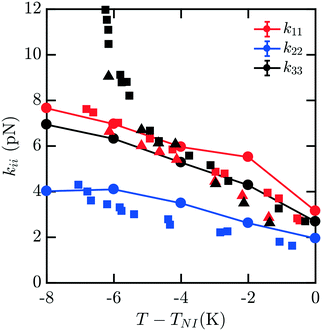 | ||
| Fig. 4 Bulk elastic constants for 8CB (circles) obtained from molecular simulation. Experimental data obtained from ref. 16 (squares) and 19 (triangles). For T − TNI in the interval [−6 K, 0 K] within the nematic phase, the simulated elastic constants are in excellent agreement with experimental data. However, when close to the smectic A–nematic transition we do not observe a divergence in k22 and k33 commensurate with the formation of a smectic phase. This is due to the suppression and disruption of layered ordering caused by a combination of the free energy sampling process and incommensurate box dimensions in the NVT ensemble suppressing the smectic phase. | ||
This apparent discrepancy is due to a number of effects. The first is a strong finite size dependence for the smectic A–nematic transition in this force field model, which has already been reported previously.6 Compared to larger systems, those containing fewer than N = 1000 mesogens, which is our case, exhibit a considerable discrepancy in smectic ordering.6 Similar behaviors were previously observed in combined phase and elastic property simulations of Gay–Berne models.30 The second is that we force the alignment of the 400 mesogens along the ẑ axis which may not be the preferred orientation of layers in a fixed-size periodic box. Thirdly, deformations to the mesogens are applied without considering the presence of smectic layering. Finally, simulations are carried out in the NVT ensemble which does not easily permit collective structural relaxation. All of these factors contribute to the suppression and disruption of smectic layering which would manifest in the divergent elasticities absent from our predictions. To properly accommodate and characterize natural smectic layering a semi-isotropic barostat would be necessary, allowing the box dimension ratios to adopt those corresponding to layer separation. The difficulties associated with this within the context of our elastic measurements have been discussed above. In principle, however, the methods we present may be extended to study this intriguing behavior in systems on the order of N = 3000 mesogens.6 Though we are unable to represent this divergence here, our results across the nematic phase are an excellent match to the experimental results.
Mixtures present a significant challenge for simulations exploring the elasticity of liquid crystals, as they have the potential for spatial inhomogeneity, and must be adequately equilibrated to ensure compositions are uniform and respond as expected to applied stress. The behavior of mixtures of molecules can often exhibit nontrivial dependences on composition which are difficult to predict. Here, we study a representative binary mixture of 5CB and 8CB where each component has a mole fraction of 0.50 (x5CB = 0.5 and x8CB = 0.5). The resulting mixture has a broadened nematic range relative to 8CB.33 Elastic measurements for this material were performed using the same protocol as outlined above for pure nCB. Compositions were confirmed to be effectively uniform throughout the simulation box upon equilibration. Fig. 5 shows the computed elastic moduli for this mixture. The raw values of the elastic coefficients are between those of 5CB and 8CB as a function of T − TNI, as may be reasonably expected.
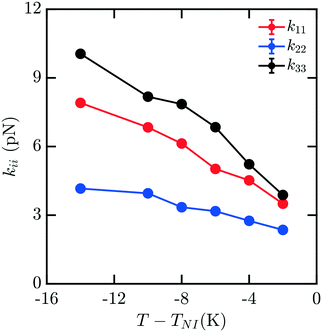 | ||
| Fig. 5 Bulk elastic constants for a mixture with of 5CB and 8CB with mole fractions x5CB = x8CB = 0.5. | ||
To understand how the mixture elasticities relate to the pure component properties, we plot each of the measurements of mixture kii on the same graph as those for 5CB and 8CB (see Fig. 6–8). The values for k11 and k22 clearly intercalate the representative nCB values, while, as the values for k33 are similar in 5CB and 8CB, all three values are closely bunched. On examination, it appears like our measured values for the mixture are a simple linear combination of the bounding nCB values. To see if this is the case, we plot the linear combinations of the elastic constants (green lines) of the compositions alongside the measurements (black lines) in Fig. 6–8 as a function of T − TNI. Quite surprisingly, these two curves lie almost on top of each other, despite all of the potential for nonlinearities in these mixing rules, not the least of which is related to the differences in TNI for the three systems. Interestingly, exactly this sort of linear dependence was found in lattice Lebwohl–Lasher mixtures in our prior work.34 This likely means that linear mixing rules can be expected for binary mixtures of chemically similar compounds. Such a linearity likely does not extend to more complex mixtures, or dissimilar chemical compositions. Still, development of simple correlations for liquid crystalline materials could be of great utility for engineering specific elastic properties in to LC-based materials and devices, and molecular simulations will be extremely useful to inform them.
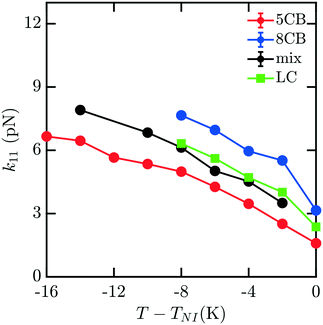 | ||
| Fig. 6 Bulk elastic constant k11 for the 5CB/8CB binary mixture (x5CB = x8CB = 0.5) (black) compared with the calculated k11 constants for 5CB8 (red) and 8CB (blue). The LC curve (green) is a linear combination of the elastic constants of 5CB and 8CB, weighted by mole fraction. | ||
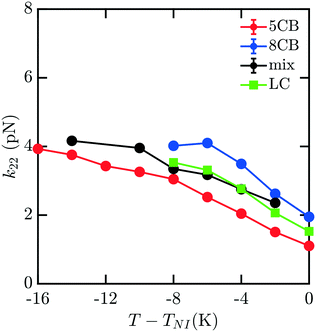 | ||
| Fig. 7 Predicted bulk twist elastic k22 constants for 5CB/8CB binary mixture. The curves are defined analogously to Fig. 6. | ||
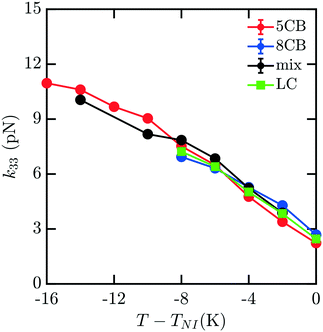 | ||
| Fig. 8 Predicted bulk bend elastic k33 constants for 5CB/8CB binary mixture. The curves are defined analogously to Fig. 6. | ||
Conclusion
In this work we have estimated the elastic constants of the cyanobiphenyls 6CB, 7CB, 8CB and binary mixtures (x5CB = 0.5, x8CB = 0.5) from biased molecular simulation using an entirely automated procedure. We show that the simulated elastic moduli of the cyanobiphenyls are generally in good agreement with reported experimental values. We find that the simulated elastic moduli of binary mixtures generally follow a linear combination of the compositions with reduced temperature. Difficulties arise in generating meaningful uncertainties and dealing with the onset of the smectic phase for 8CB. Both improving the prediction accuracy and applying this methodology on a large scale are only possible if the cost of elasticity measurements is substantially reduced. Currently, up to 4 μs of total simulation runtime is required to generate a estimate of a single elastic mode at a single temperature.Developing newer or better optimized sampling algorithms may significantly reduce this time and open the door to in silico liquid crystal engineering. This would necessitate some means of attenuating early-time noise present in elastic measurements, and perhaps a simplification of the order-parameter calculation which is computationally expensive and involves third-order tensor algebra. As presented, the methodology developed is capable of producing accurate elastic constants and merits further study to elucidate the precise limit of efficiency while retaining measurement fidelity. Further, a crucial next step involves moving beyond cyanobiphenyls and examine atomistic models of the myriad liquid crystal phases, from molecules of historical interest, such as PAA and MBBA35,36 to more exotic bent-core molecules and models exhibiting chiral37 or twist-bend phases.38 Improving the breadth, speed, and accuracy of these techniques will enable their use in computational screening of new mesogenic compounds.
Conflicts of interest
There are no conflicts to declare.Acknowledgements
HS acknowledges support from the National Science Foundation Graduate Research Fellowship Program (NSF-GRFP). JS and JKW acknowledge the support of MICCoM, the Midwest Center for Computational Materials, as part of the Computational Materials Sciences Program funded by the U.S. Department of Energy, Office of Science, Basic Energy Sciences, Materials Sciences and Engineering Division, for the development of algorithms and codes used within this work. JS, HS and JKW additionally acknowledge computational resources at the Notre Dame Center for Research Computing (CRC).References
- M. Kleman and O. D. Lavrentovich, Soft Matter Physics: An Introduction, Springer-Verlag, New York, 1st edn, 2003 Search PubMed.
- G. W. Gray and S. M. Kelly, J. Mater. Chem., 1999, 9, 2037–2050 RSC.
- T. Szilvási, L. T. Roling, H. Yu, P. Rai, S. Choi, R. J. Twieg, M. Mavrikakis and N. L. Abbott, Chem. Mater., 2017, 29, 3563–3571 CrossRef.
- G. Babakhanova, T. Turiv, Y. Guo, M. Hendrikx, Q.-H. Wei, A. P. H. J. Schenning, D. J. Broer and O. D. Lavrentovich, Nat. Commun., 2018, 9, 456 CrossRef PubMed.
- X. Wang, D. S. Miller, E. Bukusoglu, J. J. de Pablo and N. L. Abbott, Nat. Mater., 2015, 15, 106–112 CrossRef PubMed.
- M. F. Palermo, A. Pizzirusso, L. Muccioli and C. Zannoni, J. Chem. Phys., 2013, 138, 204901 CrossRef PubMed.
- H. Ramezani-Dakhel, M. Sadati, M. Rahimi, A. Ramirez-Hernandez, B. Roux and J. J. de Pablo, J. Chem. Theory Comput., 2017, 13, 237–244 CrossRef CAS PubMed.
- H. Sidky, J. J. de Pablo and J. K. Whitmer, Phys. Rev. Lett., 2018, 120, 107801 CrossRef CAS PubMed.
- D. W. Allender, G. P. Crawford and J. W. Doane, Phys. Rev. Lett., 1991, 67, 1442–1445 CrossRef CAS PubMed.
- A. Sparavigna, O. D. Lavrentovich and A. Strigazzi, Phys. Rev. E: Stat. Phys., Plasmas, Fluids, Relat. Interdiscip. Top., 1994, 49, 1344–1352 CrossRef CAS PubMed.
- R. D. Polak, G. P. Crawford, B. C. Kostival, J. W. Doane and S. Žumer, Phys. Rev. E: Stat. Phys., Plasmas, Fluids, Relat. Interdiscip. Top., 1994, 49, R978–R981 CrossRef CAS PubMed.
- E. Pairam, J. Vallamkondu, V. Koning, B. C. van Zuiden, P. W. Ellis, M. A. Bates, V. Vitelli and A. Fernandez-Nieves, Proc. Natl. Acad. Sci. U. S. A., 2013, 110, 9295–9300 CrossRef CAS PubMed.
- Z. S. Davidson, L. Kang, J. Jeong, T. Still, P. J. Collings, T. C. Lubensky and A. G. Yodh, Phys. Rev. E: Stat., Nonlinear, Soft Matter Phys., 2015, 91, 050501 CrossRef PubMed.
- X. Wang, D. S. Miller, E. Bukusoglu, J. J. de Pablo and N. L. Abbott, Nat. Mater., 2016, 15, 106–112 CrossRef CAS PubMed.
- H. Eimura, D. S. Miller, X. Wang, N. L. Abbott and T. Kato, Chem. Mater., 2016, 28, 1170–1178 CrossRef CAS.
- N. V. Madhusudana and R. Pratibha, Mol. Cryst. Liq. Cryst., 1982, 89, 249–257 CrossRef CAS.
- H. Hakemi, E. F. Jagodzinski and D. B. DuPre, J. Chem. Phys., 1983, 78, 1513 CrossRef CAS.
- G.-P. Chen, H. Takezoe and A. Fukuda, Liq. Cryst., 1989, 5, 341–347 CrossRef CAS.
- P. Chatopadhayay and S. K. Roy, Mol. Cryst. Liq. Cryst. Sci. Technol., Sect. A, 1994, 257, 89–98 CrossRef.
- G. Tiberio, L. Muccioli, R. Berardi and C. Zannoni, ChemPhysChem, 2009, 10, 125–136 CrossRef CAS PubMed.
- N. J. Boyd and M. R. Wilson, Phys. Chem. Chem. Phys., 2015, 17, 24851–24865 RSC.
- I. Cacelli, L. De Gaetani, G. Prampolini and A. Tani, J. Phys. Chem. B, 2007, 111, 2130–2137 CrossRef CAS PubMed.
- I. Cacelli, C. F. Lami and G. Prampolini, J. Comput. Chem., 2009, 30, 366–378 CrossRef CAS PubMed.
- G. W. Gray and K. J. Harrison, Symp. Faraday Soc., 1971, 5, 54–67 RSC.
- I. W. Stewart, The static and dynamic continuum theory of liquid crystals: a mathematical introduction, Taylor & Francis, London, 2004 Search PubMed.
- M. J. Abraham, T. Murtola, R. Schulz, S. Páll, J. C. Smith, B. Hess and E. Lindahl, SoftwareX, 2015, 12, 19 CrossRef.
- E. Darve, D. Rodrguez-Gmez and A. Pohorille, J. Chem. Phys., 2008, 128, 144120 CrossRef PubMed.
- J. Comer, J. C. Gumbart, J. Hénin, T. Lelièvre, A. Pohorille and C. Chipot, J. Phys. Chem. B, 2014, 119, 1129–1151 CrossRef PubMed.
- H. Sidky, Y. J. Colón, J. Helfferich, B. J. Sikora, C. Bezik, W. Chu, F. Giberti, A. Z. Guo, X. Jiang and J. Lequieu, et al. , J. Chem. Phys., 2018, 148, 044104 CrossRef PubMed.
- A. A. Joshi, J. K. Whitmer, O. Guzmán, N. L. Abbott and J. J. de Pablo, Soft Matter, 2014, 10, 882–893 RSC.
- P. de Gennes, Solid State Commun., 1972, 10, 753–756 CrossRef.
- H. Hakemi, Liq. Cryst., 1989, 5, 327–339 CrossRef CAS.
- S. Fujimura, Y. Yamamura, M. Hishida, S. Nagatomo and K. Saito, Liq. Cryst., 2014, 41, 927–932 CrossRef CAS.
- H. Sidky and J. K. Whitmer, Soft Matter, 2016, 12, 4489–4498 RSC.
- I. Haller, J. Chem. Phys., 1972, 57, 1400–1405 CrossRef CAS.
- W. H. D. Jeu, W. A. P. Claassen and A. M. J. Spruijt, Mol. Cryst. Liq. Cryst., 1976, 37, 269–280 CrossRef.
- I. Dierking, Symmetry, 2014, 6, 444–472 CrossRef.
- D. Chen, J. H. Porada, J. B. Hooper, A. Klittnick, Y. Shen, M. R. Tuchband, E. Korblova, D. Bedrov, D. M. Walba, M. A. Glaser, J. E. Maclennan and N. A. Clark, Proc. Natl. Acad. Sci. U. S. A., 2013, 10, 15931 CrossRef PubMed.
Footnotes |
| † Example scripts and information necessary to run the examples contained in this article are posted at https://github.com/shijiale0609/atomistic_elastics. |
| ‡ These authors contributed equally to this work. |
| This journal is © The Royal Society of Chemistry 2020 |

