 Open Access Article
Creative Commons Attribution 3.0 Unported Licence
Changes in the bending modulus of AOT based microemulsions induced by the incorporation of polymers in the water core
Björn
Kuttich
*,
Ann-Kathrin
Grefe
and
Bernd
Stühn
Experimental Condensed Matter Physics, TU Darmstadt, Germany. E-mail: b.kuttich@fkp.physik.tu-darmstadt.de; Tel: +49 6151 16 2584
First published on 15th July 2016
Abstract
The bending modulus κ is known to be a crucial parameter for the stability of the droplet phase in microemulsion systems. For AOT based water in oil microemulsions the bending modulus of the surfactant has values close to kBT but can be influenced by the presence of polymers. In this work we focus on the water soluble polymer polyethylene glycol and how it influences the bending modulus. An increase by a factor of three is found. For the correct evaluation of the bending modulus via percolation temperatures and droplet radii, thus by dielectric spectroscopy and small angle X-ray scattering, the determination of the radii right at the percolation temperature is crucial as we will show, although it is often neglected. In order to precisely determine the droplet radii we will present a global fitting model which provides reliable results with a minimum number of free fitting parameters.
1 Introduction
A microemulsion is a thermodynamically stable mixture of a hydrophilic and a hydrophobic component stabilised by the presence of a surfactant.1 The evolving micro-structure may be considered to consist of domains with dimensions on the nanometre length scale. These liquids are therefore optically transparent and macroscopically isotropic. Details of the micro-structure depend on the type of surfactant used and the mixing ratio as well as on temperature. The domain form varies with composition from lamellar and bicontinuous to spherical. In particular the latter has attracted large interest in fundamental and applied research. The selective solubility of guest molecules confines them within the nano-droplets of the microemulsion. Depending on the surfactant the system may favour water droplets embedded in an oil matrix (w/o) or the opposite arrangement (o/w). The size of the droplet and therefore the strength of confinement can be tuned mainly by the mixing ratio but is often also weakly dependent on temperature.2–7The surfactant layer separating hydrophilic and hydrophobic domains is soft in the sense that thermal energy is sufficient to cause fluctuations. Its rigidity is described by the bending modulus.8,9 Moreover droplets are Brownian particles diffusing in the continuous phase of the microemulsions. They will collide and exchange materials. The confinement of guest molecules is therefore called a soft confinement.
In recent years microemulsions in the droplet phase have been used as such soft confining geometry for many different molecules like glass forming liquids, polymers or proteins.4,10–12 A key question in these studies has been the stability of the microemulsion system itself under the influence of the added molecules. It is indeed found that additives have a significant impact on the phase boundaries of the droplet phase.13,14 The concentration of added molecules in these studies is low and amounts to a few molecules per droplet.
Two well suited complementary measuring methods for the investigation of phase stability in microemulsions are small angle scattering and dielectric spectroscopy. The first one provides detailed information on the structural properties of the system and allows a temperature resolved determination of droplet radii and their distribution.3–5 Furthermore interdroplet interactions leading for example to the aggregation of droplets can be investigated.3,5 Dielectric spectroscopy gives access to the conductivity of the system. Charge transport is very sensitive to phase changes in a microemulsion especially for w/o systems. It gives rise to the so called percolation transition, an increase of conductivity over several orders of magnitude due to quite a small change in temperature.13–17
Connecting the information from small angle scattering and dielectric spectroscopy allows us to access a fundamental quantity for the stability of the droplet phase, the bending modulus of the surfactant shell.17–19 In microemulsion systems the bending modulus is usually of the same size as kBT which makes the micro-structure appear rather floppy. It fluctuates on a nanosecond time scale.17,20,21 Being so close to the thermal energy of the system already small changes of the bending modulus due to the insertion of guest molecules into the core of the droplets can strongly change the phase properties of the microemulsion.
In the present study we focus on microemulsions based on the anionic surfactant dioctyl sodium sulfosuccinate (AOT) which favours a w/o droplet phase over a broad range of temperatures and mixing ratios. The continuous oil phase is octane and the water cores of the droplets contain the water soluble polymer polyethylene glycol. Droplet size and polymer concentration are varied systematically in order to provide different confining situations and stability of the droplets i.e. the bending modulus is investigated. In order to reliably determine the bending modulus from small angle X-ray scattering and dielectric spectroscopy, especially in the case of polymer loaded droplets, both experimental techniques have to be performed in a range of well-defined temperature. This fact which is often not considered for the scattering experiments but as we will show it is absolutely mandatory.
2 Experimental details
2.1 Sample preparation
Preparation of the different microemulsions was done by weighing appropriate amounts of surfactant, water, oil and polymer on a microbalance and mixing these components using a vortex shaker. After preparation the samples are stored in sealed borosilicate glasses at room temperature. They are stable over several years. Water was taken from a Millipore Direct-Q3 ultrapure water system. The surfactant AOT was purchased from Sigma Aldrich. The polymer was obtained from Alfa Aesar with a mean molecular weight of Mn = 4000 g mol−1 (PEG4000). Both the polymer and the surfactant were dried for 24 hours at 45 °C in a vacuum oven before sample preparation. The composition of the microemulsion is defined using the parameters w and ϕ. w denotes the molar ratio of water to surfactant molecules and ϕ denotes the volume fraction of water plus surfactant. For droplet phase microemulsions this parametrisation is very convenient since w is proportional to the droplet radius and ϕ directly gives the droplet volume fraction.22 To quantify the amount of polymers in the samples the parameter Z is introduced calculated by the average number of polymer chains per droplet. For our experiments we chose to keep the droplet volume fraction constant at ϕ = 0.1 and vary w between 20 and 40 yielding water core radii from 28 Å to 56 Å approximately.22 The number of polymers per droplet is varied between Z = 0 and Z = 3. This corresponds to polymer in water concentrations up to 18% which is close to the estimated overlap concentration of PEG4000 of 24%.23To perform the measurements samples were filled in borosilicate capillaries with a diameter of 1.5 mm for the small angle X-ray scattering experiments or a sample holder similar to that described in ref. 24 for dielectric spectroscopy. Since some of the highly polymer loaded systems are no longer in the one phase microemulsion region at room temperature special care has to be taken for their measurement. To ensure that the measurement, small angle X-ray scattering as well as dielectric spectroscopy, always begins in the one phase droplet region of the system all parts starting from the storage glass, via the syringes used, the sample cell and the instrument were heated up to a temperature at which the sample was in the one phase region. Then the sample was filled as quickly as possible in the sample cell and inserted in the instrument without dropping below the phase separation temperature and the measurement started at this chosen temperature.
2.2 Small angle X-ray scattering
 , with 2ϕ being the scattering angle. The sample temperature was monitored using a PT100 platinum resistance thermometer and controlled via a Eurotherm controller with an accuracy of 0.2 K. Prior to each measurement the sample was equilibrated at the given temperature for 300 s.
| I(q) ∝ 〈F(q)〉2S(q) + 〈F(q)2〉 − 〈F(q)〉2 | (1) |
 | (2) |
For the structure factor we chose a combination of the phenomenological Ornstein–Zernike structure factor3 and a hard-sphere structure factor27 as it is explained by Domschke et al.5 The Ornstein–Zernike structure factor is expressed as
 | (3) |
 | (4) |
The overall number of fitting parameters of the described model is five for the form factor (core radius rc, radius polydispersity σ, shell thickness δ, scattering contrast core–shell Δρcs and scattering contrast shell–matrix Δρsm), four for the two structure factors (susceptibility χ, correlation length ξ, hard-sphere volume fraction η and radius RHS) and an additional pre-factor resulting in ten fitting parameters in total. This number can be significantly reduced by fixing several parameters to their known values from literature. For the form factor these are the scattering length densities for the core ρc = 9.4 × 10⁻⁶ Å2, the polar head group of the shell ρs = 23.9 × 10⁻⁶ Å2 and the surrounding matrix ρm = 6.88 × 10⁻⁶ Å2.28,29 Furthermore the thickness of the polar AOT head group is independent of the sample composition and temperature and given by δ = 2.1 Å.5 For the hard-sphere structure factor the radius can be estimated by RHS = rc + δ + LAOT with LAOT = 10.5 Å being the length of the alkane tails of the AOT molecule.2,5,30 So if every single scattering curve is fitted individually the final number of free fitting parameters is six per sample and temperature.
For a scattering curve with pronounced minimum due to the form factor and precisely measured low q-range to cover the structure factor six parameters are expected to be an adequate number of free fitting parameters. Thus the results of the fitting procedure promise to be reliable. Nevertheless the different contributions discussed for the scattering profile overlap in the observed range of scattering vectors q. This may lead to correlations between different fitting parameters which make their reliable determination a difficult task. In order to deal with these correlations we make use of known relations between the different structure factor parameters and system parameters like temperature and droplet size. We use these relations to fit multiple data sets taken in a range of temperatures and for different droplet size in one step. This method of global fitting will allow us to determine even the otherwise correlated structure factor parameters precisely and reliably.
By increasing the temperature it is possible to leave the stable one phase droplet region and to obtain a demixed two phase system. This demixing takes place at a temperature Tc which is called the phase separation temperature. At this temperature the system undergoes a second order phase transition which is directly related to critical fluctuations within the sample.3,5,31 Due to this phase transition several quantities obey a power law behaviour while approaching Tc. This applies to the susceptibility χ and the correlation length ξ included in the Ornstein–Zernike structure factor part.32 As has been shown by several authors the temperature dependence on the susceptibility and the correlation length can be written as
| χ(T) = χ0·θ−γ |
| ξ(T) = ξ0·θ−ν | (5) |
Finally the hard-sphere volume fraction η can be addressed. Domschke et al. concluded from their investigations that at higher temperatures the Ornstein–Zernike structure factor part becomes stronger due to droplet clustering, and the number of free droplets interacting like hard spheres is reduced.5 They found that this decrease is linear with increasing temperature which allows further reduction of the free fitting parameters since the hard-sphere volume fraction can be written as:
 | (6) |
In conclusion the total number of free fitting parameters for the 42 scattering curves mentioned above is now not 42 × 6 = 252 as for an individual fitting procedure but down to 132 due to the global fitting which results in an average of 3.1 parameters per scattering curve. The merit of this fitting technique is that possible correlations between the different structure factor parameters are already incorporated in a physical reasonable way in accordance with the literature.3,5,31
2.3 Dielectric spectroscopy
For the dielectric spectroscopy a Novocontrol Alpha-N High Resolution Dielectric Analyzer was used with frequencies ranging from 101 Hz to 107 Hz. Dielectric spectroscopy measures the frequency dependent complex impedance Z*(f) from which the dielectric function ε*(f) can be calculated by ε*(f) = (2πifZ*(f)C0)−1, with C0 denoting the capacitance of the empty capacitor. In this publication we analyse the real part σ′(f) of the complex conductivity σ*(f), which is related to the dielectric function via σ*(f) = 2πifε0ε*(f). The relative uncertainties of the measured complex conductivities during one measurement are below one percent. However the errors of the absolute values of σ′ and σ′′ are mainly determined by the uncertainties of capacitor geometry and are estimated to be about 2%. The sample temperature was controlled using a Novocontrol Quatro Cryosystem with a temperature stability better than ±0.1 K and an absolute accuracy of ±0.5 K. All temperature dependent measurements were performed in heating runs, with 300 s stabilisation time at each measured temperature.The dc conductivity of a w/o microemulsion is in general very low, around σdc = 10−8 S cm−1, due to the resistance of the oil continuous matrix.6,13 It is larger than that of the pure oil because droplets can carry net charges and therefore act as huge ions diffusing through the oil. This mechanism is described by the charge fluctuation model.33,34 If either droplet concentration or temperature in such a system is increased, conductivity can rise dramatically up to four orders of magnitude because of a phenomenon called dynamic percolation. It is caused by an attractive force between the droplets.6,35–37 As a consequence of this droplets start to form aggregates and at the percolation threshold an extended droplet cluster from one electrode to the other is formed. Charge transport therefore changes its mechanism from charge fluctuation and Brownian transport to conductivity along the cluster. If droplet concentration or temperature is increased even further the system eventually passes the phase boundary and decomposes into a two phase system which leads to a sharp drop in the measured conductivity. The precise temperature or droplet concentration at which the percolation and the phase transition occur depends on the droplet size as well as on the amount of polymers inserted into the water core.13
We use temperature as the controlled parameter to study percolation and phase separation. To obtain the percolation Tp and the phase separation Tc temperature the temperature dependence on the complex dielectric conductivity was studied at a frequency of 104 Hz. This frequency was chosen because there are no disturbing effects from electrode polarisation or dielectric relaxations present.13 The percolation temperature was then determined as the inflexion point of the logarithmic conductivity plotted versus temperature, while the phase separation temperature was taken from the last point before the final drop in conductivity.13
2.4 Determination of the bending modulus
The bending modulus κ of the surfactant layer controls the extent of form fluctuations and the percolation temperature. Therefore from a combination of structural information as the droplet sizes and thermodynamic properties like the percolation temperature it is possible to determine the bending modulus κ of the surfactant shell.17,18 In order to distinguish large and small length scales of fluctuations in a microemulsion De Gennes and Taupin introduced the so called persistence length ξK of the surfactant shell.9 For distances smaller than ξK the surfactant layer looks smooth and flat while for larger distances it is crumpled.Furthermore, they concluded that the persistence length should obey the following Arrhenius type equation9
 | (7) |
 | (8) |
2.5 Temperature calibration
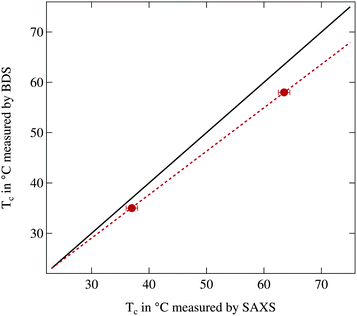
In the following we will combine results from dielectric spectroscopy and small angle X-ray scattering. In particular the precise phase separation temperature Tc is needed to be used in the global fitting procedure of scattering data. The percolation temperature Tp has to be known for the calculation of the bending modulus. In both cases the equivalence between temperatures measured in the dielectric spectrometer and the small angle X-ray scattering device is absolutely crucial for correct results. In order to check this equivalence a calibration substance is needed whose structural and dielectric properties change depending on temperature in a way that it can be resolved by both experimental techniques. This will allow us to determine the possible difference in the actual sample temperatures in both experimental setups.Excellent candidates for this purpose are liquid crystals. In a liquid crystal the phase transition between the nematic and the isotropic phase can be measured by a reduction in the dielectric permittivity as well as by the disappearance of the nematic order peak. For the relevant temperature range between 25 °C and 75 °C we found two liquid crystals with a nematic to isotropic transition, 5CB and E7. The liquid crystal 5CB has a phase transition temperature around 36 °C while this temperature for E7 is 60 °C.39,40
In Fig. 1 the phase transition temperature as measured by broadband dielectric spectroscopy (BDS) is plotted against the corresponding temperature observed in small angle X-ray scattering (SAXS). Physically the reduction of the permittivity and the vanishing of the structure peak should occur at the same temperature thus the two data points should be located on the bisecting line. As can be clearly seen this is not the case and the phase transition temperatures determined by SAXS are significantly increased in comparison to the ones from BDS. Therefore a calibration line is calculated assuming that in thermal equilibrium at room temperature both setups show the same temperature and at higher temperatures a linear offset is present, quantified by the two measured reference values. In the following we use this calibration line to match temperatures between both instruments.
Since the phase transition temperatures determined by BDS are closer to the literature values the temperatures from dielectric spectroscopy will be regarded as accurate temperatures while the temperatures from SAXS are recalculated using the calibration line. For the highest investigated temperature of 75 °C the deviation between both instruments is ΔT = 5.2 K which demonstrates the necessity of the calibration procedure.
3 Results
3.1 Variation of transition temperatures with droplet size and polymer content
We start with the determination of percolation and phase separation temperature depending on the droplet size and the amount of polymers present in the system. We use the temperature variation of conductivity as described in Section 2.3. Fig. 2 shows the temperature dependent conductivity for different droplet sizes and for Z = 0 and Z = 1 polymer chains per droplet. For all investigated samples a rise of conductivity by orders of magnitude can be observed due to dynamic percolation. At even higher temperatures the conductivity collapses again because of the phase transition into two phase systems.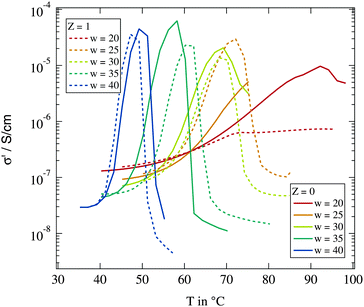 | ||
| Fig. 2 Real part of the dielectric conductivity at f = 104 Hz for different droplet sizes and polymer contents. | ||
As described above the percolation temperature Tp can be determined from these conductivity data as the point of inflexion on the rising side while the phase separation temperature Tc is given by the temperature at which the conductivity starts to drop again. An increase of the molar water to surfactant ratio w and thus an increase in droplet size clearly lead to a reduction of both Tp and Tc. The influence of the polymer addition in contrast is not clear. An increase as well as a decrease of the percolation temperature with regard to the polymer free case can be observed. An overview of the observed percolation and phase separation temperatures for all investigated samples in this work is given in Fig. 3.
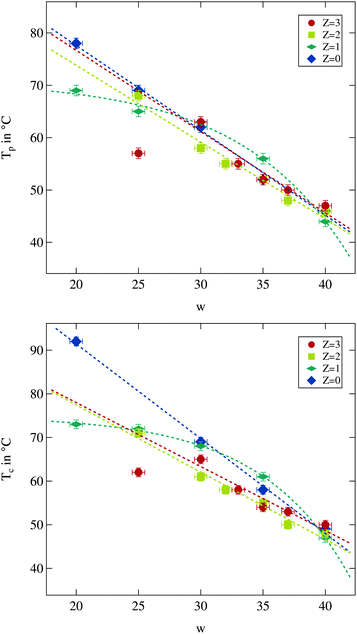 | ||
| Fig. 3 Percolation temperature Tp and phase separation temperature Tc for different droplet sizes and polymer contents. Dashed lines are guides for the eye. | ||
As can be seen both temperatures are overall decreasing with increasing water to surfactant ratio w as was observed before.13 The influence of polymer content is less clear. While for large droplet sizes the changes due to the presence of the polymer are weak, it becomes more prominent for small droplets and larger polymer contents. For the latter case a decrease in both temperatures can be observed, and thus the temperature range of the droplet phase is reduced. For the largest droplets both temperatures seem to be elevated which has also been reported in the literature.13,14,41
Taking a closer look at the influence of droplet size on both temperatures another interesting feature of polymer addition becomes apparent. The polymer free system as well as the ones with Z = 2 and Z = 3 seems to show linearly decreasing percolation and phase separation temperatures with increasing w, at least as long as the w = 25 sample with Z = 3 is excluded. For the Z = 1 series, however, this appears to be different. At small droplet sizes an increase of w has almost no effect while for the large droplets the strongest decrease of all investigated series in both temperatures due to an increase in w can be seen. The number of data points available does not allow for a more detailed discussion of the variations. But it is useful to keep the particular behaviour for the Z = 1 series in mind while investigating the structural quantities.
In conclusion an analysis of percolation and phase separation temperature, quantities purely determined by dielectric spectroscopy, does not show a systematic influence of polymer addition on transition temperatures. In the following section we will discuss the results obtained by small angle X-ray scattering focussing on the impact of the added polymer on the microemulsion system.
3.2 Variation of droplet size and interaction
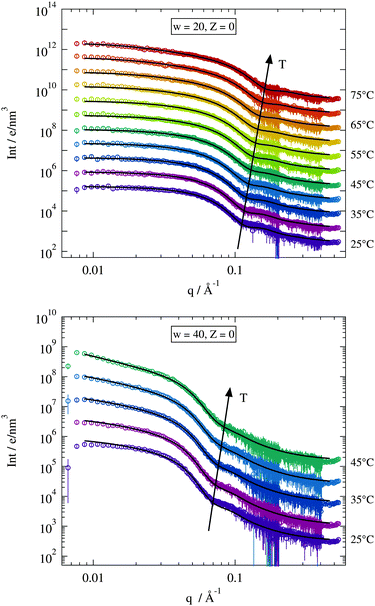 | ||
| Fig. 4 Temperature dependent scattering curves for two chosen Z = 0 samples. Solid lines are fits of the model described in Section 2.2.2. Curves are vertically shifted for clarity. | ||
For large scattering vectors (q ≳ 0.08 Å−1) all scattering curves show a pronounced shoulder emerging from the spherical form factor. As expected this maximum shifts to lower q-values for larger w implying larger structures, while the increasing temperature has the opposite effect.4,5,22,30, In the case of the w = 40 sample the maximum becomes more smeared for higher temperatures. This effect seems less pronounced in the w = 20 sample. Looking at the low q-range where the structure factor should dominate the scattering signal the w = 20 sample shows almost a horizontal trend typical for single particle scattering. The w = 40 sample on the other hand clearly exhibits an increasing power law behaviour in I(q) with increasing temperature. This different behaviour for both droplet sizes is due to their different separation between percolation and phase separation temperature. As seen by dielectric spectroscopy the gap between Tp and Tc becomes systematically smaller for larger droplets. Since the scattering curves are only recorded up to the percolation temperature the distance to the phase separation is much larger for smaller droplets than for the bigger ones resulting in a less pronounced power law behaviour at low q-values.
The solid black lines in Fig. 4 represent collective fits by the model described in Section 2.2.2. The form factor part of this model is mostly dominated by the radius of the spherical water core rc and its polydispersity σ. Both parameters are fitted individually to each scattering curve and this enables the model to describe the high q-range quite well. The structure factor parameters are adjusted globally to describe all the recorded data curves with Z = 0 at once. Here as well the model fits nicely the discussed features of the scattering curves at low q. Some minor deviations can be seen in the case of the w = 40 sample at T = 25 °C but even for this data set the model provides an acceptable description especially considering the low number of fitting parameters.
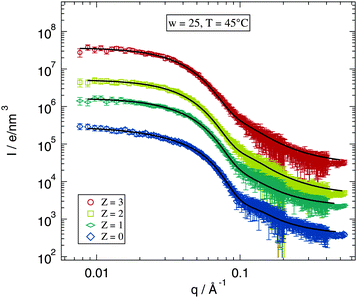
Since the fitting model describes in good agreement the Z = 0 samples the next question is, whether this works as well for the polymer loaded samples. The selected data shown in Fig. 5 allow for a direct inspection of the impact of the added polymer on the scattering profile. The figure shows scattering curves and fits for w = 25 and T = 45 °C for the investigated polymer concentrations. The differences between the scattering curves for various values of Z are obviously rather small. The form factor maximum around q ≈ 0.15 Å−1 becomes slightly broader for higher polymer concentrations but this can still be described by the fitting model. The structure factor part does not seem to be influenced by polymer addition for the data shown. Thus also the low q-range is fitted well by the model.
The quality of the fitting model as discussed in this section is satisfactory for all recorded scattering curves. The main features of the form factor, the maximum at intermediate and high q-values, as well as the ones for the structure factors, especially the power law behaviour at temperatures close to the phase separation, are nicely described by the proposed model. Therefore we expect the resulting fitting parameters to be reliable and focus thus on their evaluation in the following sections.
 | (9) |
Furthermore the temperature dependency of c is discussed.5,46,48–51 In the investigated temperature range the molar volume of water can be considered as a constant and thus temperature dependent changes in the droplet volume are due to the changing effective surface area of the AOT head group AAOT. For ionic surfactants such as AOT a repulsive interaction between the head groups appears. The strength of this interaction depends on the presence of counter ions, dissolved in water, shielding the head groups against each other. By increasing the temperature the solubility of these ions is increased, the shielding reduced and thus the repulsion increases leading to a larger effective surface area of the droplets.50 Due to the geometrical considerations of eqn (9) this leads to a reduced radius of the microemulsion droplets upon heating which is indeed observed in several studies.5,46,48,51 Thus from now on we will refer to c as c(T).
Since our fitting model described in Section 2.2.2 allows us to determine the water core radius of the droplets as well as its polydispersity we can now investigate c(T) by plotting the scaled radius (1 + 2σ2)·rc against w as shown in Fig. 6 for various temperatures of all the samples from the Z = 0 and Z = 3 series. For both polymer concentrations the linear relation implied by eqn (9) is well established. A closer investigation nevertheless reveals some interesting differences. The fitted lines spread wider for the Z = 3 samples indicating an increased influence of temperature on those samples. For the two lowest investigated temperatures in contrast this does not seem to be the case since here the data points for the Z = 3 sample are almost identical. Furthermore the polymer loaded samples with w ≤ 30 are clearly deviating from the linear relation predicted by eqn (9). This deviation to larger radii is most likely due to the presence of the polymer. Polymer size is characterized by its radius of gyration of rg ≈ 25 Å. Thus in the case of Z = 3 the polymer should be strongly confined by the droplets which may be expected to influence droplet radii in return.52,53 The missing low temperature radii for the small polymer loaded droplets could not be measured because the polymer addition leads to an increase of the lower phase boundary thus the droplet phase becomes unstable below 40 °C for these samples.
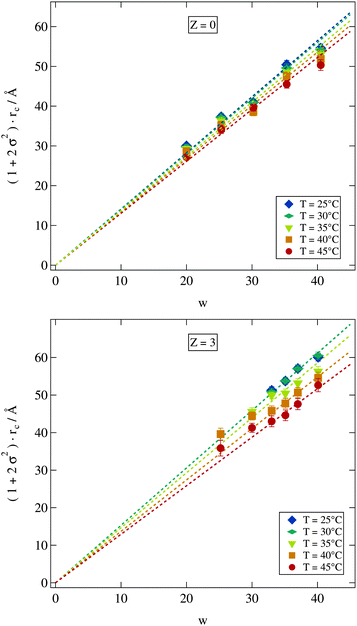 | ||
| Fig. 6 Polydispersity σ scaled water core radius rc shows a linear dependency on the molar ratio of water to surfactant w. Dashed lines are fits of eqn (9). Error bars are smaller than symbols if not visible. | ||
A more detailed description of the impact of the polymer on the temperature variation of droplet size is obtained from the quantity c(T) in eqn (9). For fitting eqn (9) to the scaled radii the small w high Z samples with clearly deviating radii discussed above were excluded. Polymer free microemulsions should exhibit a linearly decreasing c(T) with increasing temperature.5 Indeed this same variation can be observed for the samples investigated in this work as shown in Fig. 7. A reduction of the proportionality constant with increasing temperature can also be seen for the polymer loaded samples but for Z ≥ 2 the decrease is identical and not linear any more. For these high polymer concentrations a temperature increase around 25 °C has almost no effect which we have already seen in Fig. 6 for the Z = 3 series. At elevated temperatures c(T) is strongly influenced by temperature and the proportionality constant drops rapidly with temperature. Besides the different temperature dependent behaviour for various Z values, there is a crossing point where all lines intersect. This point is at T ≈ 45 °C and c(T) ≈ 1.3. At this temperature an increase in the molar ratio of water to surfactant w leads to the same increase in the droplet radius independent of the presence of the polymer.
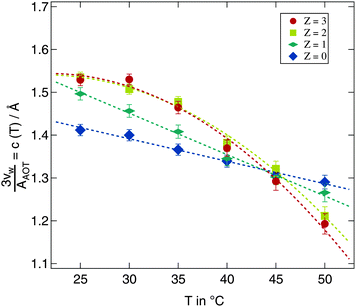 | ||
| Fig. 7 Development of the proportionality constant c(T) from eqn (9) for all investigated temperatures and polymer concentrations. Dashed lines are guides for the eye. | ||
We now consider the direct impact of polymer addition at fixed droplet size and temperature. At T = 40 °C most of the samples are in the non-percolated stable droplet phase for all polymer concentrations. We therefore choose this temperature in Fig. 8 to display the polydispersity scaled water core radii rc for all stable samples at this temperature. Addition of the polymer does clearly lead to an increase in polydispersity and radius independent of the molar water to surfactant ratio w. With the exception of the filled symbols (w = 35) obviously the increase of the scaled radius per polymer chain can be described by straight lines with a w independent slope of 1.6 Å per polymer chain. Since this analysis is based on the polydispersity scaled radii which combines the influence of polymer addition on both quantities it is hard to relate the fitted slope to a structural property of the pure polymer.
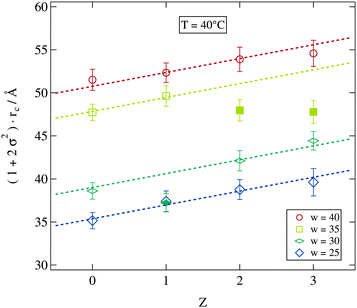 | ||
| Fig. 8 Dependence of the scaled water core radius on the number of polymer chains per droplet Z. Dashed lines are guides for the eye with an identical slope. | ||
Considering the slight change in the density of the polymer–water mixture in comparison to the pure water system the increase in droplet volume due to the presence of the polymer can be estimated.54 For one polymer chain in a w = 30 droplet the polymer in water mass concentration is c = 0.02 which leads to a relative increase in the droplet radius of about 1%. This is a much smaller effect than that observed here. Thus the polymer's influence on the microemulsion droplet has to be more complex than a simple volume change. In fact it is expected that PEG adsorbs at the water–AOT interface due to the presence of hydrophilic and hydrophobic groups of the polymer, which has a significant influence on the surfactant shell properties as we will see later.13,18,55,56
Droplet size is clearly influenced by the presence of the polymer. Polymer addition systematically affects both temperature and w dependence of the droplet radius and its polydispersity.
The critical exponents acquired from the fitting model are shown in Fig. 9. The model assumes the critical exponents to be independent of the droplet radii, which is justified as discussed in Sections 2.2.2 and 3.2.1, and therefore only a possible variation of the critical exponents due to polymer addition may be expected. But even the addition of the polymer has no significant influence on both parameters. The dashed lines indicate two fitted constants to all shown data points with the condition γ = 2ν resulting in ν = 0.73 and γ = 1.46 which is in good agreement with the literature.3,5,31,57 Obviously the addition of the polymer does not change the occurrence of critical fluctuations approaching the phase separation temperature and thus the fundamental properties of the phase transition itself are unaffected.
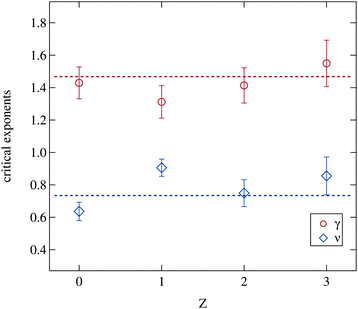 | ||
| Fig. 9 Critical exponents γ and ν retrieved from the Ornstein–Zernike part of the structure factor (eqn (3) and (5)). Dashed lines are fitted constants to all data points with the premise γ = 2ν. | ||
Besides the critical exponents the pre-factors of the power laws included in the Ornstein–Zernike structure factor part (eqn (5)) can be obtained from the data. As opposed to the critical exponents these prefactors include specific properties of the system. Indeed they change strongly with the number of polymers added. For example the absolute size of droplet clusters, as given by the correlation length ξ, depends on the molar ratio of water to surfactant w.5 This w dependency of ξ0 is linear and was included in the fitting model as ξ0 = ξw·w as discussed in Section 2.2.2. Fig. 10 therefore depicts the two w independent factors ξw and χ0. Both pre-factors clearly decrease with increasing polymer content, while again the Z = 1 samples deviate from the overall trend. This is excluded from further analysis. The two dashed lines are fits of an exponential decay with an equal slope as the guide for the eye.
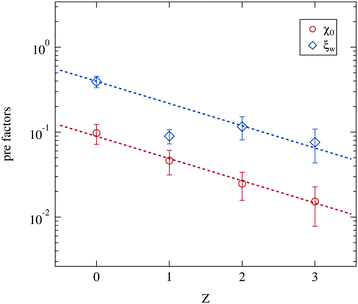 | ||
| Fig. 10 Pre-factors ξw and χ0 retrieved from the Ornstein–Zernike part of the structure factor (eqn (3) and (5)). Dashed lines are guides for the eye with an identical slope. | ||
The susceptibility χ is in general proportional to an osmotic compressibility.5 Thus the reduction of χ0 under polymer addition can be interpreted as a decrease in the compressibility which in turn means a stiffening of the microemulsion droplets. Usually this stiffening is associated with an increase in percolation temperatures.13,58 This observation is not fully supported by our dielectric measurements since a varying droplet size leads to different shifts of the percolation temperature under polymer addition (see Section 3.1).
The similar decrease of the pre-factor ξw can on one hand be interpreted as a reduction of the absolute cluster size close to the percolation with increasing polymer content. On the other hand, since ξ0 = ξw·w, the size of the single droplets has a smaller influence on the cluster size of polymer loaded microemulsions than on the polymer free ones. In contrast to the critical exponents γ and ν the pre-factors χ0 and ξw show a clear dependency on the presence of the polymer. The phase transition itself taking place at the phase separation temperature Tc is thus not modified by the addition of PEG, while the detailed structural features as cluster sizes for example are determined by the polymer concentration per droplet.
3.3 Bending modulus of the surfactant layer
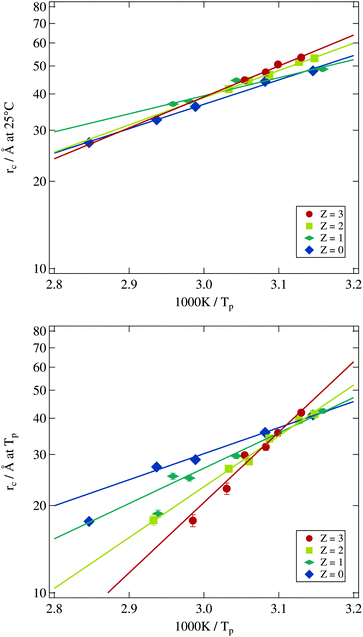
Using the results from the dynamic investigations by dielectric spectroscopy and the structural analysis by small angle X-ray scattering it is now possible to obtain the bending modulus of the surfactant shell of the microemulsion droplets. In detail we combine percolation temperatures and droplet radii. As predicted by eqn (8) the logarithm of the droplet radius at the percolation threshold should scale with the corresponding inverse percolation temperature. The slope of this linear dependency then is proportional to the bending modulus κ. Most publications making use of this relation directly measure the percolation temperature by dielectric spectroscopy but estimate the droplet radius by the simple equation rc ∝ w.13,18 Others determine the droplet radius at room temperature by small angle X-ray scattering and assume the changes by heating up to the percolation temperature as negligible.17 Both approaches are problematic as we have seen by analysing the form factor in Section 3.2.2. The droplet radius at Tp can deviate strongly from the simple estimation mentioned above or from its room temperature value.In Fig. 11 the logarithmically scaled droplet radius rc is plotted against the inverse percolation temperature Tp in order to check if eqn (8) holds true for the investigated systems even under polymer addition. The upper tile of the figure uses the droplet radii determined for each sample at 25 °C, while for the lower tile the radii were obtained at the individual percolation temperature of the sample. In both representations the linear dependency of the quantities predicted by eqn (8) can be seen, although the smallest droplets show some deviations for Z = 0 and Z = 1 if radii are determined at Tp. Addition of the polymer to the microemulsion droplets clearly does not affect the validity of the relation, but influences its slope and thus the bending modulus. The solid lines are fits of eqn (8) to the different Z series. While the data points in the upper tile of Fig. 11 are densely packed and do not seem to depend systematically on Z, the radii evaluated at Tp in the lower tile show an increasing slope with rising Z. Furthermore the different lines again intersect at one temperature which is around 1000 K/Tp ≈ 3.15 thus Tp ≈ 45 °C precisely the intersection temperature we already determined for c(T) in Fig. 7. Such intersection points by the determination of the bending modulus under addition of polymers have been found before but at different temperatures which might be due to different molecular weights of the added polymer or the determination of the droplet radius at room temperature.14,17
Since for both methods of determining the droplet radius eqn (8) is fulfilled for all polymer concentrations it is possible to evaluate the Z dependent bending modulus κ. Fig. 12 presents the results of this evaluation and compares both approaches. The absolute value of κ ≈ kBT for the polymer free systems is in good agreement with the literature.13,14,17,18,21,59–61 For the polymer loaded systems a significant difference between the radius evaluation at 25 °C and at Tp exists. While for the former the bending modulus is rather constant under polymer addition the latter one shows a strongly increasing bending modulus up to a factor of three in comparison to the Z = 0 sample.
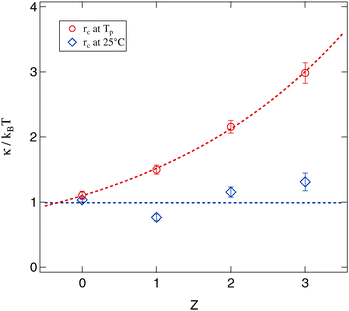 | ||
| Fig. 12 Bending modulus of the surfactant shell evaluated by eqn (8) and its dependency on the number of polymer chains per droplet Z. Dashed lines are guides for the eye. | ||
The basic assumption underlying eqn (8) is that at the percolation threshold Tp the persistence length ξK becomes equal to the droplet radius rc.18 Obviously this droplet radius has to be the one at the percolation temperature and not the one at room temperature or somewhere else. In conclusion the physically relevant curve in Fig. 12 is the upper one showing the strongly increasing bending modulus under polymer addition. This interpretation is further supported by the decreasing osmotic compressibility determined from the susceptibility χ of the Ornstein–Zernike structure factor part, which also points towards a stiffening of the surfactant shell (see Section 3.2.3).
4 Conclusions
Two transition phenomena are observed in the droplet phase of AOT based microemulsions: the dynamic percolation at T = Tp and phase separation at the transition temperature T = Tc. These transitions are controlled by interdroplet interaction and the stability of the surfactant layer. When adding a polymer (PEG) to the water core of the droplets one finds a variation of the transition temperatures. Here we try to determine the bending modulus of the surfactant layer and its variation with the addition of the polymer. Experimentally we base our results on the determination of the droplet structure and on measurements with dielectric spectroscopy. Both transitions show up clearly in the variation of conductivity with temperature. We can thus study a wide range of droplet size, temperature and polymer content of the droplets.Initially both temperatures, Tp and Tc, did not show a systematic dependency on the number of polymer chains per droplet. While for small droplets a decrease of the temperatures was observed the opposite holds true for larger droplets, an observation which has been reported in the literature.14,17 In order to understand these observations experiments have to be extended to cover a maximum range of parameters and in particular the comparison of results from different experiments needs careful calibration of temperature.
For the structural investigations small angle X-ray scattering was used and we proposed a rather complex global fitting model, fixing several correlations between structure factor parameters in order to obtain reliable results. Here we make use of established dependencies of the structure on the composition of the system and temperature. This model provided a very good description of the experimental results. We were thus able to describe all data curves in the full recorded range of scattering vectors. The water core radius rc and its polydispersity σ were found to obey the linear dependence on the molar ratio of water to surfactant w. This law prevailed even for systems with added polymer. The temperature dependent proportionality constant c(T) decreased for all polymer contents with increasing T but changed from a linear to a quadratic decay for higher Z. For T = 45 °C the proportionality constant was found to be equal for all values of Z thus independent of the presence of polymers. Droplets are stable with respect to the addition of PEG.
Looking into the structure factor parameters the critical phenomena leading to the second order phase transition at Tc are not influenced by the presence of polymers. The critical exponents ν and γ of the correlation length ξ and the susceptibility χ obeyed the theoretically predicted scaling law γ = 2·ν and are in good agreement with other investigations on microemulsion systems.3,5,31,57 However, prefactors ξw and χ0 revealed that the cluster formation in polymer loaded systems is less dependent on the single droplet radius and that compressibility is reduced upon polymer addition.
Finally by a combination of structural and dynamic results we showed that the evaluation of the bending modulus κ of the surfactant shell depends crucially on the correct determination of the droplet radii right at the percolation threshold. If this is correctly taken into account the bending modulus is found to increase significantly under polymer addition up to a factor of three for the largest investigated values of Z.
Acknowledgements
Financial support from the “Deutsche Forschungsgemeinschaft” DFG through the “DFG-Forschergruppe 1583”, project STU191/6-1, is thankfully acknowledged.References
- C. Stubenrauch, Microemulsions, John Wiley & Sons, 2008 Search PubMed.
- S. H. Chen, Annu. Rev. Phys. Chem., 1986, 37, 351–399 CrossRef CAS.
- M. Kotlarchyk, S. H. Chen and J. S. Huang, Phys. Rev. A: At., Mol., Opt. Phys., 1983, 28, 508–511 CrossRef CAS.
- T. Spehr, B. Frick, I. Grillo and B. Stühn, J. Phys.: Condens. Matter, 2008, 20, 104204 CrossRef.
- M. Domschke, M. Kraska, R. Feile and B. Stühn, Soft Matter, 2013, 9, 11503–11512 RSC.
- M. Kraska, B. Kuttich and B. Stühn, in Bottom-Up Self-Organization in Supramolecular Soft Matter, ed. S. C. Müller and J. Parisi, Springer International Publishing, 2015, vol. 217, pp. 11–64 Search PubMed.
- A. Weber and B. Stühn, J. Chem. Phys., 2016, 144, 144903 CrossRef PubMed.
- W. Helfrich, Zeitschrift für Naturforschung. Teil C: Biochemie, Biophysik, Biologie, Virologie, 1973, 28, 693–703 CAS.
- P. G. D. Gennes and C. Taupin, J. Phys. Chem., 1982, 86, 2294–2304 CrossRef.
- L.-M. Wang, F. He and R. Richert, Phys. Rev. Lett., 2004, 92, 095701 CrossRef PubMed.
- T. Blochowicz, E. Gouirand, A. Fricke, T. Spehr, B. Stühn and B. Frick, Chem. Phys. Lett., 2009, 475, 171–174 CrossRef CAS.
- S. Shipovskov, C. L. P. Oliveira, S. V. Hoffmann, L. Schauser, D. S. Sutherland, F. Besenbacher and J. S. Pedersen, ChemPhysChem, 2012, 13, 3179–3184 CrossRef CAS PubMed.
- R. Wipf, S. Jaksch and B. Stühn, Colloid Polym. Sci., 2010, 288, 589–601 CAS.
- M. Appel, T. Spehr, R. Wipf, C. Moers, H. Frey and B. Stühn, J. Chem. Phys., 2013, 139, 184903 CrossRef PubMed.
- M. Laguës, J. Phys., Lett., 1979, 40, 331–333 CrossRef.
- S. Geiger, H. F. Eicke and D. Spielmann, Zeitschrift für Physik B Condensed Matter, 1987, 68, 175–179 CrossRef CAS.
- B. Kuttich, P. Falus, I. Grillo and B. Stühn, J. Chem. Phys., 2014, 141, 084903 CrossRef CAS PubMed.
- W. Meier, Langmuir, 1996, 12, 1188–1192 CrossRef CAS.
- G. Gompper and D. M. Kroll, Statistical Mechanics of Membranes and Surfaces, World Scientific Publishing Co. Pte. Ltd., 2004, ch. Triangulatated-Surface Models of Flutctuating membranes, pp. 359–421 Search PubMed.
- B. Farago, D. Richter, J. S. Huang, S. A. Safran and S. T. Milner, Phys. Rev. Lett., 1990, 65, 3348–3351 CrossRef CAS PubMed.
- T. Spehr, B. Frick, I. Grillo, P. Falus, M. Müller and B. Stühn, Phys. Rev. E: Stat., Nonlinear, Soft Matter Phys., 2009, 79, 031404 CrossRef PubMed.
- M. van Dijk, J. Joosten, Y. Levine and D. Bedeaux, J. Phys. Chem., 1989, 93, 2506–2512 CrossRef CAS.
- Q. Ying and B. Chu, Macromolecules, 1987, 20, 362–366 CrossRef CAS.
- H. Wagner and R. Richert, J. Phys. Chem. B, 1999, 103, 4071–4077 CrossRef CAS.
- G. R. Strobl, Acta Crystallogr., Sect. A: Cryst. Phys., Diffr., Theor. Gen. Crystallogr., 1970, 26, 367–375 CrossRef.
- A. Guinier, X-Ray Diffraction In Crystals, Imperfect Crystals and Amorphous Bodies, Dover Publications, 1987 Search PubMed.
- N. W. Ashcroft and J. Lekner, Phys. Rev., 1966, 145, 83–90 CrossRef CAS.
- D. I. Svergun, P. V. Konarev, V. V. Volkov, M. H. J. Koch, W. F. C. Sager, J. Smeets and E. M. Blokhuis, J. Chem. Phys., 2000, 113, 1651–1665 CrossRef CAS.
- M. Müller, B. Stühn, K. Busse and J. Kressler, J. Colloid Interface Sci., 2009, 335, 228–233 CrossRef PubMed.
- M. Kotlarchyk, S. H. Chen, J. S. Huang and M. W. Kim, Phys. Rev. A: At., Mol., Opt. Phys., 1984, 29, 2054–2069 CrossRef CAS.
- J. S. Huang and M. W. Kim, Phys. Rev. Lett., 1981, 47, 1462–1465 CrossRef CAS.
- T. Fließbach, Statistische Physik, Spketrum Akademischer Verlag GmbH, 1999 Search PubMed.
- H. F. Eicke, M. Borkovec and B. Das-Gupta, J. Phys. Chem., 1989, 93, 314–317 CrossRef CAS.
- N. Kallay and A. Chittofrati, J. Phys. Chem., 1990, 94, 4755–4756 CrossRef CAS.
- G. S. Grest, I. Webman, S. A. Safran and A. L. R. Bug, Phys. Rev. A: At., Mol., Opt. Phys., 1986, 33, 2842–2845 CrossRef CAS.
- M. Borkovec, H.-F. Eicke, H. Hammerich and B. D. Gupta, J. Phys. Chem., 1988, 92, 206–211 CrossRef CAS.
- D. Stauffer and A. Aharony, Introduction To Percolation Theory, Crc Pr Inc, 1994 Search PubMed.
- G. Gompper and D. M. Kroll, J. Phys. I, 1996, 6, 1305–1320 CrossRef.
- G. Ahlers, in Pattern Formation in Liquid Crystals, ed. A. Buka and L. Kramer, Springer New York, 1996, pp. 165–220 Search PubMed.
- G. W. Smith, G. M. Ventouris and J. L. West, Mol. Cryst. Liq. Cryst. Sci. Technol., Sect. A, 1992, 213, 11–30 CrossRef CAS.
- D. Schübel, O. D. Bedford, G. Ilgenfritz, J. Eastoe and R. K. Heenan, Phys. Chem. Chem. Phys., 1999, 1, 2521–2525 RSC.
- P. Ekwall, L. Mandell and K. Fontell, J. Colloid Interface Sci., 1970, 33, 215–235 CrossRef CAS.
- K. Fontell, J. Colloid Interface Sci., 1973, 44, 318–329 CrossRef CAS.
- H.-F. Eicke and J. Rehak, Helv. Chim. Acta, 1976, 59, 2883–2891 CrossRef CAS.
- A. Maitra, J. Phys. Chem., 1984, 88, 5122–5125 CrossRef CAS.
- S.-H. Chen, S.-L. Chang and R. Strey, J. Chem. Phys., 1990, 93, 1907–1918 CrossRef CAS.
- Z. X. Li, J. R. Lu, R. K. Thomas and J. Penfold, Trends in Colloid and Interface Science IX, Steinkopff, 1995, vol. 98, pp. 243–247 Search PubMed.
- M. Kotlarchyk, S. H. Chen and J. S. Huang, J. Phys. Chem., 1982, 86, 3273–3276 CrossRef CAS.
- E. Y. Sheu, S.-H. Chen, J. S. Huang and J. C. Sung, Phys. Rev. A: At., Mol., Opt. Phys., 1989, 39, 5867–5876 CrossRef CAS.
- D. F. Evans and H. Wennerström, The Colloidal Domain, Wiley-VCH, 1999, ch. Micro- and Macroemulsions, pp. 548–561 Search PubMed.
- Y. Kawabata, H. Seto, M. Nagao and T. Takeda, J. Chem. Phys., 2007, 127, 044705 CrossRef PubMed.
- K. Devanand and J. C. Selser, Macromolecules, 1991, 24, 5943–5947 CrossRef CAS.
- S. Kawaguchi, G. Imai, J. Suzuki, A. Miyahara, T. Kitano and K. Ito, Polymer, 1997, 38, 2885–2891 CrossRef CAS.
- A. Eliassi, H. Modarress and G. A. Mansoori, J. Chem. Eng. Data, 1998, 43, 719–721 CrossRef CAS.
- P. G. D. Gennes, J. Phys. Chem., 1990, 94, 8407–8413 CrossRef.
- B. Hammouda, D. Ho and S. Kline, Macromolecules, 2002, 35, 8578–8585 CrossRef.
- R. Aschauer and D. Beysens, Phys. Rev. E: Stat. Phys., Plasmas, Fluids, Relat. Interdiscip. Top., 1993, 47, 1850–1855 CrossRef CAS.
- S. K. Mehta and S. Sharma, J. Colloid Interface Sci., 2006, 296, 690–699 CrossRef CAS PubMed.
- J. S. Huang, S. T. Milner, B. Farago and D. Richter, Phys. Rev. Lett., 1987, 59, 2600–2603 CrossRef CAS PubMed.
- B. P. Binks, J. Meunier, O. Abillon and D. Langevin, Langmuir, 1989, 5, 415–421 CrossRef CAS.
- E. van der Linden, S. Geiger and D. Bedeaux, Phys. A, 1989, 156, 130–143 CrossRef CAS.
| This journal is © The Royal Society of Chemistry 2016 |

