 Open Access Article
Creative Commons Attribution 3.0 Unported Licence
Soft-mode of charged chiral fibrous viruses (fd)†
Kyongok
Kang
Forschungszentrum Juelich, ICS-3, Soft Condensed Matter, Juelich, 52425, Germany. E-mail: k.kang@fz-juelich.de; Web: http://www.fz-juelich.de/SharedDocs/Personen/ICS/ICS-3/EN/Kang_K.html?nn=543650
First published on 29th June 2016
Abstract
The frictional forces in suspensions vary depending on the size, shape, and the surface of the particles, which are either charged or neutral. For anisotropic particles with no spatial gradient in the order parameter under external parameters, they exhibit either a continuous phase transition or “freezing” of the order parameter fluctuation. They are known as the collective soft-mode, which has a finite cutoff dispersion where the relaxation time diverges. From microscopic dynamics of charged chiral fd-viruses, the soft-mode is revealed with a rotation restoring “twist”, obtained from both polarized (VV) and depolarized (VH) small angle dynamic light scattering. Here, I have found the minimum spatial coherence length at a lower I–N binodal concentration, which is due to the reverse of electrostatic repulsive forces with an increase in the concentration of charged chiral rods.
I. Introduction
The control of orientational domains of ionic impurities and inhomogeneous charged groups of particles under a depolarized field is important to improve the switching efficiency of surface stabilized ferroelectric displays and functional panels.1 Random motions of mobile charged particles and condensed ion-polarizations are expected to occur on a small scale, however, they are not negligible in the fluctuations of the collective behavior of local director fields. Dynamic light scattering is a well-used method to measure the collective motions of particles, where anisotropic macromolecules can be further distinguished by the parallel and perpendicular translations diffusion, as well as the rotational diffusion.2 In the presence of ionic impurities with a polar type of ferroelectric liquid crystal,1 the electrostatic (Coulomb) interaction is apparent between mobile ions and the director field. Recently, a delicate difference between the self-organization of “condensed” and “uncondensed” F-actin bundles was discussed using the counterion density waves due to multivalent ion concentrations relating to the twist distortion of the F-actin helix,3 which is also interesting for the charged chiral rods system. Brownian dynamics (BD) simulations show a slight deviation between the stiff and flexible chains with- and without-hydrodynamics in the intermediate range of the scattering wavevector, in DNA fragments,4 and in coil–globule transitions of DNA molecules by a cationic surfactant.5 In the case of charged particles, cumbersome interactions occur due to either ion specificity or space charges that can form during a change in the configurational entropy, shown by electrophoretic light scattering,6 and non-zero mobility variances in the heterodyne correlation functions.7Interestingly, the repulsive forces between charged colloids with an electrostatic interaction of ions have been shown for salt-free polyelectrolytes with a minimum value of the effective diffusion coefficient.8 Statistical models of the density and charge fluctuations are considered in two limiting cases: either dense ionized matter with small wavevector dependence low frequency spectrums,9 or the elastic moduli in simple fluids for a long-wavelength limit.10 Although the coupled translational–rotational diffusion is discussed for optically anisotropic biological molecules,11,12 such as the TMV virus,13–15 collagen,16,17 and filamentous viruses (Pf1, M13, and potato virus X),18,19 there is not yet any experimental realization of the coupling with a high concentration of charged rods.
In this work, the system chosen is crowded suspensions of charged fibrous viruses (fd) at a low ionic strength (0.032 mM salt), where deformations of the thick electric double layers are present. The ionic properties of filamentous bacteriophage fd were established by Zimmermann et al.,20 where the surface charge of the fd-virus was determined by a polyelectrolyte titration, as the isoelectric point with a pH-value of 4.2. Also, the number of ionizable residues (of carboxylated and amide groups)21 coated in bacteriophage fd protein and their pKa values are provided in the table in ref. 20. The rotational diffusion of the fd-virus suspensions for various ionic strengths was tested by the rheological properties at dilute and intermediate fd-concentrations,22 and is related to the intrinsic viscosity of flexible rod-like (cylindrical or ellipsoidal) macromolecular solutions. The rotational diffusion is expected to be rather hindered by an increase in the fd-concentration, for the two extreme cases of salt-free and high ionic strength.23 So far, the structure and dynamics of suspensions of charged rod-like particles have been shown in a “diluted” isotropic phase, by means of dynamical mean-field theory and Monte Carlo simulations.23,24 The pair-distribution of charged fd-rods is then estimated by a depolarized structure factor for rods with different rod lengths, and Monte Carlo simulations.25 However, there is not yet any direct evidence for dynamical modes of charged fd-rods, with an increase in fd-concentration at a low ionic strength.
In equilibrium, when the system exhibits a critical slowing-down behavior, on approaching a phase transition, the fluctuations in the order parameter lead to a collective soft-mode that is shown with a finite cutoff wavevector in the dispersion relation. This is related to the thermodynamic potential, where the kinetic coefficients are engaged with the inverse of the viscosity.26 Another feature of equilibrium behavior is the enhanced order parameter with the spatial coherence length. The aim of this paper is to discuss the collective microdynamics of these highly charged fd-rods, by means of small angle dynamic light scattering (in the wavevector range of 1–8 μm−1). The spatial coherence length is then obtained from the soft-mode, which gives different cutoff wavevectors for a given fd-concentration. The change in coherence length is estimated by the collective microdyanmics of the charged chiral fd-viruses.
This paper is organized as follows: Section II gives the brief background theory and experimental details for the collective dynamics, where small angle dynamic light scattering is performed for given fd-concentrations. With a well-controlled ionic strength (of 0.032 mM salt buffer solution), the rod concentration means that it is crowded enough to form several phase transitions: isotropic–nematic (I–N) coexistence, a chiral-nematic phase, and hierarchical chiral mesophases. Not only are qualitatively different dispersion relations observed, but also collective soft-modes are exhibited for both polarized (VV-mode) and depolarized (VH-mode) light scattering. The sections from III to VI report the relaxation behaviors in the dispersion relations, obtained from the dynamic light scattering correlation functions, with an increase in concentration. Finally, the concentration-dependent coherence length with a continuous rotation restoring “twist” effect is provided in Section VII, followed by a conclusion and discussion.
II. Background theory and experimental details
A. The system: charged chiral fd-viruses
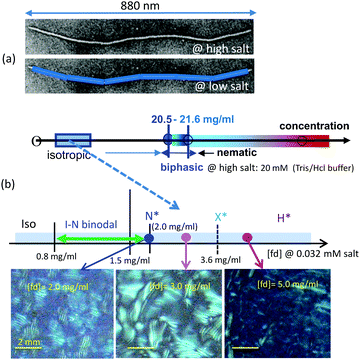
Highly charged fibrous virus (fd) suspensions at a low ionic strength are used as a model system for thick charged rods, where dissociation of condensed ions are released to the bulk salt solution, resulting in an increase in the effective diameter, and forming a long electric Debye screening length.27 By increasing the fd-concentration, the system undergoes an isotropic–nematic transition, as well as the formation of orientational textures in chiral-nematic phases, before the structural arrest is reached at the glass transition concentration.28 Since fd-virus particles carry a sufficient amount of negatively charged groups on the thin condensed counterion layer, the electrostatic Debye length is tuned by changing the ionic strength of the buffer solution. There are competing interactions between the electrostatics and hydrodynamic interactions, such that, above the ionic strength of 1 mM salt solution, thin electric double layers are present, in which screened hydrodynamics are valid,27 however, below the ionic strength of 1 mM, a relatively longer Debye length is present compared to the bare diameter of the fd-virus (6.8 nm). Then, the electrostatic polarization becomes responsive to the external deformation of thick electric double layers. The current work is done at a low ionic strength of 0.032 mM salt, where the Debye length of the fd-virus is about 54 nm, 7 times larger than the bare diameter, and the length of the fd-virus is 880 nm. Thus it gives a reduced aspect ratio of 16, as shown in Fig. 1a. The locations of the binodals and spinodals depend on both the Debye screening length and the effective number of surface charges.29 The experimental binodal concentrations are 0.8 ± 0.2 and 1.5 ± 0.4 mg ml−1 for the 0.032 mM buffer. The lower binodal concentrations are in very good agreement, while the experimental upper I–N binodal concentration is slightly higher than the theoretically predicted value. The interest is then what types of collective microdynamics exist for interacting charged fd-rods, by entering isotropic–nematic binodals, and chiral-nematic phase concentrations. Fig. 1b shows the concentration diagram extending above I–N coexistence and up to hierarchical chiral mesophases, with depolarized optical morphologies.B. Free energy description of an excluded volume effect and order parameter
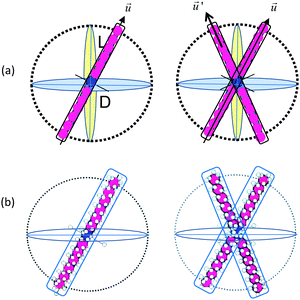
In concentrated suspensions of rod-like colloids or polymers, an excluded volume is convenient to facilitate the free energy for a given orientational distribution function, with the sum of all contributing interactions. In order to use the free energy description, a few basic assumptions are needed, as follows: (i) first, a mean-field approach is considered, such that the dynamics of a single particle present the whole motion of the thermal ensemble averages of the system, (ii) the probability to find an orientation in space is the Boltzmann distribution function relating to an interaction energy versus thermal energy, and (iii) there is also a “spontaneous” aligning effect due to an anisotropic shape above a certain high concentration in the absence of an external field. Thus, different kinetics of the order parameter are expected to occur depending on the volume fractions or effective volumes, as isotropic, isotropic–nematic coexistence (I–N binodals), and chiral-nematic phases. Fig. 2 shows a sketch of the possible configuration of an effective volume effect for a hard-rod (in Fig. 2(a)) and a charged rod (in Fig. 2(b)), where two rods, indicating a higher concentration, with pair-wise interactions play a role to some degree in the twist elastic deformation of the angular distributions between interacting rods. Then, whether or not there will be any different rotational frictions of charged rods, compared to hard-core rods, would be an interesting topic. If the orientational distribution function is , where the interaction energy of the particles i and j is u(i,j), and the Boltzmann factor is β = 1/kBT, then the free energy is proportional to the logarithmic function of a partition function Ψ,
 | (1) |
| Sα,β(t) = 〈nαnβ − 1/3δαβ〉 = Seq(nαnβ − 1/3δαβ). | (2) |
 | (3) |
 | (4) |
 | (5) |
deff = κ−1[ln![[thin space (1/6-em)]](https://www.rsc.org/images/entities/char_2009.gif) KQ + γE], KQ + γE], | (6) |
 | (7) |
 | (8) |
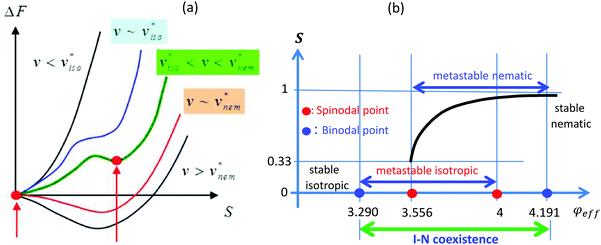
The detailed location of a lower I–N binodal concentration, including the twist effect, can be obtained from the corresponding dimensionless concentration of (L/d)φ = 3.290…, as predicted by Onsager.33,34 A brief scheme of the I–N binodal and spinodal points are depicted in Fig. 3b. This relies on the fact that the charge–charge interactions as well as the twist effect have the same functional dependence on the orientational order parameter tensor in the equation of motion (3). The lower binodal concentration is set by:
 | (9) |
The same procedure can be used to obtain the location of an upper I–N binodal and two spinodal concentrations. The Onsager value of (L/d)φ for the upper binodal is 4.191, as shown in Fig. 3b. The typical steady-state viscosity increases in the isotopic phase, but it decreases in the nematic phase,30,35 as expressed by η = vkBT/6Dr{((1 − S)2(1 + 2S)(1 + 3S/2))/((1 + S/2)2)}, which shows the direct relation of the order parameter and rotational diffusion constant, such that the rotational torque is related to the stationary intrinsic viscosity that is the resulting order parameter kinetics.36 Here, the rotational diffusion constant Dr is assumed to be a complete segment rotation of the rod length.37 The total free energy is then described by the sum of all the different contributions of the director field, ion impurities, and the charge core interactions, as well as the coupled ones with these terms. In the case of strong charge core interactions, the director field is equally important, and the contributions of ion impurities can be “instantaneously” enslaved by the director field exhibited in the thermal fluctuations, which are measurable by dynamic light scattering (DLS). Thus, random-phase approximation (RPA) is useful for exploring the intermolecular interactions for the effect of an excluded volume in the DLS of charged rods.38,39 The collective dynamics of director fluctuations are then further distinguished by the mobilities of ion impurities, relating to the rotational viscosity. The director fluctuations of the nematic phase can then be predicted by the superpositions of symmetry restoring variables in long-range hydrodynamics, as shown with the divergence of susceptibility.40
C. Collective soft-mode of the relaxation behaviors
The rotational diffusion and intrinsic viscosity for rod-like macromolecules are influenced by the hydrodynamics,2 and therefore for charged colloids, the electro-viscous forces may play an additional role in the elastic deformation of a squeezing flow, as shown by the Derjaguin approximation.41 In particular, coupling of the rotational and translational motions is seen for anisotropic particles with low frequency VH light scattering,42 with the explicit expression for the VV–VH-scattering intensities.43 This can also be observed for biological substances, such as motile microorganisms,44E. coli bacteria,45 and lysozyme.46 Depending on the aspect ratio of the rods, the dynamic structure factor is estimated by the form factor of the rods.47 An example of a dynamic structure factor is reported for living particle motions (of motile or swimming) due to the motility versus “resting” microorganism studied in the scattering spectra,44 but the velocity distribution of these living particles is not a simple Gaussian function. With an increase in the concentration of the rods, the strength of the intermolecular interactions and different mutual diffusion constants exist in the friction coefficients.48 Thus, for a collective motion of a homogenous and modulated structure, the system is set by a time-fluctuating spectrum of an order parameter that “freezes” at a finite wavevector by showing critical slowing down behaviors such that the relaxation rate becomes zero (Γ = 1/τ = 0) and the time of relaxation diverges (τ = ∞) at a wavelength at q = qc = 2π/ξ.1 One example is the Sm-A–Sm-C* transition of the thermotropic system of a chiral smectic system, where there will be a collective mode: continuous symmetry breaking exists in the chiral Sm-C* phase, while the symmetry restoring (so-called Goldstone) mode occurs to restore the broken symmetry in the Sm-A phase.1,26 The spatial coherence length, ξ, is then the characteristic measure of the collective soft-mode, depicted by the so-called 2nd order phase transitions. However, no soft-mode has yet been explored in the lyotropic system, where the external parameter can be replaced by the critical concentration instead of a critical temperature. Also, the kinetic process in the vicinity of a phase transition will be related to the inverse of the viscosity of the system. The direct way to investigate the propagation of an order parameter is to measure the relaxation rates (or a damping constant) as a function of the wavevector for various concentrations, such that the cutoff wavevector can be estimated with different phase-boundaries.D. Method: small angle scattered intensities and correlation functions of polarized (VV) and depolarized (VH) dynamic light scattering
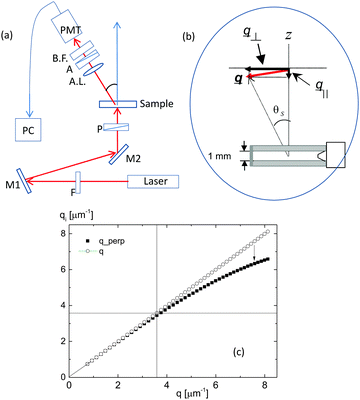
The structure of small particles can be explored by either scattered light intensities49 or real-space small angle light scattering for the particle arrangements,50,51 where the optical contrast is varied with the shape of the scatterers. In this experiment, the range of the scattering angle is small, comparable to the length of a charged rod (1–8 μm−1), and the preferred directions of alignment occur in the crowded concentrations, with persisting orientational motions of the charged fd-rods. Home-made small angle vertical dynamic light scattering is used to determine the collective microscopic dynamics of many interacting charged chiral fd-rods, at a low ionic strength (0.032 mM salt).Fig. 4a is a simple scheme of the small angle dynamic light scattering setup,52 where the incident laser beam is vertically mounted to facilitate the horizontally round quartz cylindrical cell, in Fig. 4b, with the scattering geometry: a 35 mW He–Ne laser (JDS Uniphase Model 1145P series, 633 nm wavelength), which is used as an incident light perpendicular to the cell. Two mirrors are used to align the incident laser beam from the bottom to top direction. A rotation stage (NanoRotator, Melles Griot) is used as a goniometer, which is controlled by a software stepper motor controller (advanced positioning technology by Melles Griot 17BSC002). To achieve vertical alignment of the incident laser beam, we have used two pinholes and a photon detector on an optical rail. The scattered light is then collected through an optical fiber that is connected to an avalanche photo diode detector. We use an ALV-5000/EPP multiple tau digital real time correlator (by ALV-GmbH, Langen, Germany), which computes photon correlation functions with a linear time-step distribution with time lags between 0.125 μs and 2147 s. The optical fiber is placed on an arm that is connected to the goniometer. An essential element of this vertical DLS is the achromatic lens (with a focal length of 75 mm), which is placed on the detection side to ensure that the scattering volume that is probed is well within the bulk of the sample. Without this lens, it turned out that the measured correlation functions exhibit a spurious long-time relaxation.
The incident beam is straight up to the 1 mm thick sample cuvette, and the detector photomultiplier (PMT) collects the scattered laser light intensity by varying the goniometer angle between 5 and 50° (with a scattering wavevector range of 1–8 μm−1). Then, the scattering wavevector can be decomposed either perpendicular or parallel to the incident beam. When the scattering angle is small, the perpendicular component of the scattering wavevector is dominant below the wavevector of q ∼ 3.6 μm−1 (i.e. the scattering angle of 20–22°), as shown by the comparison to the total wavevector depicted in Fig. 4c. However, at higher wavevectors, the perpendicular component itself deviates from the total scattering wavevector due to a slight contribution from the parallel component of the wavevector.
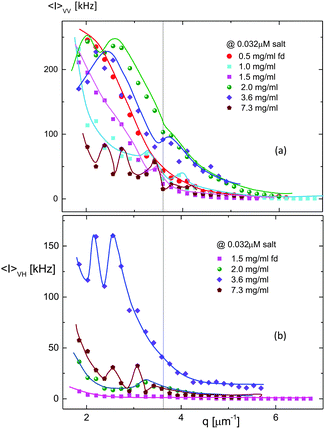
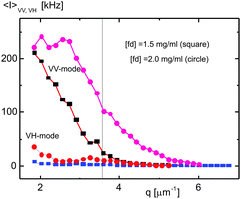
Prior to the details, the overall measured scattered intensities of the polarized light (VV-mode) are shown in Fig. 5a, as a function of fd-concentration, as well as the depolarized light scattering intensities (VH-mode) in Fig. 5b. The black vertical line indicates the wavevector of q ∼ 3.6 μm−1, which distinguishes between the perpendicular (below the value) and parallel component. Very complicated scattered intensity distributions are shown for both the VV- and VH-modes below the q-value, the perpendicular components, at a low ionic strength (0.032 mM). Within the lower wavevector limit, interestingly, different features of the scattered intensities are seen. In VV-mode, for an isotropic-phase (0.5 mg ml−1), a standard scattered intensity distribution is shown, however, with an increase in the concentration (in the isotropic–nematic coexistence concentration range of 1.0–1.5 mg ml−1), the distribution changes, and eventually two pronounced intensity peaks are shown for the chiral-nematic phase (concentration of 2.0 mg ml−1). Thus, this concentration can be remarked as approaching the chiral-nematic phase, and whether there will be a concentration-dependent form factor relating the nematic–chiral-nematic state would then be left as an open question. Also, a pronounced VH-mode is shown at a concentration above the isotropic–nematic coexistence concentration, and the highest scattered intensity distributions are shown with two pronounced peaks above the chiral-nematic phase (3.6 mg ml−1), which suggests that more rotational motions are probable.
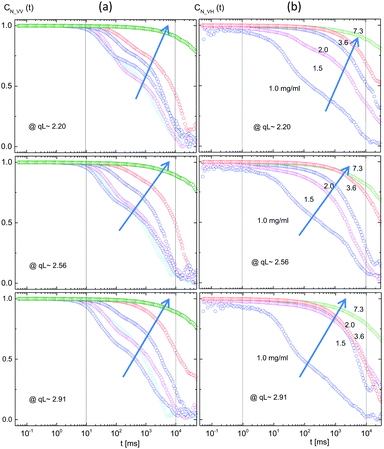
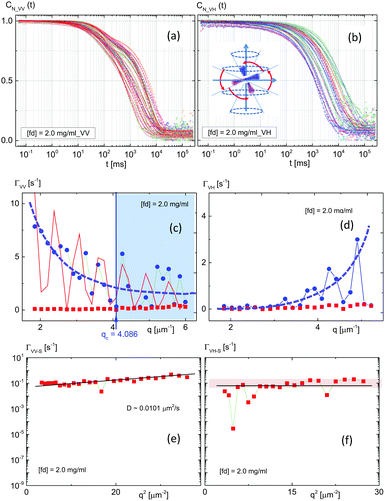
Normalized intensity–intensity autocorrelation functions are provided in Fig. 6 for a few low finite wavelengths that are comparable to the inverse of the persistence length of the fd-virus particle (2.2–2.8 μm−1): first of all, regardless of the various concentrations, two dynamical modes are evident in the measured intensity autocorrelation functions for both VV-mode (Fig. 6a) and VH-mode (Fig. 6b). Rather complicated decays in the depolarized VH-mode indicate the intra-particle interactions due to the interactions of the order parameter coupled to the concentration.
The rather complicated decay functions of the depolarized (VH) dynamic light scattering, measured at the wavelength corresponding to the persistence length of the fd-virus particles (2.20 μm−1 < qL < 2.91 μm−1), are very stretched at the concentration of 1.0 mg ml−1, in Fig. 6b. This indicates either polydispersity or coupled motions of rotations and translations. From the current measurements of the phase-diagram at this low ionic strength (32 μM salt), 0.8–1.5 mg ml−1 is isotropic–nematic coexistence, and above 1.5 mg ml−1, there is a chiral-nematic phase. The difference between the nematic- and chiral-nematic turned out to be the flow kinetics, where nematic-flow is much (∼100 times) faster than the chiral-nematic phase. This is the reason why the VH-correlations slow down enormously above 1.5 mg ml−1 in Fig. 6b.
The fits of these correlation functions are provided with the fast- and slow-dynamical mode in the following sections (III–VI): the appearance of a slow decay mode is a feature of the coupling of rotational and translational anisotropic diffusions,39 resulting from a deviation from the perfect rigid-rod model, similar to that observed in higher concentrations of PBLG solution.53 Another aspect of a slow-mode is the cooperative motion relating to charge dissociation/association for charged fd-rods (at a low ionic strength). When the system has strong interactions between neighboring charged rods, the electrostatic interaction is presented with an effective diameter of a rod that varies with salt concentration, via the Debye length, as well as the virial expansion relating to the Donnan membrane equilibrium.54 Although the effect of ionic strength on short-DNA rods and diluted suspensions of fd-rods has been tested by quasi-elastic light scattering before,55–57 this is the first time that collective microscopic dynamics of charged chiral fd-rods have been observed in crowded systems, revealing a delicate electrostatic interaction between short-range attraction and long-range repulsion.
III. Relaxation behaviors of an isotropic phase
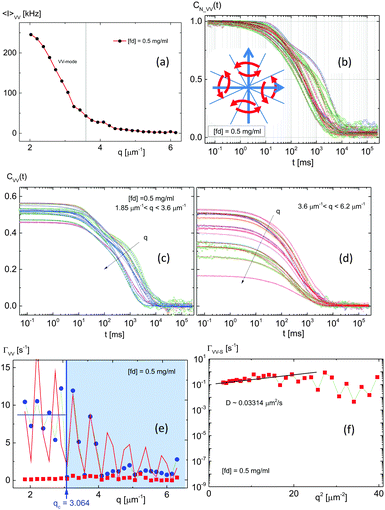
When the concentration is low, i.e. in the isotropic phase, the orientational order is random with no preferred direction in the averaged director field. The scattered intensity of the VV-polarized light in Fig. 7a is shown as a function of the wavevector, and is the expected distribution for rod-shaped macromolecules. Note that, here, a relatively shorter range of the wavevector (1–8 μm−1) is probed compared to the wavevector of the Konstanz group (10–30 μm−1).58 Only a VV-polarized light intensity signal is observed with raw intensity autocorrelation functions in Fig. 7c and d, for the relaxation behaviors of an isotropic phase. The arrows indicate an increase in the wavevector, below q ∼ 3.6 μm−1 and above q ∼ 3.6 μm−1. At very low wavevectors, two dynamical modes are visible with amplitudes, while the slow-mode is not pronounced with an increase in the wavevector. In the normalized correlation functions in Fig. 7b, the lines are fitted with two dynamical modes: one is the fast-mode that is related to the parallel direction to the rod, and the other is slow-mode due to the perpendicular direction of the thermal fluctuations. The empirical fitting function is used as g2(t) − 1 = B + Af![[thin space (1/6-em)]](https://www.rsc.org/images/entities/char_2009.gif) exp(−2Γft) + As
exp(−2Γft) + As![[thin space (1/6-em)]](https://www.rsc.org/images/entities/char_2009.gif) exp(−2(Γst)β), where Γ, A, and B are the relaxation rate (or a damping constant), amplitude, and background, respectively.
exp(−2(Γst)β), where Γ, A, and B are the relaxation rate (or a damping constant), amplitude, and background, respectively.
The stretching exponents are found to be 0.5 < β < 1 for extended long time tails in the correlation functions. The inset in Fig. 7b shows a brief illustration of the possible configuration of two interacting charged fd-rods in the isotropic phase, where the two blue orthogonal arrows indicate translational motions in parallel and perpendicular directions, while the red curves are for random orientations that are equally probable between two orthogonal axes. From the fits, dispersion relations of an isotropic concentration are obtained in Fig. 7e, for both fast- and slow-modes, as blue and red data points, respectively. There is a sudden drop in the relaxation rate, ΓVV, for the fast-mode (blue data) in the dispersion relations of an isotropic concentration, seen as the cutoff wavevector of qc = 3.064 μm−1 in Fig. 7e. This is an indication of the soft-mode, regardless of the local peaks in the small wavevector. In order to implement the damping motion of a fast-mode in VV-scattering, a rough estimation of damping is depicted as 50[cos(6q − 0.25π)]2e−0.45q, as shown by the red line in the fast-mode of Fig. 7e. Note, here, two independent processes are related: one is the cosine oscillating part with an amplitude and the other is an exponential decay. The reason for a decrease in the relaxation rates in the fast-mode of an isotropic phase is due to the fact that there is no preferred director orientation, with symmetric scatters in the thermal fluctuations. The hindered motion of mobile ions is somewhat probable in the fast-mode thermal fluctuation parallel to an increase in the wavevector. However, thermal fluctuations at higher wavevectors are overdamped, which also opens the discussion on the linear stability of the migration of ions in the electrolyte solution, as shown by the shape of the scattered intensity at low wavevectors in Fig. 5. It is probable that non-zero off diagonal diffusion coefficients, due to migration of ionic particles,59 may be relevant to the charged fd-rods that are surrounded by thick electric double layers of mobile ions. Thermal fluctuations of the slow-mode, even in the parallel component, have much smaller relaxation rates of the perpendicular motions, as shown by the logarithmic scale of the square of the wavevector in Fig. 7f. The slope of the dispersion relation gives a rough estimation of the diffusion constant of a slow-mode: D = Γ/q2, which is far (∼100 times) slower than the colloidal diffusion at low wavevectors. Although it is rather noisy, the relaxation becomes flattened at higher wavevectors. The overall possible decrease in the relaxation rate is due to the electro-viscous friction that engages with a static value of intrinsic viscosity, decreasing with a logarithmic function of an aspect ratio,36 so that the rotational diffusion is predicted to be highly influenced by a large aspect ratio. The interpretation of the slow-mode will be dealt with separately, due to an increase in the interaction with an increase in the fd-concentration, in the following sections.
IV. Relaxation behaviors of isotropic–nematic binodal phases
With an increase in the concentration of charged fd-rods, the nematic phase can coexist with an isotropic phase, i.e. isotropic–nematic (I–N) coexistence, as I–N binodals, as seen in Fig. 1 and 3b. The theoretically predicted I–N coexistence concentration region is 0.66 < [fd] < 0.84 mg ml−1 and the experimental I–N binodal concentrations are 0.8 ± 0.2 and 1.5 ± 0.4 mg ml−1 for the ionic strength of 0.032 mM buffer.29A. Relaxation behaviors of a lower I–N binodal phase (1.0 mg ml−1)
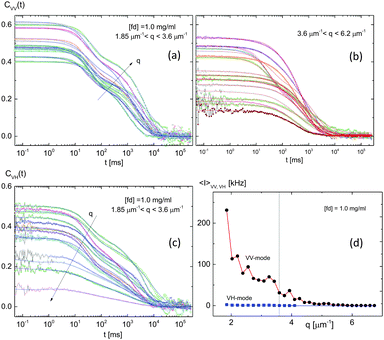
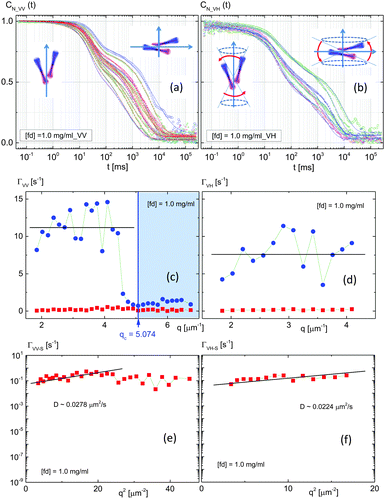
When the concentration is higher than the isotropic phase, by entering a lower I–N binodal concentration (1.0 mg ml−1), as shown in Fig. 8c and d, a vivid VH-signal is detected systematically, resulting in VH-correlation functions only at limited values of lower wavevectors. The signal to noise ratio (or the field amplitude) of the VH-scattering is decreased by an increase of a wavevector, and a stronger stretched slow-mode is shown in VH-scattering (indicated by the arrow in Fig. 8c). The VV- and VH-correlation functions of the lower wavevectors are shown in Fig. 8a and c, respectively. Similar to the isotropic phase in the earlier section, evidently a higher amplitude of the visible two modes is extended to somewhat larger wavevectors. This means that more perpendicular thermal fluctuations are available than that of the isotropic phase (see the few VV-correlation functions in Fig. 8b). The normalized correlation functions for both VV- and VH-scattering are shown in Fig. 9a and b, where the possible configurations of two interacting charged fd-rods are illustrated in the inset of the figures: translational motions of parallel (in the faster time window) and perpendicular (in the slower time window) alignments are shown in Fig. 9a, while the rotational motions are shown as red curves in the inset of Fig. 9b for VH-scattering. The solid lines are the fits with a fitting function of two dynamical modes; here the fast-mode is related to the fluctuations in the parallel direction to the director, and the slow-mode is for the perpendicular direction of the alignment.The corresponding relaxation rates are plotted as a function of the wavevector in Fig. 9c for the VV-correlations, where a cutoff wavevector at qc = 5.074 μm−1 is indicated, as the relaxation rate becomes zero in the fast-mode of VV-light scattering. The relaxation rates for VH-correlations are provided in Fig. 9d. The slow-modes for both VV- and VH-correlations are shown in Fig. 9e and f, respectively. The diffusion constants were found only for the slow-modes, D = 0.0278 μm2 s−1 and D = 0.0224 μm2 s−1 for VV- and VH-scattering, which are lower than that of the isotropic phase (D = 0.03314 μm2 s−1). There is an averaged non-zero intercept value for the rotational diffusion of 10/6 ∼ 1.7 s−1 (in VH-mode), which is lower than the rotational diffusion constant (10 s−1) at a high ionic strength.22
B. Relaxation behaviors of an upper I–N binodal phase (1.5 mg ml−1)
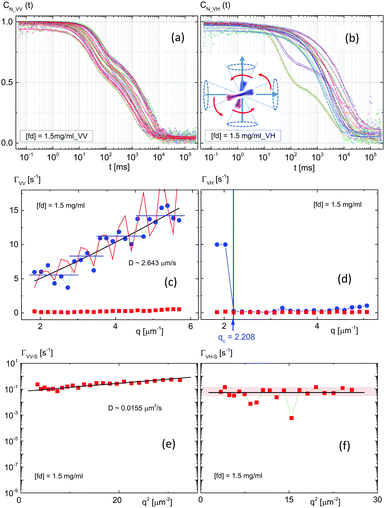
For an upper I–N binodal concentration (1.5 mg ml−1), the intensity correlation functions and normalized correlation functions are shown in Fig. 10 and 11a, b, respectively. Two dynamical modes are visible at higher wavevector VV-correlations, and are somewhat more stretched in the slow-mode of Fig. 10b, with a wider q-range in VV-mode than a lower binodal concentration. The VH-correlation functions not only show a severe change in amplitude at lower wavevectors, Fig. 10c, but this also extends to higher wavevectors in Fig. 10d. However, the fast-mode is relatively limited at the lower q-range in VH-mode. The inset in Fig. 11b for normalized correlation illustrates a possible configuration for both rotation and translation in VH-mode with some degree of rotations. The uniqueness of a dispersion relation for this upper I–N binodal concentration is the appearance of a series of discontinuous jump states with an increase in the relaxation rate (Fig. 11c) in the fast-mode of VV-scattering. Also, the red line for the fast-mode in VV-scattering (Fig. 11c) presents the damping motion of [cos(6q)]2e0.45q + 2q: here, the additional term of 2q is added to the damping motions, with a small step of increasing the shifting wavevector. On the contrary, in VH-scattering, a soft-mode exists at a cutoff wavevector of qc = 2.208 μm−1 in Fig. 11d, suggesting that the overdamped motions are present in the depolarized VH-scattering, but not polarized VV-scattering at an upper I–N binodal concentration, which is evidently a different relaxation behavior compared to that of a lower I–N binodal concentration (see Fig. 9c and d). The dispersion relation of the VV-mode is then averaged as the linear in a wavevector, Fig. 11c, indicating that a slightly ordered phase is found in the diffusive motion, as expected with an anisotropic diffusion constant: the system has indeed shown a reasonable diffusion consonant in VV-mode at the upper I–N binodal concentration (1.5 mg ml−1), the estimated diffusion constant of the fast-mode is D = 2.643 μm2 s−1, which is a typical colloidal diffusion constant. More aligned thermal fluctuations of director fields are seen in the translational motion. The diffusion constant for the slow-mode in VV-scattering was obtained to be as slow as D = 0.0155 μm2 s−1. Although the cutoff wavevector did not appear in the fast-mode of VV-scattering, a soft-mode exists at a finite cutoff wavevector for VH-scattering (blue data in Fig. 11d). Since hardly any diffusion is seen in the slow-modes of the VH-mode, with a complete flattening in Fig. 11f, overdamped rotations exist in the dispersion relation of the VH-mode in this upper binodal concentration. Whether the slow-mode in depolarized VH-scattering is related to long-range hydrodynamics nematic director fluctuations or not would be another open question.40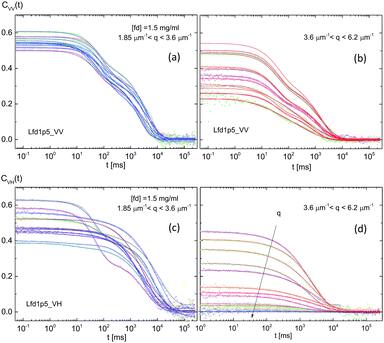 | ||
| Fig. 10 The intensity autocorrelation functions for the polarized VV-mode (a and b) and depolarized VH-mode (c and d) for an upper I–N binodal phase (fd-concentration of 1.5 mg ml−1). | ||
V. Relaxation behaviors of a chiral-nematic phase
A fully nematic concentration is, in a sense, a chiral-nematic phase, since it forms a chiral-nematic texture at a concentration of 2.0 mg ml−1 for a given low ionic strength. A comparison of the scattered intensities (for both VV- and VH-mode) for two comparable fd-concentrations is shown in Fig. 12: an upper I–N binodal (1.5 mg ml−1) and a chiral-nematic concentration (2.0 mg ml−1). The overall scattered intensities of the VV-signals are detected higher than the VH-signals in the I–N coexistence concentrations (Fig. 12). Not only is an increased scattered intensity of the VH-signal detected at a fully-nematic (a chiral-nematic) phase (with a concentration of 2.0 mg ml−1), but also the shape of the intensity broadening is depicted in terms of two separable peaks, in Fig. 12. As soon as the chiral-nematic, N*-phase is approached, the microscopic dynamics enormously slow down due to the existence of orientational textures that are persistent in the chiral-nematic domains, as well as in the helical domains of hierarchical chiral-mesophases (above 3.5 mg ml−1). So it is only valid for lower than the upper isotropic–nematic (I–N) binodal concentration (1.5 mg ml−1), and decent distinction between translational and rotational diffusion is possible in the charged chiral fd-rods. Above the upper binodal concentration, not only does the coupling of the rotational motion to translation become dominant, but also increased “twist” interactions or rotational motions of charged fd-rods appear.The correlation functions of both VV- and VH-scattering are provided in Fig. 13, where a pronounced signal-to noise ratio of the VH-signal is detected. Fig. 14a and b show the normalized correlation functions with possible schemes for rotational motions. Constrained field amplitudes are seen in the faster time window for both VV- and VH-correlation functions, implying that the translational motion in parallel is less than the perpendicular motions. However, the rotational motions are rather broadened in the wavevector.
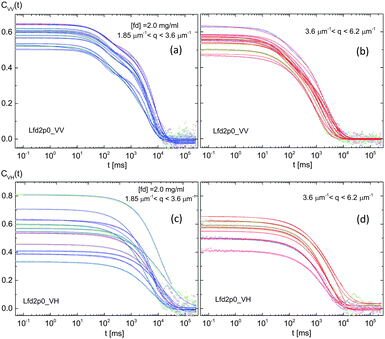 | ||
| Fig. 13 The raw intensity autocorrelation functions of the polarized VV-mode (a and b) and depolarized VH-mode (c and d) for a chiral-nematic phase with a fd-concentration of 2.0 mg ml−1. | ||
The dispersion of the fast-mode in VV- and VH-scattering in Fig. 14c and d are shown with the quadratic relation of a wavevector, as it is a diffusive motion. Here, again, a collective soft-mode is exhibited in the fast-mode of VV-scattering, with the cutoff wavevector of qc = 4.086 μm−1 in Fig. 14c slightly smaller than the cutoff wavevector of qc = 5.074 μm−1 for the lower I–N binodal concentration (Fig. 9c), indicating that the dynamic coherence length becomes longer. The red line in the fast-mode of Fig. 14c for the VV-scattering is for the damping motion of 25[cos(5q − 0.85π)]2e−0.40q. Interestingly, the amplitude of oscillation at an upper binodal concentration is reduced to a half smaller value of the lower I–N binodal concentration. Also, the slope of the dispersion relation has a different sign, as the relaxation behaviors are reversed in the fast-mode between VV- and VH-scattering for the chiral-nematic phase concentration. The flattening in the dispersion of VV-fast-mode is somewhat broadened as qc = 4.086 μm−1, as shown in Fig. 14c. The soft-mode is now shifted to a zero-wavevector limit in the fast-VH-mode, implying that the spatial coherence length becomes sufficiently longer. Here, whether the formation of orientational textures in the charged fd-rod suspensions is related to the length scale, either an optical pitch of the chiral-nematic phase (10 μm) or the persistence length of fd-viruses (2.2–2.8 μm), or not would be another interesting question. The slow-mode diffusion in VV-scattering in Fig. 14e is D = 0.0101 μm2 s−1, lower than the value of an upper I–N binodal concentration. However, for VH-scattering, a more or less averaged relaxation rate (flat) is observed in the chiral-nematic phase (Fig. 14f).
VI. Rotation restoring twist of hierarchical chiral-mesophases
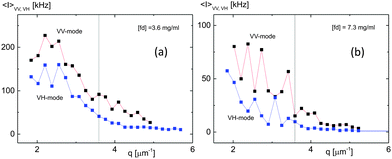
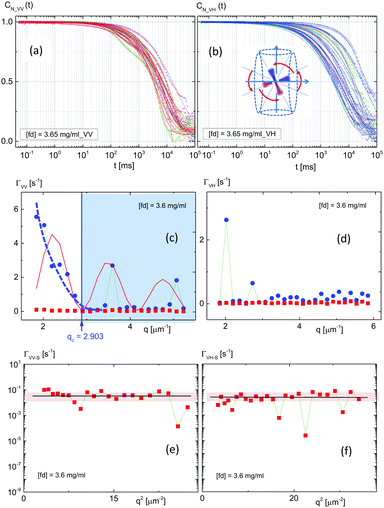
Two higher concentrations of hierarchical chiral mesophases were chosen – fd-concentrations of 3.65 mg ml−1 (distinguished as X*-phase, based on the depolarized optical morphologies) and 7.3 mg ml−1 (H*-phase). At these higher concentrations, the system is expected to equilibrate after much longer waiting times, and exhibit significantly slower relaxation of the orientation textures.28,60 At a low wavevector regime, VH-scattering, Fig. 15, the scattered intensity distributions for two comparable high concentrations of hierarchical chiral-mesophase are not only increased, but also substantially different shapes in the perpendicular direction. For a fd-concentration of 3.65 mg ml−1, the intensity correlation functions and normalized correlation functions are shown in Fig. 16 and 17a, b, respectively. The “broadening” of the rotational motions is depicted in the inset of Fig. 17b. In the overall correlation functions, the dominant rotational motions are perpendicular to the rods, except for a few extended correlation functions at low wavevectors in VV-scattering (Fig. 16a). The dispersion relations of the relaxation behaviors of VV- and VH-scattering are summarized in Fig. 17c and d for a fd-concentration of 3.65 mg ml−1 (X*-phase), where the slow-mode for both VV- and VH- are “completely” overdamped, with no indication of the slope in the dispersion relations in Fig. 17e and f. Interestingly, there is still a collective soft-mode observed in the fast-mode VV-scattering with a cutoff wavevector of qc = 2.903 μm−1, Fig. 17c, with a quadratic decrease of the wavevector.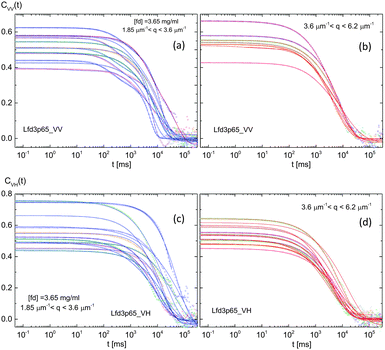 | ||
| Fig. 16 The raw intensity autocorrelation functions of the polarized VV-mode (a and b) and depolarized VH-mode (c and d) for a hierarchical chiral mesophase phase (fd-concentration of 3.6 mg ml−1). | ||
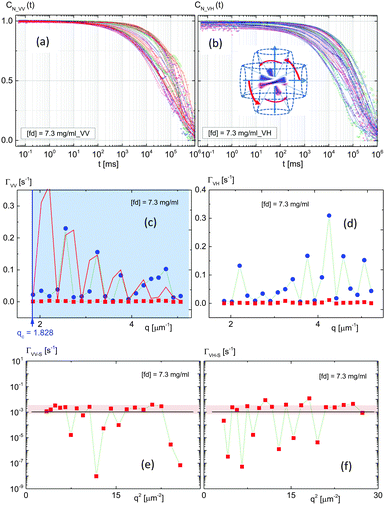
The damping motion of the fast-mode in VV-scattering is added as a red line in Fig. 17c, 10[cos(2.5q − 2.8π)]2e−0.35q, with a lower amplitude. This concentration is then unique to the observed system such that damping of translation occurs in the fast component of the fluctuations. By doubling the concentration to 7.3 mg ml−1 (H*-phase), severe slowing down behaviors are seen in both the measured and normalized correlation functions in Fig. 18 and 19a, b, respectively. The possible configuration of interacting rods is more crowded with randomized rotations and enhanced slowing down behaviors. In the dispersion relation of the higher concentration (7.3 mg ml−1) of a hierarchical chiral-mesophase (Fig. 19c and d), the minimal estimation of a soft-mode is reached at the lowest q-value in the experiment, qc = 1.828 μm−1. The red line in Fig. 19c for the fast-mode in VV-scattering is the simulated damping motion of 3[sin(6q − 0.58π)]2e−0.88q, which is qualitatively consistent with a decreased amplitude of damping motion, with an increase in the charged fd-concentration. Whether this cutoff wavevector is related to a finite length of the conformational change, as shown in molecular dynamics (MD) simulations of filaments,61 or not is an open question. Thus, enhanced rotation of higher concentrations in VH-mode is not distinguishable any more due to the slow-mode dominant relaxation. In general, the interpretation of two modes in both VV- and VH-mode are distinguishable, according to our scattering geometry, as the fast-mode is related to the ion-dissociated solvent acting on the parallel motions of the charged fd-rods, while the slow-mode corresponds to the “twist” angle or the perpendicular motions of rod–rod interactions. This can then be regarded as “restoring” rotations with a unique spatial coherence length, which is an intriguing observation when the concentration is sufficiency high enough to carry the coupled motions of rotation to translation. As a result, the system is overdamped with a rotational degree of freedom, exhibiting a slowing down behavior, as well as ordered orientations of the “domain” structure which may be formed during a reorganization process.62
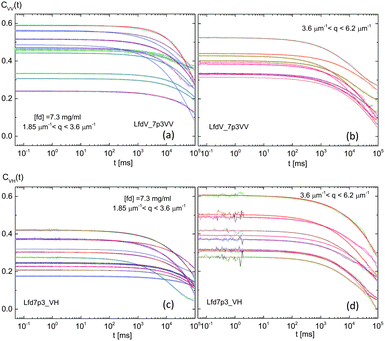 | ||
| Fig. 18 The raw intensity autocorrelation functions of the polarized VV-mode (a and b) and depolarized VH-mode (c and d) for a hierarchical chiral mesophase phase (fd-concentration of 7.3 mg ml−1). | ||
VII. Dynamic coherence length of charged chiral fd-rods
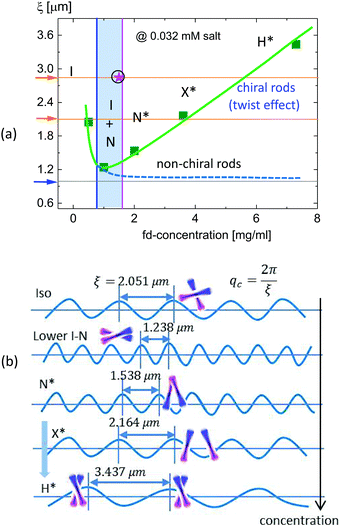
At a lower ionic strength (0.032 mM), the aspect ratio of the charged fd-rods is much reduced (16) due to an increased effective diameter, which is much lower than the aspect ratio (60–133) at a high ionic strength (above 1 mM salt). The system sets the isotropic–nematic transitions effectively for the lower concentrations. Moreover, the chiral nature of the surface of fd-viruses plays a role in having a stronger ‘twist’ interaction when the concentration is increased, for a fully-nematic chiral-nematic phase. As soon as the chiral-nematic phase concentration is approached, enormous slowing down behaviors are exhibited in the microscopic dynamics due to the existence of orientation textures.From the two dynamical modes observed in the overall dispersion relations of both the polarized (VV) and depolarized (VH) light scattering, except VV-scattering in an isotropic phase, the fast-mode is related to the thermal fluctuations of the parallel component, while the slow-mode is related to the perpendicular motions to the rods. The relaxation rates of the slow-mode are typically shown to be very low (100 times smaller). Also, depending on the concentration, the slow-mode plays a role in the interplay between rod–rod interactions via rotational motion and the “twist” elasticity. The distinctive cutoff wavevectors are found in the lower I–N binodal and a chiral-nematic phase concentration as the fast-mode translational motions exhibiting zero relaxation rates, i.e. the relaxation time diverges. Furthermore, qualitatively different dispersion relations are observed in rotational motions above a chiral-nematic phase concentration, while the translational motions are much overdamped. Quite periodic relaxation rates are seen for the rotational motions with spacing of the wavevector for hierarchical chiral-mesophases, which reveals an interesting aspect of the relevant coherence length with a persistent length of the fd-virus particle (2.26 μm). As a result, the dynamic coherence length is estimated from ξ = 2π/qc, where the cutoff wavevector qc is measured in the soft-mode of the dispersion relations, plotted in Fig. 20a, as a function of fd-concentration. Here, the existence of a minimum coherence length at the lower I–N binodal concentration indicates that there is an enhanced ‘twist’ effect of the charged chiral fd-rods, resulting from the reverse of an electrostatic interaction. Aligning effects increase by increasing the concentration up to a lower binodal, however above the lower I–N binodal concentration, the electrostatic repulsive interaction becomes stronger with a “twist” effect of the charged fd-rods. The lowest line in Fig. 20a indicates the value of the bare length of the fd-virus particle (0.88 μm).
Finally, a brief outlook of the possible spatial coherence length is illustrated in Fig. 20b with an increase in the fd-concentration, such that the isotropic phase is shown with equally probable rotations of two neighboring charged fd-rods, which is not much different from the lowest limit of the persistent length of the fd-virus itself (2.2 μm). Upon entering a lower I–N binodal concentration, the coherence length becomes shorter (1.24 μm), where a more aligned state is available, reducing the perpendicular gap among neighboring fd-rods. Interestingly, no spatial coherence length is observed at an upper I–N binodal concentration in the fast-mode of VV-scattering, but it does appear in VH-scattering as 2.84 μm, a larger limit of the persistent length of the fd-virus itself (2.8 μm). At a chiral-nematic phase, a slightly larger dynamic coherence length is observed (1.54 μm), indicated in the middle of Fig. 20b, where the charged fd-rods are twisted with rotations. By further increasing the concentration, larger correlation lengths are observed – 2.16 μm (for the X*-phase) and 3.44 μm (for the H*-phase). Consequently, a pronounced “twist” exists in the charged chiral fd-rods to keep the larger spatial coherence length. In the case of non-chiral rods, the correlation length may differ at the I–N coexistence concentration due to either a lack of “twist” or stronger short-range attractions. The formation of chiral-nematic orientation textures of a finite pitch length also relies on the twist elastic modulus: depending on the concentration, the twist power parameter is varied with an intrinsic chiral interaction, distinguished by either X*- (as lower) or H*-phase (as higher) in the hierarchical chiral mesophase concentration. Then, the finite width of a wavevector suggests the dynamic coherence length with possible relevant length scales, such as (i) the persistence length of the fd-virus (2.2–2.8 μm), (ii) the bare length of the fd-virus (0.9 μm), and (iii) the projections of an optical pitch length of the chiral nematic-texture (5–10 μm). For a lower concentration, there is still a separable diffusion between rotation and translation, however at a higher concentration, the coupling of rotational motion to translation becomes dominant: as soon as the chiral-nematic N*-phase is approached, the microscopic dynamics become enormously slower due to the existence of orientational textures. Above the upper binodal concentration, not only does the coupling of rotational motion to translation become dominant, but also a minimal coherence length appears due to the increased “twist” interaction or the rotational motions of the charged fd-rods. Therefore, a continuous rotation occurs vividly at higher concentrations with a restoring “twist” deformation, such that translational motion is caged, but the slow-mode is preserved by rotations of the whole cluster (or domains) over longer times. The spatial coherence length in the fast-mode then cooperates with the soft-mode relaxation that persists in the orientation texture of the charged chiral fd-viruses, reaching a new phase concentration.
VIII. Conclusions and discussion
This is the first time that the collective soft-mode has been explored in a lyotropic system and shown in the dispersion relations of damping motions of charged chiral rods by means of small angle dynamic light scattering. The system used is crowded suspensions of charged fibrous viruses (fd) at a low ionic strength (0.032 mM salt), where deformations of thick electric double layers are present. With an increase in the concentration, microscopic dynamics are discussed for an isotropic, two I–N binodals, a chiral-nematic phase, and two hierarchical chiral-mesophases. The chiral nature of the surface of fd-viruses plays a role in having a stronger ‘twist’ interaction when the concentration is increased, approaching a chiral-nematic phase. Continuous rotation occurs in the restoring “twist” deformation, such that translational motion is caged at a higher concentration, while the slow-mode is mainly preserved in the rotations of the whole cluster (or domains) for much longer time variables. The most intriguing finding is the existence of a minimum coherence length at the lower I–N binodal concentration due to an enhanced “twist” effect of the charged chiral fd-rods, as a consequence of the reverse of electrostatic repulsive forces. In the near future, the ‘twist’ effect of charged chiral fd-rods will be discussed by means of the optical pitch phase diagram as a function of the ionic strength and fd-concentration. The realistic microscopic description of two dynamical modes can be further described by including the motions of mobile ions attached to the charged fd-rods, either as the splay–bend or twist–bend elastic deformations. To check the fidelity of these specific elastic deformations of charged fd-rods, higher order Landau–Ginzburg equations should be considered in the kinetics of the orientational order parameter.References
- I. Musevic, R. Blinc and B. Zeks, The Physics of Ferroelelctric and Antiferroelelctric Liquid Crystals., Printed in Singapore by World Scientific Publishing Co., ISBN 981-02-0325-X, 2000 Search PubMed.
- J. Riseman and J. G. Kirkwood, J. Chem. Phys., 1950, 18, 512–516 CrossRef CAS.
- G. C. L. Wong and L. Pollack, Annu. Rev. Phys. Chem., 2010, 61, 171189 CrossRef PubMed.
- S. Allison, C. Chen and D. Stigter, Biophys. J., 2001, 81, 2558–2568 CrossRef CAS PubMed.
- R. S. Dias, J. Innerlohinger, O. Glatter, M. G. Miguel and B. Lindman, J. Phys. Chem. B, 2005, 109, 10458–10463 CrossRef CAS PubMed.
- J. B. Hubbard and J. A. Mccammon, J. Chem. Phys., 1987, 87, 4339–4343 CrossRef CAS.
- B. Robertson, J. Chem. Phys., 1991, 95, 3873–3876 CrossRef CAS.
- M. Drifford and J.-P. Dalbiez, J. Phys. Chem., 1984, 88, 5368–5375 CrossRef CAS.
- J. P. Hansen and I. R. Mcdonald, Phys. Rev. A: At., Mol., Opt. Phys., 1975, 11, 2111–2123 CrossRef.
- P. Schofield, Proc. Phys. Soc., London, 1966, 88, 149–170 CrossRef CAS.
- R. Pecora, Annu. Rev. Biophys. Bioeng., 1972, 1, 257–276 CrossRef CAS PubMed.
- R. Pecora, J. Nanopart. Res., 2000, 2, 123–131 CrossRef CAS.
- T. A. King, A. Knox and J. D. G. Mcadam, Biopolymers, 1973, 12, 1917–1926 CrossRef CAS PubMed.
- J. M. Schurr and K. S. Schmitz, Biopolymers, 1973, 12, 1021–1045 CrossRef CAS.
- E. E. Maier, R. Krause, M. Deggelmann, M. Hagenbuechle, R. Weber and S. Fraden, Macromolecules, 1992, 25, 1125–1133 CrossRef CAS.
- J. C. Thomas and G. C. Fletcher, Biopolymers, 1979, 18, 1333–1352 CrossRef CAS PubMed.
- D. Lehner, H. Lindner and O. Glatter, Langmuir, 2000, 16, 1689–1795 CrossRef CAS.
- E. Loh, E. Ralston and V. N. Schumaker, Biopolymers, 1979, 18, 2549–2567 CrossRef CAS.
- E. Loh, Biopolymers, 1979, 18, 2569–2588 CrossRef CAS.
- K. Zimmermann, J. Hagedorn, CC. Heuck, M. Hinrichsen and J. Ludwig, J. Biol. Chem., 1986, 261, 1653 CAS.
- G. J. Thomas, B. Prescott and L. A. Day, J. Mol. Biol., 1983, 165, 321–356 CrossRef CAS PubMed.
- C. Graf, M. Deggelmann, M. Hegenbuechle, H. Kramer, R. Kraus, C. Martin and R. Weber, J. Chem. Phys., 1991, 95, 6284–6289 CrossRef CAS.
- Th. Kirchhoff, H. Loewen and R. Klein, Phys. Rev. E: Stat. Phys., Plasmas, Fluids, Relat. Interdiscip. Top., 1996, 53, 5011–5022 CrossRef CAS.
- B. Weyerich, B. D. Aguanno, E. Canessa and R. Klein, Faraday Discuss. Chem. Soc., 1990, 90, 245–259 RSC.
- J. Schneider, D. Karrer, J. K. G. Dhont and R. Klein, J. Chem. Phys., 1987, 87, 3008–3015 CrossRef CAS.
- L. D. Landau and I. M. Khalatnikov, On the anomalous absorption of sound near the second order phase transitons., Dokl. Akad. Nauk SSSR, 1954, 96, 469 Search PubMed.
- K. Kang, A. Wilk, A. Patkowski and J. K. G. Dhont, J. Chem. Phys., 2007, 126, 214501 CrossRef PubMed.
- K. Kang and J. K. G. Dhont, Soft Matter, 2013, 9, 4401–4411 RSC.
- K. Kang and J. K. G. Dhont, Colloid Polym. Sci., 2015, 293, 3325–3336 CAS.
- M. Doi, Ferroelectrics, 1980, 30, 247–254 CrossRef CAS.
- J. K. G. Dhont and K. Kang, Soft Matter, 2014, 10, 1987 RSC.
- J. K. G. Dhont and K. Kang, Soft Matter, 2015, 11, 2893 RSC.
- L. Onsager, Phys. Rev., 1942, 62, 558 CrossRef CAS.
- L. Onsager, Ann. N. Y. Acad. Sci., 1949, 51, 627 CrossRef CAS.
- M. Doi, J. Polym. Sci., 1981, 19, 229–243 CAS.
- J. G. Kirkwood and P. L. Auer, J. Chem. Phys., 1951, 19, 281–283 CrossRef CAS.
- J. E. Hearst, J. Chem. Phys., 1963, 38, 1062–1065 CrossRef CAS.
- P. S. Russo, in Dynamic Light Scattering from Rigid and Nearly Rigid Rods in Dynamic Light Scattering, the Method and Some Applications, ed. W. Brown, Oxford University Press, Oxford, 1993 Search PubMed.
- R. Cush, P. S. Russo, Z. Kucukyavuz, Z. Bu, D. Neau, D. Shih, S. Kucukyavuz and H. Ricks, Macromolecules, 1997, 30, 4920–4926 CrossRef CAS.
- AJ. Masters, Mol. Phys., 1985, 56, 887–901 CrossRef CAS.
- B. V. Derjaguin, V. M. Mueller and Y. P. Toporov, J. Colloid Interface Sci., 1975, 53, 314–326 CrossRef CAS.
- N. D. Gershon and I. Oppenheim, J. Chem. Phys., 1973, 59, 1337–1341 CrossRef CAS.
- D. R. Bauer, J. I. Brauman and R. Pecora, Annu. Rev. Phys. Chem., 1976, 27, 443–463 CrossRef CAS.
- R. Nossal, Biophys. J., 1971, 11, 341–354 CrossRef CAS PubMed.
- J. P. Boon, R. Nossal and S. H. Chen, Biophys. J., 1974, 14, 847–864 CrossRef CAS PubMed.
- S. B. Dubin, G. Feher and G. B. Benedek, Biochemistry, 1973, 12, 714–720 CrossRef CAS PubMed.
- M. Doi, T. Shimada and K. Okano, J. Chem. Phys., 1988, 88, 4070–4075 CrossRef CAS.
- M. A. Tracy and R. Pecora, Annu. Rev. Phys. Chem., 1992, 43, 525–557 CrossRef CAS.
- H. C. van de Hulst, Lighit Scattering by Small Particles, Dover Pub. Inc., N.Y., ISBN: 0-486-64229-3, 1957 Search PubMed.
- O. Glatter, J. Appl. Crystallogr., 1979, 12, 166–175 CrossRef CAS.
- O. Glatter and B. Hainisch, J. Appl. Crystallogr., 1984, 17, 435–441 CrossRef CAS.
- K. Kang, Rev. Sci. Instrum., 2011, 82, 053903 CrossRef PubMed.
- K. Kubota and B. Chu, Biopolymers, 1983, 22, 1461–1487 CrossRef CAS.
- D. Stigter, Cell Biophys., 1987, 11, 139–158 CrossRef CAS PubMed.
- A. W. Fulmer, J. A. Benbasat and V. A. Bloomfield, Biopolymers, 1981, 20, 1147–1159 CrossRef CAS PubMed.
- S. F. Schulz, E. E. Maier, R. Krause, M. Hagenbuechle, M. Deggelmann and R. Weber, J. Chem. Phys., 1990, 92, 7087–7094 CrossRef CAS.
- T. Maeda and S. Fujime, Macromolecules, 1985, 18, 2430–2437 CrossRef CAS.
- S. F. Schulz, E. E. Maier and R. Weber, J. Chem. Phys., 1989, 90, 7–10 CrossRef.
- J. Jorne, J. Theor. Biol., 1975, 55, 529–532 CrossRef CAS PubMed.
- K. Kang, Soft Matter, 2014, 10, 3311 RSC.
- Z. Qin and M. J. Buehler, Phys. Rev. Lett., 2010, 104, 198304 CrossRef PubMed.
- I. M. Lifshitz, J. Exp. Theor. Phys., 1962, 15, 939–942 Search PubMed.
Footnote |
| † PACS number: 64.60.-i, 82.70.Dd, 47.20.Hw |
| This journal is © The Royal Society of Chemistry 2016 |

![[u with combining right harpoon above (vector)]](https://www.rsc.org/images/entities/i_char_0075_20d1.gif)
