Giant enhancement of the initial SERS activity for plasmonic nanostructures via pyroelectric PMN-PT†
Mingrui
Shao
 a,
Di
Liu
b,
Jinxuan
Lu
a,
Xiaofei
Zhao
a,
Jing
Yu
a,
Di
Liu
b,
Jinxuan
Lu
a,
Xiaofei
Zhao
a,
Jing
Yu
 a,
Chao
Zhang
a,
Baoyuan
Man
*a,
Hui
Pan
a,
Chao
Zhang
a,
Baoyuan
Man
*a,
Hui
Pan
 *bc and
Zhen
Li
 *a
*a
aSchool of Physics and Electronics, Shandong Normal University, Jinan 250014, China. E-mail: byman@sdnu.edu.cn; lizhen19910528@163.com
bInstitute of Applied Physics and Materials Engineering, University of Macau, Macao SAR, 999078, P. R. China. E-mail: huipan@um.edu.mo
cDepartment of Physics and Chemistry, Faculty of Science and Technology, University of Macau, Macao SAR, 999078, P. R. China
First published on 17th May 2023
Abstract
Herein, a simply-prepared and highly sensitive electric field-induced surface-enhanced Raman spectroscopy (E-SERS) substrate is proposed by combining a pyroelectric material (PMN-PT) with the plasmonic silver nanoparticles (Ag NP). The intensity of SERS signals is further enhanced by more than 100 times after the application of positive or negative pyroelectric potentials. Theoretical calculations and experimental characterizations demonstrate that the chemical mechanism (CM) as induced by the charge transfer (CT) is mainly responsible for enhanced E-SERS. In addition, a novel nanocavity structure with PMN-PT/Ag/Al2O3/silver nanocubes (Ag NCs) was also introduced, which could effectively convert light energy into heat energy and realize a tremendous enhancement of SERS signals. These findings are expected to further accelerate the application of plasmonic metal nanoparticle-based pyroelectric materials in the fields of energy conversion, optical-sensors and photocatalysts.
New conceptsIn this paper, a pyroelectric effect assisted surface-enhanced Raman scattering (SERS) signal amplifying platform is demonstrated by combining PMN-PT with plasmonic silver nanostructures. Under the action of the pyroelectric field, the SERS signal can be further amplified by more than 100 times. Detailed experimental and theoretical analyses indicate that the chemical mechanism (CM) induced by charge transfer (CT) is mainly responsible for the further enhancement of SERS, which is a change from previous research. The proposed innovative substrate provides another perspective for an in-depth understanding of the SERS enhanced mechanism and is also conducive to accelerating the preparation and advances of the SERS platform based on other self-electric materials. |
Introduction
As a powerful fingerprint vibrational spectroscopy technique, surface-enhanced Raman scattering (SERS) has been extensively used in various fields, such as environmental monitoring,1,2 pharmaceutical analysis,3 food safety,4–6 and biosensing.7–9 The ultra-high sensitivity is contributed to two mechanisms: electromagnetic (EM) enhancement and chemical (CM) enhancement.10–12 The EM enhancement mechanism derives from the collective vibration of free electrons in metal nanostructures under laser irradiation, which amplifies the local electromagnetic field (hot spot) at the nanogap.10 The CM enhancement mechanism is related to the charge transfer (CT) between the substrate and the analyte, which results in the polarization within the molecule and thus increases the Raman scattering cross section, leading to a magnified Raman signal.11,12In order to further enhance the detection capability of the substrate, hybrid systems engaging both EM and CM mechanisms have been extensively studied.13–16 Nonetheless, in most cases, the enhancement is difficult to be tuned for both EM and CM if the substrate has been prepared. For example, the CM mechanism is highly affected by the energy level matching degree between the substrate and the detected molecule.17,18 Therefore, different strategies to enhance SERS signals, such as doping degree control, external electric field regulation and deformation, are proposed.19–22 Han et al. designed an active modulation method to dynamically control the Fermi level of graphene by using UV irradiation in different gas environments, which could regulate the CT between the substrate and analytes and realize the active tuning of SERS signals.18 By applying an electric field to the aligned diphenylalanine peptide nanotube (FF-PNT)-GO composite substrate, Rice et al. successfully increased the detection sensitivity of glucose and nucleobases by tenfold due to the enhanced CT resonance.23 In addition, Rice's group also prepared the FF-PNT/Ag NP complex based on the piezoelectric properties of FF-PNTs, and the SERS signal of the bent sample was one order of magnitude higher than that of the flat sample,22 which was attributed to the piezoelectric-induced charge through bending. Song et al. decorated zinc oxide (ZnO) nanorods with gold nanoparticles and realized the controllable enhancement of the piezoelectric potential by using the magnets to provide adjustable pressure force, which could regulate the electron density around the gold nanoparticles, create a local electric field, and significantly enhance the local surface plasmon resonance (LSPR), leading to the enhanced SERS signal by 6.7 times.24 However, the experimental complexity of the above strategies, especially for piezoelectric control and mechanical motion, easily disturbs the signal. Besides, the enhancement factor of the SERS signal was not high enough, which needs to be further optimized. More importantly, the mechanism behind the phenomena has not been thoroughly explored. Therefore, these active regulation strategies still need to be further studied.
The pyroelectric effect is a phenomenon of releasing an electric charge on the surface of certain anisotropic solids due to the change of spontaneously polarized intensity caused by temperature fluctuation.25,26 Thus, heat energy could be captured and converted into electricity by the pyroelectric effect. Apart from the piezoelectric effect, at present, there are few studies on introducing the pyroelectric effect into an SERS substrate as an active regulation strategy.27,28 However, the current work simply attributed the signal enhancement to the electromagnetic field up-regulation effects. The role of CM caused by CT in a pyroelectric based SERS substrate has not been discussed. Combining the CT mechanism and the accumulation of charges on the surface of a pyroelectric substrate, can these materials be used to amplify the SERS signal dramatically because they are widely available now?29–32 For example, Pb(Mg,Nb)O3-PbTiO3 (PMN-PT) is a common pyroelectric material with an outstanding pyroelectric coefficient.33,34 To demonstrate our idea, we combined PMN-PT with plasmonic silver nanoparticles (Ag NPs) as a composite substrate (PMN-PT/Ag NP) for SERS in this work. We find that the SERS signal is further amplified by more than two orders of magnitude when the positive or negative pyroelectric potentials are applied, which is the highest enhancement factor in the reported strategies so far. The two mechanisms, EM and CT, work simultaneously, and the CT process between Ag NPs and probe molecules plays a critical role in the overall SERS enhancement. Our strategy is also expected to be applied to other pyroelectric or thermoelectric materials to boost the detection sensitivity.
Results and discussion
Pyroelectrical characteristics of the PMN-PT/Ag NP sample
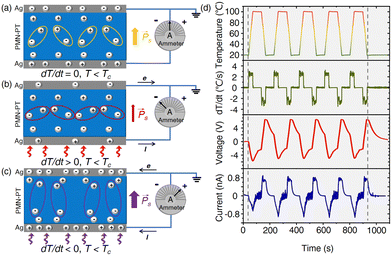
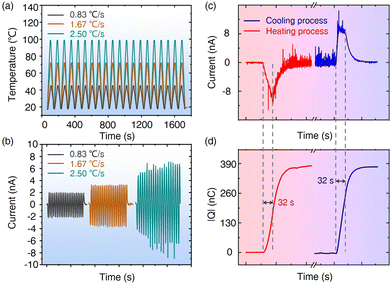
The PMN-PT/Ag NP substrate was fabricated by depositing Ag NPs on a PMN-PT plate using a simple vacuum thermal evaporation process. The substrate was then placed on a temperature controller for the electrical and SERS tests. We first examined the pyroelectrical properties of PMN-PT/Ag NP. Two gold wires were fixed on the upper and lower sides of the sample (Fig. S1, ESI†). The open-circuit voltage and the short-circuit current were then measured by connecting the gold-wire sample to an electrochemical workstation. Fig. 1 depicts the pyroelectric working mechanism and the electrical output characteristics of PMN-PT/Ag NP in detail. When the temperature is constant (dT/dt = 0), the electric dipole in PMN-PT oscillates around the central axis of symmetry with a certain amplitude. The self-polarized electric field generated by stacking of electric dipoles induces equal and opposite charges on the conductive electrodes of PMN-PT through electrostatic interaction, resulting in the overall electric neutrality and no external current release (Fig. 1a). When the temperature of the sample increases (dT/dt > 0) near the Curie temperature (Tc ∼135 °C), the electric dipole swings around the central axis of symmetry with a larger amplitude due to the thermal effect, which weakens its spontaneous polarization intensity. The weak electrostatic induction of PMN-PT to the surface polarized charge leads to the redistribution of charge in the two electrodes through the external circuit, resulting in a new electrostatic balance (Fig. 1b).35,36 In contrast, as the sample temperature decreases (dT/dt < 0), the amplitude of the electric dipole in PMN-PT decreases, and the spontaneous polarization intensity increases. The electrostatic balance is broken again, and the electrons flow backwards through the external circuit to reach a new stable state (Fig. 1c).37 The open-circuit voltage and short-circuit current of PMN-PT/Ag have been measured by varying the sample temperature in the range of 20 °C to 100 °C (the room temperature (RT) is 20 °C) (Fig. 1d). Negative voltage/current (∼5 V/0.8 nA) is observed as the temperature increases from 20 °C to 100 °C. As the temperature is kept at 100 °C, the voltage and current signals decay. When the temperature decreases from 100 °C to 20 °C, positive voltage/current (∼6 V/0.8 nA) is obtained. Similarly, as the temperature remains constant at 20 °C, the voltage and current signals gradually approaches zero.It is known that pyroelectric current (ip) has the following relationship with the rate of change in temperature (dT/dt) for pyroelectric materials:
| ip = pS(dT/dt) | (1) |
SERS enhancement by controlling temperature variation
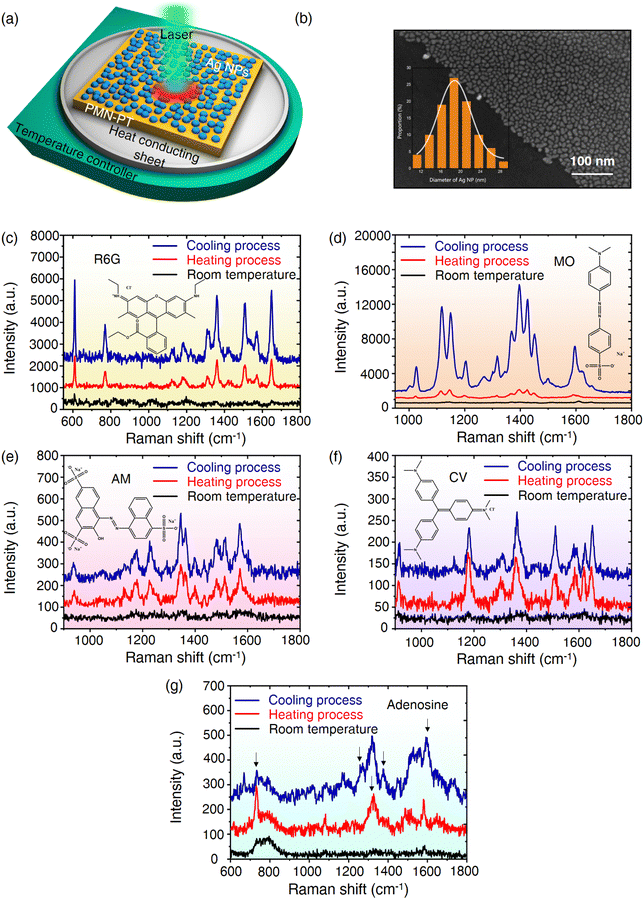
Fig. 3a shows the Raman measurement system in this work, which consists of a temperature control platform, a heat conduction gasket and a test sample. As shown in Fig. 3b (also see Fig. S2, ESI†), uniform Ag NPs with an average diameter of 19 nm (inset) are tightly attached to the surface of PMN-PT. Compared with that of PMN-PT, the UV-vis-NIR spectra of the PMN-PT/Ag NP substrate shows an obvious absorption peak at 565 nm, which originates from the LSPR absorption of Ag NPs on pyroelectric PMN-PT (Fig. S3, ESI†). The laser-dependent SERS spectra also demonstrate that a good SERS signal is obtained using a 532 nm laser, while there was no identifiable characteristic peak using a 785 nm laser (Fig. S4, ESI†). As a result, the 532 nm laser was employed for subsequent experiments unless specifically mentioned. Before the SERS measurement, we find that there is the slight displacement relative to the laser point when placing the PMN-PT/Ag NP at variable temperature, which would affect the analysis for the Raman test to a certain extent (Fig. S5, ESI†). To eliminate the influence of this factor, Raman spectra of thirty random points near the black dashed line were collected at RT. The characteristic peaks of rhodamine 6G (R6G) at 613 and 1653 cm−1 were selected to evaluate the homogeneity of PMN-PT/Ag NP, and the following equation was used to calculate the relative standard deviation (RSD): | (2) |
Mechanism for SERS Enhancement
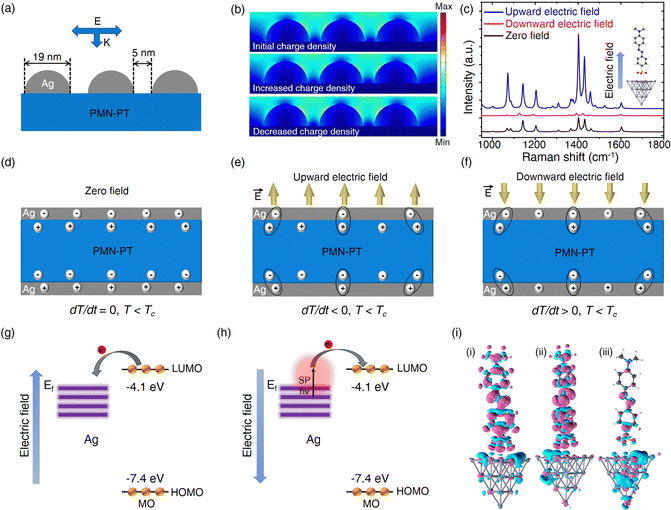
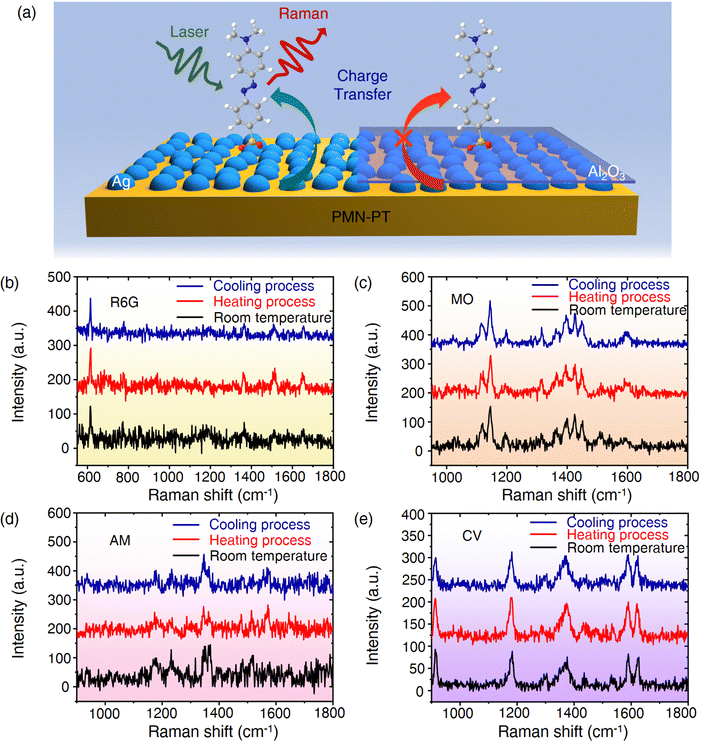
In order to reveal the origins behind the observed phenomena, we analyzed them from two aspects of EM and CM mechanisms. On the one hand, we calculate the change of charge quantity on the Ag electrode during heating and cooling processed according to Fig. 2d, and then, add or subtract the varying charge density from the initial charge density on the Ag electrode at room temperature. The change of charge density alters the relative permittivity of Ag according to the Drude model. We used COMSOL multi-physics 5.5 software to construct the local electromagnetic field model of Ag NPs under different carrier concentrations by solving the Homogeneous Helmholtz equation (see the Methods section for details, Fig. 4a). As shown in Fig. 4b, no matter whether the charge density increases or decreases, the local electric field changes little. In addition, the SERS signals under different temperatures were also collected to assess the influence of temperature changes on LSPR of Ag NPs (Fig. S10, ESI†). The SERS signal decreased slightly with the increase of temperature, which is due to the redshift of the LSPR peak at high temperature, causing it to move away from the excited laser wavelength (Fig. S11, ESI†). Therefore, only considering the electromagnetic mechanism could not explain the experimental result that SERS signal is greatly enhanced in the process of temperature change. On the other hand, an electric potential could be produced at a nonconstant temperature if the pyroelectric material was connected with an open circuit.26 To this end, we consider the construction of the MO–Ag20 complex, and use Gauss software to calculate the Raman spectra of MO–Ag20 complex in different electric fields. The direction of the applied electric field is parallel to the Ag–S bond and perpendicular to the metal surface (the inset in Fig. 4c). When the temperature drops (dT/dt < 0), the spontaneous polarization intensity in PMN-PT is enlarged (Fig. 4e). As the change of polarized charge density in the Ag electrode lags behind the change of bound charge density in PMN-PT, an upward electric field is generated on the sample surface. This facilitates the transfer of electrons from the LUMO level of the molecule to the Fermi level of Ag, which increases the polarization of the molecule (Fig. 4g). As shown in Fig. 4c, when the upward electric field is applied (corresponding to the case of cooling), the calculated SERS spectrum is much higher than that at zero electric field. Similarly, as the temperature rises (dT/dt > 0), a downward electric field is generated on the surface of the sample (Fig. 4f). The calculated SERS spectrum is lower than that at zero field (Fig. 4c). In this case, the electrons would prefer to move from the Fermi level of Ag to the LUMO level of the molecule. Nevertheless, the electrons are not energetic enough to realize the transition, and thus reducing the chemical enhancement. However, under the excitation of external laser, the high-energy electrons of Ag have enough energy to jump to the LUMO level of molecule (Fig. 4h). Therefore, the enhanced SERS signal can be also collected experimentally in the heating process. In addition, Fig. 4i shows the response of the first excitation states of MO–Ag20 complex to the applied electric field. Compared with the field-free case, the electrons migrate to the bottom atoms of the Ag cluster when the upward electric field is applied, while the holes are localized on the Ag cluster when the downward electric field is applied. It is worth emphasizing that the simplified model is designed to explain the CT process qualitatively. The theoretical results indeed proved that the applied electric field could affect the CT in the MO–Ag20 complex, which we argue is responsible for the SERS enhancement in the process of heating and cooling. Fig. S12–S14 (ESI†) shows schematic diagrams for the electron transitions of R6G, AM and CV molecules, respectively. Consequently, the pyroelectric effect could significantly promote the CM rather than EM, leading to the enhanced SERS. In addition, we also investigated the impact of heating and cooling PMN-PT/Ag NPs in the reduction of p-nitrothiophenol (PNTP) to p,p′-dimercaptoazobenzene (DMAB). The results show that PNTP and DMAB can be converted into each other, indicating that electron migration between molecule and substrate can be effectively regulated by the pyroelectric field (see Fig. S15 and S16 for details, ESI†).To further verify our conclusions, an aluminium oxide (Al2O3) layer with a thickness of 5 nm was deposited on PMN-PT/Ag NP by electron beam evaporation (Fig. 5a). Using the same probe molecules, the contrast test was conducted. Notably, almost no strength variation could be observed on PMN-PT/Ag NP/Al2O3 under variable temperature as shown in Fig. 5b–e compared with that on bare PMN-PT/Ag NPs (Fig. 3c–f). This is because Al2O3, acting as a barrier layer, prohibits the CT process between the Ag NPs and the analytes, resulting in the suppression of CM provided by the pyroelectric effect (Fig. 5a).
Furthermore, in order to evaluate the universality of the SERS enhancement strategy proposed in this work, the LiTaO3/Ag NP substrate was also prepared for SERS measurement (see Fig. S17 for details, ESI†). A similar experimental result was obtained, that is, the SERS signal was significantly enhanced in both heating and cooling processes, compared with that at room temperature, indicating that this method has great potential to be applied to other pyroelectric materials and is expected to be used in the real environment or biological detection.
Conversion optical energy into heat energy for SERS enhancement
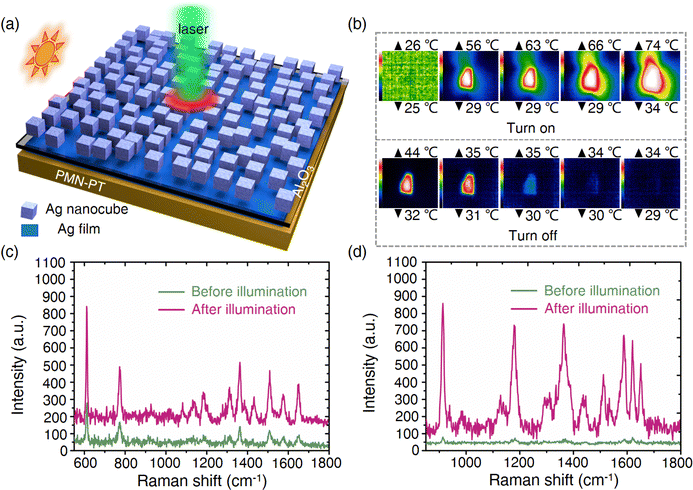
Optical energy is one of the most promising green energy sources in nature. In order to free our SERS substrate from the limitation of temperature control platform and improve its working ability based on the pyroelectric effect in the real environment, we introduced a novel nanocavity structure with PMN-PT/Ag/Al2O3/Ag NCs. As shown in Fig. 6a, collective charge oscillations confined to the Ag NCs and Ag film occur (localized surface plasmons) due to resonance with incident light, which rapidly decay and generate heat through electron–phonon scattering.41 The heat diffuses to the PMN-PT below, causing the change of spontaneous polarization intensity of PMN-PT and generating an electric field. The temperature distribution of PMN-PT/Ag/Al2O3/Ag NC before and after the simulated sunlight illumination was recorded by an infrared camera, as shown in Fig. 6b. Fig. S18 of the ESI† shows a line chart of the corresponding temperature peak over time. The highest temperature and maximal change rate of temperature can reach 74 °C and 3.0 °C s−1, respectively. Subsequently, we used this platform as the SERS substrate to detect R6G and CV. As shown in Fig. 6c and d, the SERS signals are significantly enhanced after the simulated sunlight is turned on. Fig. S19 of the ESI† clearly shows the intensity change of SERS signal of CV with time under simulated sunlight irradiation. Only faint SERS signals is observed before the simulated sunlight was turned on. There is no obvious change in the SERS signals for a short time after the light is turned on, which may be due to the thermal energy converted by optical energy is not transmitted promptly to PMN-PT below. When the temperature of the whole substrate begins to rise, the surface potential appears, accompanied by a significantly enhanced SERS signal. Subsequently, the temperature approached 74 °C, the rate of temperature change is close to zero, and the resulting SERS signal continued to decrease until it is indistinguishable. With the simulated sunlight turned off at this time, the clear characteristic band is visualized again, followed by gradual decrease of the SERS signal close to that at room temperature. Therefore, the PMN-PT/Ag/Al2O3/Ag NC substrate could be used as an excellent opto-thermo-electric converter device to possess a greater potential in the actual environment detection.Conclusions
In summary, we successfully combine PMN-PT and plasmonic Ag NP to prepare an SERS substrate based on the pyroelectric effect, and systematically investigated its SERS performance in a variable temperature environment. Several common dye molecules and biomolecular adenosine have been detected using this substrate, and the peak strength can be increased by more than two orders of magnitude. Theoretical calculations and experimental characterizations indicate that the signal enhancement is due to the CM induced by CT. Furthermore, by combining the plasmonic light absorption layer with PMN-PT, we achieved a significant SERS enhancement under visible light irradiation. The proposed innovative SERS substrate has broad application prospects in energy conversion, optical-sensors and photocatalytic reactions.Methods
Preparation of PMN-PT/Ag NP
The PMN-PT single crystal (<001>, 10 × 10 × 0.5 mm3) was grown using the modified Bridgman method.42 The silver target (Ag, ≥99.99%) was obtained from Hangzhou Bald Advanced Materials Co., LTD (Hangzhou, China). High vacuum hot evaporation apparatus (VZZ-300S, Beijing, China) was used to directly deposit Ag NPs on a polished PMN-PT substrate. The deposition thickness was set at 5 nm with a deposition rate of 0.2 Å s−1 under a pressure of 4.5 × 10⁻⁴ Pa.Preparation of PMN-PT/Ag/Al2O3/Ag NC
The electron beam evaporation was performed to fabricate an Al2O3 layer. The evaporation thickness was 5 nm with an evaporation rate of 0.3 Å s−1 under a pressure of 1 × 10⁻⁴ Pa. The Ag NCs with the side-length of 80 nm (purchased from Xiamen numan tech Co., Ltd) was first cleaned twice with ethanol by centrifugation at 500 rpm. Then, the supernatant was removed and 20 μL cube solution was dropped onto the PMN-PT/Ag/Al2O3 to fabricate the PMN-PT/Ag/Al2O3/Ag NC substrate.Characterization
Scanning electronic microscopy (SEM, ZEISS, Sigma 500) was used to characterize Ag NPs on the surface of PMN-PT. A temperature control platform was employed to precisely control the temperature of the substrate by connected software. SERS measurements were performed using a Raman spectrometer (Horiba HR Evolution) with an excited laser of 532 or 785 nm, in which a laser power of 0.48 mW and a diffraction grid of 600 g mm−1 were chosen. Two microliters of the solution of the molecule to be tested were dropped onto the substrate, dried and used for spectral acquisition. Time-dependent Raman mapping was adopted to collect SERS signals using a 50× objective. The integration time was 1 s with 1 accumulation. In a typical experiment, the SERS signals of molecules at room temperature were collected first, then the sample was heated to 100 °C (HP), and then cooled to room temperature from 100 °C (CP) by temperature controller. All Raman spectra collected during this whole process were recorded. The open-circuit voltage and short-circuit current were obtained on an electrochemical workstation (CH Instruments Ins., CHI760E) by connecting the sample to gold wires using SPI Silver conductive paint (purchased from Wuhan Vacuum Tesco Trading Co., Ltd).Finite-element electromagnetic modeling
COMSOL Multi-physics 5.5 was used to construct the local electromagnetic field model of Ag NPs with different carrier concentrations by solving the homogenous (source-free) Helmholtz equation. The geometric structure of the model includes two parts: a physical domain and a perfectly matching layer (PML). The thickness of the PML is 150 nm, and the physical domain is composed of two regions: (a) PMN-PT domain: 750 nm × 750 nm × 250 nm; (b) air + Ag NP domain: 750 nm × 750 nm × 400 nm. Nine Ag NPs with a diameter of 19 nm and a gap of 5 nm are distributed in an array on the PMN-PT contact surface with air. The electromagnetic plane-wave is incident perpendicular to the contact surface and the incident power is 0.56 μW. The relative dielectric constant of PMN-PT is set to εr = 5000 + 4500i. We regulated the relative dielectric constant of Ag using the following formula: | (3) |
 is the plasma frequency of Ag, and γD is the damping frequency. According to the SEM image, the amount of charge transfer measured by electrochemical workstation is evenly distributed in individual Ag NPs, so as to change the carrier concentration N and further adjust the relative dielectric constant εω.
Density-Functional-Theory calculations
The spectral calculations were performed using the Gaussian 09 software package. Except for the four Ag atoms at the bottom of the Ag20 cluster, the geometric configurations of the other atoms of MO–Ag20 complex were optimized via the PW91PW91 functional, in which C, H, O, N and S atoms adopted the 6-31G(D) basis group, and Ag atoms adopted the LANL2DZ basis group. Electric fields of +0.01 au and −0.01 au are applied along the X-axis. The SERS spectra were analyzed using a 532 nm laser and 298.15 K using Multiwfn software.Author contributions
M. S. proposed and implemented experiments, analyzed data, and wrote and revised the manuscript. D. L., J. L., X. Z., J. Y., and C. Z. reviewed and revised the manuscript. M. S. contributed to simulations. B. M., H. P., and Z. L. proposed and supervised the project and revised and determined the manuscript. All authors contributed to interpretation of the results and approved the submitted version.Conflicts of interest
There are no conflicts to declare.Acknowledgements
We are thankful for the financial support from the National Natural Science Foundation of China (11974222, 12004226, 12174229, and 11904214), the Natural Science Foundation of Shandong Province (ZR2020QA075), the Qingchuang Science and Technology Plan of Shandong Province (2021KJ006), the China Postdoctoral Science Foundation (2019M662423), and the Shandong Post-Doctoral Innovation Project (202002021). H. Pan is thankful for the support from the Shenzhen-Hong Kong-Macao Science and Technology Research Programme (Type C) (SGDX20210823103803017) and the Science and Technology Development Fund from Macau SAR (FDCT) (0081/2019/AMJ, 0102/2019/A2, 0154/2019/A3, and 0033/2019/AMJ).References
- S. K. Yang, X. M. Dai, B. B. Stogin and T. S. Wong, Proc. Natl. Acad. Sci. U. S. A., 2016, 113, 268 CrossRef CAS PubMed
.
- R. A. Halvorson and P. J. Vikesland, Environ. Sci. Technol., 2010, 44, 7749 CrossRef CAS PubMed
.
- Y. Q. Zhang, Y. Q. Gu, J. He, B. D. Thackray and J. Ye, Nat. Commun., 2019, 10, 3905 CrossRef PubMed
.
- C. H. Li, J. Yu, S. C. Xu, S. Z. Jiang, X. W. Xiu, C. S. Chen, A. H. Liu, T. F. Wu, B. Y. Man and C. Zhang, Adv. Mater. Technol., 2018, 3, 1800174 CrossRef
.
- B. H. Liu, G. M. Han, Z. P. Zhang, R. Y. Liu, C. L. Jiang, S. H. Wang and M. Y. Han, Anal. Chem., 2012, 84, 255 CrossRef CAS PubMed
.
- H. Cui, S. Y. Li, S. Z. Deng, H. J. Chen and C. X. Wang, ACS Sens., 2017, 2, 386 CrossRef CAS PubMed
.
- Q. Q. Ding, J. Wang, X. Y. Chen, H. Liu, Q. J. Li, Y. L. Wang and S. K. Yang, Nano Lett., 2020, 20, 7304 CrossRef CAS PubMed
.
- Y. H. Hu, H. J. Cheng, X. Z. Zhao, J. J. Wu, F. Muhammad, S. C. Lin, J. He, L. Q. Zhou, C. P. Zhang, Y. Deng, P. Wang, Z. Y. Zhou, S. M. Nie and H. Wei, ACS Nano, 2017, 11, 5558 CrossRef CAS PubMed
.
- L. Zhou, Y. Liu, F. Y. Wang, Z. J. Jia, J. Zhou, T. Jiang, L. Petti, Y. C. Chen, Q. Xiong and X. J. Wang, Talanta, 2018, 188, 238 CrossRef CAS PubMed
.
- S. Y. Ding, J. Yi, J. F. Li, B. Ren, D. Y. Wu, R. Panneerselvam and Z. Q. Tian, Nat. Rev. Mater., 2016, 1, 16021 CrossRef CAS
.
- X. X. Han, W. Ji, B. Zhao and Y. Ozaki, Nanoscale, 2017, 9, 4847 RSC
.
- P. Kambhampati, C. M. Child, M. C. Foster and A. Campion, J. Chem. Phys., 1998, 108, 5013 CrossRef CAS
.
- L. B. Yang, X. Jiang, W. D. Ruan, J. X. Yang, B. Zhao, W. Q. Xu and J. R. Lombardi, J. Phys. Chem. C, 2009, 113, 16226 CrossRef CAS
.
- Y. Chen, H. M. Liu, Y. R. Tian, Y. Y. Du, Y. Ma, S. W. Zeng, C. J. Gu, T. Jiang and J. Zhou, ACS Appl. Mater. Interfaces, 2020, 12, 14386 CrossRef CAS PubMed
.
- M. R. Shao, C. Zhang, J. Yu, S. Z. Jiang, X. F. Zhao, Z. X. Li, W. X. Lu, B. Y. Man and Z. Li, Opt. Express, 2021, 29, 28664 CrossRef CAS PubMed
.
- X. Zhao, W. Z. Wang, Y. J. Liang, J. L. Fu, M. Zhu, H. L. Shi, S. J. Lei and C. J. Tao, Sens. Actuators, B, 2019, 279, 313 CrossRef CAS
.
- H. Xu, L. M. Xie, H. L. Zhang and J. Zhang, ACS Nano, 2011, 5, 5338 CrossRef CAS PubMed
.
- L. Zhou, L. Pusey-Nazzaro, G. H. Ren, L. G. Chen, L. Y. Liu, W. T. Zhang, L. Yang, J. Zhou and J. G. Han, ACS Nano, 2022, 16, 577 CrossRef CAS PubMed
.
- S. M. Feng, M. C. dos Santos, B. R. Carvalho, R. T. Lv, Q. Li, K. Fujisawa, A. L. Elias, Y. Lei, N. Perea-Lopez, M. Endo, M. H. Pan, M. A. Pimenta and M. Terrones, Sci. Adv., 2016, 2, e1600322 CrossRef PubMed
.
- Q. Z. Hao, S. M. Morton, B. Wang, Y. H. Zhao, L. Jensen and T. J. Huang, Appl. Phys. Lett., 2013, 102, 011102 CrossRef PubMed
.
- H. Xu, Y. B. Chen, W. G. Xu, H. L. Zhang, J. Kong, M. S. Dresselhaus and J. Zhang, Small, 2011, 7, 2945 CrossRef CAS PubMed
.
- S. Almohammed, A. Fularz, F. Y. Zhang, D. Alvarez-Ruiz, F. Bello, D. D. O'Regan, B. J. Rodriguez and J. H. Rice, ACS Appl. Mater. Interfaces, 2020, 12, 48874 CrossRef CAS PubMed
.
- S. Almohammed, F. Y. Zhang, B. J. Rodriguez and J. H. Rice, J. Phys. Chem. Lett., 2019, 10, 1878 CrossRef CAS PubMed
.
- J. Xu, H. X. He, X. X. Jian, K. Z. Qu, J. W. Xu, C. W. Li, Z. D. Gao and Y. Y. Song, Anal. Chem., 2021, 93, 9286 CrossRef CAS PubMed
.
- Y. Yang, W. X. Guo, K. C. Pradel, G. Zhu, Y. S. Zhou, Y. Zhang, Y. F. Hu, L. Lin and Z. L. Wang, Nano Lett., 2012, 12, 2833 CrossRef CAS PubMed
.
- C. Y. Wang, N. Tian, T. Y. Ma, Y. H. Zhang and H. W. Huang, Nano Energy, 2020, 78, 105371 CrossRef CAS
.
- C. H. Li, S. C. Xu, J. Yu, Z. Li, W. F. Li, J. H. Wang, A. H. Liu, B. Y. Man, S. K. Yang and C. Zhang, Nano Energy, 2021, 81, 105585 CrossRef CAS
.
- D. T. You, R. Wang, J. W. Xie, L. Liu, K. W. Li, X. L. Han, T. Guo and C. X. Xu, J. Mater. Chem. A, 2022, 10, 14078 RSC
.
- N. Ma and Y. Yang, Nano Energy, 2017, 40, 352 CrossRef CAS
.
- E. Z. Lin, Z. H. Kang, J. Wu, R. Huang, N. Qin and D. H. Bao, Appl. Catal., B, 2021, 285, 119823 CrossRef CAS
.
- P. P. Lv, J. Qian, C. H. Yang, T. Liu, Y. W. Wang, D. Wang, S. F. Huang, X. Cheng and Z. X. Cheng, Nano Energy, 2022, 97, 107182 CrossRef CAS
.
- Q. Li, Y. B. Liu, J. F. Liu, K. X. Song, H. S. Guo, F. Li and Z. Xu, Adv. Funct. Mater., 2022, 32, 2201719 CrossRef CAS
.
- R. Zheng, M. Y. Yan, C. Li, S. Q. Yin, W. D. Chen, G. Y. Gao, J. M. Yan and Y. Chai, Nanoscale, 2021, 13, 20657 RSC
.
- H. J. Fang, C. Xu, J. Ding, Q. Li, J. L. Sun, J. Y. Dai, T. L. Ren and Q. F. Yan, ACS Appl. Mater. Interfaces, 2016, 8, 32934 CrossRef CAS PubMed
.
- K. W. Zhang, Y. H. Wang, Z. L. Wang and Y. Yang, Nano Energy, 2019, 55, 534 CrossRef CAS
.
- N. Ma, K. W. Zhang and Y. Yang, Adv. Mater., 2017, 29, 1703694 CrossRef PubMed
.
- K. Song, N. Ma and Y. Yang, Adv. Mater. Technol., 2017, 2, 1700221 CrossRef
.
- M. Y. Xie, S. Dunn, E. Le Boulbar and C. R. Bowen, Int. J. Hydrogen Energy, 2017, 42, 23437 CrossRef CAS
.
- T. X. Yang, X. Y. Guo, Y. P. Wu, H. Wang, S. Y. Fu, Y. Wen and H. F. Yang, ACS Appl. Mater. Interfaces, 2014, 6, 20985 CrossRef CAS PubMed
.
- C. Zhang, B. Y. Man, S. Z. Jiang, C. Yang, M. Liu, C. S. Chen, S. C. Xu, H. W. Qiu and Z. Li, Appl. Surf. Sci., 2015, 347, 668 CrossRef CAS
.
- J. W. Stewart, J. H. Vella, W. Li, S. H. Fan and M. H. Mikkelsen, Nat. Mater., 2020, 19, 158 CrossRef CAS PubMed
.
- S. J. Zhang and F. Li, J. Appl. Phys., 2012, 111, 031301 CrossRef
.
Footnote |
| † Electronic supplementary information (ESI) available. See DOI: https://doi.org/10.1039/d3nh00053b |
| This journal is © The Royal Society of Chemistry 2023 |

