Remarkably improved photocatalytic selective oxidation of toluene to benzaldehyde with O2 over metal-free delaminated g-C3N4 nanosheets: synergistic effect of enhanced textural properties and charge carrier separation†
Rajat
Ghalta
 and
Rajendra
Srivastava
 *
*
Catalysis Research Laboratory, Department of Chemistry, Indian Institute of Technology Ropar, Rupnagar, Punjab-140001, India. E-mail: rajendra@iitrpr.ac.in; Tel: +91 1881 232064
First published on 27th January 2023
Abstract
The sustainable production of benzaldehyde by the oxidation of toluene with O2 is a challenging and exciting research area due to the low toluene conversion over the reported catalysts and the importance of benzaldehyde in chemical industries. The photocatalytic toluene oxidation is facilitated by the generation of reactive oxygen species but is limited by charge carrier recombination. Herein a simple metal-free g-C3N4 nanosheet photocatalyst is reported for the selective production of benzaldehyde by toluene oxidation with O2. The efficiency of g-C3N4 was enhanced several folds just by increasing the surface area and incorporating carbon vacancies by a simple thermal treatment at different times. The best photocatalyst was obtained by thermal exfoliation at 500 °C for 3 h in a muffle furnace that exhibited 84.4% toluene conversion and ∼100% benzaldehyde selectivity after 8 h using a 250 W high-pressure Hg lamp with good recyclability. The catalyst exhibited excellent activity in sunlight and produced 78.3% toluene conversion and ∼100% benzaldehyde selectivity after 8 h. Toluene derivatives and other aromatic compounds were converted to their corresponding aldehydes or ketones with good yields and selectivity. The structure–activity relationship studied by catalytic investigation, physicochemical characterization, control reactions, and scavenging studies suggest that the exceptionally high surface area with carbon vacancies in exfoliated g-C3N4 provides higher numbers of efficiently separated charge carriers with a longer lifetime, and facilitates the generation of various reactive oxygen species and holes responsible for the selective production of benzaldehyde with high toluene conversion and apparent quantum yield. A simple, reproducible, eco-friendly, and sustainable metal-free photocatalytic C–H activation under mild conditions would be fascinating to catalysis researchers and materials scientists to develop simple metal-free catalysts for activating other bonds with high dissociation energy to produce industrially important synthetic intermediates.
Introduction
C–H activation (especially sp3 C–H) is challenging due to the high dissociation energy of 440 kJ per mole.1 Moreover, its oxidation is even more challenging because of high-temperature requirements (high energy is needed to activate the C–H bond) and the formation of several oxidation products.1–3 Among the different types of hydrocarbons, the oxidation of toluene is of particular interest because it leads to three products namely benzyl alcohol, benzaldehyde, and benzoic acid. Among these products, benzaldehyde is important because it is a versatile, functional compound bearing the –CHO group and has wide applications in polymer, pharmaceutical, agrochemical industries, etc.4–6 Therefore, selective production of side-chain oxidation of toluene to benzaldehyde is attractive to researchers. In the commercial process, benzaldehyde is produced by the alkali hydrolysis of benzal chloride or the carbonylation of benzene. Both processes are not preferred due to the involvement of toxic reagents or by-product formation. Therefore, selective oxidation of toluene with O2/air is highly preferred.7 Selective aerial oxidation of benzyl alcohol to benzaldehyde is somewhat milder than the selective partial oxidation of toluene to benzaldehyde using O2/air.8,9 An active catalyst is required to activate C–H bonds and oxidants. Researchers developed several homogeneous and heterogeneous catalysts for toluene to benzaldehyde oxidation under mild conditions using H2O2, TBHP, or other peroxide sources.10–13 However, the oxidation of toluene using O2 is much more challenging. Most of the heterogeneous catalysts have produced benzaldehyde in less than 10% yield using these catalytic processes. In general, metal oxide-based catalysts have been developed for this process. For example, facet-dependent CeO2 synthesis, producing CeO2 nanocubes with a highly oxidizing (100) exposed plane, exhibited significantly higher activity than 1D CeO2 nanorods.14 The functionalized surface of CeO2 nanocubes also assisted toluene adsorption and its oxidation to benzaldehyde. Though a very good activity was observed, it involved a cumbersome and costly synthesis strategy. Similarly, CuCr2O4 has been demonstrated to give good conversion of toluene to benzaldehyde using H2O2 as an oxidant.15The high thermal energy requirement of C–H activation can be overcome by sustainable light energy as an energy source.16–18 The idea probably came into mind because several heterogeneous oxidation reactions follow the free radical mechanism, and the degradation of organic compounds to completely oxidized product CO2 is achieved via photocatalytic degradation.8,19–21 The oxidation reaction is assisted by the photogenerated electrons and holes,20,21 whereas the photogenerated holes help the photodegradation of organic compounds.21 The electrons and holes are photogenerated by semiconductors upon light irradiation. Numerous metal oxides with variable band gaps have succeeded in the photogeneration of charge carriers.22–26 Many of them are photocatalytically active under UV radiation, whereas several absorb visible light to generate charge carriers.22–26 The importance of utilizing solar radiation in chemical and fuel production can be realized if the materials absorb light in the visible or IR region. An exciting candidate, carbon nitride (g-C3N4), absorbs light in the visible region.27,28 g-C3N4 is widely investigated in photocatalytic transformations for chemical and fuel production. The metal-free g-C3N4 is fascinating because it has the capability to oxidize organic compounds.27 The basic property of g-C3N4 due to different nitrogen species has been explored in several base-catalyzed reactions29 and CO2 activation.30 Moreover, it can be functionalized with acid groups to catalyze bi-functional catalysis.30 Though g-C3N4 has demonstrated good activity, its activity is still inferior due to the recombination of photogenerated charge carriers. Metal and non-metal doping strategies have been adopted to overcome the recombination process. Moreover, metals/metal oxides have been incorporated in g-C3N4 to prepare heterojunctions to boost photocatalytic activity.31 The efficient separation of charge carriers is possible if the textural properties of g-C3N4, such as the surface area and porosity, are improved. Conventional g-C3N4 has a low surface area (∼30 m2 g−1). Motivated by Hummer's method of graphite exfoliation, in general, the chemical exfoliation method is being adopted to increase the surface area.30,32–34 However, not many encouraging results have been achieved. Therefore, metals and non-metals have been incorporated via doping or heterojunction formation to improve the photocatalytic activity of g-C3N4.35–39 Thus, it is desired to increase the surface area of g-C3N4 to improve the catalytic activity.
Herein a simple, robust, and reproducible synthesis strategy is reported to synthesize a very high surface area of g-C3N4 nanosheets without using any template. An increase in the surface area of 6–7 fold was achieved by a simple but controlled thermal exfoliation of g-C3N4 prepared by the thermal polymerization of urea. This is the first report where a 276 m2 g−1 surface area of exfoliated g-C3N4 was obtained. Also, the thermal exfoliation causes carbon vacancies, which amplify its catalytic activity. Therefore, the catalyst efficiently catalyzed toluene oxidation with a mild oxidant, i.e., O2, upon light irradiation. With this novel photocatalytic strategy of selective oxidation of toluene to benzaldehyde, 84% toluene conversion was achieved for the first time at room temperature. The versatility of this photocatalytic process is demonstrated for side-chain C–H activation of several aromatic compounds. Detailed physicochemical, optical, and photoelectrochemical investigations & scavenging experiments were conducted to understand the possible reasons for the enhancement of the photocatalytic activity of the exfoliated catalyst, and a mechanism for the photocatalytic oxidation of toluene is proposed.
Experimental details
Catalyst synthesis
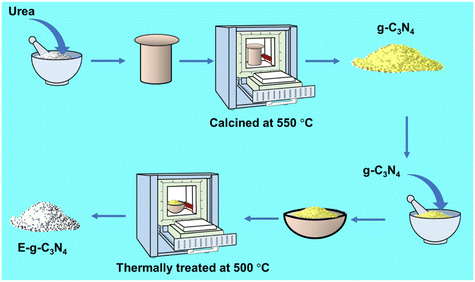
g-C3N4 was synthesized using a capped crucible by thermal pyrolysis of urea at 550 °C. The resulting yellow-colored g-C3N4 was further exfoliated by applying a thermal exfoliation approach for different times (1.5 h to 4 h) at 500 °C in a muffle furnace (Scheme 1). The pale-yellow colored catalyst was obtained after treatment. The detailed catalysis synthesis is provided in the ESI.†Catalytic reaction
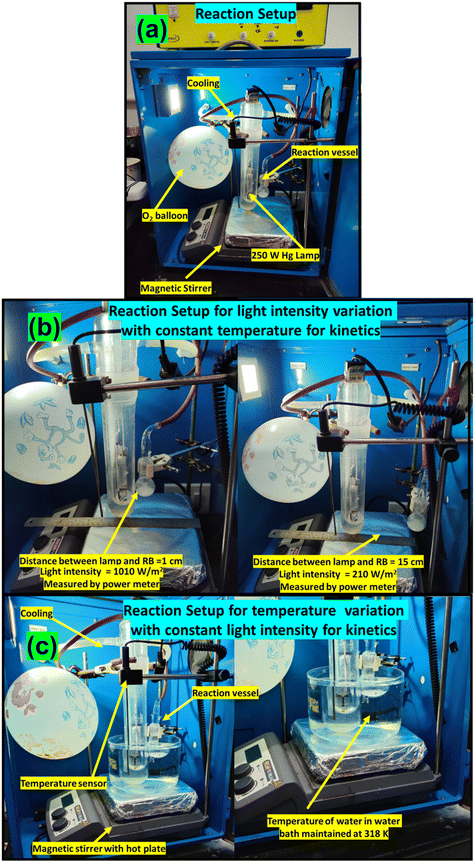
The reactant was mixed with acetonitrile for the photocatalytic reaction, and an oxygen atmosphere was imposed using a balloon. The reaction mixture was exposed to a light source with continuous stirring for a fixed time. The progress of the reaction was monitored using gas chromatography (GC), and the products were identified using GC-MS. The photocatalytic reaction set-up is provided in Fig. 1. The apparent quantum yield (AQY) was calculated following a reported method.40 The details of photocatalytic reactions, photocatalytic reactor set-up, quantification of conversion, selectivity (Fig. S1), and AQY are provided in the ESI.† The procedures for the nitro blue tetrazolium (NBT) test, terephthalic acid (THA) test, and iodometric test for H2O2 detection are provided in the ESI.†Results and discussion
Physicochemical characterization
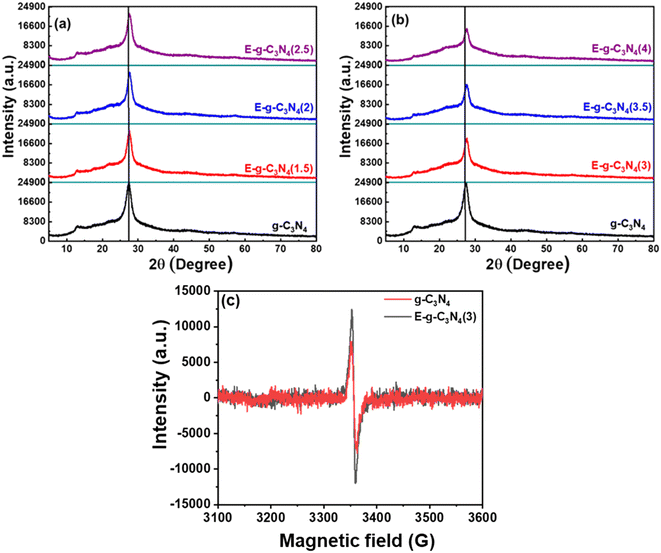
X-ray diffraction patterns of pristine and exfoliated catalysts are shown in Fig. 2a. The diffraction peak at 27.7° for pristine g-C3N4 can be indexed to the (002) diffraction plane, indicating graphitic materials with an interlayer stacking structure (JCPDS 87-1526).41 Additionally, a diffraction peak is found at ∼13.1° and is indexed to the (100) diffraction plane, enlightening the interplanar structural packing.42 On exfoliation of the catalyst, it loses its layered structure and is subsequently accompanied by broadening in the (002) diffraction peak (Fig. 2a and b).43 Likewise, the (100) peak also diminished with exfoliation, justifying the exfoliation of the layered structure.44 The extent of exfoliation grows with the rise in thermal treatment duration (1.5 h to 4 h) and is observed in XRD patterns. Both peaks lose their intensity through broadening in the order of E-g-C3N4(4) > E-g-C3N4(3.5) > E-g-C3N4(2.5) > E-g-C3N4(2) > E-g-C3N4(1.5) > g-C3N4. E-g-C3N4(4) experienced extreme structural distortions among all exfoliated catalysts. Moreover, the decrease in the intensity can be correlated to the introduction of carbon vacancies during exfoliation (discussed later), which affects the crystallization of g-C3N4 and could ameliorate its activity.45FT-IR analysis was performed for exfoliated and pristine g-C3N4 catalysts to elucidate the changes in chemical bonding, structure, and functional groups after the exfoliation process (Fig. S2a and b†). The FT-IR spectra of pristine and exfoliated g-C3N4 catalysts look alike. The multiple peaks observed at 1150 cm−1 to 1650 cm−1 are due to the C–N stretching and heterocyclic aromatic C–N.46 The N–H stretching and O–H stretching of surface oxygen cause a broad spectrum from 3000 cm−1 to 3450 cm−1, whose intensity increased with exfoliation, signifying more exposed –NH2 groups due to the unwrapping of sheets and the introduction of surface oxygen after thermal exfoliation.32,47 The sharp peak at 810 cm−1 was created because of the heptazine ring system,48 and it became sharp with exfoliation, which is ascribed to the more ordered packing of tri-s-triazine units.49 Therefore, it is suggested that the catalyst was chemically stable after the thermal treatment of exfoliation.
The thermal stability of the catalyst was evaluated by recording the thermograms of all the catalysts in the air. The pristine g-C3N4 was stable till 500 °C (Fig. S3†), but after that, it started losing weight with a further rise in the temperature. The catalyst degraded at 700 °C in the air atmosphere. Therefore, 500 °C was chosen as the best temperature for thermal exfoliation. After exfoliation, similar TGA curves were obtained for all the catalysts (Fig. S3†). However, with a rise in exfoliation time, the decay curve slightly shifted towards a higher temperature. Therefore, the catalyst retains its thermal stability till 500 °C even after exfoliation.
The exfoliation of pristine g-C3N4 by thermal treatment is expected to tailor the textural properties. It was verified by N2-adsorption analysis (Fig. S2c–e†). The exfoliated catalyst exhibited a larger surface area than the pristine g-C3N4, and the surface area of the exfoliated catalyst increased with an increase in the time of thermal exfoliation (Table 1). Thermal treatment generates more surface area and is expected to increase the efficiency of the catalyst. With thermal treatment, a six to seven-fold rise in the surface area of the pristine g-C3N4 was observed. After 4 h of thermal treatment, the saturation point arrived, and no further increase in surface area was experienced. After 5 h of exfoliation (E-g-C3N4(5)), the surface area slightly decreased. However, the yield of the catalyst prepared after 5 h of thermal treatment was modest; therefore, it was not our choice for further characterization.
| Entry | Catalyst | BET surface area (m2 g−1) | Total pore volume (cm3 g−1) |
|---|---|---|---|
| 1 | g-C3N4 | 45 | 0.253 |
| 2 | E-g-C3N4(1.5) | 130 | 0.529 |
| 3 | E-g-C3N4(2) | 155 | 0.839 |
| 4 | E-g-C3N4(2.5) | 185 | 0.929 |
| 5 | E-g-C3N4(3) | 195 | 1.037 |
| 6 | E-g-C3N4(3.5) | 232 | 1.267 |
| 7 | E-g-C3N4(4) | 276 | 1.351 |
| 8 | E-g-C3N4(5) | 210 | 1.142 |
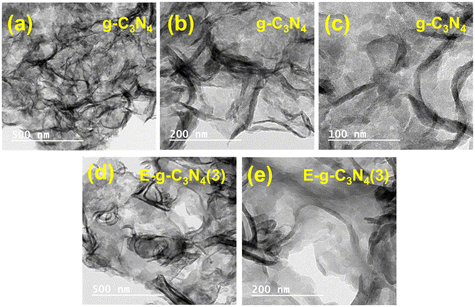
The morphology of the pristine and exfoliated g-C3N4 was investigated using the SEM images recorded at different magnifications (Fig. S4†). The pristine g-C3N4 shows an aggregation of flakes and nonporous architecture.50 E-g-C3N4(1.5) was less aggregated than the pristine g-C3N4, indicating that the thermal exposure opened the catalyst layers. With the rise in exfoliation time, the layers of the catalyst opened up. The degree of exfoliation was prominent till 3 h of exfoliation; after that, the thermal treatment started aggregating the spherical morphology (Fig. S4g and h†). The extent of exfoliation was also investigated by the TEM analysis of g-C3N4 and E-g-C3N4(3). E-g-C3N4(3) shows a sheet-like morphology, and with thermal treatment, the g-C3N4 sheets got exfoliated (Fig. 3). The exfoliation provides more exposed active surface sites for the reactant adsorption and its photocatalytic conversion.
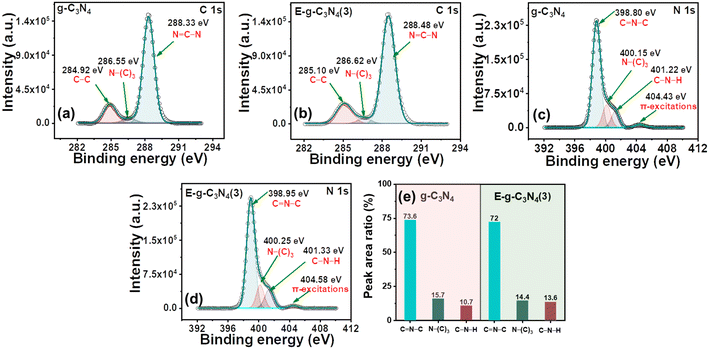
g-C3N4 and E-g-C3N4(3) show a similar XPS spectrum. The XPS survey spectra of both materials confirm that they are made up of carbon, nitrogen, and a modest amount of oxygen (Fig. S5a and b†). The deconvoluted high-resolution spectrum of C 1s of pristine g-C3N4 consists of three peaks, the peak with a binding energy of 284.92 eV is for the C–C coordination of surface adventitious carbon, and the peak at 286.55 eV is assigned to (C)3–N bonded carbon. In addition, the peak at 288.33 eV corresponds to sp2-bonded carbon (N–C–N) (Fig. 4a).51 E-g-C3N4(3) shows a similar spectrum for C 1s with three peaks at 285.10 eV, 286.62 eV, and 288.48 eV (Fig. 4b). A positive shift in the binding energy was observed for E-g-C3N4(3). The high-resolution peak for N 1s was deconvoluted into three peaks at 398.80 eV, 400.15 eV, and 401.22 eV, corresponding to C–N–C, N(C3), and NHx groups for pristine g-C3N4 (Fig. 4c).52 One peak at 404.43 eV was also observed due to π to π* transitions.53 Exfoliated g-C3N4 shows a similar spectrum for N 1s, having three deconvoluted peaks at 398.95 eV, 400.22 eV, and 401.37 eV with one π to π* peak at 404.50 eV (Fig. 4d). Positive shifts in the binding energy for C 1s and N1s of the exfoliated catalyst are observed and attributed to the carbon vacancy,54 which was confirmed by the XPS elemental analysis and bulk elemental analysis (Table S1†). The carbon content was low in the exfoliated catalyst (Table S1†). The N/C atomic ratios in pristine g-C3N4 and E-g-C3N4(3) obtained from the quantitative analysis of XPS data were 1.17 and 1.22, which confirms the carbon vacancy.55 The C/N ratio from XPS and bulk elemental analysis confirms the carbon vacancy in E-g-C3N4(3). E-g-C3N4(3) exhibited a higher C–N–H peak area but lower N–(C)3 and C![[double bond, length as m-dash]](https://www.rsc.org/images/entities/char_e001.gif) N–C area (Fig. 4e), further suggesting that E-g-C3N4(3) has carbon vacancies in the sample, which is consistent with a reported article.56 The high-resolution deconvoluted O 1s spectrum of g-C3N4 shows two peaks with binding energies of 532.49 eV and 533.92 eV, corresponding to the surface oxygen of hydroxyl groups (O–H) and the (O–N) intermediates, which formed as the intermediates of urea thermal-polymerization (Fig. S5c†).43 In the exfoliated catalyst (Fig. S5d†), the XPS analysis shows a rise in the content of surface O–H species.
N–C area (Fig. 4e), further suggesting that E-g-C3N4(3) has carbon vacancies in the sample, which is consistent with a reported article.56 The high-resolution deconvoluted O 1s spectrum of g-C3N4 shows two peaks with binding energies of 532.49 eV and 533.92 eV, corresponding to the surface oxygen of hydroxyl groups (O–H) and the (O–N) intermediates, which formed as the intermediates of urea thermal-polymerization (Fig. S5c†).43 In the exfoliated catalyst (Fig. S5d†), the XPS analysis shows a rise in the content of surface O–H species.
Further, the EPR spectra were recorded at room temperature to detect the vacancy defect in the catalyst.57 The EPR spectra in the dark for g-C3N4 and E-g-C3N4(3) exhibited a single Lorentzian line with a g-factor of ∼2.005, indicating that g-C3N4 and E-g-C3N4(3) contain one type of paramagnetic species.57 In g-C3N4, the unpaired electrons are in the localized π-conjugated structure of the tris-s-triazine unit rather than the electron pairs of σ bonds, 2pz orbit, or lone pair of bridging nitride atoms. These electron pairs have the opposing spin magnetic moment and do not produce an EPR signal. The EPR signal in g-C3N4 and E-g-C3N4(3) was observed due to the unpaired electrons in the localized π-conjugated structure of the tris-s-triazine unit.58 It was observed that the intensity of the EPR signal over E-g-C3N4(3) was higher than that over g-C3N4, which is attributed to more defects in nanostructured E-g-C3N4(3) than in bulk g-C3N4. Such a defect is possible from the carbon and nitrogen vacancy in the π-conjugated structure, increasing the unpaired electron density.59 The bulk elemental analysis and elemental analysis from XPS confirmed a carbon vacancy in E-g-C3N4(3) (lower C/N ratio or higher N/C ratio) compared with g-C3N4 (Table S1†).
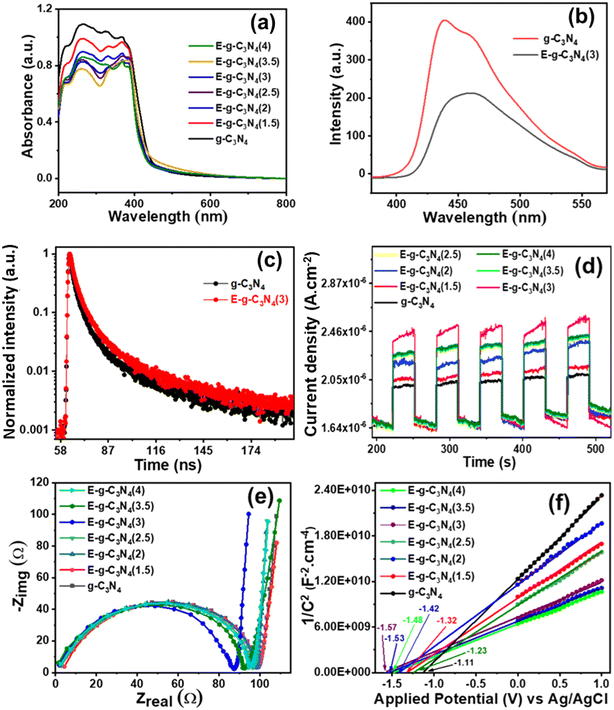
The light absorption capability and band structure of pristine and exfoliated g-C3N4 were evaluated with diffuse reflectance ultraviolet-visible spectroscopy (DRUV-vis) (Fig. 5a). The pristine g-C3N4 shows an absorption band in the visible region. The exfoliated g-C3N4 experienced a blue shift in the absorption spectrum. As the exfoliation time increased, the color of g-C3N4 became lighter and experienced a larger blue shift. The exfoliation of g-C3N4 raised its bandgap and made it a photocatalyst with good charge separation. To examine the bandgap of pristine and exfoliated g-C3N4, the Tauc plot with equation (αhν)1/r = β(hν − Eg) was used.60 The equation relates the photon energy (hν) to the absorption coefficient (α), where the parameter Eg signifies the bandgap of the catalyst, constant β is recognized as the band tailing parameter, and r is the power factor that depends on the type of transition. Commonly, for direct transition r = ½, whereas for indirect transition, r = 2.61 In the present study, r = ½ was a suitable fit for (αhν)1/rvs. photon energy (hν) plots that gave straight lines. The band gap for direct allowed transitions was estimated by extrapolating these lines (Fig. S6†).62,63
The photoluminescence (PL) spectra were recorded by setting the excitation wavelength to 330 nm to know the effective charge separation in pristine g-C3N4 and exfoliated E-g-C3N4(3) (Fig. 5b). The pristine g-C3N4 shows a broad emission peak in the visible region. In contrast, the exfoliated catalyst shows a narrower spectrum with a lower peak intensity with a peak maximum at 458 nm. The quenching of PL in E-g-C3N4(3) indicates a relatively lower photogenerated charge carrier recombination rate.64 The better charge separation in E-g-C3N4(3) is due to the introduction of carbon vacancies during exfoliation, which traps the charge carriers. Carbon vacancies of exfoliated catalysts can capture electrons and retard the radiative recombination of electrons and holes.54
Time Correlated Single Photon Counting (TCSPC) was performed for pristine g-C3N4 and exfoliated E-g-C3N4(3). Fig. 5c displays the decay curves for both samples with an excitation wavelength of 330 nm. The decay in intensity with luminescence was studied using the following equation.  , where n is the number of discrete emissive species, yo corresponds to baseline correction, αi are the pre-exponential factors and τi designates a time for excited-state luminescence decay related to the ith component.65 The value of ∑αi was normalized to 1. The equation
  was used to calculate the average decay time, 〈τ〉.21 The fractional contribution fi for each decay was calculated by using
  , and it was also normalized to 1.35 The decay curve was fitted using four (n = 4) exponential decay response functions.66 All the calculated parameters are listed in Table S2.† The average decay lifetime was 1.55 times higher in the exfoliated E-g-C3N4(3) sample than the pristine g-C3N4. Therefore, TCSPC analysis confirmed that the exfoliated E-g-C3N4(3) exhibited a better life than pristine g-C3N4, indicating the coupling effect of the carbon vacancies and exfoliated nanosheets that effectively obstruct the recombination of charge carriers.67
Photoelectrochemical measurements
The photoelectrochemical activity of the catalyst was evaluated using linear sweep voltammetry (LSV), on–off photocurrent measurement (i–t), and electrochemical impedance spectroscopy (EIS). For band edge calculation, Mott–Schottky (M–S) plots were drawn. LSV was conducted under dark and light illumination (Fig. S7a and b†). The photocurrent density rose with applied potential under both dark and light-illuminated conditions for g-C3N4. In light, g-C3N4 showed a higher current density of 190 × 10−6 A cm−2 at an applied potential of 1.5 V vs. Ag/AgCl than in the dark (current density, 101 μA cm−2), indicating that g-C3N4 is photochemically active. On exfoliation of g-C3N4, the catalyst exhibited a boost in photocurrent density at an applied potential of 1.5 V vs. Ag/AgCl under dark (189 × 10−6 A cm−2) and light (298 × 10−6 A cm−2) conditions. A high photocurrent density signifies the brilliant capability of materials to photo-generate and transfer charge carriers. The acquisition of the highest photocurrent density by E-g-C3N4(3) over applied potential proposes the ejection of a large number of charge carriers and/or low recombination of electron and hole pairs with good photo-absorption capability.Moreover, the photo responses of pristine and exfoliated photocatalysts were surveyed by transient photocurrent analysis (i–t) (Fig. 5d). The photocatalysts exhibited enhancement in the response current during light illumination and returned to their initial state when the light was switched off. The transient photocurrent responses of all the catalysts were analyzed for many test cycles to check the stability of the photocurrent. It was discovered that both catalysts show stable photocurrent in every test cycle. The exfoliated catalyst showed a higher photocurrent response than the pristine catalyst. Among exfoliated catalysts, E-g-C3N4(3) showed the best photocurrent response, and it follows the trend: E-g-C3N4(3) > E-g-C3N4(4) > E-g-C3N4(2.5) > E-g-C3N4(2) > E-g-C3N4(1.5). It proves that E-gC3N4(3) is the most photoelectrochemically active catalyst. An evident increase in the photocurrent response can be ascribed to the rise of conductivity.68 The electrical conductivity (σ) can be related to carrier concentration (N) by the equation σ = Neμ, where e is the carrier charge, and μ is the mobility.69 Therefore, the exfoliated E-g-C3N4(3) generated more charge carriers than the other analyzed photocatalysts upon light illumination.
EIS provides information regarding interface properties like the charge transfer of an electrode–electrolyte system. EIS performed in the dark was fitted in the Nyquist plots (Fig. 5e). The semicircle feature is apparent in the impedance spectra of all the photocatalysts. The semicircle diameter in Nyquist plots is directly related to the reaction rate.70 The semicircle arc's diameter relates to interfacial charge transfer resistance (Rct) at the electrode–electrolyte system.71 The smaller semicircle diameter (Rct) of the exfoliated catalysts than the pristine ones indicates an effective charge separation and a faster interfacial charge transfer.72 Among all the exfoliated catalysts, E-g-C3N4(3) exhibited the smallest Rct value, making it the most photoactive catalyst.
Mott–Schottky plots in Fig. 5f are presented to analyze the band edge potentials and electronic properties. The plots fit the equation 1/C2 = 2 [V − Vfb − (kbT/e)]/(εε0eA2Nd) (C = space charge capacitance, V = applied potential, Vfb = flat band potential, k = Boltzmann constant, T = temperature, e = electron charge (1.602 × 10⁻¹⁹ C), ε0 = vacuum permittivity (8.85 × 10⁻¹⁴ F cm−2), εr = dielectric constant, and Nd = donor density).73 M–S plots exhibited a positive slope over applied potential versus 1/C2, which suggests an n-type semiconductor.74 The slope values of the plots are reported in Table S3,† and the slope values can be directly related to donor density. The Mott–Schottky plots of the exfoliated catalysts show a smaller slope than the pristine ones, suggesting a higher donor density in the exfoliated catalyst. The flat band potentials (Efb) were obtained from the x-intercept of Mott–Schottky plots for pristine and exfoliated catalysts. The flat band potential for g-C3N4 was −1.11 V vs. Ag/AgCl. The exfoliated catalyst showed a more negative flat band potential than the pristine one. The values of the flat band potential of all the exfoliated catalysts are presented in Table S3.† Among all the exfoliated catalysts, E-g-C3N4(3) shows the most negative flat band potential (−1.57 V vs. Ag/AgCl). The conduction band (CB) position is very close to the flat band potential for an n-type semiconductor.75 The Efb value was used to calculate the conduction band edge potential using the relation Ecb = Efb −0.1 V.76 The calculated Ecb values of all the photocatalysts are shown in Table S3.† To investigate the complete band structure of the photocatalyst, it is necessary to find the valence band edge potential. The bandgap (Eg) can be related to the band edges using the relation EVB = ECB + Eg.77 All the calculated potential is versus the Ag/AgCl scale. The equation (ENHE = EAg/AgCl + 0.197) was used to convert them to a standard scale.78 The most negative flat band potential and conduction band potential values in exfoliated E-g-C3N4(3) could be due to the carbon vacancy (Fig. S8†).45
The band structure of g-C3N4 and E-g-C3N4(3) was investigated by combining ultraviolet photoelectron spectroscopy (UPS), valance band XPS (VB-XPS), and DRUV-vis spectra. The valence band maximum (VBM) values of g-C3N4 and E-g-C3N4(3) were located at 1.51 eV and 1.36 eV vs. vacuum in VB-XPS spectra (Fig. 6a and c), corresponding to their Fermi levels (EF).79 The Fermi level of the photocatalyst was obtained by determining the work function Φ from UPS spectra, which denotes the difference in energy between the Fermi level and vacuum.80 From the UPS spectra presented in Fig. 6b and d, the Φ values of g-C3N4 and E-g-C3N4(3) were calculated to be 4.73 eV and 4.43 eV using the relation Φ = 21.22 − ESE cut off + Ecut off, where 21.22 eV is the energy of the HeI photon, Ecut off is the cut-off energy located in UPS spectra, and ESE cut off is the secondary electron cut-off.81 Thus, the Fermi levels of g-C3N4 and E-g-C3N4(3) were 4.73 eV and 4.43 eV vs. Evac. Combining the results of VB-XPS, DRUV-vis, and UPS spectra, the calculated CB and VB values of g-C3N4 were 3.52 eV and 6.24 eV vs. vacuum, and the CB and VB values of E-g-C3N4(3) were 3.03 and 5.79 eV (Fig. 6e). The Fermi level represents the highest level that an electron can occupy. The exfoliation decreased the work function of g-C3N4 from 4.73 eV to 4.43 eV. The material with a lower work function value and low Fermi level can more easily transfer the electron to the vacuum. Therefore E-g-C3N4(3) can more efficiently transfer its photogenerated electrons to the surface where they participate in the photo redox process and show good photoactivity. The band edge values are in Evac, and it can be converted to ENHE by adding it with −4.44 ± 0.02 eV.82 The band structures of g-C3N4 and E-g-C3N4(3) presented in Fig. 6e are well matched with the band structure determined from the Motty–Schottky plots with a marginal shift. The carbon vacancy could be a possible reason for the uplifting of CB and VB positions.67 The uniform charge delocalization occurs on the VB maximum and CB minimum of heptazine rings in g-C3N4 due to the high symmetry of the planar structure of g-C3N4. Redistribution of the charge density occurs in carbon-deficient g-C3N4 that causes uplifting of the CB and VB potential of g-C3N4.56,83
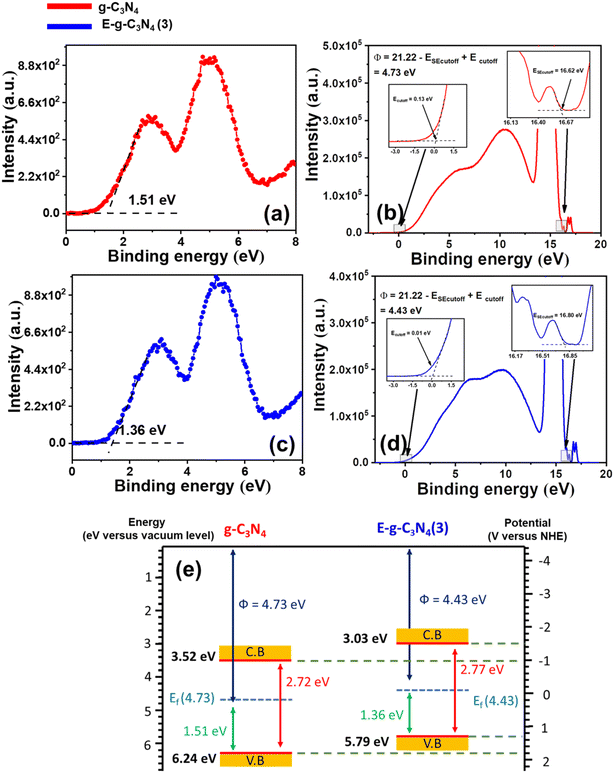 | ||
| Fig. 6 (a) VB-XPS spectrum of g-C3N4, (b) UPS spectrum of g-C3N4, (c) VB-XPS spectrum of E-g-C3N4(3), (d) UPS spectrum of E-g-C3N4(3), and (e) band structures of g-C3N4 and E-g-C3N4(3). | ||
Photocatalytic activity
The photocatalytic oxidation of toluene was performed using pristine g-C3N4 in an oxygen atmosphere for 8 h with a 250 W Hg lamp at room temperature. First, the catalyst amount was varied to optimize the reaction. The best activity was found with 25 mg of catalyst (31.2% toluene conversion) (Fig. 7a). The amount of catalyst was fixed at 25 mg for further reactions. To optimize the light source, the reaction was performed with different light sources. The result shows that the reaction afforded the best activity with a 250 W Hg lamp (Fig. 7b). In sunlight, the conversion was good (29.9% toluene conversion) after 8 h (4 h + 4 h, on two different days, the reaction mixture was placed in the refrigerator overnight without light). In a household 20 W LED, the toluene conversion was low (4.8% toluene conversion). The results show that the 250 W Hg lamp and sunlight were suited well for this reaction. Still, for further optimization, a 250 W Hg lamp was used.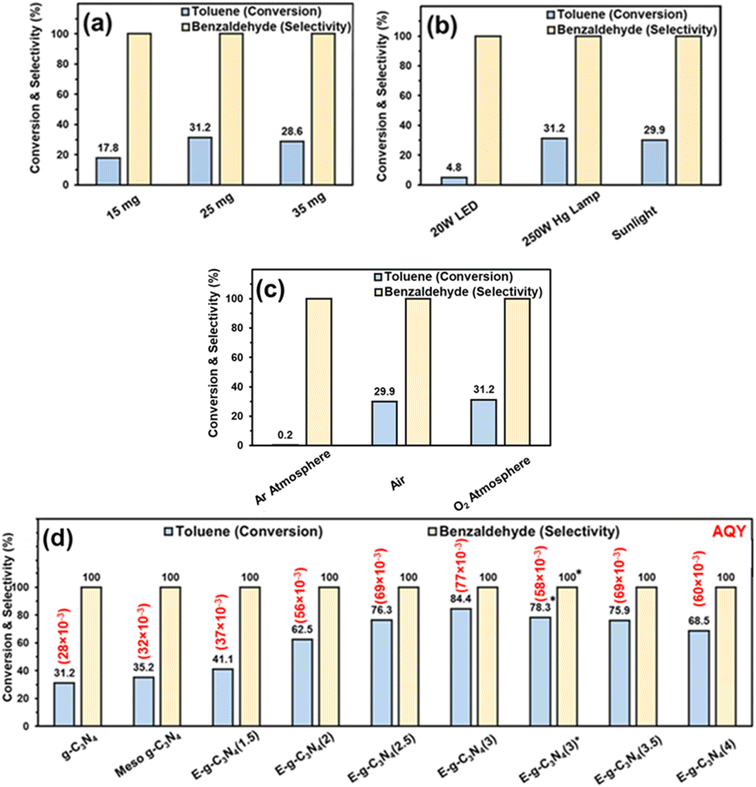 | ||
| Fig. 7 Toluene oxidation with – (a) different catalyst amounts (reaction conditions – g-C3N4 (various amount), light source (250 W Hg lamp), toluene (0.05 mmol), acetonitrile (3 ml), and O2 balloon), (b) different light sources (reaction conditions – g-C3N4 (25 mg), light source (various), toluene (0.05 mmol), acetonitrile (3 ml), and (O2 balloon)), (c) different atmospheres (reaction conditions – g-C3N4 (25 mg), light source (250 W Hg lamp), toluene (0.05 mmol), acetonitrile (3 ml), and different atmospheres), and (d) different catalysts (reaction conditions – catalyst (25 mg), light source (250 W Hg lamp), toluene (0.05 mmol), acetonitrile (3 ml), and O2 balloon). *Reaction conducted in sunlight. Apparent quantum yield (AQY) is provided in parentheses, and the calculation method is provided in the ESI.† | ||
For the reaction, an oxygen atmosphere was chosen because the oxygen molecules abstract the electrons generated by the photocatalyst, form superoxide, and are involved in the oxidation of toluene (discussed later in the mechanism part). The reaction was performed in different atmospheres, i.e., air and inert Ar atmosphere (Fig. 7c). The reaction vessel was purged with Ar, and then the vessel was fitted with an Ar balloon, and the reaction was conducted. In an Ar atmosphere, the toluene conversion was drastically reduced to 0.2%, demonstrating the role of oxygen in the reaction. In contrast, in air, the catalyst afforded somewhat similar activity to that in the oxygen atmosphere, further confirming the role of O2 in the reaction.
The activity of g-C3N4 for toluene oxidation was low. It may be an excellent strategy to increase the surface area of the catalyst to increase the catalyst activity. Firstly, the hard template technique was employed to increase the surface area. SBA-15 was used as a hard template, and mesoporous g-C3N4 was synthesized. Toluene oxidation was performed using mesoporous g-C3N4. Only a marginal improvement in toluene conversion was obtained over meso-g-C3N4 (Fig. 7d). Therefore, an exfoliation strategy was adopted to increase the surface area of the pristine g-C3N4.
The catalyst was exfoliated using thermal treatment. The catalyst was treated at 500 °C in a crucible. The temperature was optimized to 500 °C because, above that temperature, a higher weight loss of the catalyst was observed. Firstly, thermal treatment was employed for 1.5 h, and 300 mg of pristine g-C3N4 was kept in a crucible in a muffle furnace. After the thermal treatment for 1.5 h, the catalyst amount was reduced to 170 mg, but the volume remained almost the same, which indicated that the material (designated as E-g-C3N4(1.5)) became fluffy. Further, E-g-C3N4(1.5) was employed in the toluene oxidation reaction under the optimized conditions, and 41.1% toluene was converted into benzaldehyde (Fig. 7d). It encouraged further exfoliation of the catalyst for longer times. Therefore, the pristine catalyst was exfoliated at different times. With an increase in the exfoliation time, the weight of the catalyst reduced, but the volume remained the same. For example, upon thermal treatment of 300 mg of g-C3N4 for 1.5 h, 2.0 h, 2.5 h, 3.0 h, 3.5 h, and 4.0 h, the amount of sample was reduced to 170, 151, 135, 110, 98, and 85 mg, respectively. Therefore, the fluffiness of the catalyst increased with a rise in the duration of thermal treatment. The 50 mg of pristine g-C3N4 and 50 mg of exfoliated catalysts obtained at different times were taken in separate vials to show the difference in weight-to-volume ratio. A digital image of the vials is shown in (Fig. S9†). The volume of 50 mg catalyst increased with the rise in the exfoliation time. Toluene oxidation was performed with all the exfoliated catalysts. As the extent of exfoliation increased, the toluene conversion increased (Fig. 7d). The catalytic data suggested that up to an exfoliation time of 3 h, the toluene conversion was increased. The best activity was found for E-g-C3N4(3) (84.4% toluene conversion). After that, a decrease in conversion was observed, but the selectivity of all the catalysts remained the same. Thus 3 h of exfoliation was found to be the best time of exfoliation to achieve the best activity. E-g-C3N4(3) afforded 78.3% toluene conversion and ∼100% benzaldehyde selectivity after 8 h in sunlight (Fig. 7d). The AQY for all the catalysts are provided in parentheses of Fig. 7d.
The influence of the substituent was investigated. For a better comparison, the reaction time was reduced to 6 h instead of 8 h, and all other experimental conditions were kept constant. The electron-withdrawing substituent (p-nitro toluene) afforded ∼100% conversion, whereas toluene afforded 60% conversion in 6 h. The conversion of p-methoxy toluene was lower (81%) than p-nitro toluene but higher than toluene. It suggests that substituents improve the reactant activity, but the withdrawing group improved the activity more than the donating substituents (Table 2). Interestingly, p-xylene afforded p-methyl benzaldehyde selectively with ∼100% conversion. p-Xylene was more reactive for the photocatalytic oxidation reaction than toluene because the donating group facilitated the oxidation. Therefore, the catalyst could selectively oxidize p-xylene into p-methyl benzaldehyde. Similarly, 95% diphenylmethane was converted, and selectively benzophenone was formed (Table 2). The AQY is provided in Table 2 for all the substrates. The developed catalyst exhibited better activity than previously reported catalysts, especially metal-free ones (Table S5†). Comparing our reaction with other reported reactions in the literature in accordance with AQY is difficult because most of the reported manuscripts didn't report AQY; only one piece of literature has reported AQY (Table S5†).17,22,25,26,84 The developed E-g-C3N4(3) afforded 11 times higher activity than the reported one.
| Substrate | Conv. (%) | Product | Select. (%) | AQY |
|---|---|---|---|---|
| Reaction conditions: E-g-C3N4(3) (25 mg), light source (250 W Hg lamp), reactant (0.05 m mol), solvent acetonitrile (3 ml), time (6 h), and oxygen atmosphere (O2 balloon).a Reaction conducted in sunlight. The calculation method for apparent quantum yield (AQY) is provided in the ESI.† | ||||
Toluene |
60.5 | Benzaldehyde |
∼100 | 74 × 10−3 |
Toluene |
55.7a | Benzaldehyde |
∼100a | 56 × 10−3 |
4-Nitrotoluene |
∼100 | 4-Nitrobenzaldehyde |
∼100 | 123 × 10−3 |
4-Methyl anisole |
81 | 4-Methoxy benzaldehyde |
∼100 | 99 × 10−3 |
p-Xylene |
∼100 |

|
∼100 | 123 × 10−3 |
Diphenylmethane |
95 | Benzophenone |
∼100 | 117 × 10−3 |
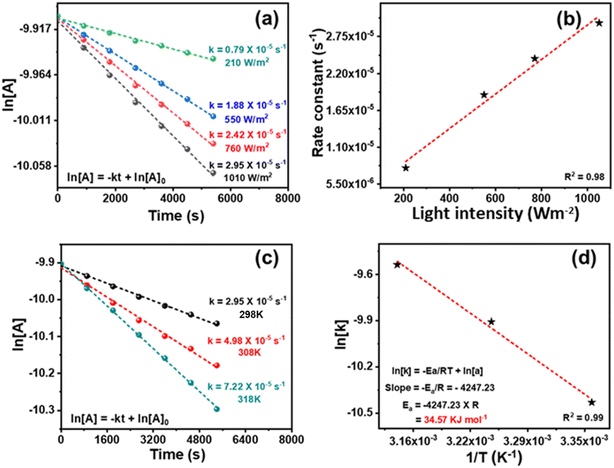
The kinetics of the reaction was studied. During the initial duration, benzyl alcohol was also detected along with benzaldehyde (Fig. S10 and S11†). The toluene conversion was plotted for different order equations, and a linear graph was obtained by following the first-order rate equation (Fig. 8a). The slope of a straight line of the plot gives the rate constant (k) 2.95 × 10⁻⁵ s−1. The reaction is photocatalytic, and the reaction kinetics would be dependent on the power of the light source. The ln[Tol conc.] vs. time was plotted for reactions conducted using different light intensities. The kinetic profiles (Fig. 8a) show the decrease in k from 2.95 × 10⁻⁵ to 0.79 × 10⁻⁵ s−1 upon decreasing the light intensity from 1010 to 210 W m−2 [by placing the reaction vessel at a different distance from the light source (Hg lamp)] (Fig. 1b). A linear correlation between light intensity and rate constant (R2 = 0.98) was observed (Fig. 8b), which shows that the reaction kinetics is light intensity-dependent. To calculate the apparent activation energy (Ea), the reaction was performed at variable temperatures (Fig. 1c). Though the reaction took place at ambient temperature but just for the sake of calculating the activation energy, the temperature was varied from 25–45 °C.85 The rise in temperature boosted the reaction rate and increased the rate constant (Fig. 8c). The Arrhenius equation gives the value of apparent activation energy of 34.6 kJ mol−1 (Fig. 8d). The reaction was light intensity-dependent; thus, a low-temperature coefficient was found. It may be noted that without light, toluene conversion did not occur in 25–45 °C. Moreover, the catalyst was inactive without light, even at a higher temperature (45 °C). The reaction is mainly photogenerated electron and hole-driven, and its rate depends on the quantity of generated charge carriers. Still, the oxidation rate increased with rising temperature at a fixed light intensity.
The reaction conducted in different atmospheres using the exfoliated E-g-C3N4(3) catalyst shows that O2 was required for the oxidation of toluene (Fig. S12a†). In Ar and N2 atmospheres, 0.3% and 1.2% toluene conversions were observed. It was due to the trace amount of dissolved oxygen in the reaction mixture (Fig. S12a†). The toluene oxidation was carried out in the presence of TEMPO, a radical scavenger. A drastic decrease in the toluene conversion was found (Fig. S12b†). It proves the formation of various radical species (electrons, holes, superoxide, and hydroxide radicals) as intermediates in the photocatalytic oxidation reaction. The generation of free radicals upon light irradiation over g-C3N4 is well documented.86–88 The electron scavenger study was conducted to learn the role of electrons in the photocatalytic oxidation reaction. Two scavengers were used, i.e., CCl4 and formic acid. The toluene conversion declined to 35.6% with CCl4 and 30.1% with formic acid (Fig. S12c†). It confirms that the photogenerated electrons play a vital role as O2 is converted into superoxide radicals. To ensure the generation of superoxide radicals, an NBT test was performed. With the generation of the superoxide radical, the concentration of NBT decreased. NBT suffers reduction by superoxide, which forms diformazan (dark blue-colored insoluble precipitate) (Fig. S13a†). g-C3N4 and exfoliated E-g-C3N4(3) were capable of producing superoxide from oxygen. A more significant quenching of absorption suggests that E-g-C3N4(3) was more proficient in generating superoxide radicals. Further, the quenching of superoxide was achieved with hydroquinone and benzoquinone as superoxide scavengers. The toluene conversion decreased to 51.2% in hydroquinone and 45.7% in benzoquinone (Fig. S12d†). The holes were generated simultaneously with the electron, and they also played an important role. Toluene oxidation was performed with triethanolamine (TEA) and ethylenediaminetetraacetic acid (EDTA) as hole scavengers. The toluene conversion decreased in both scavengers. In TEA, the toluene conversion was 10.6%, while in EDTA, it was 16.5% (Fig. S12e†). The hole scavengers drastically decreased the activity of the catalyst. Therefore, the holes also facilitated photocatalytic oxidation. The involvement of OH radicals as an intermediate in the reaction was confirmed via fluorescence quenching using terephthalic acid (THA) (Fig. S13b†). The experiments were conducted with g-C3N4 and E-g-C3N4(3). There is a generation of OH radicals in both cases, but E-g-C3N4(3) generated more radicals because of its higher activity. Scavenging experiments for OH radicals in the presence of tert-butyl alcohol (TBA) and methanol (MeOH) as scavengers were conducted. In TBA, the toluene conversion decreased to 26.9%, and in MeOH, the conversion decreased to 24.5% (Fig. S12f†). It suggests that the quenching of OH radicals terminates photocatalytic oxidation. The valence band of the catalysts is not capable of direct generation of OH radicals ([Eθ (OH−/˙OH) = 2.40 eV] vs. NHE, pH 7).89 Therefore, the catalyst generated the OH radicals indirectly via the degradation of the in situ generated H2O2. The formation of H2O2 was confirmed by an iodometric test (Fig. S13c†). H2O2 was generated from the superoxide ion (discussed later).
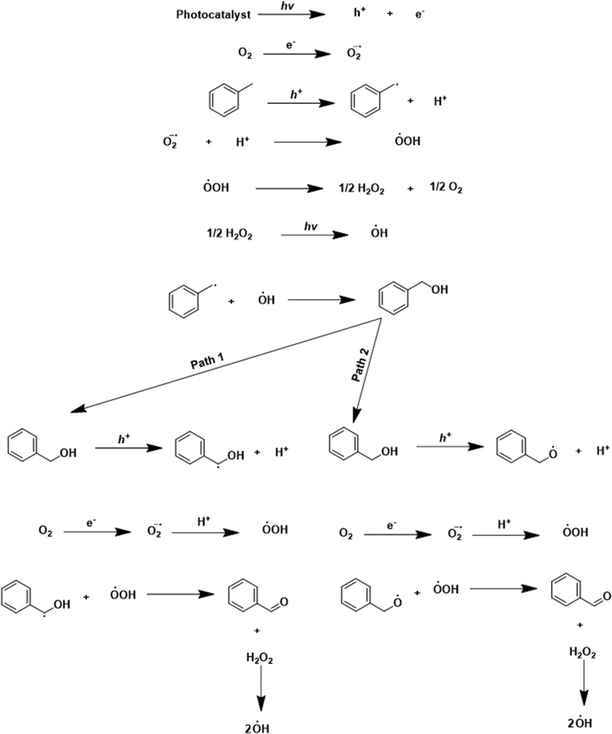
Based on the catalytic activity data, control experiments, scavenging studies, and characterization results, a plausible mechanism for the oxidation reaction is presented in Scheme 2. In the beginning, reactant molecules were adsorbed on the catalyst surface. Upon light irradiation, the charge carriers (electron and hole pairs) were generated. These pairs migrated to the catalyst's surface, where the reactant molecule was adsorbed. The electron (e−) was consumed in the reduction of the oxygen molecule (O2 + e+ → ˙O2−), which generated the superoxide radical anion (O2˙−) confirmed by the NBT test (discussed earlier). The hole (h+) interacted with the –C–H bond of toluene. The hole (h+) abstracted the electron (e−) from the C–H bond, by which the C–H bond got activated, leading to the generation of the toluene radical (˙C7H7) with the liberation of a proton (H+) (C7H8 + h+ → ˙C7H7 + H+). The proton (H+) reacted to the superoxide radical anion (O2˙−) to produce the (HOO˙) radical (H+ + O2˙− → HOO˙). The two (HOO˙) radicals combined to generate H2O2 (2HOO˙ → H2O2) as an intermediate. H2O2 was confirmed by the iodometric test (discussed earlier). In light, H2O2 decomposed into the (OH˙) radical (H2O2 → OH˙). The control experiment and THA test (discussed earlier) confirmed the formation of the (OH˙) radical in the reaction. After that, the radicals (˙C7H7) and (OH˙) combined and formed benzyl alcohol as an intermediate (˙C7H7 + OH˙ → Ph–CH2–OH). Benzyl alcohol was identified as an intermediate in the initial few hours of the reaction (Fig. S10 and S11†). The holes could interact with benzyl alcohol via two pathways. In pathway one, activation of the C–H bond took place. The hole interacted with the C–H bond, abstracted the electron by which the proton was liberated, and Ph–CH–OH˙ formed (Ph–CH2–OH + h+ → Ph–CH–OH˙ + H+). The photogenerated electron reduced the oxygen molecule to superoxide (O2 + e+ → ˙O2−), and superoxide interacted with the proton and formed (HOO˙). The radicals (HOO˙) and benzyl alcohol combined to form benzaldehyde as the main product, with the liberation of H2O2 as a side product (Ph–CH–OH˙ + HOO˙ → Ph–CHO + H2O2). In the second pathway, there is the activation of the –OH bond from the hole (Ph–CH2–OH + h+ → Ph–CH2–O˙ + H+). In this pathway, the formed radical and (HOO˙) combined to form the desired benzaldehyde product. Since the catalyst has basicity [due to the nitrogen atoms, confirmed by CO2-TPD analysis (Fig. S14†)], pathway 2 also occurred. With the exfoliation, the basicity of the catalyst increased, because the area under the curve in the CO2-TPD profile was larger for E-g-C3N4(3) than the pristine g-C3N4, indicating the higher basicity in the exfoliated catalyst. Pathway 1 proceeds through C–H activation, whereas pathway 2 proceeds through O–H activation. The basicity of the catalyst prefers the O–H activation of the intermediate over the C–H activation. Thus, pathway 2 is favorable, but both paths go through the C–H activation of toluene. The more basic E-g-C3N4(3) could favor C–H/O–H activation in both paths and shows higher activity than g-C3N4. The higher basicity in E-g-C3N4(3) triggered the easy C–H/O–H activation, facilitated pathway 2, and enhanced the activity of the catalyst for the reaction.
The catalyst recyclability study was conducted to validate the stability of E-g-C3N4(3). The recycled data confirmed that the catalyst exhibited an insignificant loss in its photocatalytic activity during the five consecutive cycles (Fig. S15a†). Also, after five cycles, no structural change was observed in the catalyst structure, confirmed by SEM and XRD analysis (Fig. S15b and c†). The FT-IR spectra of fresh and spent catalysts demonstrate that the chemical constituents of the spent catalysts remained the same (Fig. S15e†). The DRUV-vis spectra suggest that the optical property of the spent catalyst was similar to the fresh one (Fig. S15d†). Therefore, the catalyst is suggested to be stable and recyclable and afforded good activity and selectivity for toluene oxidation under very mild conditions.
Conclusions
In summary, a highly efficient exfoliated catalyst, E-g-C3N4(3), was successfully synthesized by a simple thermal polymerization of urea at 550 °C in a closed crucible, followed by thermal exfoliation at 500 °C in a crucible for 3 h. BET analysis suggested that a 6–7 fold increase in the surface area was observed after the thermal exfoliation. No structural changes occurred upon thermal exfoliation, which was established by XPS and FTIR analysis. A blue shift in the UV-visible spectra was observed upon exfoliation, which resulted in a shift in the bandgap in the materials. The band structure of g-C3N4 and E-g-C3N4(3) was determined by combining UPS, VB-XPS, and DRUV-vis spectra. Among the exfoliated catalysts, E-g-C3N4(3) showed the best charge separation, a longer charge carrier lifetime, excellent photostability, and the best transient photocurrent response. E-g-C3N4(3) exhibited the best activity and selectivity in toluene oxidation to benzaldehyde with 84.4% conversion and ∼100% benzaldehyde selectivity in 8 h with an AQY of 77 × 10−3 using a 250 W high-pressure Hg lamp, whereas E-g-C3N4(3) afforded 78.3% toluene conversion and ∼100% benzaldehyde selectivity in 8 h under sunlight with an AQY of 58 × 10−3. The rate was light intensity-dependent and had an activation energy of ∼35 kJ mol−1. Owing to the delaminated layered structure with a very high surface area and carbon vacancy, the e− and h+ were efficiently separated and transferred to the surface, which resulted in the suppression of e− and h+ recombination and facile generation of reactive oxygen species, responsible for the excellent performance of photocatalytic oxidation of toluene under visible light irradiation. Based on the control reactions and scavenging studies, a comprehensive photocatalytic reaction mechanism was proposed. Several aromatic aldehydes and ketones were prepared with these protocols, demonstrating the scope of this strategy in producing a wide range of chemicals of industrial importance. The cheap and straightforward catalyst synthesis, sustainable reaction conditions, C–H activation using molecular oxygen, excellent product selectivity, efficient catalyst recyclability, and good photostability of E-g-C3N4(3) are attractive outcomes of this study, which are fundamentally sound with high practical relevance to chemical industries.Conflicts of interest
There are no conflicts to declare.Acknowledgements
RG expresses gratefulness to CSIR, New Delhi, (09/1005(0031)/2020-EMR-I) for the fellowship. RS acknowledges the support given by IIT Ropar through the faculty research innovation award (9-35/2009/IITRPR/3121). We are grateful to the Advanced Material Research Centre (AMRC), IIT Mandi for XPS characterization support, SAIF IIT Bombay for the TEM facility, and Dr. Kamalakannan Kailasam, INST Mohali for TCSPC analysis.References
- X. Cao, Z. Chen, R. Lin, W.-C. Cheong, S. Liu, J. Zhang, Q. Peng, C. Chen, T. Han, X. Tong, Y. Wang, R. Shen, W. Zhu, D. Wang and Y. A. Li, Nat. Catal., 2018, 1, 704–710 CrossRef CAS.
- L. Kesavan, R. Tiruvalam, M. H. Rahim, M. I. Saiman, D. I. Enache, R. L. Jenkins, N. Dimitratos, J. A. Lopez-Sanchez, S. H. Taylor, D. W. Knight, C. J. Kiely and G. J. Hutchings, Science, 2011, 331, 195–199 CrossRef CAS PubMed.
- J. Long, H. Liu, S. Wu, S. Liao and Y. Li, ACS Catal., 2013, 3, 647–654 CrossRef CAS.
- M. Fujihira, Y. Satoh and T. Osa, Nature, 1981, 293, 206–208 CrossRef CAS.
- J. A. B. Satrio and L. K. Doraiswamy, Chem. Eng. J., 2001, 82, 43–56 CrossRef CAS.
- K. T. V. Rao, P. S. N. Rao, P. Nagaraju, P. S. S. Prasad and N. Lingaiah, J. Mol. Catal. A: Chem., 2009, 303, 84–89 CrossRef CAS.
- A. Martin, U. Bentrup and G.-U. Wolf, Appl. Catal., A, 2002, 227, 131–142 CrossRef CAS.
- B. Sarmah, R. Srivastava, P. Manjunathan and G. V. Shanbhag, ACS Sustainable Chem. Eng., 2015, 3, 2933–2943 CrossRef CAS.
- V. R. Choudhary, R. Jha and P. Jana, Green Chem., 2007, 9, 267–272 RSC.
- S. J. Freakley, S. Kochius and J. Marwijk, Nat. Commun., 2019, 10, 4178–4186 CrossRef PubMed.
- Á. Szécsényi, G. Li, J. Gascon and E. A. Pidko, ACS Catal., 2018, 8, 7961–7972 CrossRef PubMed.
- Y. L. Hu, H. Jiang and M. Lu, Green Chem., 2011, 13, 3079–3087 RSC.
- G. S. Kumar, C. U. Maheswari, R. A. Kumar, M. L. Kantam and K. R. Reddy, Am. Ethnol., 2011, 50, 11748–11751 CAS.
- K. Deori, C. Kalita and S. Deka, J. Mater. Chem. A, 2015, 3, 6909–6920 RSC.
- S. S. Acharyya, S. Ghosh, R. Tiwari, B. Sarkar, R. K. Singh, C. Pendem, T. Sasaki and R. Bal, Green Chem., 2014, 16, 2500–2508 RSC.
- S. Sarina, H. Zhu, Z. Zheng, S. Bottle, J. Chang, X. Ke, J.-C. Zhao, Y. Huang, A. Sutrisno, M. Willans and G. Li, Chem. Sci., 2012, 3, 2138–2146 RSC.
- Y.-X. Tan, Z.-M. Chai, B.-H. Wang, S. Tian, X.-X. Deng, Z.-J. Bai, L. Chen, S. Shen, J.-K. Guo, M.-Q. Cai, C.-T. Au and S.-F. Yin, ACS Catal., 2021, 11, 2492–2503 CrossRef CAS.
- Z. Zhang, Y. Yang, Y. Wang, L. Yang, Q. Li, L. Chen and D. Xu, Angew. Chem., 2020, 132, 18293–18296 CrossRef.
- B. Sarmah, B. Satpati and R. Srivastava, ACS Omega, 2018, 3, 7944–7954 CrossRef CAS PubMed.
- S. Samanta, S. Khilari, D. Pradhan and R. Srivastava, ACS Sustainable Chem. Eng., 2017, 5, 2562–2577 CrossRef CAS.
- A. Kumar, S. Samanta and R. Srivastava, ACS Omega, 2018, 3, 17261–17275 CrossRef CAS.
- K. Su, H. Liu, B. Zeng, Z. Zhang, N. Luo, Z. Huang, Z. Gao and Feng Wang, ACS Catal., 2020, 10, 1324–1333 CrossRef CAS.
- Z. Sheng, D. Ma, Q. He, K. Wua and L. Yang, Catal. Sci. Technol., 2019, 9, 5692–5697 RSC.
- H. Wang, Y. Wang, C. Jiang, K. Ye, X. He, C. Xue, Z. Yang, X. Zhou and H. Ji, ACS Appl. Mater. Interfaces, 2020, 12, 2259–2268 CrossRef CAS PubMed.
- F. Liu, C.-X. Xiao, L.-H. Meng, L. Chen, Q. Zhang, J.-B. Liu, S. Shen, J.-K. Guo, C.-T. Au and S.-F. Yin, ACS Sustainable Chem. Eng., 2020, 8, 1302–1310 CrossRef CAS.
- S. Ouidri and H. Khalaf, J. Photochem. Photobiol., A, 2009, 207, 268–273 CrossRef CAS.
- D. Masih, Y. Ma and S. Rohani, Appl. Catal., B, 2017, 206, 556–588 CrossRef CAS.
- S. Samanta and R. Srivastava, Mater. Adv., 2020, 1, 1506–1545 RSC.
- J. Xu, K.-Z. Long, Y. Wang, B. Xue and Y.-X. Li, Appl. Catal., A, 2015, 496, 1–8 CrossRef CAS.
- S. Samanta and R. Srivastava, Sustainable Energy Fuels, 2017, 1, 1390–1404 RSC.
- S. Samanta and R. Srivastava, Appl. Catal., B, 2017, 218, 621–636 CrossRef CAS.
- M. Zhang, Y. Yang, X. An, J. Zhao, Y. Bao and L. Hou, J. Hazard. Mater., 2022, 127424, 1–10 Search PubMed.
- J. Xu, L. Zhang, R. Shi and Y. Zhu, J. Mater. Chem. A, 2013, 1, 14766–14772 RSC.
- X. Zhang, J. Deng, J. Yan, Y. Song, Z. Mo, J. Qian, X. Wu, S. Yuan, H. Li and H. Xua, Appl. Surf. Sci., 2019, 490, 117–123 CrossRef CAS.
- S. Samanta, R. Yadav, A. Kumara, A. K. Sinha and R. Srivastava, Appl. Catal., B, 2019, 259, 118054–118073 CrossRef CAS.
- B. Liu, L. Ye, R. Wang, J. Yang, Y. Zhang, R. Guan, L. Tian and X. Chen, ACS Appl. Mater. Interfaces, 2018, 10, 4001–4009 CrossRef CAS PubMed.
- Z. Zhu, H. Pan, M. Murugananthan, J. Gong and Y. Zhang, Appl. Catal., B, 2018, 232, 19–25 CrossRef CAS.
- W. Yan, L. Yan and C. Jing, Appl. Catal., B, 2019, 244, 475–485 CrossRef CAS.
- T. Xiong, W. Cen, Y. Zhang and F. Dong, ACS Catal., 2016, 6, 2462–2472 CrossRef CAS.
- S. S. Wong, M. J. Hülsey, H. An and N. Yan, Catal. Sci. Technol., 2022, 12, 5217–5228 RSC.
- L. Ye, J. Liu, Z. Jiang, T. Peng and L. Zan, Appl. Catal., B, 2013, 142, 1–7 Search PubMed.
- J. Liu, T. Zhang, Z. Wang, G. Dawson and W. Chen, J. Mater. Chem., 2011, 21, 14398–14401 RSC.
- J. Fu, B. Zhu, C. Jiang, B. Cheng, W. You and J. Yu, Small, 2017, 13, 1603938–1603945 CrossRef PubMed.
- J. Sun, J. Zhang, M. Zhang, M. Antonietti, X. Fu and X. Wang, Nat. Commun., 2012, 3, 1139–1146 CrossRef.
- Y. Li, W. Ho, K. Lv, B. Zhu and S. C. Lee, Appl. Surf. Sci., 2018, 430, 380–389 CrossRef CAS.
- Q. Liang, Z. Li, Z.-H. Huang, F. Kang and Q.-H. Yang, Adv. Funct. Mater., 2015, 25, 6885–6892 CrossRef CAS.
- Y. Zheng, S. Chen, X. Yu, K. Li, X. Ni and L. Ye, Appl. Surf. Sci., 2022, 598, 153786 CrossRef CAS.
- P. Niu, L. Zhang, G. Liu and H.-M. Cheng, Adv. Funct. Mater., 2012, 22, 4763–4770 CrossRef CAS.
- Y. Li, M.-Q. Wang, S.-J. Bao, S. Lu, M. Xu, D. Long and S. Pu, Ceram. Int., 2016, 42, 18521–18528 CrossRef CAS.
- X. Yue, S. Yi, R. Wang, Z. Zhang and S. Qiu, Sci. Rep., 2016, 6, 22268–22277 CrossRef CAS PubMed.
- J. Büker, X. Huang, J. Bitzer, W. Kleist, M. Muhler and B. Peng, ACS Catal., 2021, 11, 7863–7875 CrossRef.
- G. Zhang, S. Zang and X. Wang, ACS Catal., 2015, 5, 941–947 CrossRef CAS.
- J. Cai, J. Huang, S. Wang, J. Iocozzia, Z. Sun, J. Sun, Y. Yang, Y. Lai and Z. Lin, Adv. Mater., 2019, 31, 1806314–1806325 CrossRef PubMed.
- J. Li, W. Ma, J. Chen, N. An, Y. Zhao, D. Wang and Z. Mao, Int. J. Hydrogen Energy, 2020, 45, 13939–13946 CrossRef CAS.
- Y. Zhang, J. Di, P. Ding, J. Zhao, K. Gu, X. Chen, C. Yan, S. Yin, J. Xia and H. Li, J. Colloid Interface Sci., 2019, 553, 530–539 CrossRef CAS PubMed.
- B. Yang, J. Han, Q. Zhang, G. Liao, W. Cheng, G. Ge, J. Liu, X. Yang, R. Wang and X. Jia, Carbon, 2023, 202, 348–357 CrossRef CAS.
- S. Cao, B. Fan, Y. Feng, H. Chen, F. Jiang and X. Wang, Chem. Eng. J., 2018, 353, 147–156 CrossRef CAS.
- P. Xia, B. Cheng, J. Jiang and H. Tang, Appl. Surf. Sci., 2019, 487, 335–352 CrossRef CAS.
- C. Hu, W.-Z. Hung, M.-S. Wang and P.-J. Lu, Carbon, 2018, 127, 374–383 CrossRef CAS.
- P. Makuła, M. Pacia and W. Macyk, J. Phys. Chem. Lett., 2018, 9, 6814–6817 CrossRef PubMed.
- B. D. Viezbicke, S. Patel, B. E. Davis and D. P. Birnie, Phys. Status Solidi B, 2015, 8, 1700–1710 CrossRef.
- X. Wang, K. Maeda, A. Thomas, K. Takanabe, G. Xin, J. M. Carlsson, K. Domen and M. Antonietti, Nat. Mater., 2009, 8, 76–80 CrossRef CAS PubMed.
- G. Algara-Siller, N. Severin, S. Y. Chong, T. Björkman, R. G. Palgrave, A. Laybourn, M. Antonietti, Y. Z. Khimyak, A. V. Krasheninnikov, J. P. Rabe, U. Kaiser, A. I. Cooper, A. Thomas and M. J. Bojdys, Angew. Chem., 2014, 126, 7580–7585 CrossRef.
- F. Dong, Z. Zhao, T. Xiong, Z. Ni, W. Zhang, Y. Sun and W.-K. Ho, ACS Appl. Mater. Interfaces, 2013, 5, 11392–11401 CrossRef CAS PubMed.
- Q. He, M. Worku, L. Xu, C. Zhou, S. Lteif, J. B. Schlenoff and B. Ma, J. Mater. Chem. A, 2020, 8, 2039–2046 RSC.
- K. Das, S. N. Sharma, M. Kumar and S. K. De, J. Phys. Chem. C, 2009, 113, 14783–14792 CrossRef CAS.
- L. Cheng, F. Y. Chen, Z. Q. Zhu, Y. B. Tang, K. K. Shu and W. L. Shi, Mater. Chem. Phys., 2022, 275, 125192–125203 CrossRef CAS.
- X. Hu, Q. Ma, X. Wang, Y. Yang, N. Lu, C. Zhang, N. Kawazoe, G. Chen and Y. Yang, J. Catal., 2020, 387, 28–38 CrossRef CAS.
- B. Roose, S. Pathak and U. Steiner, Chem. Soc. Rev., 2015, 44, 8326–8349 RSC.
- L. Wu, Y. Zhang, X. Li and C. Cen, Phys. Chem. Chem. Phys., 2014, 16, 15339–15345 RSC.
- R. Das, S. Sarkar, R. Kumar, S. D. Ramarao, A. Cherevotan, M. Jasil, C. P. Vinod, A. K. Singh and S. C. Peter, ACS Catal., 2022, 12, 687–697 CrossRef CAS.
- Y.-F. Xu, M.-Z. Yang, B.-X. Chen, X.-D. Wang, H.-Y. Chen, D.-B. Kuang and C.-Y. Su, J. Am. Chem. Soc., 2017, 139, 5660–5663 CrossRef CAS PubMed.
- K. Gelderman, L. Lee and S. W. Donne, J. Chem. Educ., 2007, 84, 685–689 CrossRef CAS.
- H. Guo, H.-Y. Niu, C. Liang, C.-G. Niu, D.-W. Huang, L. Zhang, N. Tang, Y. Yang, C.-Y. Feng and G.-M. Zeng, J. Catal., 2019, 370, 289–303 CrossRef CAS.
- K. Zhang, W. Kim, M. Ma, X. Shia and J. H. Park, J. Mater. Chem. A, 2015, 3, 4803–4810 RSC.
- R. Ghalta, A. K. Kar and R. Srivastava, Chem. – Asian J., 2021, 16, 3790–3803 CrossRef CAS PubMed.
- X. Zhao, Y. Fan, W. Zhang, X. Zhang, D. Han, L. Niu and A. Ivaska, ACS Catal., 2020, 10, 6367–6376 CrossRef CAS.
- S. Hoang, S. Guo, N. T. Hahn, A. J. Bard and C. B. Mullins, Nano Lett., 2012, 12, 26–32 CrossRef CAS PubMed.
- J. Liu, J. Zhang, D. Wang, D. Li, J. Ke, S. Wang, S. Liu, H. Xiao and R. Wang, ACS Sustainable Chem. Eng., 2019, 7, 12428–12438 CAS.
- R. Pandiyan, N. Delegan, A. Dirany, P. Drogui and M. A. El Khakani, J. Phys. Chem. C, 2016, 120, 631–638 CrossRef CAS.
- I. Shown, H.-C. Hsu, Y.-C. Chang, C.-H. Lin, P. K. Roy, A. Ganguly, C.-H. Wang, J.-K. Chang, C.-I. Wu, L.-C. Chen and K.-H. Chen, Nano Lett., 2014, 14, 6097–6103 CrossRef CAS PubMed.
- R. Beranek, Adv. Phys. Chem., 2011, 2011, 1–20 CrossRef.
- D. Zhao, C. Dong, B. Wang, C. Chen, Y. Huang, Z. Diao, S. Li, L. Guo and S. Shen, Adv. Mater., 2019, 31, 1903545 CrossRef CAS PubMed.
- C. Xu, Y. Pan, G. Wan, H. Liu, L. Wang, H. Zhou, S.-H. Yu and H.-L. Jiang, J. Am. Chem. Soc., 2019, 141, 19110–19117 CrossRef CAS PubMed.
- S. Juntrapirom, S. Anuchai, O. Thongsook, S. Pornsuwan, P. Meepowpan, P. Thavornyutikarn, S. Phanichphant, D. Tantraviwat and B. Inceesungvorn, Chem. Eng. J., 2020, 394, 124934–124946 CrossRef CAS.
- Y. Liu, L. Chen, X. Liu, T. Qian, M. Yao, W. Liu and H. Ji, Chin. Chem. Lett., 2022, 33, 1385–1389 CrossRef CAS.
- J. Jing, K. Qi, G. Dong, M. Wang and W. Ho, Chin. Chem. Lett., 2022, 33, 4715–4718 CrossRef CAS.
- X. He, H. Shang, C. Wang, L. Chen, Z. Gong, J. Wang, S. Zhao and J. Ma, Chin. Chem. Lett., 2021, 32, 3377–3381 CrossRef CAS.
- X. Wang, X. Zheng, H. Han, Y. Fan, S. Zhang, S. Meng and S. Chen, J. Solid State Chem., 2020, 289, 121495–121504 CrossRef CAS.
Footnote |
| † Electronic supplementary information (ESI) available: Experimental procedures, detailed synthesis and characterization of catalysts, the procedure of the photocatalytic reaction, N2 adsorption profiles, SEM images, Tauc plots, LSV analysis, and recycling data are provided in this section. See DOI: https://doi.org/10.1039/d2cy01801b |
| This journal is © The Royal Society of Chemistry 2023 |

