 Open Access Article
Unveiling the thickness-dependent mechanical properties of graphene papers by in situ SEM tension†
Tianci
Cao
,
Xianqiang
Liu
*,
Xiaopeng
Cheng
,
Yonghe
Li
 ,
Lijun
Sang
,
Jinyao
Ma
,
Jin
Wang
,
Jiachuo
He
,
Mingming
Wang
and
Yuefei
Zhang
,
Lijun
Sang
,
Jinyao
Ma
,
Jin
Wang
,
Jiachuo
He
,
Mingming
Wang
and
Yuefei
Zhang
 *
*
Institute of Microstructure and Property of Advanced Materials, Beijing University of Technology, Beijing, 100124, PR China. E-mail: xqliu@bjut.edu.cn; yfzhang@bjut.edu.cn
First published on 6th February 2019
Abstract
With more and more applications, the mechanical strength of graphene paper (GP) has attracted significant attention in recent years. In this report, GPs were prepared by flow-induced filtration of electrochemical exfoliated graphene sheets. By adjusting the concentration of solution, we found graphene sheets fabricated in 0.1 M K2SO4 have the thinnest average thickness. And by uniaxial in-plane tensile tests operated on a self-developed in situ scanning electron microscopy (SEM) tensile stage, the corresponding GP has the best fracture strength of 192 MPa. This is due to that the thickness decrease of exfoliated graphene will increase the quantity of interlayer crosslinks, thus improving the mechanical properties of GPs. This research may open a new way to obtain high-strength GPs for applications.
1. Introduction
Graphene, a single atom thick 2D honeycomb sp2 carbon lattice, has been attracting a great deal of attention due to its high specific surface area (2640 m2 g−1), high flexibility, fine mechanical strength, thermal and chemical stability, and high conductivity1–3 since it was experimentally discovered in 2004.4 For macroscopical application, as building blocks graphene can be assembled to graphene paper (GP), which has emerged in batteries,5 supercapacitors,6 sensors,7 filtration membrane8 and so on.Whether for electrochemical field applications or filtration membrane, mechanical strength is of great importance to GPs. The mechanical properties of prepared GPs have been investigated by tensile, indentation, and bending test.9 The high strength and stiffness of GPs were ascribed to the interlocking-tile microstructures of graphene nanosheets.10 To quantitatively understand the mechanical properties of stratified material, several theoretical models have been proposed. In 1952, Cox put forward the shear-lag model for fibrous materials in consider of the interface shear between hard and soft phases.11 After that, Gao and Li extended this model into carbon nanotube composites.12 In 2003, Ji and Gao proposed the tension-shear chain (TSC) model.13 Afterwards, this model was further extended to explain the failure mechanism of biological materials with hierarchical microstructures like bone and teeth. In TSC model, the interface shear stress between bone and protein is uniform because of the rigidity of bones.14 In contrast, graphene sheets have good elasticity compared to bones. Thus, Liu et al. modified TSC to predict the mechanical properties of graphene-based papers, which is the deformable tension-shear (DTS) model.15
From one aspect, the mechanical property of GO paper should be better than that of GP because of the oxygen-containing chemical groups. However, these oxygen-containing groups are harmful to the application of GP in the electrochemical field. Up to now, people have no idea about how to improve the mechanical properties of GP. Here, in this paper, by tuning the electrolyte, we fabricated graphene of different thickness and assembled them into GPs. The combination of in situ tensile testing inside SEM and following AFM analysis found that the fracture strength of GPs has strong correlation with the quality of graphene sheets prepared.
2. Experiments
2.1 Materials
Graphite foil (99.8%) was provided by Alfa Aesar chemical Co., Ltd., China. K2SO4 (AR) was supplied by Zhiyuan Chemical Reagent Co., Ltd., China.2.2 Preparation of graphene
Graphite foil, platinum plate, 0.1 mol L−1 (M) K2SO4 solution were used for working electrode, counter electrode, and the electrolyte, respectively. The distance between two electrodes was about 3 cm. A constant 10 V voltage was applied for 15 minutes, and the flow rate was controlled at ∼2 cm s−1. After being vacuum-filtered and washed by deionized water (DIW), the wet GP was redispersed in DIW by sonication for 20 min and then centrifuged at 2000 rpm for 20 min. The supernate was collected and centrifuged at 4000 rpm for 30 min. The precipitate was collected. These cleaning steps were repeated for 3 times and the preparation of 0.1 M graphene was finished. Other conditions remained invariable, only changing the concentration of K2SO4 solution then we can get 0.2 M, 0.3 M and 0.4 M graphene, respectively.2.3 Preparation of graphene paper
GPs were prepared by vacuum-filtrating the resulting graphene colloid through an Anodic membrane filter (47 mm in diameter, 0.2 μm pore size, Whatman), and then drying at 80 °C. The thickness of GPs is about 16 μm.2.4 Characterization
Scanning electron microscopy (SEM) (FEI Quanta 250, accelerating voltage: 20 kV) was used to observe the morphologies of surface and fracture surface of GPs. The morphologies and structure of graphene were characterized by transmission electron microscopy (TEM) (FEI Titan G2, operated at 300 kV). The lateral dimensions and height were measured using the atomic force microscopy (AFM) (Bruker Multimode8, tapping mode). Typical uniaxial in-plane tensile tests were operated on a self-developed in situ specimen tensile stage integrated in Quanta 650 FEG ESEM.16 All tensile tests were conducted in controlled strain rate mode17 with a preload of 0.01 N18 and a stain ramp rate of 11 μm min−1.3. Results and discussion
3.1 Electrochemical exfoliation and GPs preparation
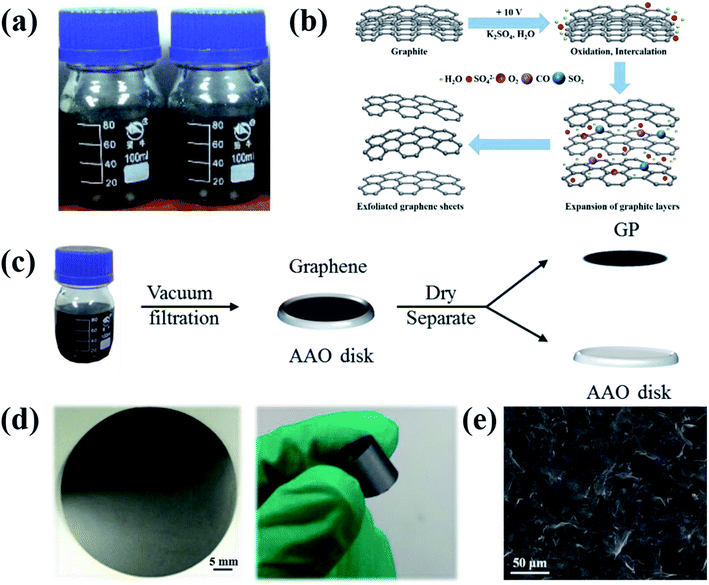
Four kinds of graphene (Fig. 1a) were obtained from a two-electrode system in the electrolyte K2SO4 solution19 prepared by dissolving K2SO4 in DIW (concentration of 0.1–0.4 M). The mechanism of electrochemical exfoliaton is illustrated in Fig. 1b: Firstly, graphite is intercalated by OH− ions (4OH− − 4e− → 2H2O + O2), which ‘opens’ the edge and grain boundaries of graphite. The expansion of graphite layers facilitates the following anions intercalation. Finally, reduction of SO42− yields a large amounts of SO2 gas (SO42− + 4H+ + 2e− → 2H2O + SO2), supplying force to separate weakly-bonded graphite layers into graphene sheets. The exfoliated graphene sheets (EGs) will contain less oxygen-containing groups compared with the graphene prepared by oxide-reduction methods. Then, the GPs were prepared via a procession of vacuum-filtration, drying and separation (Fig. 1c). The resulted GPs exhibit good flexibility (Fig. 1d). The surface morphology of GPs was characterized by SEM (Fig. 1e), showing the piece-by-piece overlapping hierarchical structure.3.2 In situ measurements of mechanical properties of GPs
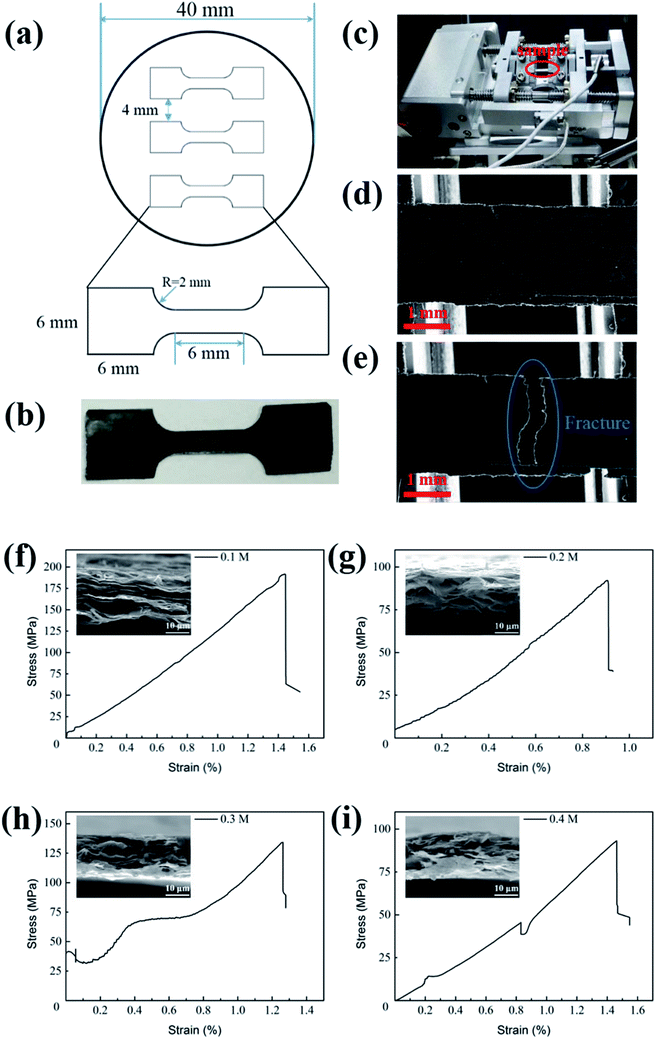
Fig. 2a is the sketch figure of the mould for the preparation GP tensile samples in in situ mechanical measurements. And Fig. 2b is the real GP strips for uniaxial in-plane tensile tests. Fig. 2c shows the specimen tensile stage designed for in situ experiments. Fig. 2d and e exhibit the low magnification morphologies of GPs before and after tensile experiments, respectively. And the morphology shows out the characterization of brittle fracture. Fig. 2f–i present the stress–strain curves of GPs, corresponding to four kinds of EGs (0.1, 0.2, 0.3 and 0.4 M), respectively. These curves exhibit linear behavior (elastic), similar to the reports of Shen et al.20 and Wang et al.21 However, the fracture strength of four kinds GPs (f–i) varies dramatically and they are 191.68, 93.16, 134.25 and 92.18 MPa, respectively. The corresponding fracture morphologies (insets) demonstrate obvious laminar structure, suggesting the hierarchical structure of GPs. Interestingly, we found that the strips of 0.1 M and 0.3 M seem to have more sheets than 0.2 M and 0.4 M and correspondingly they have higher fracture strength.3.3 Characterization of graphene sheets
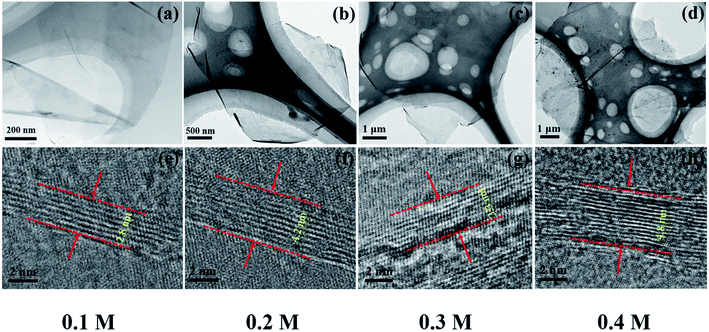
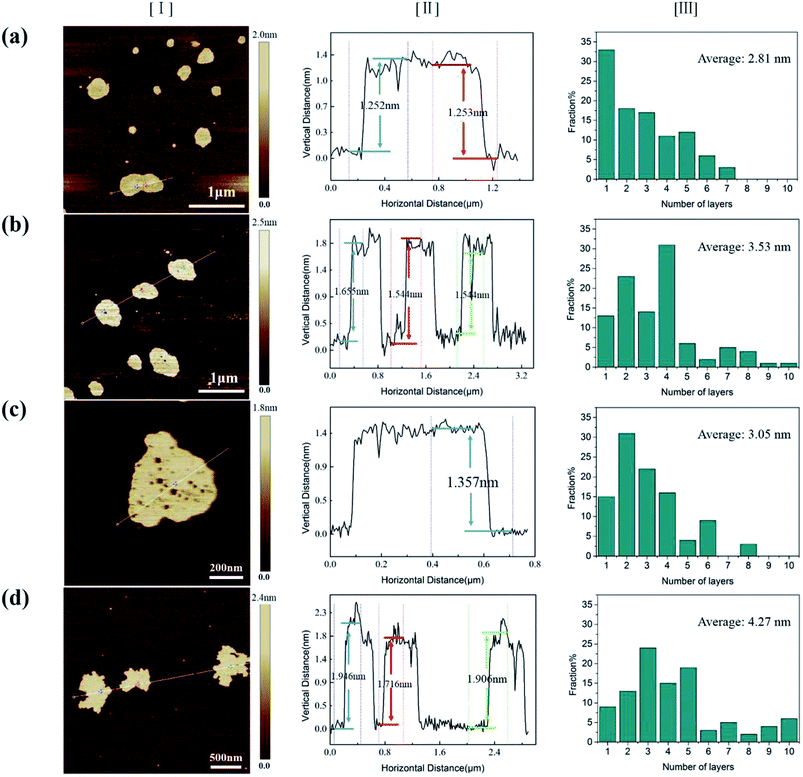
To explore the origin of dramatic variation of fracture strength, we carefully characterized the building blocks of these GPs. Fig. 3a–d show the bright field images of four kinds of EGs, which exhibit the thin flaky and weak wrinkle morphologies. Moreover, the relative brighter characteristics for EGs in Fig. 3a and c suggest a little thinner thickness in comparison with those in Fig. 3b and d. Fig. 3e–h present the HRTEM images obtained from the curly edges of these EGs, which will clearly show the thickness of these EGs: they are 2.8, 4.2, 3.3, 4.8 nm, respectively, agreeing well with the characteristics in Fig. 3a–d.Due to the difficulty of analyzing large amount of samples by TEM, we did the thickness statistics of four kinds of EGs according to the AFM measurements.22Fig. 4 shows the morphologies, height profiles and layer number statistics of four kinds of EGs, respectively. Statistical data show that all four kinds of EGs have monolayer graphene, which is thinner than 1 nm. And over 80% of EGs have less than 5 layers in all samples. The comparison shows that the electrolyte concentration has a non-negligible influence on the quality of EGs. The samples of electrolyte concentration at 0.1 M have over 30% monolayer EGs. In comparison, the samples of 0.4 M have less than 10% monolayer EGs. The average thicknesses of four kinds of EGs are 2.81 nm, 3.53 nm, 3.05 nm, 4.27 nm, respectively. According to the procedure of electrochemical exfoliaton, OH− ions provide gaps between graphite layers and SO42− ions offer force to separate layers from these gaps. Therefore, the number of gaps determines the thickness of the prepared graphene. When concentration of solution increases, the formation of OH− ions is suppressed due to the low water content, besides, due to the high concentration of SO42− ions, the exfoliation process will finish rapidly before the formation of new gaps. From the above, higher electrolyte concentration corresponds to thicker graphene sheets thickness within a certain concentration range. Thus a low concentration electrolyte will produce EGs of high quality, as shown by Fig. 4.
3.4 Analysis of mechanical property
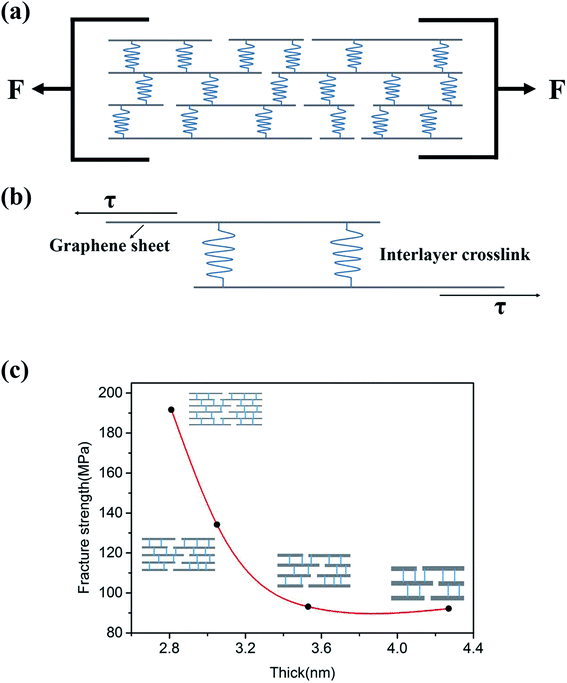
Fig. 5a sketches the uniaxial in-plane tension of GP strips. As shown by Fig. 5a, GPs are formed by the stacking and interlocking of individual EGs. In the GP, the bonding between EGs are the crosslinks, which include van der Waals interaction and hydrogen bond.23Fig. 5b sketches the tension-shear transition mechanism in the uniaxial in-plane tension experiments. When tension loads onto the hierarchical structure, the tension stress will transform into the shear stress according to DTS model. Graphene-based paper materials are assembled by EGs in a layer-by-layer manner. Because of the wrinkle morphology of EGs, the interlayer distance is about 1.2 nm.24 which is much larger than the intra-layer distance of EGs (0.35 nm). The intra-layer binding strength is about two orders higher than that of interlayer according to the van der Waals force equation, which is the function of inter- and intra-layer distances.25 Thus the fracture of GP strips should be the separation of interlayers while not the intra-layers of EGs. And the interlayer crosslinks are the binding characterized by the fracture strength. Fig. 5c shows the relationship between the fracture strength and the thickness of EGs. As shown by Fig. 5c, the fracture strength decreases with the thickness increase of EGs. This should be attribute to the decrease of interlayer crosslinks because quantity of interlayer crosslinks will decrease with the thickness increase of individual EGs.4. Conclusions
In this work, we introduced a route to fabricate graphene sheets by electrochemical exfoliation of graphite foils in K2SO4 solution. We found the thickness of graphene sheets has strong impact on the fracture strength of corresponding GPs. Combining with the stratified structure of GPs (interlocking of EGs) revealed by SEM observation and the DTS model, we proposed that decreasing the thickness of EGs will increase the number of interlayer crosslinks of GPs, thus enhancing fracture strength of GPs.Conflicts of interest
There are no conflicts to declare.Acknowledgements
This work was supported by funding from the NSFC (21676005), the NSFCDFG joint project (51761135129), Beijing Municipal Natural Science Foundation (2172002), and Great Wall Scholarship Project (CIT&TCD20170306).References
- X. Wang and G. Shi, Energy Environ. Sci., 2015, 8(3), 790–823 RSC.
- M. Z. B. Dzukarnain, T. Takami, H. Imai and T. Ogino, Thin Solid Films, 2016, 615, 247–255 CrossRef CAS.
- M. J. Allen, V. C. Tung and R. B. Kaner, Chem. Rev., 2010, 110(1), 132 CrossRef CAS.
- K. S. Novoselov, A. K. Geim, S. V. Morozov, D. Jiang, Y. Zhang, S. V. Dubonos, I. V. Grigorieva and A. A. Firsov, Science, 2004, 306(5696), 666–669 CrossRef CAS.
- D. Lin, Y. Liu, Z. Liang, H. W. Lee, J. Sun, H. Wang, K. Yan, J. Xie and Y. Cui, Nat. Nanotechnol., 2016, 11(7), 626 CrossRef CAS PubMed.
- G. Wang, X. Sun, F. Lu, H. Sun, M. Yu, W. Jiang, C. Liu and J. Lian, Small, 2012, 8(3), 452–459 CrossRef CAS.
- F. Xiao, Y. Li, X. Zan, K. Liao, R. Xu and H. Duan, Adv. Funct. Mater., 2012, 22(12), 2487–2494 CrossRef CAS.
- H. Liu, H. Wang and X. Zhang, Adv. Mater., 2015, 27(2), 249–254 CrossRef CAS.
- D. A. Dikin, E. J. Zimney, S. Stankovich, R. D. Piner, G. H. B. Dommett, and R. S. Ruoff, APS March Meeting, American Physical Society, 2007 Search PubMed.
- K. W. Kim, J. H. Kim, S. Cho, K. Shin and S. H. Kim, Thin Solid Films, 2017, 632, 50–54 CrossRef CAS.
- H. L. Cox, Br. J. Appl. Phys., 1951, 3(3), 72 CrossRef.
- X. L. Gao and K. Li, Int. J. Solids Struct., 2005, 42(5), 1649–1667 CrossRef.
- B. Ji and H. Gao, J. Mech. Phys. Solids, 2004, 52(9), 1963–1990 CrossRef.
- F. Barthelat, H. Tang, P. D. Zavattieri, C. M. Li and H. D. Espinosa, J. Mech. Phys. Solids, 2007, 55(2), 306–337 CrossRef CAS.
- Y. Liu, B. Xie, Z. Zhang, Q. Zheng and Z. Xu, J. Mech. Phys. Solids, 2012, 60(4), 591–605 CrossRef CAS.
- J. Wang, Y. Zhang, J. Ma, J. Li and Z. Zhang, Acta Metall. Sin., 2017, 53(12), 1627–1635 Search PubMed.
- H. Chen, M. B. Müller, K. J. Gilmore, G. G. Wallace and D. Li, Adv. Mater., 2010, 20(18), 3557–3561 CrossRef.
- D. A. Dikin, S. Stankovich, E. J. Zimney, R. D. Piner, G. H. B. Dommett, G. Evmenenko, S. B. T. Nguyen and R. S. Ruoff, Nature, 2007, 448(7152), 457–460 CrossRef CAS.
- K. Parvez, Z. S. Wu, R. Li, X. Liu, R. Graf, X. Feng and K. Müllen, J. Am. Chem. Soc., 2014, 136(16), 6083–6091 CrossRef CAS.
- A. R. Ranjbartoreh, B. Wang, X. Shen and G. Wang, J. Appl. Phys., 2011, 109(1), 666–668 CrossRef.
- Z. Cheng, Q. Zhou, C. Wang, Q. Li, C. Wang and Y. Fang, Nano Lett., 2011, 11(2), 767–771 CrossRef CAS.
- A. Carpinteri and N. M. Pugno, Int. J. Fract., 2008, 150(1–2), 221–226 CrossRef.
- A. Lerf, A. Buchateiner, J. Pieper, S. Schöttl, I. Dekany, T. Szabo and H. P. Boehm, J. Phys. Chem. Solids, 2006, 67(5–6), 1106–1110 CrossRef CAS.
- Y. Gao, L. Q. Liu, S. Z. Zu, K. Peng, D. Zhou, B. H. Han and Z. Zhang, ACS Nano, 2011, 5(3), 2134–2141 CrossRef CAS.
- L. Spanu, S. Sorella and G. Galli, Phys. Rev. Lett., 2009, 103(19), 196401 CrossRef.
Footnote |
| † Electronic supplementary information (ESI) available. See DOI: 10.1039/c8ra09818b |
| This journal is © The Royal Society of Chemistry 2019 |

