 Open Access Article
Ionic association analysis of LiTDI, LiFSI and LiPF6 in EC/DMC for better Li-ion battery performances
Christopher L. Berhaut *ac,
Daniel Lemordant
 a,
Patrice Porion
 b,
Laure Timperman
 a,
Grégory Schmidtc and
Mériem Anouti
 a
a
aLaboratoire PCM2E (EA 6296), Université François Rabelais de Tours, UFR Sciences et Techniques, Parc de Grandmont, 37200 Tours, France. E-mail: christopher.berhaut@outlook.com
bICMN CNRS - Université d'Orléans, UMR 7374, 1b rue de la Férollerie, 45071 Orléans Cedex 02, France
cARKEMA, rue Henri Moissan, 69493 Pierre Bénite, France
First published on 6th February 2019
Abstract
New lithium salts such as lithium bis(fluorosulfonyl)imide (LiFSI) and lithium 4,5-dicyano-2-(trifluoromethyl)imidazole-1-ide (LiTDI) are now challenging lithium hexafluorophosphate (LiPF6), the most used electrolyte salt in commercial Li-ion batteries. Thus it is now important to establish a comparison of these electrolyte components in a standard solvent mixture of ethylene carbonate and dimethyl carbonate (EC/DMC: 50/50 wt%). With this aim, transport properties, such as the ionic conductivity, viscosity and 7Li self-diffusion coefficient have been deeply investigated. Moreover, as these properties are directly linked to the nature of the interionic interactions and ion solvation, a better understanding of the structural properties of electrolytes can be obtained. The Li salt concentration has been varied over the range of 0.1 mol L−1 to 2 mol L−1 at 25 °C and the working temperature from 20 °C to 80 °C at the fixed concentration of 1 mol L−1. Experimental results were used to investigate the temperature dependence of the salt ion-pair (IP) dissociation coefficient (αD) with the help of the Walden rule and the Nernst–Einstein equation. The lithium cation effective solute radius (rLi) has been determined using the Jones–Dole–Kaminsky equation coupled to the Einstein relation for the viscosity of hard spheres in solution and the Stokes–Einstein equation. From the variations of αD and rLi with the temperature, it is inferred that in EC/DMC LiFSI forms solvent-shared ion-pairs (SIP) and that, LiTDI and LiPF6 are likely to form solvent separated ion-pairs (S2IP) or a mixture of SIP and S2IP. From the temperature dependence of αD, thermodynamic parameters such as the standard Gibbs free energy, enthalpy and entropy for the ion-pair formation are obtained. Besides being in agreement with the information provided by the variations of αD and rLi, it is concluded that the ion-pair formation process is exergonic and endothermic for the three salts in EC/DMC.
1. Introduction
The current desire to continuously increase the use of renewable and green energy in order to reduce the dependence on fossil fuel reserves comes with the necessity to multiply solar, tidal and wind power harvesting technologies. However, green energy is intermittent and depends on the weather. An energy shortage (at night, during windless and/or cloudless periods) has as much chance of happening as an energy surplus (summer days, storms). The use of technologies capable of storing energy directly where it is produced does not only solve the problem of the uncertainty of green energy delivery but also relieves the power grid and prevents its expansion. Indeed, the produced energy does not have to be transported over great distances as it is when coming from large-scale power plants, and the line-losses are reduced. Batteries are ideal candidates for such an application. Furthermore, stationary batteries can buffer voltage fluctuations to meet the power demands of consumers.The lithium-ion battery (LiB) is the most popular rechargeable battery compared to other technologies due to its high energy density and its good cycle life.1–6 Since the commercialization of its first generation by Sony in 1990 (ref. 7) LiBs have known an impressive increase in performance and a decrease in price.8 Today, LiBs can not only be found in all kinds of portable electronic devices such as smartphones, portable computers and digital cameras but also in larger systems such as electric vehicles.6 Thus, because of the increasing use of the LiB technology it is important for the future LiB generations to be even more performant and safe. To increase the energy density of LiBs higher-capacity materials are being explored. Oxygen-based and sulfur (Li2S) positive electrodes are currently being studied9,10 while silicon-alloys11–13 show promising results as negative electrode material. Safety can be improved through a better choice of the battery components.
The electrolyte is one of the most important component of Li-ion batteries and represented a production of 103 kt and 1.4 B$ in revenues in 2016.14 Among all the Li salts that can be used as electrolyte salts, only lithium tetrafluoroborate (LiBF4) and lithium hexafluorophosphate (LiPF6) have been commercialized in current cells. Nevertheless, new salts like lithium bis(fluorosulfonyl)imide (LiFSI) and lithium 4,5-dicyano-2-(trifluoromethyl)imidazole-1-ide (LiTDI) are now challenging LiPF6. Despite exhibiting many advantages over LiPF6, the main limitation for their use in commercial batteries is their cost and availability. One of the objectives of this article is to establish a comparison between LiPF6, LiTDI and LiFSI dissolved in a standard solvent: a mixture of ethylene carbonate and dimethyl carbonate (EC/DMC: 50/50 wt%). Beside security issues and interface stability with electrode materials, ion transport properties are the most important features for an electrolyte. Hence, in this work is presented an extended comparative study of the electrolyte transport properties, such as ion conductivity, electrolyte viscosity and self-diffusion coefficients. Moreover, from a deep study of these properties, are inferred other important parameters such as ion size, ion solvation and ion pairing, which can allow a better understanding of the behavior of lithium salts in solution.15,16
2. Theory
2.1. Ion-pairing
Electrolytes for Li-ion batteries generally contain 1 mol L−1 of lithium salt dissolved in a mixture of alkylcarbonate solvents such as EC/DMC. In spite of the relatively high dielectric constant of EC, the formation of ion-pairs (IP) may occur. If M+, X− and S stand respectively for the metallic cation, the anion and a solvent molecule then three kinds of ion-pairs are commonly described as illustrated in Fig. 1: (M+X−) the contact ion-pairs (CIP), (M+SX−) the solvent shared ion-pairs (SIP) and the (M+SSX−) solvent separated ion-pairs (S2IP) when both ions retain their primary solvation shell. In low permittivity solvents higher ion-aggregates (AGG) may exist such as M+X−M+ triple ions, (M+X−)2 ion-pair dimers, or even larger species.17,18 Ion-pair population varies with ion size, solvent properties and temperature. The thermodynamic parameters describing ion association are the molar Gibbs free energy (ΔGIP) for ion pairing and the related enthalpy (ΔHIP) and entropy (ΔSIP). These parameters are linked to each other and to the activity ratio (Qr) and equilibrium constant (KIP) of the chemical reaction describing the association, by the following equation.
ΔGIP = ΔHIP − TΔSIP = RT![[thin space (1/6-em)]](https://www.rsc.org/images/entities/char_2009.gif) ln(Qr/KIP) ln(Qr/KIP)
| (1) |
The ionic association process which leads to CIP or SIP is generally dominated by a positive ΔHIP.
| ΔHIP = ΔHel + ΔHsol | (2) |
The coulombic energy released when two oppositely charged ions are brought together, forming an ion pair, is an exothermic process (ΔHel < 0 J mol−1) but this contribution is overcompensated by the de-solvation contribution making the ion-pairing enthalpy ΔHIP(T) positive. As a matter of fact, during association, the electric field becomes smaller around the ions that are now paired and consequently, an appreciable number of electrostricted solvent molecules are released to the bulk solvent. This phenomenon, being the inverse process of solvation, leads to a large endothermic solvation enthalpy contribution (ΔHsol) which dominates the overall enthalpy ΔHIP. The entropy variation ΔSIP corresponding to the formation of an ion pair can also be expressed as the sum of two terms:
| ΔSIP = ΔS + ΔSsol | (3) |
Ion association leads to a decrease in entropy ΔS < 0 J K−1 mol−1 as a solution containing un-associated ions is more disordered than a solution containing ion-pairs. Still, the displacement of solvent molecules from the solvation shell of the cation or the anion to the bulk solvent leads to a positive contribution (ΔSsol > 0 J K−1 mol−1) to the global entropy. The sign of ΔSIP depends on the magnitude of these two opposite contributions. Often the resulting ion pairing entropy is positive.
In the case of CIP and SIP, a large release of solvating molecules to the bulk occurs and hence ΔHIP ≥ 0 J mol−1 and ΔSIP > 0 J K−1 mol−1. According to the Van't Hoff equation, any increase in temperature will favors ion pairing. On the contrary, in the case of S2IP only solvent molecules belonging to the second solvation shell may be released during ion-pairing leading to a low and possibly negative association enthalpy and entropy. In consequence, any temperature increase will have no effect or favor ion-pair dissociation, depending on the magnitude of ΔHIP.
2.2. Lithium effective ionic radius
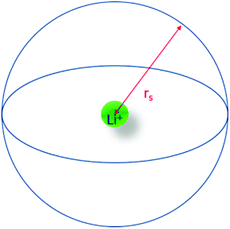
As presented in Fig. 2, the Li+ effective solute radius (rs) represents the radius of the sphere englobing the species that participate in the first solvation layer of the lithium cation, its center.Two methods were used herein to estimate rs. The first one makes use of the Stokes–Einstein equation applied to 7Li self-diffusion coefficients as:
| D(Li) = kT/c | (4) |
| c = 6πηrs,stokes | (5) |
| rs,stokes = (kT)/(6πηD(Li)) | (6) |
The second approach for determining rs, is to use both the Einstein relation for the viscosity of a solution of hard spheres and its extension to spherical shaped suspensions (8)19 and the Jones–Dole–Kaminsky (JDK) eqn (7):20–23
| ηr = 1 + A√C + BC + DC2 | (7) |
In this equation, ηr is the relative viscosity of the solution (ηr = η/η°), C the salt concentration and A, B, D parameters describing respectively long-range ion–ion interactions, volume effects and short-range interactions. At concentrations higher than 0.1 mol L−1 the A√C term is negligible.24 The B parameter is closely linked to the molar volume of the solute as indicated by the Einstein relation (8). Finally, D remains an adjustable parameter as no equation has yet been found to calculate this term. At concentrations lower than 0.1 mol L−1 the DC2 term can be considered negligible compared to the other terms of the JDK equation but is predominant at higher concentrations.
 | (8) |
 | (9) |
2.3. Ion-pair dissociation coefficients
The dissociation coefficient (αD) of the lithium salt, dissolved at the concentration C in the solvent mixture, is defined by the equilibrium described in Fig. 3.Determining αD is not straightforward when the solute activity coefficient is difficult to determine and this is the case for the present electrolytes.
Nevertheless, two alternative methods can be used for this purpose. The first one makes use of the Walden rule (Method 1) and the second involves the use of the self-diffusion coefficients of the charged species (Method 2).
| Λην = constant | (10) |
By plotting ln(Λ) vs. ln(η) for the present electrolytes, ν was found to be close to 1 as indicated by the values displayed in Table 1.
| LiTDI | LiPF6 | LiFSI | |
|---|---|---|---|
| ν | 1.0 | 0.9 | 0.8 |
The dissociation coefficients of LiTDI, LiPF6 and LiFSI could then be estimated using eqn (11):33–35
 | (11) |
| 25 °C | 50 °C | 60 °C | 80 °C | ||
|---|---|---|---|---|---|
| Λ° (10−4 × S m2 mol−1) | LiTDI | 50.5 | 68.9 | 76.6 | 92.2 |
| LiFSI | 43.5 | 59.2 | 65.5 | 78.8 | |
| LiPF6 | 49.4 | 63.7 | 79.4 | 85.7 | |
The limiting molar conductivity Λ° values were obtained by extrapolating at high dilution the variations of Λ vs. C1/2 according to the Debye–Hückel–Onsager eqn (12):
 | (12) |
 | (13) |
ΛNE is calculated using eqn (14):
 | (14) |
 | (15) |
ΛNE values are derived from the assumption that all of the diffusing lithiated and fluorinated species detected during the Pulse-Gradient Spin-Echo Nuclear Magnetic Resonance (PGSE-NMR) measurement contribute to the molar conductivity. Hence, the Nernst–Einstein equation gives the molar conductivity of the electrolyte as it should be if all ion-pairs were dissociated and/or if all charged species contribute to the bulk conductivity.
3. Experimental
3.1. Material and cell preparation
Highly pure (GC grade, molecular purity >99%) ethylene carbonate (EC) purchased from Fluka, and anhydrous dimethylcarbonate (DMC, molecular purity >99%) purchased from Sigma-Aldrich, were used as received. The alkyl-carbonate EC/DMC (50/50 wt%) mixture used was prepared using a Sartorius 1602 MP balance with a ±1 × 10⁻⁴ g accuracy in an argon filled MBraun glove box at 25 °C with less than 5 ppm of moister content. A GeneCust desiccant bag was placed in the mixture to reduce the water content to a minimal level.The battery grade lithium hexafluorophosphate (LiPF6) purchased from Fluorochem was kept and used under the dry atmosphere of the glove box.
The lithium 4,5-dicyano-2-(trifluoromethyl)imidazole-1-ide (LiTDI) and lithium bis(fluorosulfonyl)imide (LiFSI) were supplied by Arkema (Pierre-Bénite, France). Before use LiTDI was dried under vacuum at 120 °C and then placed under a dry atmosphere in the glove box and kept there. LiTDI, LiFSI and LiPF6 were dissolved in EC/DMC (50/50 wt%) at concentrations going from 1 × 10⁻⁴ mol L−1 to 2 mol L−1 in the glove box and kept there until use.
Prior to any measurement, the water content of each electrolyte was measured using an 831 Karl-Fisher Coulometer (Metrohm). The water content of the LiPF6 and LiFSI electrolytes was lower than 20 ± 1 ppm and that of the LiTDI electrolytes, lower than 100 ± 1 ppm as this salt is very hygroscopic.
3.2. Experimental methods
4. Results and discussion
The transport properties of LiTDI, LiFSI and LiPF6 in EC/DMC are investigated at fixed concentration (1 mol L−1) over a large temperature range or at 25 °C as a function of the concentration in Li salt that ranges from 0 to 2 mol L−1. From these results, the Li+ effective radius, the mean ion-pair dissociation coefficient and the thermodynamic parameters for ion-pair formation are determined. Finally, the most likely ion-pair structure for these salts is proposed.4.1. Conductivity, viscosity and self-diffusion coefficients
Conductivities and viscosities of the studied electrolytes are used here to calculate the ion-pair (IP) dissociation coefficient by using the Walden rule. With this aim, LiFSI conductivities and viscosities in EC/DMC have been measured as a function of the temperature and the results are presented in Fig. 4.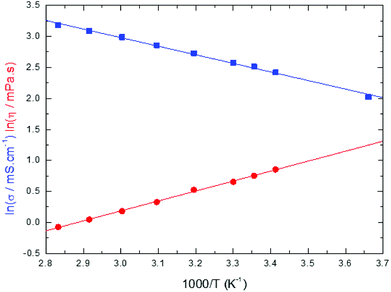 | ||
| Fig. 4 Logarithmic plot of the conductivity (blue squares) and the viscosity (red discs) of LiFSI at 1 mol L−1 in EC/DMC (50/50 wt%) as a function of 1/T. | ||
The data plotted in Fig. 4 shows that the Arrhenius equations for the conductivity and the viscosity are verified:
 | (16) |
 | (17) |
In eqn (16) and (17), Eaη and Eaσ are the activation energies for the two processes and η0 and σ0 fitting parameters. The values of these parameters are reported in Table 3 together with those for LiTDI and LiPF6 in EC/DMC. The R2 correlation coefficient values, which are over 0.99, show that eqn (16) and (17) fit perfectly the experimental results obtained over the temperature range investigated.
| Conductivity | σ0 (mS cm−1) | Eaσ (kJ mol−1) ±0.5 | R2 |
|---|---|---|---|
| LiTDI | 1324 | 13.6 | 0.9948 |
| LiFSI | 1292 | 11.6 | 0.9965 |
| LiPF6 | 1545 | 12.1 | 0.9986 |
| Viscosity | η0 | Eaη (kJ mol−1) ±0.5 | R2 |
|---|---|---|---|
| LiTDI | 0.017 | 14.1 | 0.9992 |
| LiFSI | 0.009 | 13.4 | 0.9979 |
| LiPF6 | 0.011 | 14.1 | 0.9984 |
The Eaσ values are a slightly lower than that of Eaη but, by taking into account the uncertainty, it can be considered that Eaσ ≃ Eaη (especially for LiTDI). When Eaσ = Eaη the Walden product ση is strictly independent of the temperature and hence remains constant. Thus, this relation in only approximately verified.
Conductivity variations at 25 °C of LiTDI, LiFSI and LiPF6 in EC/DMC have been represented as a function of the salt concentration in Fig. 5. All curves present a maximum of conductivity, which depends on the nature of the anion: at 0.75 mol L−1 for LiTDI, 1 mol L−1 for LiPF6 and 1.16 mol L−1 for LiFSI. The maximum of conductivity σmax for each electrolyte is reported in Table 4. In the case of LiTDI, σmax is only of 6.8 mS cm−1 owing to its lower dissociation coefficient32 in EC/DMC. This means that LiTDI starts forming ion-pairs at a lower concentration than LiFSI and LiPF6. Once the maximum conductivity is reached, the conductivity drops more or less sharply owing to the increase in viscosity that depends on the salt anion.
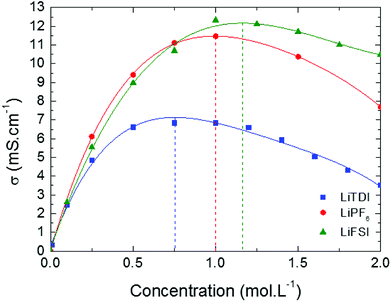 | ||
| Fig. 5 Conductivity of LiTDI, LiFSI and LiPF6 in EC/DMC at 25 °C as a function of the salt concentration. | ||
| LiTDI | LiFSI | LiPF6 | |
|---|---|---|---|
| σmax (mS cm−1) | 6.8 | 12.3 | 11.4 |
| Cm (mol L−1) | 0.75 | 1.16 | 1.00 |
The 7Li and 19F self-diffusion coefficients (D(7Li) and D(19F)) of the LiTDI, LiPF6 and LiFSI at 1 mol L−1 in EC/DMC electrolytes were determined by PGSE-NMR as a function of the temperature. Results are reported in Fig. 6.
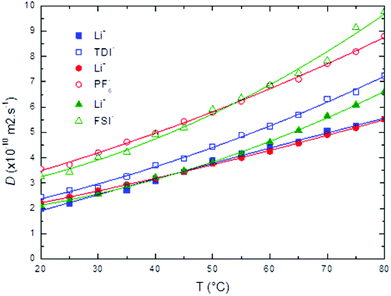 | ||
| Fig. 6 7Li and 19F self-diffusion coefficients (D(7Li) and D(19F)) of LiTDI (blue squares), LiPF6 (red circles) and LiFSI (green triangles) at 1 mol L−1 in EC/DMC as a function of the temperature. | ||
It can be noticed that D(7Li), which corresponds to the self-diffusion of all species containing at least one 7Li nucleus, does not exhibit any significate change from one lithium salt to the other contrarily to D(19F), the self-diffusion of all species containing at least one 19F nucleus. D(19F) values are larger than D(7Li) and depends on the anion size with the following sequence:
| D(19F)TDI < D(19F)FSI ⋍ D(19F)PF6 |
Hence, the species containing a smaller anion diffuse more rapidly.
4.2. Lithium effective ionic radius
Relative viscosities of LiTDI and LiFSI in EC/DMC are plotted against the salt concentration in Fig. 7 at several temperatures. All curves have been fitted according to the JDK eqn (7). It can be noticed that the DC2 term of this equation becomes predominant when the salt concentration is over 0.1 mol L−1. The fitting curves exhibit a high correlation constant: R2 = 0.99999, justifying the use of the JDK equation.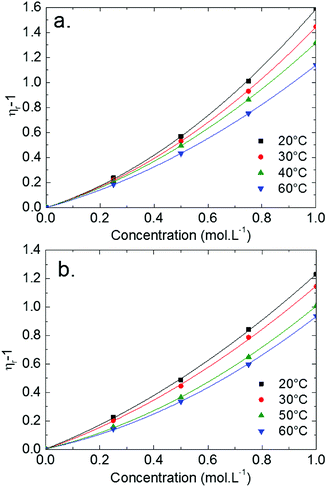 | ||
| Fig. 7 Variations of the relative viscosity (ηr − 1) as a function of the concentration of LiTDI (a) and LiFSI (b) in EC/DMC at several temperatures. | ||
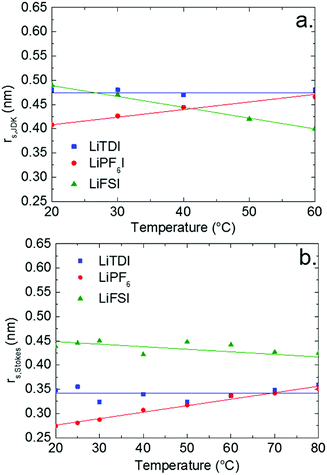
The JDK equation B parameter values and that of the rs,JDK radii, deduced from eqn (9), for the LiTDI, LiFSI and LiPF6 electrolytes are reported in Table 5. The Li+ effective solute radius, which has been obtained by using the JDK equation coupled to the Einstein relation and by applying the Stokes–Einstein equation, is plotted against the temperature in Fig. 8.
| T (°C) | B (L mol−1) | rs,JDK (nm) | |
|---|---|---|---|
| LiTDI | 20 | 0.69 | 0.48 |
| 30 | 0.68 | 0.48 | |
| 40 | 0.66 | 0.47 | |
| 60 | 0.66 | 0.48 | |
| LiFSI | 20 | 0.75 | 0.49 |
| 30 | 0.68 | 0.47 | |
| 50 | 0.45 | 0.42 | |
| 60 | 0.40 | 0.40 | |
| LiPF6 | 20 | 0.43 | 0.41 |
| 30 | 0.49 | 0.43 | |
| 40 | 0.55 | 0.45 | |
| 60 | 0.64 | 0.47 |
The graphs reported in Fig. 8 show that rs,JDK values are systematically larger than rs,Stokes. The reason for that is not clear but in the case of rs,JDK, the ions or ion-pairs are submitted to a shear stress but not in the case of rs,Stokes which is deduced from self-diffusion measurements. Hence, the transport conditions are not strictly equivalent and the number of solvating molecules could be different.
Regarding the variations of rs,JDK and rs Stokes with the temperature, the same trend is observed when the temperature is increased: rs (Li+, LiTDI) does not vary significantly, rs (Li+, LiPF6) increases and rs (Li+, LiFSI) decreases. This suggests that the three lithium salts form different types of ion-pairs which themselves exhibit a different behavior when the temperature is raised. This will be analyzed in the following paragraphs.
The first solvation layer of the lithium cation for LiTDI in EC/DMC has been modelized using the Conductor-Like Screening Model (COSMO) procedure. The results of this simulation are represented in Fig. 9. Three solvent molecules and one anion were arranged around the cation without considering polarization and deformation of the electron cloud.
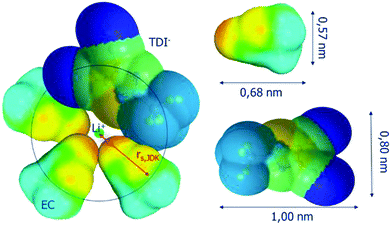 | ||
| Fig. 9 Representation of the first solvation sphere of Li+ in the case of LiTDI dissolved in EC/DMC. | ||
The black circle having the lithium cation at its center corresponds to the section of the JDK solvation sphere (radius rs,JDK). As the rs,Stokes is even smaller, it appears clearly that the JDK equation allows a better estimation of the lithium effective solute radius. One possible reason for that is that the rs,Stokes values are deduced from D(7Li), the self-diffusion coefficient of all species containing a lithium ion and not D+, that of free lithium ions only.
4.3. Ion-pair dissociation coefficients
Variations of the ion-pair dissociation coefficients with the temperature which are obtained by using eqn (11) (αD,Wal) or eqn (13) (αD,NE) are plotted in Fig. 10.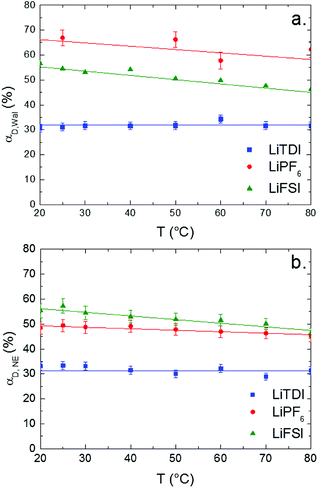 | ||
| Fig. 10 Dissociation coefficients of LiTDI, LiFSI and LiPF6 in EC/DMC at 1 mol L−1 measured using the Walden rule (a) and the Nernst–Einstein equation (b), as a function of the temperature. | ||
As expected from its lower conductivity, LiTDI is the less dissociated salt of the three in EC/DMC even with TDI−, a large hückel anion with a highly delocalized negative charge.37 The size of the anion and its delocalized charge should be in favor of poor coulombic interactions. It can be noticed that both methods lead to αD values which are in fair agreement for LiTDI and LiFSI but not for LiPF6 as the difference reaches 15%. As indicated by the graphs reported in Fig. 10, both methods agree on the variations of αD with the temperature: αD does not depend on the temperature in the case of the LiTDI based electrolyte, but on the contrary, decreases with the temperature in the case of LiPF6 and LiFSI. These observations suggest that the ion pairs formed by each salt in EC/DMC do not have the same structure. It can also be noted that the temperature independence of αD (LiTDI) is in agreement with the relation between the activation energies Eaη ≈ Eaσ which has been found experimentally for LiTDI. Thus, according to eqn (16) and (17), the Walden product does not depend on the temperature.
4.4. Gibbs free energy of association for LiTDI, LiPF6 and LiFSI in EC/DMC
The dissociation coefficient of LiTDI, LiFSI and LiPF6 in EC/DMC, which is strictly below 1 at the selected concentration of 1 mol L−1, is evidence of the existence of ion-pairs and/or larger aggregates within the electrolytes. The equilibrium constant KIP for ion pair formation:| Li+ + X− → LiX |
 | (18) |
The standard Gibbs free energy for ion pair formation,  can be calculated by:
 | (19) |
The temperature dependence of  is plotted in Fig. 11.
  values calculated with αD,Wal and αD, NE are close excepted in the case of LiPF6. Because the LiFSI-EC/DMC electrolyte has a higher conductivity than LiPF6-EC/DMC it is likely that LiFSI is in a less associated state in the present experiment conditions. Thus, the considered
  (LiPF6) was calculated using αD,NE.
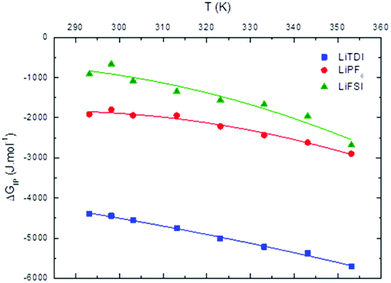 | ||
Fig. 11 Standard Gibbs free energy  for ion pair formation as a function of the temperature for LiTDI, LiPF6 and LiFSI at 1 mol L−1 in EC/DMC. for ion pair formation as a function of the temperature for LiTDI, LiPF6 and LiFSI at 1 mol L−1 in EC/DMC. | ||
For LiPF6 and LiFSI in EC/DMC,  values are negative. Thus, the entropy contribution to the free energy dominate the enthalpy contribution meaning that ion-pair formation here follows an exergonic process.
  decreases when the temperature rises owing to the weakening of ion–solvent interactions. That is also the case for LiTDI even though IP association was seen to be very weakly temperature dependent (Fig. 10).
  variations can be fitted by the following polynomial equation:16
 | (20) |
Values of constants a, b and c are summarized in Table 6 along with the correlation coefficient R2.
| a (J mol−1 K−2) | b (J mol−1 K−1) | c (J mol−1) | R2 | |
|---|---|---|---|---|
| LiTDI | −0.06 | 17.02 | −4193 | 0.994 |
| LiPF6 | −0.23 | 128.82 | −20117 | 0.97 |
| LiFSI | −0.25 | 135.16 | −18685 | 0.92 |
 and
and  respectively the ion-pair formation standard enthalpy and entropy can be calculated by using eqn (21) and (22):
 | (21) |
 | (22) |
 and
and  variations with the temperature are presented in Fig. 12.
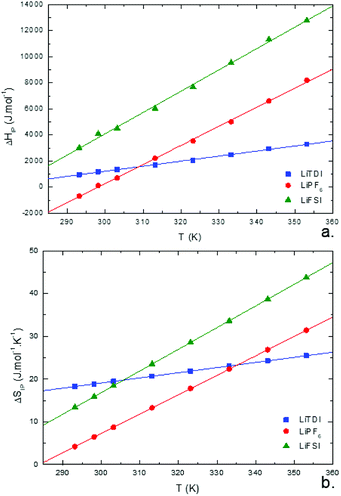 | ||
Fig. 12 Standard enthalpy  (a) and entropy (a) and entropy  (b) for ion-pair formation as a function of the temperature for LiTDI, LiPF6 and LiFSI at 1 mol L−1 in EC/DMC. (b) for ion-pair formation as a function of the temperature for LiTDI, LiPF6 and LiFSI at 1 mol L−1 in EC/DMC. | ||
 and
and  values both increase with the temperature.
  is negative only for LiPF6 below 300 K and
  is always positive. For these lithium salts in EC/DMC, ion-pairing is an endothermic process excepted for LiPF6 at temperatures below 300 K.
Entropy can be taken as a measure of disorder resulting from the formation of ion-pairs. During the association process, the number of molecules is reduced from 2 to 1 which means that a change in ion solvation occurs: more than one solvent molecule is released and this number is likely to increase when the temperature is raised. However, increasing the electrolyte temperature has a low impact on the association entropy of the LiTDI-based electrolyte. This could be explained by considering that the kind of ion-pairs formed by LiTDI in EC/DMC are of the S2IP type. Owing to weaker interactions between solvated ions in the ion-pairs, the ion pairing process will be less affected by temperature variations. Thus, fewer solvent molecules are released during the association process of LiTDI than during that of LiPF6 and LiFSI.
4.5. Discussing the ion-pair structure of LiTDI, LiPF6 and LiFSI in EC/DMC
Association of free ions into ion-pairs is an endothermic ( > 0) and an exergonic (
 < 0) phenomenon for LiTDI, LiFSI and LiPF6 in EC/DMC. Due to the nature of EC, a strongly polar molecule with a high dielectric constant preferentially solvating Li+ in EC/DMC,38 the formation of CIP is unlikely. This kind of ion-pairs are found in solvents of low dielectric constant like dioxanne, benzene or cyclohexane. A positive value for
  indicates that the desolvation, which occurs during the formation of the ion-pairs, brings a predominant positive contribution (ΔHsol) to the standard enthalpy over the negative contribution due to the released coulombic energy (ΔHel). Thus, the formation of a SIP structure appears more likely for LiPF6 and LiFSI. Concerning LiTDI, for which the
  slop is weaker than that of LiFSI and LiPF6, the modulus of the two different contributions of the association enthalpy might be close enough to nearly compensate each other which is in fair agreement with a S2IP type of ion-pairing as stated previously.
It was also noticed that the average Li+ effective solute radius, which takes into account free solvated lithium ions and those engaged in IP or larger aggregates, could vary with the temperature. A reduction of this radius after a rise in temperature (LiFSI) would suggest the formation of ion-pairs of the SIP type. On the contrary, an increase or no variation of the effective solute radius with the temperature (LiTDI) would more likely suggest the formation of S2IP.
Finally, LiPF6 presents a peculiar behavior. The Li+ effective solute radius increases with the temperature and, it is the only salt that exhibits a negative standard enthalpy at room temperature or below. As the number of free ions within the solution decreases when the temperature is raised, this phenomenon can be explained by the transformation of a number of SIP into S2IP. This also explains the change in sign of  for LiPF6-based electrolyte in EC/DMC.
5. Conclusion
The conductivity and viscosity study of LiFSI, LiTDI and LiPF6 solutions in EC/DMC show that these two transport processes are not strictly coupled as their activation energies differ by 1 to 2 kJ mol−1. The reason for that could be the formation of ion-pairs when the concentration in salt in solution is increased to 1 mol L−1. The best conductivity at room temperatures is obtained for LiFSI followed closely by LiPF6, the reason for this being a lower dissociation coefficient for LiTDI. In addition, the maximum in conductivity is obtained in the case of LiFSI and LiPF6 around 1 mol L−1 but only 0.75 mol L−1 for LiTDI.The ion-pair dissociation coefficient (αD) and the lithium cation effective solute radius (rs) of the LiTDI, LiFSI and LiPF6 salts in an EC/DMC binary solvent were investigated at temperatures ranging from 25 °C to 80 °C. The ion-pair structures of these salts, i.e. solvent-shared ion-pair (SIP) and solvent separated ion-pair (S2IP), were deduced from the study of the variations of αD and rs. αD was determined by using the Walden rule and also by using the self-diffusion coefficients values and the Nernst–Einstein equation. Both methods gave results in fair agreement for the variations of αD with the temperature. In a similar way, rs was calculated using the Jones–Dole–Kaminsky equation coupled with the Einstein relation and the Stokes–Einstein equation. Even though the first method leads to higher values for rs than the other, there was a good agreement concerning the variations of rs with the temperature. By analyzing the variations of αD and rs with the temperature, LiFSI and LiPF6 ion-pairs could be characterized as SIP. However, in the case of LiPF6  exhibits a sign change above room temperature meaning that SIP and S2IP could co-exist at room temperature and that a number of SIP transform to S2IP when the solution temperature is raised. In the case of the LiTDI-based electrolyte, αD, rs,
  and
and  are not temperature dependent. This has been assigned to the fact that LiTDI ion-pairs are of the S2IP type.
The temperature dependence of the Gibbs free energy, enthalpy and entropy for the ion-association process thermodynamic parameters allowed us to confirm the selected ion-pair structure for each lithium salt. Moreover, the standard Gibbs free energy  for ion-pair formation is negative for all electrolytes meaning that this process is exergonic.
  is positive at all temperature investigated indicating that there is a net increase in the number of free solvent molecules during the ion association process.
  is positive excepted for LiPF6 at room temperature or below. It can be concluded that the desolvation process is more energetic than the coulombic contribution to the overall ion-pair formation. Future work will now be devoted to Raman spectroscopy in order to confirm the ion-pair structures.
Conflicts of interest
There are no conflicts to declare.References
- J. M. Tarascon and M. Armand, Nature, 2001, 414, 359–367 CrossRef CAS PubMed.
- M. Armand and J. M. Tarascon, Nature, 2008, 451, 652–657 CrossRef CAS PubMed.
- B. Scrosati and J. Garche, J. Power Sources, 2010, 195, 2419–2430 CrossRef CAS.
- E. M. Erickson, C. Ghanty and D. Aurbach, J. Phys. Chem. Lett., 2014, 5, 3313–3324 CrossRef CAS PubMed.
- D. Linden, Handbook of Batteries, 3rd ednn, McGraw-Hill, 2002 Search PubMed.
- A. Yoshino, Angew. Chem., Int. Ed., 2012, 51, 5798–5800 CrossRef CAS PubMed.
- Y. Nishi, H. Azuma and A. Omaru, US Pat., No. 4 959 281, 1990.
- H. U. Sverdrup, Resour., Conserv. Recycl., 2016, 114, 112–129 CrossRef.
- Y. Yang, M. T. McDowell, A. Jackson, J. J. Cha, S. S. Hong and Y. Cui, Nano Lett., 2010, 10, 1486–1491 CrossRef CAS PubMed.
- B. L. Ellis, K. T. Lee and L. F. Nazar, Chem. Mater., 2010, 22, 691–714 CrossRef CAS.
- R. Petibon, V. L. Chevrier, C. P. Aiken, D. S. Hall, S. R. Hyatt, R. Shunmugasundaram and J. R. Dahn, J. Electrochem. Soc., 2016, 163, A1146–A1156 CrossRef CAS.
- N. Liu, H. Wu, M. T. McDowell, Y. Yao, C. Wang and Y. Cui, Nano Lett., 2012, 12, 3315–3321 CrossRef CAS PubMed.
- T. Li, Y. L. Cao, X. P. Ai and H. X. Yang, J. Power Sources, 2008, 184, 473–476 CrossRef CAS.
- M. Sanders, Lithium-Ion Battery Raw Material & Demand 2016-2025, San Francisco, CA, 2017 Search PubMed.
- L. Li, S. Zhou, H. Han, H. Li, J. Nie, M. Armand, Z. Zhou and X. Huang, J. Electrochem. Soc., 2011, 158, A74 CrossRef CAS.
- A. Borun and A. Bald, J. Chem. Eng. Data, 2016, 61, 3788–3793 CrossRef CAS.
- M. Bachelin, P. Gans and J. B. Gill, J. Chem. Soc., Faraday Trans., 1992, 88, 3327–3330 RSC.
- P. Gans, J. B. Gill and P. J. Longdon, J. Chem. Soc., Faraday Trans. 1, 1989, 85, 1835–1839 RSC.
- D. G. Thomas, J. Colloid Sci., 1965, 20, 267–277 CrossRef CAS.
- G. Jones and M. Dole, J. Am. Chem. Soc., 1929, 51, 2950–2964 CrossRef CAS.
- M. Kaminsky, Z. Phys. Chem., 1957, 12, 206 CrossRef CAS.
- K. G. Lawrence, A. Sacco, A. De Giglio and A. Dell'Atti, J. Chem. Soc., Faraday Trans. 1, 1989, 85, 23–32 RSC.
- N. Martinus, D. Crawford, D. Sinclair and C. A. Vincent, Electrochim. Acta, 1977, 22, 1183–1187 CrossRef CAS.
- A. A. M. M. Lencka, S. J. Sanders and R. D. Young, Int. J. Thermophys., 1998, 19 CrossRef.
- P. Z. Walden, Physik Chem., 1906, 55, 207–246 CAS.
- A Dictionary of Chemistry, ed. J. Daintith, Oxford University Press, 6th edn, 2008, Print ISBN-13: 9780199204632, DOI:10.1093/acref/9780199204632.001.0001.
- W. Xu, E. I. Cooper and C. A. Angell, J. Phys. Chem. B, 2003, 107, 6170–6178 CrossRef CAS.
- C. Austen Angell, Y. Ansari and Z. Zhao, Faraday Discuss., 2012, 154, 9–27 RSC.
- C. A. Angell, Solid State Ionics, 1983, 9, 3–16 CrossRef.
- M. P. Longinotti and H. R. Corti, J. Phys. Chem. B, 2009, 113, 5500–5507 CrossRef CAS PubMed.
- W. X. Masahiro Yoshizawa and C. Austen Angell, J. Am. Chem. Soc., 2003, 125, 15411–15419 CrossRef PubMed.
- C. L. Berhaut, P. Porion, L. Timperman, G. Schmidt, D. Lemordant and M. Anouti, Electrochim. Acta, 2015, 180, 778–787 CrossRef CAS.
- A. Ferry, G. Orädd and P. Jacobsson, Electrochim. Acta, 1998, 43, 1471–1476 CrossRef CAS.
- M. P. Longinotti and H. R. Corti, J. Phys. Chem. B, 2009, 113, 5500–5507 CrossRef CAS PubMed.
- C. Schreiner, S. Zugmann, R. Hartl and H. J. Gores, J. Chem. Eng. Data, 2009, 55, 1784–1788 CrossRef.
- Y. Aihara, K. Sugimoto, W. S. Price and K. Hayamizu, J. Chem. Phys., 2000, 113, 1981–1991 CrossRef CAS.
- L. Niedzicki, S. Grugeon, S. Laruelle, P. Judeinstein, M. Bukowska, J. Prejzner, P. Szczeciñski, W. Wieczorek and M. Armand, J. Power Sources, 2011, 196, 8696–8700 CrossRef CAS.
- K. Xu and A. Von Cresce, ECS Trans., 2012, 41, 187–193 CAS.
| This journal is © The Royal Society of Chemistry 2019 |


