Hydrothermal liquefaction of blackcurrant pomace and model molecules: understanding of reaction mechanisms†
Maxime
Déniel
ab,
Geert
Haarlemmer
 *a,
Anne
Roubaud
a,
Elsa
Weiss-Hortala
b and
Jacques
Fages
b
aCEA-LITEN, Bioresources Thermal Conversion Laboratory, 17 rue des Martyrs, 38054 Grenoble, France. E-mail: geert.haarlemmer@cea.fr; Fax: +33438785251; Tel: +33438782495
bUniversité de Toulouse, Ecole des Mines d'Albi, CNRS Centre RAPSODEE, 81013 Albi, France
First published on 7th February 2017
Abstract
Hydrothermal liquefaction (HTL) refers to the conversion of carbonaceous resources into oily substances in hot pressurized liquid water. During this process, constitutive biomass molecules decompose into thousands of organic compounds, following complex reaction mechanisms. The chemistry behind HTL processes is highly complex and still poorly understood to date, in spite of many research efforts. After a detailed analysis of a wet bioresource, blackcurrant pomace, a selection of representative model compounds was subjected to hydrothermal liquefaction conditions (300 °C, 60 min), either alone or as binary, ternary and quaternary mixtures: glucose, xylose, and microcrystalline cellulose were chosen to represent carbohydrates; guaiacol and alkali lignin for native lignin; glutamic acid for proteins; and linoleic acid for lipids. The results show that the reaction products mainly arise from degradation of individual compounds. The main reactions that can be identified are decarboxylation, dehydration, and condensation reactions producing heavy compounds found in the bio-oil and the char. Some binary interactions have been identified such as the Maillard reaction between carbohydrates and proteins, and also a strong interaction between carbohydrates and lipids for bio-oil formation. Comparative experiments showed that HTL of the real resource (blackcurrant pomace) could be qualitatively represented by model mixtures, in terms of the molecular composition of the products, especially when model fibres were used. The quantitative representativeness of the simulating monomers is lower than that obtained by using model polymers.
1 Introduction
With the ever increasing demand for energy coinciding with the rarefaction of fossil resources, and an ever increasing amount of various organic wastes, waste-to-energy solutions are gaining momentum. Among these solutions, thermochemical processes can be used to convert biomass and produce energy in the form of heat and electricity, as well as solid, liquid and gaseous fuels. Energy valorisation of wet bioresources through dry conversion routes (e.g. combustion or gasification) is particularly problematic, as drying of large amounts of wet waste is costly. To avoid this drying cost, hydrothermal processes are often proposed to convert wet biomass and waste. They use water as a reaction medium to perform the conversion thereby avoiding drying.1Hydrothermal liquefaction (HTL) is the conversion of carbonaceous resources into oily substances in hot pressurised liquid water. It decomposes biomass and produces four valuable products: a crude-like bio-oil with higher heating values up to 35–40 MJ kg−1, a combustible solid residue called ‘char’, an aqueous phase containing light polar platform chemicals, and a CO2-rich gaseous phase also containing certain amounts of hydrogen and light hydrocarbons. Many resources are considered for HTL, such as sewage sludge,2 food processing residues,3 and algae.4 Typical conditions for hydrothermal liquefaction are in the 300 °C range at pressures above the saturation pressure of water.5 Other important process parameters are the dry matter concentration in the reaction medium (10–20%), and the use of pH-regulating additives to optimise HTL in basic media and increase the production of bio-oils from hydrothermal liquefaction of lignocellulosic biomass.3
The chemistry behind HTL processes is highly complex. The biomass considered in this work is composed of not only lignocellulosic compounds but also lipids, proteins, and small carbohydrates. Biomass polymers and molecules required by living organisms decompose into thousands of organic molecules via complex reaction mechanisms. For instance, Faeth, et al.6 identified over 20![[thin space (1/6-em)]](https://www.rsc.org/images/entities/char_2009.gif) 000 unique molecular formulae both in the aqueous phase and the bio-oil produced by HTL of microalgae Nannochloropsis sp., which shows the high complexity of reaction networks. An additional issue is the important variety of biomass compositions, in particular the lignin content varies from zero to 50%.7 While it is virtually impossible to fully apprehend all reactions, it is possible to gain a good understanding of the mechanisms by studying selected model compounds. This would lead to the identification of the main contributing species to the formation of products, either alone or through interactions, and to the optimisation of the initial biochemical composition of resources according to the desired product.
000 unique molecular formulae both in the aqueous phase and the bio-oil produced by HTL of microalgae Nannochloropsis sp., which shows the high complexity of reaction networks. An additional issue is the important variety of biomass compositions, in particular the lignin content varies from zero to 50%.7 While it is virtually impossible to fully apprehend all reactions, it is possible to gain a good understanding of the mechanisms by studying selected model compounds. This would lead to the identification of the main contributing species to the formation of products, either alone or through interactions, and to the optimisation of the initial biochemical composition of resources according to the desired product.
Many authors have presented the behaviour of model compounds under the conditions of hydrothermal liquefaction. We provided in a previous paper a review of the main reactions occurring during hydrothermal conversion of model molecules.3 Polymeric model compounds such as cellulose,8–10 lignin,9 proteins10,11 or triglycerides10,12,13 have been the subject of many research papers investigating the reaction pathways and degradation kinetics of individual model compounds. Moreover, many model monomers have been used, such as monosaccharides,14–16 guaiacol,17 amino acids18 or fatty acids.19–21 Previous studies identified the main reaction pathways of model molecules in hydrothermal media. The reactivity is characterised by a first common hydrolysis step, which produces monomers: monosaccharides from cellulosic fibres,22 amino acids from proteins,23 phenol monomers and oligomers from lignin24 and fatty acids and glycerol through hydrolysis of triglycerides (lipids).13 The amount of char produced during HTL is highly correlated with bad hydrolysis of the fibres in biomass: it has been shown that cellulose and lignin were significant contributors to char formation.9
After the hydrolysis step, monomers are decomposed following many reaction pathways, depending on factors such as the temperature or pH of the reaction media. Monosaccharides are very reactive in subcritical water, and they are decomposed following three main mechanisms: retro-aldol condensations to produce light polar intermediates (aldehydes, ketones, carboxylic acids…),15,16 dehydrations to produce furan and phenol intermediates,15,16,25 and isomerisation known as Lobry de Bruyn–van Ekenstein transformation.15,16 Amino acids have been extensively studied in the field of geochemistry, and follow two main reaction pathways in hydrothermal media: deamination to produce organic acids and ammonia, as well as decarboxylation to produce amines and carbon dioxide.18,26,27 Phenol monomers and oligomers undergo various reactions in hydrothermal media, especially under supercritical conditions: hydrolysis of methoxy groups, breakage of C–C bonds, alkylations, condensations…. While aromatic rings are relatively stable at high temperatures, fragmentations of the substituents lead to the formation of small polar molecules such as carboxylic acids, alcohols and aldehydes.28–31 A common model compound of lignin is guaiacol, whose reactivity was mostly studied under supercritical conditions,32–35 even though some studies use typical HTL conditions.17,36 Finally, fatty acids are relatively stable in subcritical water until 300 °C, while they undergo decarboxylation to produce alkanes, alkenes and ketones at higher temperatures.19,37 Furthermore, unsaturated fatty acids can polymerise in subcritical water to produce high-molecular-weight structures.38
While abundant literature currently exists on the hydrothermal conversion of individual model compounds, significantly less research efforts have been made regarding complex model mixtures. The main studies examine HTL of carbohydrate–protein binary mixtures, even though some other studies refer to lipid–protein interactions.3 In addition, the assessment of the representativeness of model compounds towards the case of real resources is rarely considered by authors. To our knowledge, no previous paper has presented results from HTL of a specific resource, coupled with a reactivity study of its individual compounds and their interactions.
Many operating parameters and additives have an influence on the HTL results. It has been often observed that the addition of bases, in particular sodium hydroxide, is beneficial to the bio-oil production. The influence of NaOH on the reactions is complex and few studies have been presented to explain the reaction mechanisms. Other bases have been used in the literature such as KOH, Na2CO3, Ca(OH)2 and many other bases. Some differences between these additives have been suggested such as the catalytic behaviour of potassium cations and a buffer effect of carbonates. In practice NaOH is the most commonly used pH modifier. The use of NaOH to convert lignocellulosic residues leads to higher solubilisation of the organic matter in the aqueous phase and to the inhibition of char formation.39
This paper presents the detailed analysis of a wet bioresource, blackcurrant pomace. A selection of representative model compounds was subjected to hydrothermal liquefaction conditions, following a design of experiments including binary, ternary and quaternary mixtures. Model monomers were used to gain insight into the reaction mechanisms. More complex model polymers were used to assess the representativeness of the monomers in the case of fibres, and to further examine the reactions that occur. The objective is to gain insights into the reactions that take place during HTL, and to assess the representativeness of the selected model compounds towards the real case.
2 Materials and methods
2.1 Characterisation of blackcurrant pomace
Blackcurrant pomace was obtained from a local producer operating in south-east of France, Les Vergers Boiron. The resource is a press cake obtained after berry pressing of two blackcurrant cultivars (Noir de Bourgogne and Andega). The resource was analysed in detail, and its global composition is given in Table 1.| Moisture | 59.6% |
| % of dry matter | |
| Ash content | 4.5 |
| Fibres–cellulose | 18.2 |
| Fibres–hemicellulose | 8.8 |
| Fibres–lignin | 34.6 |
| Proteins | 16.9 |
| Lipids | 14.8 |
| Free carbohydrates | 2.3 (by difference) |
Table 1 shows that blackcurrant pomace is mainly constituted of fibres, representing 61.7% of the total dry matter content. It also contains non-negligible amounts of proteins and lipids, respectively 16.9 and 14.8% of the dry matter content, as well as a low proportion of ashes.
The fibre content and composition of blackcurrant pomace were determined following the NF V18-122 standard.40 The results show that fibres are especially rich in lignin, and contain lower amounts of cellulose and hemicelluloses. The high lignin content can be partially explained by the presence of other phenolic molecules in blackcurrant berries, such as tannins and flavonoids, which polymerize after oxidation and can easily be confused with lignin. Lignin is a complex polymer that varies between species. We decided to use guaiacol as a model compound for lignin, as the guaiacyl unit has been identified in blackcurrant lignin.41 In addition, guaiacol contains relevant chemical groups from lignin. Cellulose and hemicelluloses are represented by glucose and xylose. In the case of blackcurrant pomace, glucose can also be used as a model monomer for hemicelluloses. In fact, blackcurrant is part of the eudicot clade. For this particular class, hemicelluloses are in majority xyloglucans, formed by a back-bone of glucose units linked together by β-1,4-glycosidic bonds, substituted by other monosaccharides such as xylose.42,43 In addition, reactions of monosaccharides (hexoses and pentoses) under hydrothermal conditions are described as very similar.15,16
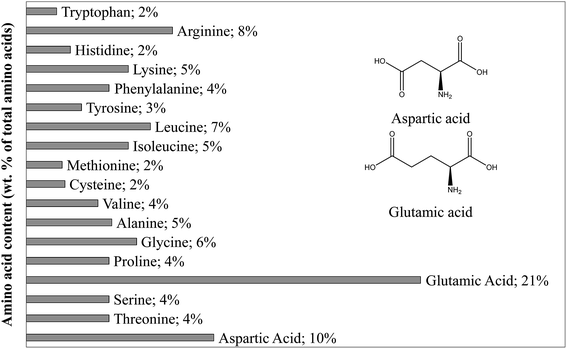
As shown in Table 1, proteins represent 16.9% of the dry matter in blackcurrant pomace. This value is estimated from the nitrogen content obtained following the Kjeldahl method. The selection of the model compound for proteins was based on the composition of proteins contained in blackcurrant pomace, established by an amino acid profile shown in Fig. 1. While many amino acids are present, the dominating acid is glutamic acid, followed by aspartic acid. These two amino acids have a very similar structure. The results of the amino acid profile are in agreement with the previous characterisation of blackcurrant pomace, and we chose glutamic acid as the representative amino acid.44
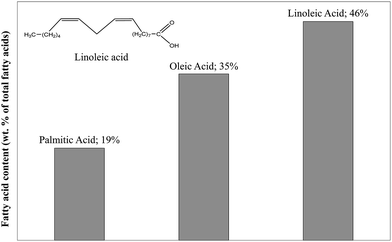
Table 1 shows a lipid content of 14.8% of the dry matter. This value is obtained after hydrolysis with HCl followed by petroleum ether extraction. The fatty acid profile obtained by HPLC is presented in Fig. 2. The lipids in blackcurrant pomace mainly contain three fatty acids. The polyunsaturated linoleic acid (C18H32O2) especially represents nearly half of the lipid content and was selected as the model compound for lipids in this study.
NaOH was selected as a base additive to modify the pH before the reaction. Even if the actual choice remains arbitrary in view of the alternatives (KOH, Na2CO3, Ca(OH)2, etc.), NaOH is the most commonly used base additive, avoiding potential catalytic effects of the K+ ion.
Overall biomass is constituted of different biopolymers, proteins, lipids and fibres. Some of these are easily hydrolysed and rapidly available in their monomeric forms during hydrothermal processing. Other constituents such as fibres are certainly more difficult to hydrolyse. This is why we also studied the substitution of glucose and guaiacol by their respective polymers, namely microcrystalline cellulose and alkali lignin. All reagents – glucose, microcrystalline cellulose, guaiacol, alkali lignin, glutamic acid and linoleic acid – were purchased from Sigma-Aldrich and used as received.
2.2 Design of experiments
The design of experiments (DOE) for hydrothermal liquefaction of model compounds was based on specific designs called mixture designs, in which the variables are the composition of each compound in the mixture. In a mixture DOE, variables depend on each other, as the sum of compositions must equal 100%. In this work, we used an axial mixture design, including experimental test points for pure model compounds, as well as binary to quaternary mixtures. The variables are defined as follows: x1 stands for the mass fraction of glucose or cellulose in a model mixture, x2 stands for the mass fraction of glutamic acid, x3 is the mass fraction of guaiacol or lignin, and x4 stands for the mass fraction of linoleic acid. The variables x1 and x3 are re-used for the respective polymers, rather than introducing additional variables. In Fig. 3, we show the experimental matrix corresponding to the design used to perform HTL of model compounds, and a schematic representation of this DOE.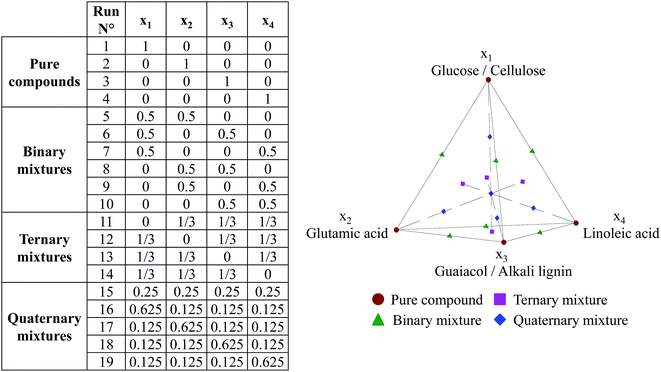 | ||
| Fig. 3 Design of experiments used in hydrothermal conversion of model compounds (axial mixture design + binary mixtures with 4 model monomers). | ||
2.3 Hydrothermal liquefaction experiments
Hydrothermal liquefaction experiments were performed in a 0.6 L stainless steel (type 316) stirred batch reactor (Parr Instruments). In a typical experiment, the reactor is filled with approximately 240 g of slurry prepared from either raw blackcurrant pomace or model compounds, and distilled water. A constant concentration of 15 wt% dry matter in the reaction slurry is used. Prior to the experiment, the autoclave is leak tested, purged and pressurized to 1 MPa with nitrogen gas to guarantee sufficient pressure for gas analysis after the reaction. The reactor is then heated to the reaction temperature, 300 °C, in about 30–35 min. The holding time at the reaction temperature is 60 minutes. The reaction is performed at a stirring speed of 600 rpm. The pressure typically reaches 8–9 MPa at the end of the holding time, depending on the amount of gas produced. After the holding time, the reactor is rapidly cooled to room temperature by air quenching. The gaseous phase in the reactor is vented and analysed by using a micro-chromatograph (Varian Quad CP 4900) equipped with a thermal conductivity detector used on-line. Permanent gases (O2, H2, CO and CH4) are separated on a molecular sieve column using argon as the carrier gas. Light hydrocarbons (C2H4, C2H6, C2H2 and C3H8), CO2 and sulphur species (H2S and COS) are separated on a Poraplot-U column using helium as the carrier gas.Three phases are recovered after the conversion: a gaseous phase, an aqueous phase and an oily residue called “raw organic residue”. After opening the reactor, the aqueous phase is separated from the raw organic residue on a Buchner filter. The bio-oil is then separated from the char by extracting the raw organic residue with a tenfold mass of ethyl acetate, followed by filtration to separate the liquid fraction from the solid fraction. Mass yields of bio-oil, char and gas are defined as the mass ratios between the products and the initial mass of reagents (biomass or model compounds). The yield of the organic matter in the aqueous phase is determined by difference to 100%. This value should be considered as indicative, as water can take part in reactions and therefore impact the overall balance on the organic matter.
For GC-MS analysis of bio-oils, a mass ratio of raw organic residue to ethyl acetate of 1![[thin space (1/6-em)]](https://www.rsc.org/images/entities/char_2009.gif) :
:![[thin space (1/6-em)]](https://www.rsc.org/images/entities/char_2009.gif) 1 was used to minimize the effect of potential solvent pollution on the chromatograms. Organic molecules in the water phase were extracted with ethyl acetate and analysed using the same procedure. The identification of molecules in the bio-oils and aqueous phases is performed by using a gas chromatograph coupled with a mass spectrometer GC-MS (Clarus 500/Clarus 600S, Perkin Elmer) equipped with a DB-1701 capillary column (60 m × 0.25 mm, 0.25 μm film thickness). A 1 μL sample is injected into the instrument with a split ratio of 10
1 was used to minimize the effect of potential solvent pollution on the chromatograms. Organic molecules in the water phase were extracted with ethyl acetate and analysed using the same procedure. The identification of molecules in the bio-oils and aqueous phases is performed by using a gas chromatograph coupled with a mass spectrometer GC-MS (Clarus 500/Clarus 600S, Perkin Elmer) equipped with a DB-1701 capillary column (60 m × 0.25 mm, 0.25 μm film thickness). A 1 μL sample is injected into the instrument with a split ratio of 10![[thin space (1/6-em)]](https://www.rsc.org/images/entities/char_2009.gif) :
:![[thin space (1/6-em)]](https://www.rsc.org/images/entities/char_2009.gif) 1. Helium is used as the carrier gas. The GC oven temperature is programmed from 45 °C (10 min) to 230 °C at a rate of 6 °C min−1, and held at 230 °C for 9.17 min. It is then increased to 250 °C at a rate of 10 °C min−1, and held at 250 °C for 20 min. The NIST mass spectral database is used to identify the peaks. Only when both the match and reverse match are above 800, the identification is taken into account.
1. Helium is used as the carrier gas. The GC oven temperature is programmed from 45 °C (10 min) to 230 °C at a rate of 6 °C min−1, and held at 230 °C for 9.17 min. It is then increased to 250 °C at a rate of 10 °C min−1, and held at 250 °C for 20 min. The NIST mass spectral database is used to identify the peaks. Only when both the match and reverse match are above 800, the identification is taken into account.
The reaction products are quantified by using a Liquid Chromatograph coupled with an Ultraviolet Detector (HPLC-UV). The apparatus is constituted of a Dionex Ultimate 3000 HPLC pump, a Dionex ASI-100 automated sampler, a Dionex TCC-100 column compartment and a Dionex UVD170u ultraviolet detector. The detector allows the simultaneous recording of 4 different wavelengths: 200 nm, 210 nm, 254 nm and 280 nm. A Thermo Scientific Hypersil Gold column (dimensions: 4.6 × 150 mm; porosity: 5 μm) is used. Two distinct methods are used to analyse the products:
• Butyrolactone, 2-pyrrolidone, guaiacol and other phenol derivatives are analysed using a mixture of water and acetonitrile (ACN) as the mobile phase, at a 1 mL min−1 flow rate. The composition of the mobile phase is as follows: 5–10% ACN for 10 min, 10–20% ACN for 10 min, 20–30% ACN for 4 min, and finally 30–5% ACN for 2 min.
• Linoleic acid is analysed under isocratic conditions using a mixture of 5% deionized water and 95% ACN at a 1 mL min−1 flow rate.
For the above analysis, a 25 μL injection volume of diluted sample is used, and the column temperature is maintained at 40 °C. The sample is diluted either in deionized water or in ACN for an aqueous phase or a bio-oil (organic phase) analysis, respectively.
The concentration of organic acids in the aqueous phases is determined by ion chromatography using a Dionex ICS3000 equipped with a Dionex IonPac AS-17C column (4 × 250 mm) and a Dionex IonPac AG-17C guard column (4 × 50 mm). The analysed acids are pyroglutamic, lactic, acetic, propionic and formic acids. A 25 μL injection volume of diluted sample is used. The mobile phase is a mixture of deionized water and NaOH solutions (5 and 100 mmol L−1), at a 2 mL min−1 flow rate. The composition of the mobile phase is as follows: 80% deionized water and 20% NaOH (5 mmol L−1) for 6 min; 80% to 41% deionized water, 0–39% NaOH (100 mmol L−1) and 20% NaOH (5 mmol L−1) for 6 min; 41% deionized water, 39% NaOH (100 mmol L−1) and 20% NaOH (5 mmol L−1) for 2 min. The column temperature is maintained at 30 °C.
3 Hydrothermal conversion of blackcurrant pomace
In this section we present hydrothermal conversion of blackcurrant pomace at a temperature of 300 °C for 60 min, in the absence and presence of sodium hydroxide NaOH to increase the alkalinity of the reaction medium (mass ratio NaOH/dry matter = 9%, corresponding to an initial pH of 12.8 in the reaction slurry).3.1 Presentation of the mass yields
Table 2 shows the mass yields of the products obtained by hydrothermal conversion of blackcurrant pomace under the conditions of the study. The results show that using NaOH benefits the bio-oil yield, increases the solubilisation of the organic matter in the aqueous phase and inhibits char formation. More details on hydrothermal conversion of blackcurrant pomace can be found in previous papers published by our team.39,45,46| Mass yield (wt% of initial dry matter) | Without NaOH (initial pH = 3.1) | With NaOH (initial pH = 12.8) |
|---|---|---|
| Bio-oil | 26.1 (±1.5) | 31.4 (±0.5) |
| Char | 34.5 (±2.6) | 24.3 (±0.8) |
| Gas | 11.6 (±0.6) | 11.0 (±0.1) |
| Aqueous phase (by difference) | 27.7 (±4.7) | 33.3 (±1.4) |
3.2 Molecular composition of the products obtained by GC-MS analysis
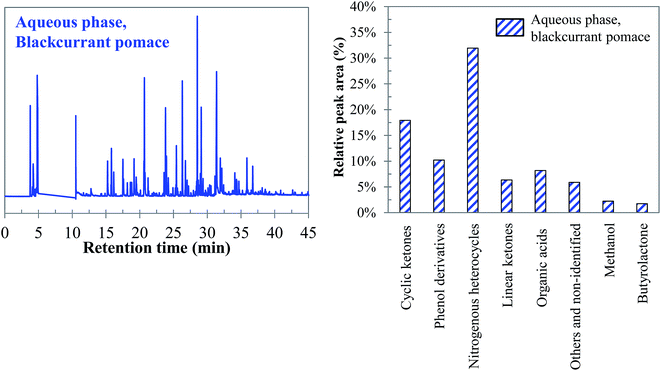
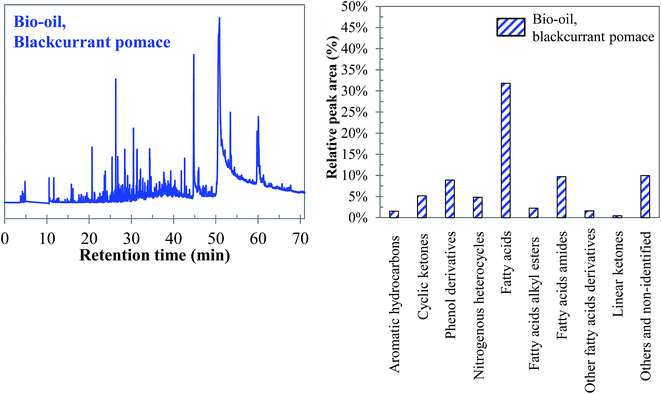
This sub-section presents the results of the molecular characterisation of products obtained by hydrothermal liquefaction of blackcurrant pomace at 300 °C, 60 min in the absence of NaOH. We do not present the molecular characterisation of the products obtained in the presence of NaOH, because we observed previously that they were qualitatively the same.45 In fact, the same chemical families are detected, although the proportions could slightly differ.4 Hydrothermal conversion of individual model monomers
In this section we present hydrothermal conversion of the individual model monomers chosen to represent blackcurrant pomace. These model molecules were converted both in the absence and in the presence of sodium hydroxide NaOH (mass ratio NaOH/model compound = 10%). This is potentially favourable to the reaction, as we observed in Section 3.1.4.1 Hydrothermal conversion of monosaccharides: glucose and xylose
The yields of the products obtained from hydrothermal conversion of model monosaccharides are presented in Fig. 6. Both molecules have a very similar reactivity in terms of product distribution between bio-oil, char, gaseous and aqueous phases, which is consistent with the literature.10,15,16,47,48 Even though we did not measure the conversion of monosaccharides due to lack of adapted analytical tools, we estimate that they are completely converted under the conditions of the study. For instance, Cantero, et al.49 reported a total conversion of glucose in 40 seconds at 300 °C. Yu-Wu, et al.50 showed similarly that glucose undergoes fast degradation above 250 °C. The complete conversion of glucose was also detected by Castello et al.51 after a few seconds of residence time at 400 °C.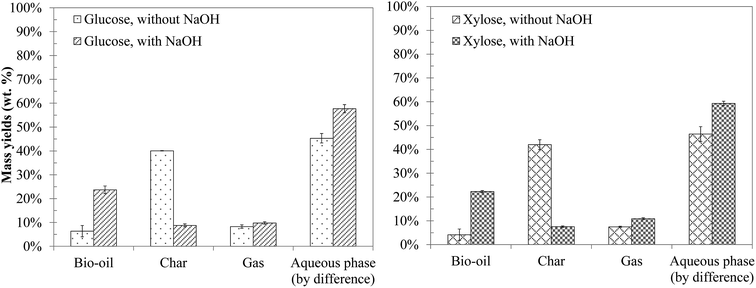 | ||
| Fig. 6 Mass yields of the products from hydrothermal conversion of glucose and xylose (300 °C, 60 min). | ||
In the absence of NaOH, hydrothermal conversion of monosaccharides produces mostly water-soluble organic molecules, and an important amount of char (approximately 40 wt% of the initial mass). The addition of NaOH strongly influences the conversion, notably by increasing the bio-oil yield and reducing the char yield. Biller and Ross10 and Yin and Tan47 made the same observations for cellulose, in the presence of Na2CO3 and NaOH respectively. This effect is also observed when converting blackcurrant pomace in the presence of NaOH, as shown in Section 3: alkaline conditions reduce the char yield, and increase both the bio-oil yield and the solubilisation of the organic matter in the aqueous phase.
The GC-MS chromatograms of the extracted water phase and the bio-oils produced by hydrothermal conversion of glucose and xylose are presented in the ESI (Fig. S31†). The two monosaccharides show a high reactivity under the conditions of the study. This is shown by the high number of degradation products detected by GC-MS analysis. Given the high number of products, only products with relative peak areas representing at least 0.5% of the biggest peak are taken into account for this analysis. Detailed identification of the reaction products is given in the ESI (Tables S12 to S19†).
From the identified compounds, Fig. 7 shows a classification of the main products in different chemical groups, representing at least 95% of the total area of the detected peaks. The main degradation product of glucose in the absence of NaOH is levulinic acid, representing nearly half of the total area of the detected peaks. This molecule is produced by successive degradation reactions from 5-HMF, itself being a dehydration product of glucose.16 In contrast, the presence of NaOH leads to 2-methyl, 2-cyclopenten-1-one as the main reaction product from glucose. Hydrothermal conversion of xylose produces mostly furfural, including under basic conditions.52 Furfural is produced by dehydration of xylose via the intermediate xylulose.15 Other products are also formed, such as phenolic compounds produced by dehydration reactions,25 other organic acids (formic, acetic, propanoic and lactic), linear ketones (e.g.: 2,5-hexanedione and 3,6-heptanedione) and cyclic ketones (derivatives of cyclopenten-1-one and cyclopentanone), furan derivatives (including furfural) and some aromatic hydrocarbons (substituted benzene rings, benzofuran and indanone derivatives).
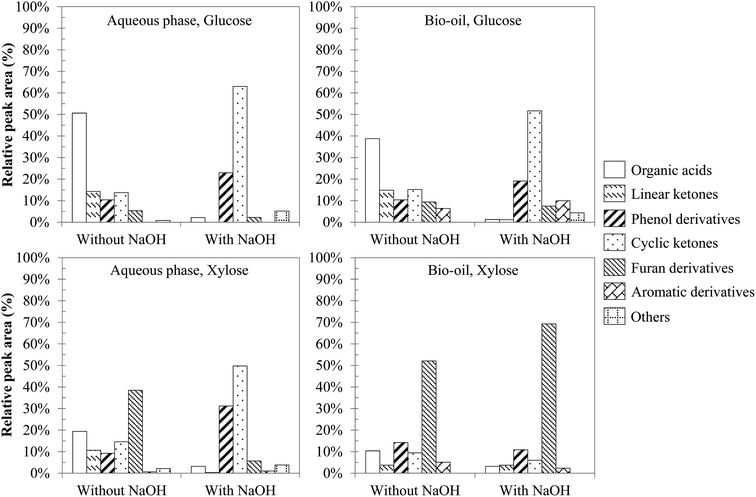 | ||
| Fig. 7 Main chemical families identified in the products from hydrothermal conversion of glucose and xylose (300 °C, 60 min). | ||
Even though variations of the relative peak areas are observed, Fig. 7 shows that hydrothermal conversion of glucose and xylose leads to degradation products of the same nature. Many compounds are detected in both the aqueous phase and the bio-oil, even if bio-oils contain more heavy products (e.g. aromatic hydrocarbons) than aqueous phases. The conversion of glucose without NaOH mainly leads to the formation of organic acids, and in smaller proportions to linear ketones, phenol derivatives, cyclic ketones and furan derivatives. The addition of sodium hydroxide affects the conversion of glucose significantly, leading mainly to cyclic ketones derived from cyclopentenone. An increase in the proportion of phenol derivatives is also noticeable, while the proportion of organic acids greatly decreases. This observation could be due to the neutralization of carboxylic acids by hydroxide ions, thus remaining as carboxylate ions in the aqueous phase instead of being extracted by ethyl acetate. These observations are also found in the case of xylose, although the significant selectivity to furfural results in less clear observations than in the case of glucose.
Initial pH conditions affect the degradation pathways of monosaccharides. Yin and Tan47 suggest that the conversion of cellulose under acidic or neutral conditions is mainly characterised by dehydration of sugars, leading to the formation of furan compounds (5-HMF, furfural) that repolymerise to form char. In contrast, basic conditions favour the solubilisation of the organic matter in the aqueous phase, in the form of anions of organic acids, as well as short chain aldehydes and ketones (2 to 6 carbon atoms). Aida et al.15,16 showed that retro-aldol reactions form such kinds of intermediates (aldehydes, ketones…) from monosaccharides. The degradation of these intermediates via partial oxidation and condensation reactions leads to the formation of organic acids.15,16,52 The degradation of organic acids can ultimately lead to the formation of gas.47
Our experimental observations appear to confirm the results of the literature. Fig. 7 shows the preferential formation of cyclic ketones under basic conditions, along with a decrease of linear ketones. This corresponds to intramolecular aldol condensations of linear ketones, favoured under basic conditions. One example is the intramolecular aldol condensation of 2,5-hexanedione to form 3-methyl-2-cyclopenten-1-one.53 The formation of cyclic ketones by condensation of compounds originating from retro-aldol condensations of monosaccharides has also been proposed in the work of Barbier.52 The preferential formation of cyclic ketones under basic conditions provides some explanations as to the improvement of the bio-oil yield under basic conditions (Fig. 6). Cyclic ketones are less soluble in water than linear ketones and are therefore found preferably in the bio-oil.
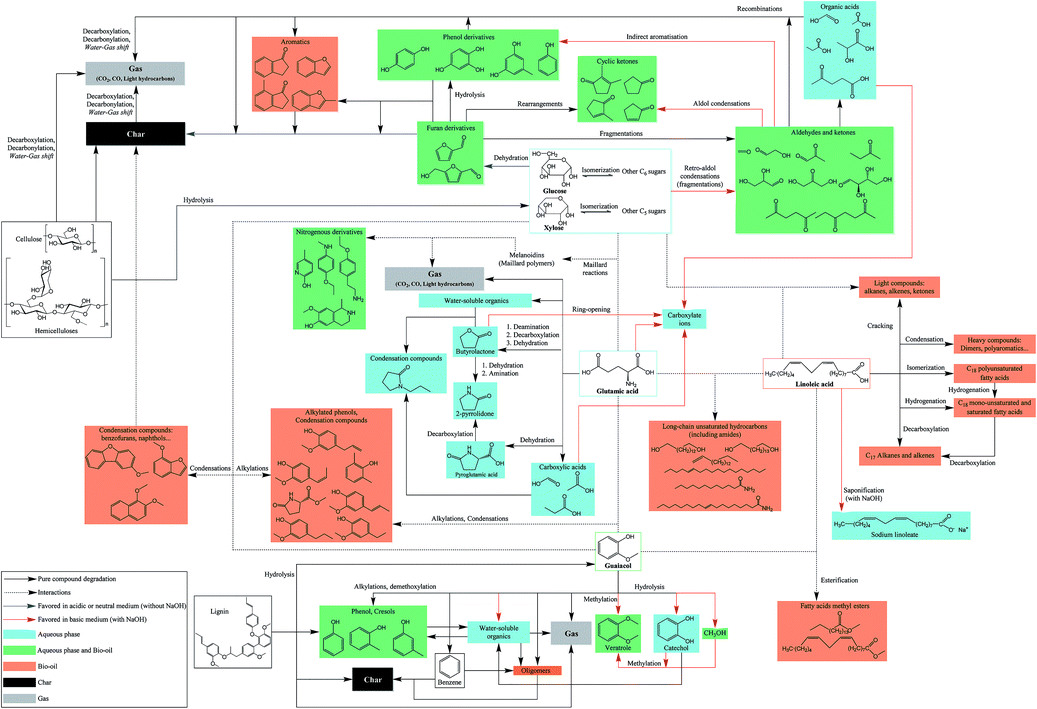
Fig. 7 also shows a significant increase in the proportion of phenol derivatives in the products in the presence of NaOH. These compounds are primarily derived from the hydrolysis of furan derivatives, via the intermediate 1,2,4-benzenetriol.15,16,25 This may seem surprising, since the formation of furan derivatives is not favoured under basic conditions.47 Two hypotheses can however clarify this apparent contradiction. First, we observed a net decrease of the char yield in the presence of NaOH (Fig. 6), indicating the inhibition of repolymerization reactions. Phenolic compounds stay then preferably in monomeric or dimeric forms in the aqueous phase and in the bio-oil. This hypothesis is supported by the fact that hydroxide ions allow the neutralization of certain polymerization intermediates, such as carboxylic acids. These can indeed participate in the formation of polycyclic aromatic structures by acylation of aromatic rings, leading to indanone derivatives,52 or by esterification reactions with hydroxyl groups in the char.54 Because they are neutralized in the aqueous phase in the form of sodium carboxylates, carboxylic acids can no longer participate in these reactions. Second, the formation pathways of phenol derivatives might differ under basic conditions. In particular direct aromatization, through cooperative mechanisms such as Diels-Alder reaction, has been suggested to explain the formation of aromatic rings from monosaccharide fragmentation products.52,55 This hypothesis would reconcile the facts that retro-aldol reactions are favoured in basic media and that a greater proportion of phenolic compounds is observed. In Fig. 8, we propose a reaction scheme of the hydrothermal conversion of glucose and xylose, based on our observations completed with data from the literature.
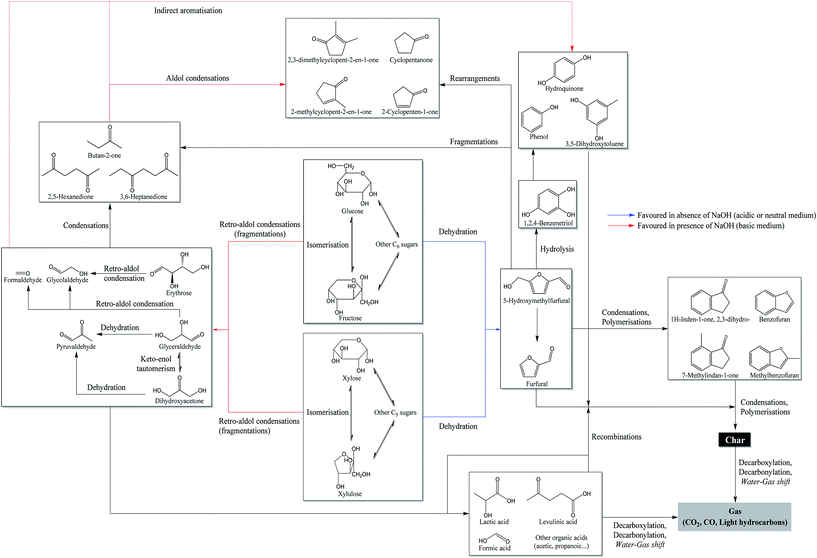 | ||
| Fig. 8 Reaction scheme of the hydrothermal conversion of glucose and xylose based on experimental observations and studies from the literature.15,16,25,52,55,56 | ||
4.2 Hydrothermal conversion of an amino acid: glutamic acid
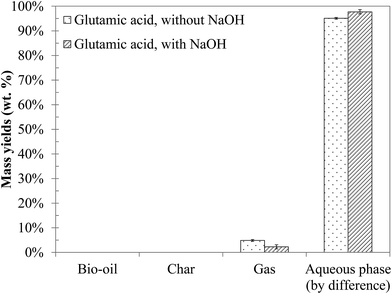
Fig. 9 shows the yields of the products obtained by hydrothermal conversion of glutamic acid. Under the conditions of the study, glutamic acid is mainly converted to water-soluble organic compounds. A small amount of gas is also formed. The addition of NaOH to the reaction mixture only results in a slight decrease of the gas yield and does not affect the global distribution of the phases.The chromatograms obtained by GC-MS analysis of the aqueous phases from hydrothermal conversion of glutamic acid are presented in Fig. S32 of the ESI.† Detailed identifications of the reaction products are also given in the ESI (Tables S20 and S21†). GC-MS analysis identified two main reaction products: butyrolactone and 2-pyrrolidone (butyrolactam). Some minor species were also detected such as 1-propyl, 2-pyrrolidinone and N-propylsuccinimide. GC-MS analysis showed no apparent changes of the reaction products when NaOH was added to the reaction mixture, as only the minority peaks disappeared.
Analysis of the aqueous phase by HPLC-UV allows quantifying the two compounds identified by the GC-MS analysis. The quantification of butyrolactone is however difficult, because it responds badly to the UV detector. Fig. S33 in the ESI† shows the chromatograms of this analysis. A number of changes in the appearance of the chromatograms are noticeable, which implies that other products are formed in the presence of NaOH. However, we could not identify these molecules due to the lack of an adapted detector. The pH of the aqueous phase after hydrothermal conversion of glutamic acid was measured to be 2.7 (pH before the reaction: 3.2). This suggests that a significant amount of organic acids was formed. This hypothesis has been confirmed by the analysis of the aqueous phase by ion chromatography (chromatograms shown in Fig. S34 of the ESI†). This analysis shows that some organic acids are formed by hydrothermal conversion of glutamic acid: mainly pyroglutamic acid, but also formic, acetic and propionic acids. These analyses showed no apparent changes of the reaction products in the presence of NaOH: only minor organic acids are no longer detected.
Table 3 provides a summary of the hydrothermal conversion of glutamic acid in terms of molar selectivity. Although we were not able to quantify glutamic acid due to the lack of suitable equipment, we can assume that its conversion is important, as it can exceed 90% at 250 °C.27 In addition, Table 3 shows that the sum of selectivities is close to 100%.
| Without NaOH | With NaOH | |
|---|---|---|
| Butyrolactone | 1.6% | 4.3% |
| 2-Pyrrolidone | 12.9% | 3.0% |
| Pyroglutamic acid | 70.1% | 76.7% |
| Formic acid | 8.9% | 0.0% |
| Acetic acid | 8.2% | 4.9% |
| Propanoic acid | 6.6% | 0.2% |
| Total | 108.3% | 89.1% |
From the results, we see that hydrothermal conversion of glutamic acid mainly generates organic acids, in particular pyroglutamic acid. This result is consistent with the literature.27 The addition of NaOH in the reaction medium is responsible for decreasing the selectivity of 2-pyrrolidone, and slightly increasing the selectivities of pyroglutamic acid and butyrolactone. The selectivities of other organic acids are decreased. Table 3 shows that the quantified products are not enough to fully explain the hydrothermal conversion of glutamic acid in the presence of NaOH, as the sum of selectivities does not equal 100%. Fig. S33 of the ESI† shows the appearance of new unidentified peaks in HPLC-UV, which could explain this observation, due to the diversification of the reaction products contained in the aqueous phase. From the experimental observations in this section, we propose in Fig. 10 a reaction scheme of hydrothermal conversion of glutamic acid, based on experimental observations and data from the literature.
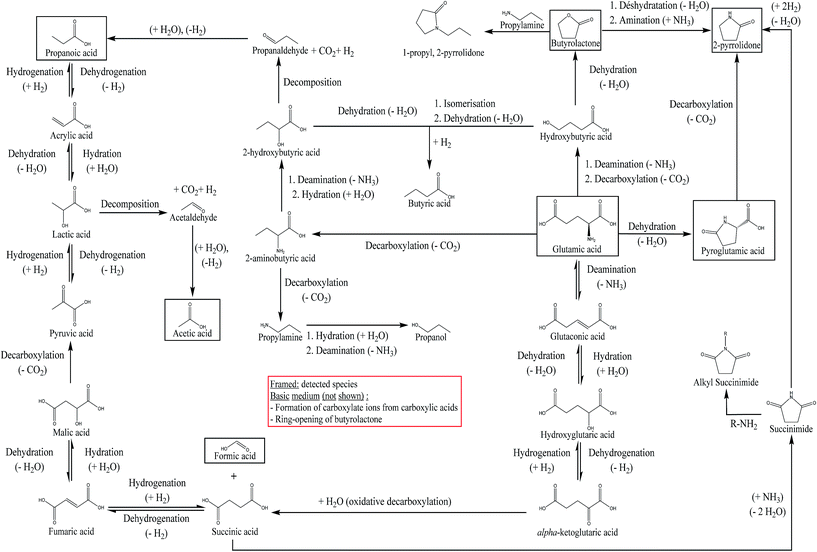 | ||
| Fig. 10 Reaction scheme of the hydrothermal conversion of glutamic acid based on experimental observations and studies from the literature.18,26,27,57,60,61 | ||
Two main reactions of amino acids under hydrothermal conditions are generally considered: deamination and decarboxylation.18 Coupled to dehydration reactions, these two reactions can explain the formation of butyrolactone and 2-pyrrolidone from glutamic acid, as shown in Fig. 10. The cyclization of glutamic acid to form pyroglutamic acid is a well-known reaction, previously described as one of the main reactions of glutamic acid in hydrothermal media.26,27,57 The formation of 2-pyrrolidone from pyroglutamic acid occurs via the decarboxylation of the latter: Povoledo and Vallentyne57 reported that it is a slower reaction than the cyclization of glutamic acid to pyroglutamic acid. Butyrolactone formation can be explained by the existence of an intermediate produced by the deamination and decarboxylation of glutamic acid: it is the hydroxybutyric acid, whose intramolecular esterification forms butyrolactone.58 Finally, 2-pyrrolidone may also be formed from butyrolactone by reaction with NH3.59 Liao and Tuemmler59 also suggested that 2-pyrrolidone can be formed from succinimide. Table 3 shows a lower selectivity of 2-pyrrolidone under basic conditions; this can be linked to other reaction pathways followed by the reaction intermediates. For example, hydroxide ions can neutralise some of the acidic functions, thereby stabilising reaction intermediates in anionic forms. Moreover, butyrolactone can undergo nucleophilic attack by a hydroxide ion, leading to ring opening, and inhibiting the formation of 2-pyrrolidone.
We observed in our experiments that a large proportion of the initial glutamic acid was converted to pyroglutamic acid. Similarly, we observed the formation of formic, acetic and propanoic acids in smaller proportions. These reactions have also been observed by Sato, et al.,18 through deamination and decarboxylation of different amino acids (aspartic acid, serine, phenylalanine, leucine and alanine). Glutamic acid can also form succinic acid, as reported at 250 °C by Lee, et al.,27 but not observed in this work. This reaction is described by the authors as an oxidative decarboxylation of α-ketoglutaric acid. This intermediate is formed by three successive reactions from glutamic acid: deamination, hydration and finally dehydrogenation. The formation of α-ketoglutaric acid can also be explained by an oxidative deamination step of glutamic acid, as mentioned by Sato, et al.18 in the case of another amino acid (alanine). Fig. 10 shows a reaction network summarising the above observations, introducing the observed reaction intermediates and/or those proposed by Sato, et al.18 and Lee, et al.27 The preferred reaction pathway is the formation of pyroglutamic acid through dehydration of glutamic acid. Fig. 10 also shows an additional way of forming 2-pyrrolidone from the degradation of succinic acid, forming a succinimide intermediate. The succinimide can also undergo alkylation reactions in the presence of amines.60 Finally, the formation of 1-propyl, 2-pyrrolidone, observed as a minority species in Fig. S32,† can be explained by the interaction between butyrolactone and propylamine. In fact, this reaction is used in the production of N-methyl-2-pyrrolidone, from butyrolactone and methylamine, under conditions of temperature and pressure close to those of our study.61
4.3 Hydrothermal conversion of a methoxyphenol monomer: guaiacol
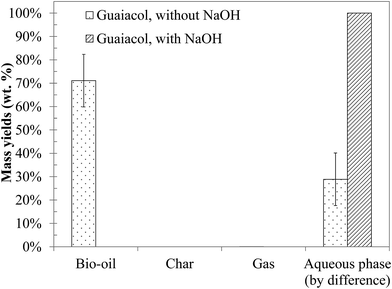
Fig. 11 shows the yields of hydrothermal conversion of guaiacol, a model monomer for lignin. Hydrothermal conversion of guaiacol in the absence of NaOH generates two liquid phases: an aqueous phase charged with organic compounds, as well as a dense organic brown phase, containing the majority of the initial organic matter. No gas and char are recovered. In the presence of NaOH, a significant change is observed, as a single homogeneous liquid phase is obtained (identified as a 100% aqueous phase yield). As was already the case with monosaccharides, basic conditions favour the solubilisation of the organic matter in the aqueous phase.As illustrated by error bars, the recovery of the products from hydrothermal conversion of guaiacol faces many experimental issues. In fact, the aqueous and organic phases form an emulsion which is difficult to separate, directly impacting the mass balances.
Fig. S35 in the ESI† shows the chromatograms obtained by GC-MS analysis of aqueous and organic phases recovered following hydrothermal conversion of guaiacol. Detailed identification of the reaction products is also given in the ESI (Tables S22 to S24†). The conversion of guaiacol seems to be rather low under the conditions of the study, as it remains the major peak. Only some conversion products were detected by GC-MS analysis: veratrole (1,2-dimethoxybenzene) in the organic phase and catechol in the aqueous phase are the two main detected products. Other minor species were also detected, such as phenol and o-cresol. These products have been identified before in the studies of hydrothermal conversion of guaiacol.17,35,36
Analysis of the aqueous phase by HPLC-UV is used to quantify compounds identified by GC-MS analysis. Fig. S36 in the ESI† shows the chromatogram of this analysis. The results are shown in terms of molar selectivity in Table 4.
| Catechol | Veratrole | o-Cresol | Phenol | Guaiacol conversion | |
|---|---|---|---|---|---|
| Without NaOH | 0.004% | 0.04% | 0.5% | 0.0% | 15.4% |
| With NaOH | 0.3% | 1.4% | 0.0% | 0.1% | 87.6% |
The results presented in Table 4 are relatively consistent with the literature. For example, Wahyudiono, et al.36 reported a guaiacol conversion of less than 4% at 250 °C and a 60 min reaction time. At the same time, they observed a catechol selectivity of about 1.2%. In our study, a better guaiacol conversion is obtained, but a lower selectivity to catechol: increasing the temperature from 250 °C to 300 °C may be responsible for the greater tendency of guaiacol to form other products, such as veratrole. The reactivity of guaiacol is largely activated by increasing the pH: in the presence of NaOH, guaiacol conversion is almost multiplied by 6. In particular, we see an improvement in the selectivities of catechol and veratrole. However, the selectivities are too low to identify the main transformation products.
The results presented in Table 4 show that the products identified by GC-MS analysis represent a very small proportion of the reaction products. It is likely that a variety of products has been formed in concentrations too low to be measured. This suggests the fronting and tailing of the catechol peak (Fig. S35 in the ESI†). In addition, some products such as benzene, 4-ethylacetophenone or carveol have been identified after hydrothermal conversion of guaiacol at 350 °C and 25 MPa by Yong and Matsumura.17 Finally, the formation of high-molecular-weight species, by condensation of monomeric units, may explain that all conversion products have not been detected. Although the formation of these compounds is clearly favoured in the supercritical range,17 the relatively high concentration of guaiacol used in our study may promote condensation reactions, leading to oligomeric polycyclic structures (not detectable by our analytical setups). The formation of such structures is suggested by the browning of the organic phase during hydrothermal liquefaction of guaiacol.
In Fig. 12, we propose a reaction scheme of the hydrothermal conversion of guaiacol, based on our experimental observations. As our experiments did not allow identifying the main degradation products, the reaction scheme in Fig. 12 is also based on the literature data for the reactivity of guaiacol under both subcritical and supercritical conditions.17,32–36
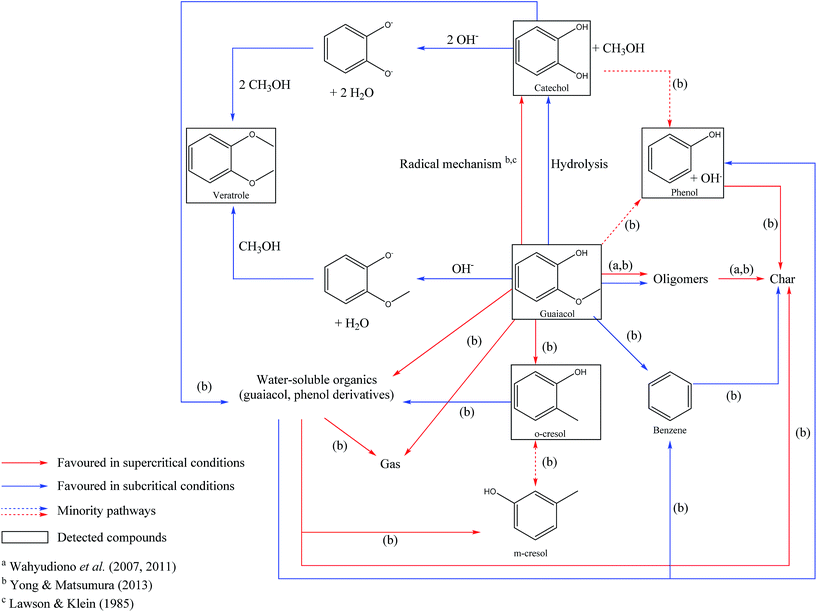 | ||
| Fig. 12 Reaction scheme of the hydrothermal conversion of guaiacol based on experimental observations and studies from the literature.17,32,35,36 | ||
Under hydrothermal conditions, guaiacol can be converted to catechol and methanol by two routes. The first one is a hydrolysis reaction of guaiacol, following an ionic mechanism, and favoured in the subcritical region. The first hydrolysis step is a protonation of the methoxy group, by the direct action of H+, or by the attack of H2O, releasing OH−.62 Subsequently, this hydroxide ion can recombine with the CH3+ fragment derived from guaiacol demethoxylation, and form methanol. The second formation pathway of catechol from guaiacol is a pyrolytic way following a radical mechanism, favoured under supercritical conditions.17,32 Note that the pyrolytic routes of guaiacol transformation also lead to the formation of polyaromatic compounds.17,32
Veratrole (1,2-dimethoxybenzene) can be formed by methylation of guaiacol or catechol. These two reaction routes involve the formation of phenolate intermediates, by deprotonation of the hydroxyl groups, followed by the nucleophilic attack of methanol, leading to the formation of a methoxy group. This mechanism explains the improvement of the veratrole selectivity in the presence of NaOH. In fact, we estimate the initial pH of the aqueous phase to be 13.6 in our experiments, higher than the pKa of the involved phenolic species: guaiacol (pKa = 9.93) and catechol (pKa1 = 9.25 and pKa2 = 13). Under these conditions, deprotonation of the hydroxyl groups is favoured.
Finally, other minority compounds were detected in the experiments, including o-cresol and phenol; the formation of these compounds is related to other mechanisms favoured at higher temperatures. Fig. 12 summarizes all the above observations and provides a reaction scheme of the hydrothermal conversion of guaiacol, inspired by our experimental observations and literature work.
4.4 Hydrothermal conversion of a fatty acid: linoleic acid
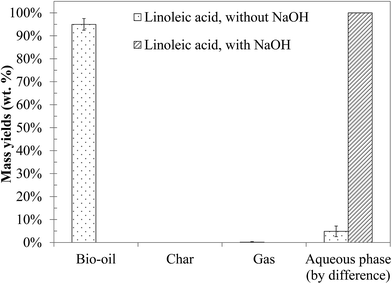
Linoleic acid is the model monomer chosen to represent the lipids contained in blackcurrant pomace. The yields of the products obtained by hydrothermal liquefaction of linoleic acid are presented in Fig. 13. Hydrothermal liquefaction of linoleic acid generates a light brown organic phase, representing almost all of the initial organic matter. These results are consistent with the literature.10,11 In the presence of NaOH, only a soapy water phase is obtained; the same type of results was obtained by Biller and Ross10 for hydrothermal conversion of sunflower oil at 350 °C in the presence of Na2CO3.Fig. S37 in the ESI† shows the GC-MS chromatogram of the bio-oil produced by hydrothermal liquefaction of linoleic acid. Detailed identification of the reaction products is also given in the ESI (Table S25†). The chromatograms of the aqueous phases associated with those tests are not presented, because no compound was detected. As illustrated in the chromatogram, the conversion of linoleic acid seems to be relatively low under the conditions of the study, and only some minor compounds are detected by GC-MS analysis: mainly alkenes, aldehydes, ketones or long-chain aliphatic alcohols.
Fig. S38 in the ESI† shows the results of the HPLC-UV analysis of the bio-oil produced in the absence of NaOH, and of the soapy aqueous phase produced when linoleic acid is converted in the presence of NaOH. Our goal is to quantify linoleic acid in these phases, and estimate its conversion. The chromatograms of HPLC-UV analysis show the occurrence of a second peak, eluting after the major peak of linoleic acid. It could be a conversion product of linoleic acid or an impurity in the reactant (oleic acid, for instance). However our detector did not allow us to identify this compound. From the quantification of linoleic acid by HPLC-UV analysis, we estimate the conversion of linoleic acid to be 47% in the absence of NaOH. In the presence of NaOH, the conversion of linoleic acid is 80%, especially due to the saponification reaction. The conversion of linoleic acid under the conditions of our study does not seem to result from fragmentation reactions to lighter compounds, as these would have been detected by GC-MS analysis. Thus, it seems that linoleic acid is converted to compounds of equivalent or superior molecular weights. From our experimental observations, we propose a reaction scheme of hydrothermal conversion of linoleic acid in Fig. 14.
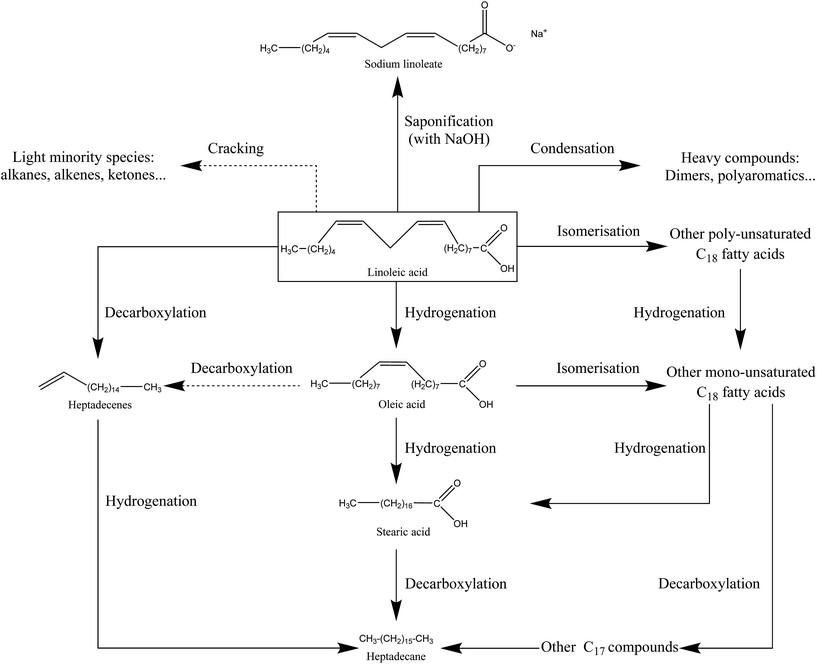 | ||
| Fig. 14 Reaction scheme of hydrothermal conversion of linoleic acid based on experimental observations and studies from the literature.19–21,38 | ||
The hydrothermal conversion of linoleic acid under the conditions of the study results in a light brown organic phase, which accounts for almost all of the starting organic matter. Although GC-MS analysis shows no major degradation products, the browning of the bio-oil is a clue to linoleic acid transformation. This experimental observation is moreover in line with those made by Holliday, et al.37 for the hydrothermal conversion of fatty acids derived from hydrolysis of soybean oil. Their work showed that the decomposition of fatty acids was activated above 300 °C, via pyrolytic and polymerization pathways.
Given the results, the conversion of linoleic acid seems to result mainly in the formation of products with equivalent or superior molecular weights. In fact, GC-MS analysis of the bio-oil (Fig. S37†) has shown that light compounds were only formed in minority and that the peak identified as linoleic acid eluted in a very wide range of retention times at the end of the chromatogram. This supports the hypothesis of the formation of high-molecular-weight compounds from linoleic acid. In particular, linoleic acid can undergo isomerization or hydrogenation reactions to other fatty acids of equivalent molecular weights, such as oleic acid.20,21 Fu, et al.21 have particularly observed that more than 60% of linoleic acid converted in water at 330 °C, in the presence of a Pt/C catalyst, was found in three major products: oleic acid, stearic acid and a group of unidentified compounds denoted as “heavy products”, having equivalent molecular weights to linoleic acid. These are probably derived from isomerization reactions, already observed under hydrothermal conditions for unsaturated fatty acids.38
The formation of products with higher molecular weights than linoleic acid is linked to condensation reactions between two molecules of fatty acids. For example, Watanabe, et al.19 reported the formation of a ketone with 35 carbon atoms, via bimolecular decarboxylation of stearic acid. Dimerization of fatty acids is also reported by Kocsisová, et al.38 This type of reaction applied to linoleic acid would be responsible for the formation of heavy species, undetectable by GC-MS.
Finally, some very minor light products were also observed. Their formation can be explained by fatty acid decarboxylation reactions, leading to long-chain aliphatic alkanes or alkenes,20,21 and by the fragmentation reactions of carbon chains (the case of isomers of octene and nonene, for example). It is likely that such cracking reactions are activated at higher temperatures.
From the experimental observations and data from the literature, we can conclude that linoleic acid has mainly followed isomerization pathways, producing compounds of equivalent molecular weights, and polymerization pathways leading to the formation of high-molecular-weight compounds not detected by GC-MS analysis. Fragmentation reactions of linoleic acid to form lighter compounds are minor pathways under the conditions of the study. The observations of this section are summarized in the form of a reaction scheme in Fig. 14.
In summary, the study of the hydrothermal conversion of five model monomers evidenced reaction mechanisms. The comparison of the obtained results in the absence and presence of NaOH allows explaining the behaviour of blackcurrant pomace during hydrothermal liquefaction, as presented in Section 3. In fact, the use of NaOH confirmed the inhibitory effect of NaOH on char formation, on the improvement of the bio-oil yield from monosaccharides, and on the higher solubilisation of the organic matter in the aqueous phase for all studied monomers.
5 Hydrothermal conversion of complex mixtures of model monomers: binary, ternary and quaternary mixtures
In this section, we present the results of the hydrothermal conversion of several mixtures of model monomers, following the design of experiments presented in Section 2. Four model monomers were converted in the absence of NaOH: glucose, glutamic acid, guaiacol and linoleic acid. Xylose was not included in the model mixtures of this section, as its reactivity is very similar to that of glucose.5.1 Binary mixtures
| Run no. | Binary mixture | Mass yields (%) | |||
|---|---|---|---|---|---|
| Bio-oil | Char | Gas | Aqueous phase (by difference) | ||
| 5 | Glucose–glutamic acid | 12.7 (±1.2) | 24.6 (±6.6) | 12.8 (±0.2) | 49.9 (±5.2) |
| 6 | Glucose–guaiacol | 27.3 (±0.0) | 35.4 (±0.0) | 3.8 (±0.0) | 33.6 (±0.0) |
| 7 | Glucose–linoleic acid | 62.7 (±0.0) | 9.9 (±0.0) | 3.8 (±0.0) | 23.6 (±0.0) |
| 8 | Glutamic acid–guaiacol | 21.4 (±0.0) | 0.0 (±0.0) | 1.3 (±0.0) | 77.3 (±0.0) |
| 9 | Glutamic acid–linoleic acid | 58.6 (±2.7) | 0.0 (±0.0) | 1.9 (±0.1) | 39.5 (±2.8) |
| 10 | Guaiacol–linoleic acid | 76.0 (±7.6) | 0.0 (±0.0) | 0.0 (±0.0) | 24.0 (±7.6) |
Fig. 15 shows the differences between experimental yields obtained in the case of binary mixtures and “theoretical” yields calculated by a mass-averaged law using the results of pure model monomers. The figure shows the absolute difference on the left, the deviation from the mass averaged model. The relative differences, the percentage increase or decrease, are shown on the right (values limited to 100%). This comparison allows a simple comparison between the results of model mixtures and the results of individual model compounds. In fact, a positive interaction can be identified when the difference between an experimental yield and a mass-averaged yield is positive. When this value is negative, the corresponding interaction is identified as negative.
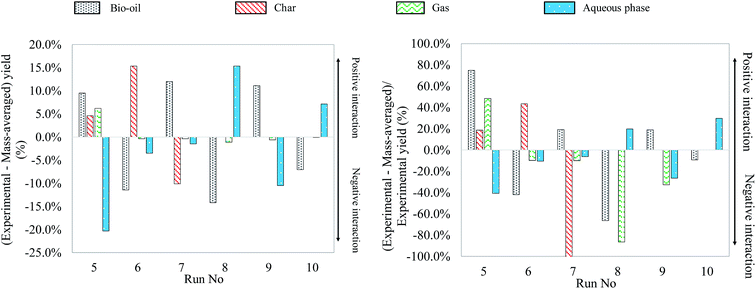 | ||
| Fig. 15 Absolute and relative differences between experimental and mass-averaged yields for hydrothermal liquefaction of binary mixtures of model monomers (300 °C, 60 min). | ||
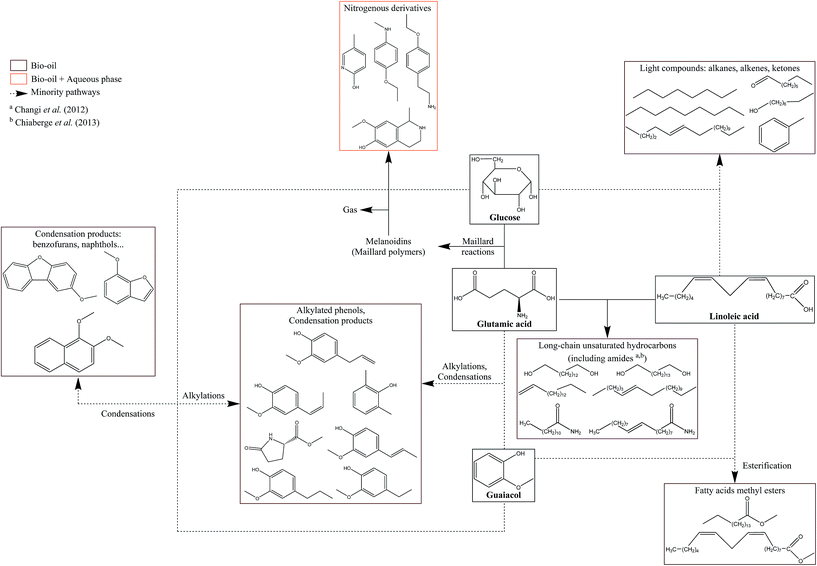
Fig. 15 allows identifying several positive or negative interactions regarding the formation of products. For instance, the glucose–glutamic acid binary mixture (run no. 5) produces higher bio-oil, char and gas yields than their respective individual model monomers. This implies that model monomers and their degradation products take part in interaction reactions, increasing the formation of both bio-oil and gas. In particular, the increase of the bio-oil yield can be explained by Maillard-type reactions, producing nitrogen heterocycles.63
Another positive interaction for bio-oil formation can be identified in the case of the glucose–linoleic acid binary mixture (run no. 7). When compared to the case of pure glucose, the char yield is decreased by 4 times, meaning that char contribution from glucose is decreased by two times in the case of the binary mixture. In addition, the bio-oil yield is higher than 50% in the case of the binary mixture, suggesting a positive interaction for bio-oil formation. Therefore, bio-oil formation seems to benefit from the interaction between glucose and linoleic acid, because of the inhibition of char formation from bio-oil repolymerisation. Similarly, the glutamic acid–linoleic acid binary mixture (run no. 9) produces a bio-oil yield higher than the mass-averaged individual contributions. This suggests the occurrence of interaction reactions, probably by formation of long-chain amides.64
Experimental yields suggest that positive interactions for char formation occur during hydrothermal conversion of the glucose-guaiacol binary mixture (run no. 6). In fact, using half the glucose in the mixture does not result in a twofold reduction of the char yield, but in a comparable char yield to the case of conversion of glucose alone. The bio-oil yield is at the same time decreased by nearly 3 times compared to the hydrothermal conversion of guaiacol alone. This suggests that glucose, guaiacol and their degradation products interact via condensation reactions of bio-oil to form char.
Finally, another identified interaction is the increased solubilisation of the organic matter in the aqueous phase in the cases of the glutamic acid–guaiacol binary mixture (run no. 8) and the guaiacol–linoleic acid binary mixture (run no. 10), at the expense of bio-oil yields. The study of mass yields therefore allows identifying several binary interactions from a macroscopic point of view. In the next section, we focus on the identification of the reaction products by GC-MS analysis to confirm or refute the observations made in Fig. 15.
5.1.2.1 Glucose–glutamic acid binary mixture. GC-MS analysis of the reaction products obtained by hydrothermal conversion of the glucose–glutamic acid binary mixture tends to confirm that the increase of the bio-oil yield is due to Maillard reactions. While the molecular composition of the aqueous phase seems little affected compared to the case of individual model compounds, the bio-oil composition shows significant differences, as shown in Fig. 16. A large diversity of nitrogen heterocycles is observed in the bio-oil produced by hydrothermal conversion of the glucose–glutamic acid binary mixture. Detailed identifications are given in the ESI (Tables S26 and S27†).
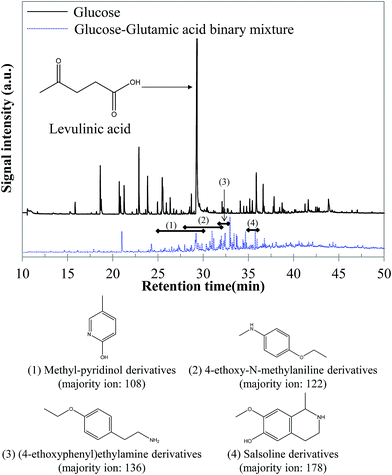 | ||
| Fig. 16 GC-MS chromatograms of the bio-oil produced by hydrothermal conversion of the glucose–glutamic acid binary mixture (300 °C, 60 min). | ||
Although bio-oil compositions are particularly complex, because of the high reactivity of the two model compounds, differences are observable compared to the case of pure model compounds. In fact, while peaks elute in a very wide range of retention times in the case of glucose, the majority of peaks elute between 27 and 37 minutes in the case of the binary mixture. These peaks correspond to nitrogenous heterocycles, as well as other nitrogen-containing molecules. Some examples are shown in Fig. 16. The detection of such molecules in the bio-oil indicates the occurrence of Maillard reactions, responsible for the increased bio-oil yield. This positive interaction was previously identified in Fig. 15.
5.1.2.2 Glucose–guaiacol binary mixture. GC-MS analysis of the reaction products from hydrothermal conversion of the glucose–guaiacol binary mixture shows that very few interaction products are detected in the aqueous phase. In contrast, Fig. 17 illustrates the formation of a large number of molecules derived from condensation reactions. Detailed identifications are given in the ESI (Table S28†).
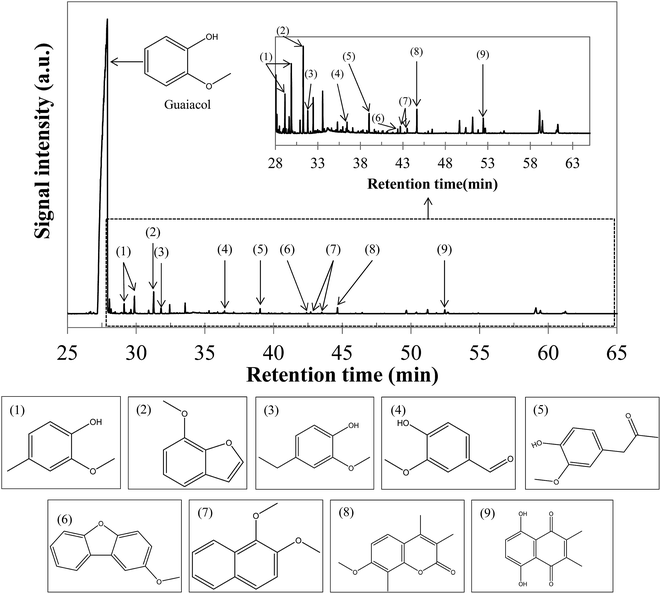 | ||
| Fig. 17 GC-MS chromatograms of the bio-oil produced by hydrothermal conversion of the glucose–guaiacol binary mixture (300 °C, 60 min). | ||
Although guaiacol remains the main compound in the bio-oil (more than 90% of the total area of the chromatogram above), a diversification of the heaviest products is observed in the case of the binary mixture. In particular, alkylation products of guaiacol are formed, such as isomers of 2-methoxy-4-methylphenol (retention time: 29.1–29.9 min, compound no. 1 in Fig. 17), or isomers of ethylguaiacol (retention time: 30.9–31.8 min, compound no. 3 above). Moreover, benzofuran or naphthol-type molecules are formed, such as 7-methoxybenzofuran (retention time: 31.3 min, compound no. 2 in Fig. 17), or dimethoxynaphthalene isomers (retention time: 40.1–43.5 min, compound no. 7 for instance). Finally, heavier structures are also formed, eluting at retention times higher than 50 min, indicating the occurrence of condensation reactions during hydrothermal conversion of this binary mixture. In particular, intermediates from glucose degradation can serve as bridges between aromatic structures derived from guaiacol.31 According to our results, it is possible to see that interactions between molecules in the glucose–guaiacol binary mixture may be favourable to bio-oil formation. However, condensation reactions of aromatic structures, due to the presence of intermediates serving as polymerization bridges, also suggest that char may be formed by these interaction reactions, as previously identified in Fig. 15.
5.1.2.3 Glucose–linoleic acid binary mixture. Fig. 18 shows the chromatogram obtained by GC-MS analysis of the bio-oil produced by hydrothermal conversion of the glucose–linoleic acid binary mixture, compared with that obtained from linoleic acid. Although the peaks of linoleic acid and its heavy derivatives remain dominant, a diversification of the bio-oil composition can be noticed. In particular, a higher variety of peaks of light compounds is detected. The detected compounds are aromatic compounds derived from toluene (majority ion: 91), alkanes (octane and nonane) and other light compounds (alkenes and ketones). An increase in the variety of unsaturated long-chain compounds eluting between 37 and 40 min is also observed (heptadecene derivatives, for example). Detailed identifications are given in the ESI (Table S29†). From our observations, the positive interaction for bio-oil formation between glucose and linoleic acid seems to be a reducing effect. This effect would in fact be responsible for decreasing the repolymerisation reactions leading to heavy structures and char. The increased presence of long-chain unsaturated compounds may be a clue to this interaction effect, as well as the detection of molecules such as octanal, octene and octane in the bio-oil. In fact, these structures are produced by successive reductions from octanoic acid, derived from the scission of the linoleic acid chain.
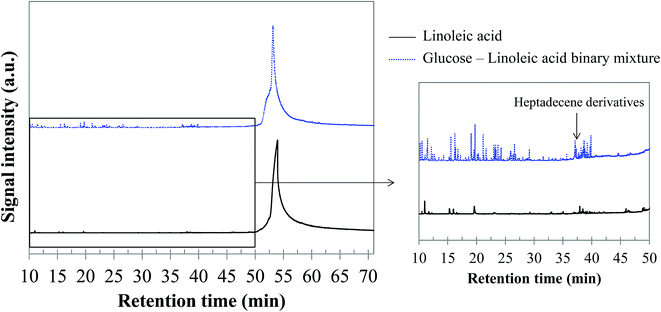 | ||
| Fig. 18 GC-MS chromatograms of the bio-oil produced by hydrothermal conversion of the glucose–linoleic acid binary mixture (300 °C, 60 min). | ||
5.1.2.4 Glutamic acid–guaiacol binary mixture. GC-MS analysis of the reaction products did not evidence interaction products in the aqueous phase resulting from the conversion of the glutamic acid–guaiacol binary mixture. Although guaiacol remains the major compound in the bio-oil, minor interaction products are observed, corresponding to a diversification of the bio-oil composition, as illustrated by the chromatogram shown in Fig. 19. The bio-oil produced by hydrothermal conversion of this binary mixture contains alkylated phenol derivatives such as 2,6-xylenol (retention time: 28.5 min), ethylguaiacol (retention time: 31.8 min) and propylguaiacol (retention time: 33.7 min), as already observed during hydrothermal conversion of the glucose–guaiacol binary mixture. It is likely that the formation of these compounds is related to the reaction between guaiacol (and its derivatives) and polar intermediates produced by degradation of sugars and amino acids (carboxylic acids, aldehydes…). Other interaction products are eugenol isomers, or condensation products between guaiacol and nitrogenous molecules from glutamic acid degradation. For example, the methyl ester of pyroglutamic acid was detected at a retention time of 37 min. Detailed identifications are given in the ESI (Table S30†).
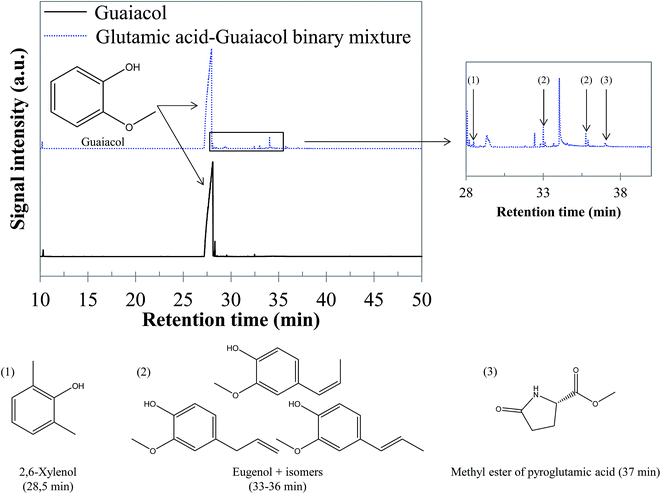 | ||
| Fig. 19 GC-MS chromatograms of the bio-oil produced by hydrothermal conversion of the glutamic acid–guaiacol binary mixture (300 °C, 60 min). | ||
5.1.2.5 Glutamic acid–linoleic acid binary mixture. As for the previous binary mixture, GC-MS analysis of the reaction products did not evidence interaction products in the aqueous phase. In contrast, the bio-oil composition is affected. As shown in the chromatogram presented in Fig. 20, a group of compounds elutes at retention times between 37 and 39 min. These molecules are long-chain unsaturated molecules derived from linoleic acid degradation. However, the large number of co-eluting peaks prevented us from identifying the structures with certainty. Some indicative identifications are nevertheless provided in Fig. 20, as well as in the ESI (Table S31†).
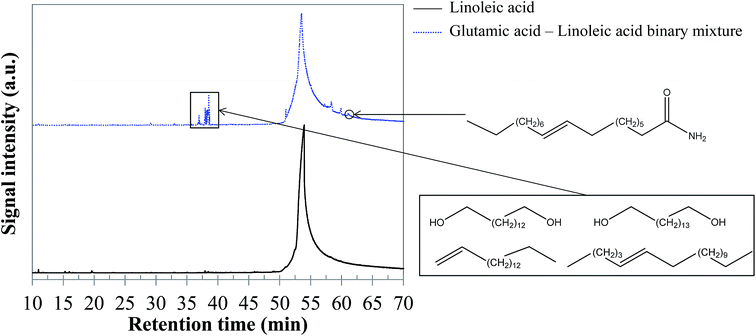 | ||
| Fig. 20 GC-MS chromatograms of the bio-oil produced by hydrothermal conversion of the glutamic acid–linoleic acid binary mixture (300 °C, 60 min). | ||
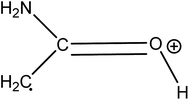
While one might expect to observe the presence of amides, these compounds were not obviously detected in the chromatograms. This result is surprising in view of previous studies from the literature, in which the formation of fatty acid amides by condensation reactions has been observed.64,65 In our experiments, amides seem to be actually hidden by the peak of linoleic acid. In fact, the extraction of the signal corresponding to the fragment C2H5NO+ (m/z = 59), characteristic of long-chain amides (Fig. 21), shows that amides are formed, but that they are masked by the spreading of the linoleic acid peak. Extracting the signal of the ion presented in Fig. 21 allows identifying oleamide at a retention time of 61.1 min.
5.1.2.6 Guaiacol–linoleic acid binary mixture. As for the previous binary mixtures, no interaction product was detected by GC-MS analysis of the aqueous phase produced by hydrothermal conversion of the guaiacol–linoleic acid binary mixture. Only few minor interaction compounds were detected by GC-MS analysis of the bio-oil, particularly methyl esters of palmitic acid and linoleic acid, respectively, eluting at 46.6 and 46.7 minutes. These compounds are produced by esterification of fatty acids with methanol produced by guaiacol hydrolysis. Detailed identifications are given in the ESI (Table S32†). In the case of the guaiacol–linoleic acid binary mixture, heavy compounds elute as a single massive peak between 51.7 and 72 min, centred at 56 min. The identification of this peak reveals a heavy molecule different from linoleic acid, which might indicate an increased reactivity compared to the case of individual linoleic acid.
5.2 Ternary mixtures
Table 6 summarizes the product yields obtained by hydrothermal conversion of ternary mixtures (equal proportions of each compound) in the absence of NaOH.| Run no. | Ternary mixture | Mass yields (%) | |||
|---|---|---|---|---|---|
| Bio-oil | Char | Gas | Aqueous phase (by difference) | ||
| 11 | Glucose–glutamic acid–guaiacol | 29.0 (±2.0) | 10.2 (±0.0) | 8.2 (±0.0) | 52.6 (±2.0) |
| 12 | Glucose–glutamic acid–linoleic acid | 43.5 (±1.8) | 13.5 (±0.0) | 8.7 (±0.0) | 34.3 (±1.8) |
| 13 | Glucose–guaiacol–linoleic acid | 51.9 (±0.0) | 0.0 (±0.0) | 2.6 (±0.0) | 45.5 (±0.0) |
| 14 | Glutamic acid–guaiacol–linoleic acid | 59.7 (±0.0) | 0.0 (±0.0) | 0.6 (±0.0) | 39.7 (±0.0) |
As what has been done for binary mixtures, Fig. 23 shows the differences between experimental yields obtained in the case of ternary mixtures and “theoretical” yields calculated by a mass-averaged law using the results of pure model monomers. The figure shows the absolute difference on the left, the deviation from the mass averaged model. The relative differences, the percentage increase or decrease, are shown on the right (values limited to 100%).
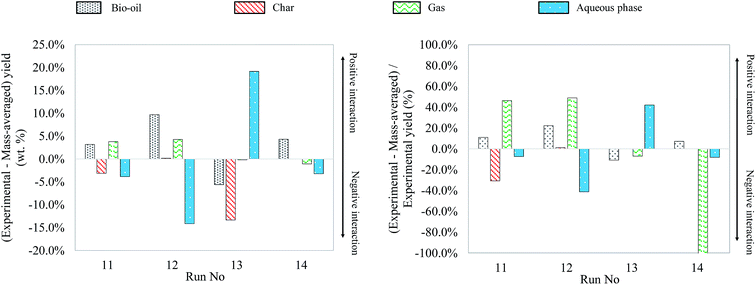 | ||
| Fig. 23 Absolute and relative differences between the experimental and mass-averaged yields from hydrothermal liquefaction of ternary mixtures of model monomers (300 °C, 60 min). | ||
The results obtained from hydrothermal conversion of ternary model mixtures are globally in agreement with the observations made on individual model compounds and binary mixtures. In most trials reported above, the aspects of products after the reaction are similar to those obtained with blackcurrant pomace. However, as in the case of binary mixtures, only ternary mixtures initially containing glucose resulted in solid formation, evidencing the occurrence of polymerization reactions from the liquid phase. In the case of the last two trials (run no. 13 and 14), the amount of char generated was too low to be recovered and quantified, and is therefore approximated to zero. In particular for the run no. 13, the inhibition of char production already observed for the glucose–linoleic acid binary mixture may explain the low formation of char.
In comparison with the cases of individual model compounds and binary mixtures, very few interactions have been identified by GC-MS analysis of the aqueous phases and bio-oils. Only the analysis of the products in the case of the glucose–glutamic acid–linoleic acid ternary mixture showed differences from the previous cases. Detailed identifications of this model mixture are given in Table S33 of the ESI.† Hydrothermal conversion of this mixture results in the appearance of long-chain amides in the chromatogram of the bio-oil (Fig. 24). These products seem to be absent from the bio-oils in the cases of the glutamic acid–linoleic acid binary mixture and the glutamic acid–guaiacol–linoleic acid ternary mixture. Yet, as previously discussed in Section 5.1.2.5, the extraction of the signal corresponding to a characteristic fragment of long-chain amides (C2H5NO+, m/z = 59) shows that amides are detected in every mixture in which glutamic acid and linoleic are simultaneously present. While they are hidden by the peak of linoleic acid in the cases of the glutamic acid–linoleic acid binary mixture and the glutamic acid–guaiacol–linoleic acid ternary mixture, formation of amides seems to be favoured in the case of the glucose–glutamic acid–linoleic acid ternary mixture. This ternary mixture also corresponds to the highest positive interaction for bio-oil formation in Fig. 23.
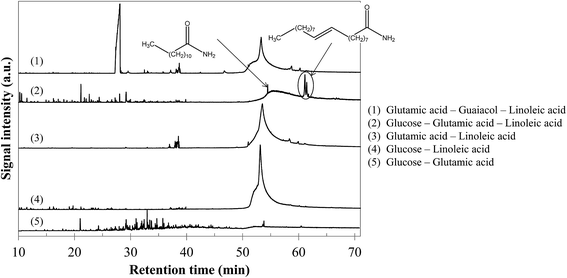 | ||
| Fig. 24 GC-MS chromatograms of bio-oils produced from hydrothermal conversion of binary and ternary mixtures of model monomers (300 °C, 60 min). | ||
5.3 Quaternary mixtures
Five quaternary mixtures were studied: they correspond to the four axial points and the central point of the mixture design of experiments presented in Section 2. The same operating conditions as previously described were used (300 °C, 60 min). Table 7 summarizes the mass yields obtained in these experiments.| Run no. | Quaternary mixture | Mass yields (%) | |||
|---|---|---|---|---|---|
| Bio-oil | Char | Gas | Aqueous phase (by difference) | ||
| 15 | Central mixture (equal proportions) | 44.8 (±3.8) | 7.9 (±0.0) | 7.1 (±0.0) | 40.2 (±3.8) |
| 16 | 62.5% glucose | 24.6 (±5.7) | 32.0 (±0.0) | 7.1 (±0.0) | 36.2 (±5.7) |
| 17 | 62.5% glutamic acid | 25.8 (±0.0) | 4.1 (±0.0) | 7.6 (±0.0) | 62.5 (±0.0) |
| 18 | 62.5% guaiacol | 85.7 (±0.0) | 0.6 (±0.0) | 3.7 (±0.0) | 10.0 (±0.0) |
| 19 | 62.5% linoleic acid | 70.2 (±0.0) | 0.9 (±0.0) | 0.5 (±0.0) | 28.5 (±0.0) |
As what has been done for binary and ternary mixtures, Fig. 25 shows the differences between the experimental yields obtained in the case of quaternary mixtures and the “theoretical” yields calculated by a mass-averaged law using the results of pure model monomers. The figure shows the absolute difference on the left, the deviation from the mass averaged model. The relative differences, the percentage increase or decrease, are shown on the right (values limited to 100%).
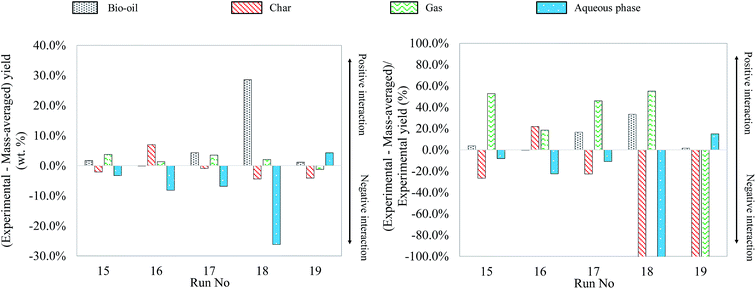 | ||
| Fig. 25 Absolute and relative differences between the experimental and mass-averaged yields for hydrothermal liquefaction of quaternary mixtures of model monomers. | ||
The experimental results of quaternary mixtures are consistent with the observations made in the previous paragraphs. For instance, a glucose-rich model mixture (run no. 16) generates a yield of char, while a linoleic acid-rich model mixture (run no. 19) produces more bio-oil. In view of the results from previous paragraphs, it is quite surprising to see that the quaternary mixture containing the most guaiacol (run no. 18) gives the highest bio-oil yield, leading to an important synergetic effect. As already discussed in Section 4.3, HTL of guaiacol is associated with experimental issues to recover the products, which might lead to an overestimation of the bio-oil yield for guaiacol-rich mixtures. The mixture of run no. 18 could however also benefit from the combination of various synergetic effects previously observed and produce a high bio-oil yield. Overall, the comparison of the experimental yields with the mass-averaged yields shows that the products arise both from degradation of individual model compounds and interaction reactions. The identification of the reaction products by GC-MS analysis did not show any more interactions than those already identified with individual model compounds and binary and ternary mixtures. At the end of the paper, we provide an overall reaction scheme of the hydrothermal conversion of the studied model monomers, summarizing all our observations.
6 Hydrothermal conversion of model mixtures of blackcurrant pomace: assessment of the qualitative representativeness of the products
Model monomers were selected in order to simplify the reaction systems as much as possible and identify the reaction mechanisms. Yet, the qualitative representativeness of these compounds towards the real case of blackcurrant pomace still has not been considered. It is however likely that this simplification causes a lack of representativeness when compared to the real case. In this section, hydrothermal conversion of two model mixtures (300 °C, 60 min) is compared with the results of hydrothermal liquefaction of blackcurrant pomace under the same conditions, in terms of the molecular composition of the products (aqueous phases and bio-oils).6.1 Presentation of model mixtures
Model mixtures were elaborated from the four model monomers previously used (glucose, glutamic acid, guaiacol and linoleic acid), as well as from two polymers chosen to represent biomass fibres (microcrystalline cellulose and lignin alkali). In fact, blackcurrant pomace is particularly rich in fibres, and these polymers are significant contributors to char formation, as previously mentioned in the Introduction.9 It seemed therefore important to use them in this study. The purpose of this section is to simulate the real case of blackcurrant pomace by the use of model mixtures. In Table 8, we present the composition of the two model mixtures elaborated from model compounds, as well as we recall the composition of blackcurrant pomace.| Biomass component | Model compound | Blackcurrant pomace | Mixture 1 | Mixture 2 |
|---|---|---|---|---|
| a Calculated by difference from the data presented in Table 1. | ||||
| Cellulose–hemicelluloses–sugars | Glucose | 30.6a | 30.7 | N.A. |
| Cellulose | N.A. | N.A. | 30.6 | |
| Lignin | Guaiacol | 36.2 | 36.3 | N.A. |
| Alkali lignin | N.A. | N.A. | 36.3 | |
| Proteins | Glutamic acid | 17.7 | 17.6 | 17.8 |
| Lipids | Linoleic acid | 15.5 | 15.4 | 15.4 |
6.2 Comparison of the mass yields of the products from hydrothermal conversion of model mixtures and blackcurrant pomace
The mass yields of the four products from liquefaction experiments will be discussed in this section. These results were published earlier in relation to the development of modelling correlations to predict liquefaction results.7 The results are summarised in Table 9. The experimental results show that the model mixtures do not accurately reproduce the results of the actual resource. From the results it is clear that the model polymers, cellulose and lignin, rather than their monomers are more representative.| Oil yield (wt% daf) | Char yield (wt% daf) | Gas yield (wt% daf) | Aqueous phase yield (wt% daf) | |
|---|---|---|---|---|
| Blackcurrant pomace | 27.3 (±1.5) | 36.1 (±2.7) | 12.1 (±0.7) | 24.5 (±4.9) |
| Mixture 1 | 35.0 (±1.3) | 13.4 (±0.9) | 7.0 (±0.3) | 44.6 (±0.8) |
| Mixture 2 | 28.2 (±0.2) | 24.2 (±0.5) | 8.9 (±0.2) | 38.6 (±0.9) |
6.3 Comparison of the molecular composition of the products from hydrothermal conversion of model mixtures and blackcurrant pomace
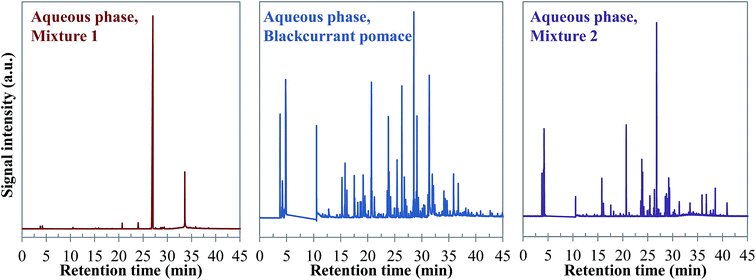 | ||
| Fig. 26 Comparison of the chromatograms obtained by GC-MS analysis of aqueous phases produced by hydrothermal conversion of model mixtures and blackcurrant pomace (300 °C, 60 min). | ||
Visually, Fig. 26 illustrates great differences between the three considered cases. In fact, the chromatograms of the model mixtures show an obvious lower complexity in terms of the composition than the real case. In particular, the composition of the aqueous phase obtained with the model mixture using exclusively model monomers (mixture 1) is dominated by one peak eluting at 27 min (guaiacol). In contrast, a higher diversity of products is observed in the aqueous phases produced from blackcurrant pomace and mixture 2. Although the latter has a simpler composition than in the case of blackcurrant pomace, the chromatograms have closer similarities. The composition of the aqueous phases in terms of chemical families is presented in Fig. 27. Detailed identifications are given in the ESI (Tables S34, S35 and S10†).
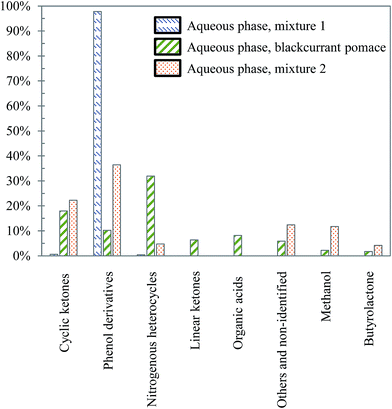 | ||
| Fig. 27 Main chemical families detected in the aqueous phases produced by hydrothermal conversion of model mixtures and blackcurrant pomace (300 °C, 60 min). | ||
The differences already noticed in the chromatograms of Fig. 26 are confirmed by the classification shown in Fig. 27. While the products contained in the aqueous phase produced by hydrothermal conversion of blackcurrant pomace have a diverse molecular composition (nitrogenous heterocycles, cyclic ketones, phenol derivatives…), the compositions of the aqueous phases are largely dominated by phenol derivatives in the case of model mixtures. In particular, guaiacol is the main peak in the case of model mixtures, even though it is less dominant in mixture 2 (limitation due to the resistance of lignin to hydrolysis).
The comparison of chromatograms in Fig. 28 confirms the observations made on aqueous phases. In fact, the bio-oil produced by hydrothermal conversion of mixture 1 is largely non-representative of the real case. On the other hand, the chromatograms of the bio-oil produced from blackcurrant pomace and mixture 2 are very similar. This is confirmed in Fig. 29, showing the main chemical families contained in the bio-oils. Detailed identifications of the compositions of the bio-oils are given in the ESI (Tables S36, S37 and S11†).
The below figure confirms the good qualitative representativeness of mixture 2 towards the real case of blackcurrant pomace. In fact, the bio-oil produced by hydrothermal conversion of mixture 2 is mainly formed by fatty acids and other heavy derivatives, as in the case of blackcurrant pomace. In contrast, phenol derivatives (mainly guaiacol) are predominant in the composition of the bio-oil produced from mixture 1. The higher proportion of phenol derivatives in the case of mixture 2 compared to blackcurrant pomace may be explained by the nature of the lignin used. In fact, alkali lignin has a certain basic nature due to its production process. It is therefore possible that the pH rise caused by lignin solubilisation is favourable to the stabilization of phenol derivatives in the monomeric form, dissolved in the aqueous phases and the bio-oils.
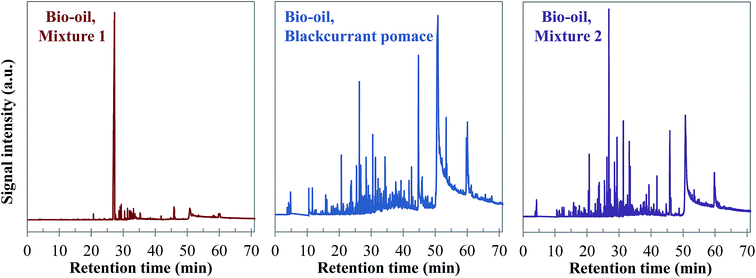 | ||
| Fig. 28 Comparison of the chromatograms obtained by GC-MS analysis of bio-oils produced by hydrothermal conversion of model mixtures and blackcurrant pomace (300 °C, 60 min). | ||
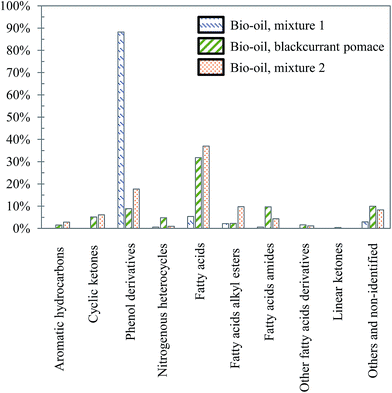 | ||
| Fig. 29 Main chemical families detected in the bio-oils produced by hydrothermal conversion of model mixtures and blackcurrant pomace (300 °C, 60 min). | ||
To sum up, model compounds can be used to simulate qualitatively the case of hydrothermal conversion of blackcurrant pomace, even though some differences are noticed between model mixtures and real cases. The use of monomers or polymers to represent the fibre content of the biomass has an important influence on the representativeness of model mixtures. The use of model compounds is therefore interesting to simplify reaction systems and get fundamental information on the chemistry of hydrothermal liquefaction. However, it can have a limited representativeness is some cases.
7 Conclusion: presentation of the overall reaction scheme
The experimental results presented in this paper have shown that studying hydrothermal conversion of model monomers alone and in mixtures is an important source of information to understand hydrothermal conversion of real biomass. It provides information from a macroscopic perspective, and also describes more detailed chemical mechanisms. Several reaction pathways have been identified, depending on the presence or absence of sodium hydroxide. Moreover, some interaction mechanisms have been identified, mainly affecting the composition of the bio-oil. Except for some specific cases (Maillard reactions, for example), interaction reactions seem to have a minor influence in comparison to primary degradation of model compounds. The comparison of the hydrothermal liquefaction results of blackcurrant pomace and two model mixtures shows that the real case can be qualitatively represented by using model mixtures, especially when model polymers are used to represent the fibre content of biomass (cellulose and lignin). GC-MS analysis of the products showed that real systems were however more complex than model mixtures. From the observations reported in this paper and data from the literature, an overall reaction scheme is proposed in Fig. 30, summarizing in a simplified way all identified reaction pathways.By explaining reaction mechanisms observed in the case of a reduced number of model compounds, it is possible to identify the main conversion pathways in which biomass components are involved. However, due to the much greater complexity of real resources, the proposed reaction scheme is by no means exhaustive. The study of the hydrothermal conversion of model compounds resulted in a reaction scheme using a wide variety of 20 reactions to explicit the formation of the detected products. Considering the even more complex composition of real biomass, it is likely that thousands of reactions occur simultaneously. Therefore, establishing an exhaustive scheme of all reactions and associated kinetics seems presumptuous. One way to avoid this problem would be to consider a more macroscopic approach and to elaborate simple predictive equations to calculate the yields and properties of products using the initial biochemical content of the organic matter (content of cellulose and lignin, protein and fat).
Acknowledgements
The authors would like to acknowledge financial support from the French Research National Agency ANR (LIQHYD project, Grant ANR-12-BIME-0003). The authors are also grateful to Marine Blanchin, Hélène Miller, Sébastien Thiery and Julien Roussely for technical support and help in analysis of the products.Notes and references
- A. A. Peterson, F. Vogel, R. P. Lachance, M. Froling, M. J. Antal Jr and J. W. Tester, Energy Environ. Sci., 2008, 1, 32–65 CAS.
- H.-J. Huang, X.-Z. Yuan, H.-N. Zhu, H. Li, Y. Liu, X.-L. Wang and G.-M. Zeng, Energy, 2013, 56, 52–60 CrossRef CAS.
- M. Déniel, G. Haarlemmer, A. Roubaud, E. Weiss-Hortala and J. Fages, Renewable Sustainable Energy Rev., 2016, 54, 1632–1652 CrossRef.
- D. López Barreiro, W. Prins, F. Ronsse and W. Brilman, Biomass Bioenergy, 2013, 53, 113–127 CrossRef.
- S. S. Toor, L. Rosendahl and A. Rudolf, Energy, 2011, 36, 2328–2342 CrossRef CAS.
- J. L. Faeth, J. M. Jarvis, A. M. McKenna and P. E. Savage, AIChE J., 2016, 62, 815–828 CrossRef CAS.
- M. Déniel, G. Haarlemmer, A. Roubaud, E. Weiss-Hortala and J. Fages, Waste Biomass Valorization, 2016 DOI:10.1007/s12649-016-9726-7.
- I. Pavlovič, Z. Knez and M. Skerget, Chem. Biochem. Eng. Q., 2013, 27, 73–82 Search PubMed.
- S. Karagöz, T. Bhaskar, A. Muto and Y. Sakata, Fuel, 2005, 84, 875–884 CrossRef.
- P. Biller and A. B. Ross, Bioresour. Technol., 2011, 102, 215–225 CrossRef CAS PubMed.
- G. Teri, L. Luo and P. E. Savage, Energy Fuels, 2014, 28, 7501–7509 CrossRef CAS.
- R. Alenezi, G. A. Leeke, R. C. D. Santos and A. R. Khan, Chem. Eng. Res. Des., 2009, 87, 867–873 CrossRef CAS.
- M. C. Johnson and J. W. Tester, Ind. Eng. Chem. Res., 2013, 52, 10988–10995 CrossRef CAS.
- T. M. Aida, Y. Sato, M. Watanabe, K. Tajima, T. Nonaka, H. Hattori and K. Arai, J. Supercrit. Fluids, 2007, 40, 381–388 CrossRef CAS.
- T. M. Aida, N. Shiraishi, M. Kubo, M. Watanabe and R. L. Smith Jr, J. Supercrit. Fluids, 2010, 55, 208–216 CrossRef CAS.
- T. M. Aida, K. Tajima, M. Watanabe, Y. Saito, K. Kuroda, T. Nonaka, H. Hattori, R. L. Smith Jr and K. Arai, J. Supercrit. Fluids, 2007, 42, 110–119 CrossRef CAS.
- M. W. Seo, Y. M. Yun, W. C. Cho, H. W. Ra, S. J. Yoon, J. G. Lee, Y. K. Kim, J. H. Kim, S. H. Lee, W. H. Eom, U. D. Lee and S. B. Lee, Energy, 2014, 66, 56–62 CrossRef CAS.
- N. Sato, A. T. Quitain, K. Kang, H. Daimon and K. Fujie, Ind. Eng. Chem. Res., 2004, 43, 3217–3222 CrossRef CAS.
- M. Watanabe, T. Iida and H. Inomata, Energy Convers. Manage., 2006, 47, 3344–3350 CrossRef CAS.
- M. Snåre, I. Kubičková, P. Mäki-Arvela, D. Chichova, K. Eränen and D. Y. Murzin, Fuel, 2008, 87, 933–945 CrossRef.
- J. Fu, X. Lu and P. E. Savage, ChemSusChem, 2011, 4, 481–486 CrossRef CAS PubMed.
- D. A. Cantero, M. D. Bermejo and M. J. Cocero, J. Supercrit. Fluids, 2013, 75, 48–57 CrossRef CAS.
- T. Rogalinski, S. Herrmann and G. Brunner, J. Supercrit. Fluids, 2005, 36, 49–58 CrossRef CAS.
- T. L.-K. Yong and Y. Matsumura, Ind. Eng. Chem. Res., 2013, 52, 5626–5639 CrossRef CAS.
- A. Kruse and A. Gawlik, Ind. Eng. Chem. Res., 2002, 42, 267–279 CrossRef.
- N. Lee, D. I. Foustoukos, D. A. Sverjensky, R. M. Hazen and G. D. Cody, Chem. Geol., 2014, 386, 184–189 CrossRef CAS.
- N. Lee, D. I. Foustoukos, D. A. Sverjensky, G. D. Cody and R. M. Hazen, Geochim. Cosmochim. Acta, 2014, 135, 66–86 CrossRef CAS.
- J. Barbier, N. Charon, N. Dupassieux, A. Loppinet-Serani, L. Mahé, J. Ponthus, M. Courtiade, A. Ducrozet, A.-A. Quoineaud and F. Cansell, Biomass Bioenergy, 2012, 46, 479–491 CrossRef CAS.
- K. Yoshida, J. Kusaki, K. Ehara and S. Saka, Appl. Biochem. Biotechnol., 2005, 123, 795–806 CrossRef.
- K. Ehara, S. Saka and H. Kawamoto, J. Wood Sci., 2002, 48, 320–325 CrossRef CAS.
- M. Huet, A. Roubaud, C. Chirat and D. Lachenal, Biomass Bioenergy, 2016, 89, 105–112 CrossRef CAS.
- J. R. Lawson and M. T. Klein, Ind. Eng. Chem. Fundam., 1985, 24, 203–208 CAS.
- G. L. Huppert, B. C. Wu, S. H. Townsend, M. T. Klein and S. C. Paspek, Ind. Eng. Chem. Res., 1989, 28, 161–165 CrossRef CAS.
- C. J. Martino and P. E. Savage, Ind. Eng. Chem. Res., 1999, 38, 1784–1791 CrossRef CAS.
- W. Wahyudiono, T. Kanetake, M. Sasaki and M. Goto, Chem. Eng. Technol., 2007, 30, 1113–1122 CrossRef.
- W. Wahyudiono, M. Sasaki and M. Goto, J. Mater. Cycles Waste Manage., 2011, 13, 68–79 CrossRef.
- R. L. Holliday, J. W. King and G. R. List, Ind. Eng. Chem. Res., 1997, 36, 932–935 CrossRef CAS.
- T. Kocsisová, J. Juhasz and J. Cvengroš, Eur. J. Lipid Sci. Technol., 2006, 108, 652–658 CrossRef.
- M. Déniel, G. Haarlemmer, A. Roubaud, E. Weiss-Hortala and J. Fages, Biomass Bioenergy, 2016, 95, 273–285 CrossRef.
- AFNOR, NF V18-122-Aliments des animaux – Détermination séquentielle des constituants pariétaux – Méthode par traitement aux détergents neutre et acide et à l'acide sulfurique, 2013.
- D. Stewart, R. Brennan and G. J. Provant, Phytochemistry, 1994, 37, 1703–1706 CrossRef CAS.
- H. Hilz, E. J. Bakx, H. A. Schols and A. G. J. Voragen, Carbohydr. Polym., 2005, 59, 477–488 CrossRef CAS.
- H. Hilz, L. E. de Jong, M. A. Kabel, H. A. Schols and A. G. J. Voragen, J. Chromatogr. A, 2006, 1133, 275–286 CrossRef CAS PubMed.
- L. F. Burroughs, J. Sci. Food Agric., 1960, 11, 14–18 CrossRef CAS.
- S. Anouti, G. Haarlemmer, M. Déniel and A. Roubaud, Energy Fuels, 2015, 30, 398–406 CrossRef.
- M. Déniel, G. Haarlemmer, A. Roubaud, E. Weiss-Hortala and J. Fages, Energy Fuels, 2016, 30(6), 4895–4904 CrossRef.
- S. Yin and Z. Tan, Appl. Energy, 2012, 92, 234–239 CrossRef CAS.
- D. Castello, A. Kruse and L. Fiori, Chem. Eng. J., 2013, 228, 535–544 CrossRef CAS.
- D. A. Cantero, A. Álvarez, M. D. Bermejo and M. J. Cocero, J. Supercrit. Fluids, 2015, 98, 204–210 CrossRef CAS.
- Q. M. Yu-Wu, E. Weiss-Hortala and R. Barna, J. Supercrit. Fluids, 2013, 79, 76–83 CrossRef CAS.
- D. Castello, A. Kruse and L. Fiori, Biomass Bioenergy, 2015, 73, 84–94 CrossRef CAS.
- J. Barbier, PhD, Université Bordeaux 1, 2010.
- J. An, L. Bagnell, T. Cablewski, C. R. Strauss and R. W. Trainor, J. Org. Chem., 1997, 62, 2505–2511 CrossRef CAS PubMed.
- M. Sugano, H. Takagi, K. Hirano and K. Mashimo, J. Mater. Sci., 2008, 43, 2476–2486 CrossRef CAS.
- W. J. Catallo, T. F. Shupe, J. L. Comeaux and T. Junk, Biomass Bioenergy, 2010, 34, 1–13 CrossRef CAS.
- Z. Srokol, A.-G. Bouche, A. van Estrik, R. C. J. Strik, T. Maschmeyer and J. A. Peters, Carbohydr. Res., 2004, 339, 1717–1726 CrossRef CAS PubMed.
- D. Povoledo and J. R. Vallentyne, Geochim. Cosmochim. Acta, 1964, 28, 731–734 CrossRef CAS.
- P. Ribéreau-Gayon, Y. Glories, A. Maujean and D. Dubourdieu, Traité d'oenologie - Tome 2 Chimie du vin. Stabilisation et traitements, 2012 Search PubMed.
- H. P. Liao and W. B. Tuemmier, US3092638 A, 1963.
- M. M. Patil and S. S. Rajput, Int. J. Pharm. Pharm. Sci., 2014, 6, 8–14 CAS.
- F. Ohlbach, J.-P. Melder, K.-H. Ross, M. Rudlo and J. Liebe, US6348601 B2, 2002.
- L. Yang, W. Zhou, K. Seshan and Y. Li, J. Mol. Catal. A: Chem., 2013, 368–369, 61–65 CAS.
- W. Yang, X. Li, Z. Li, C. Tong and L. Feng, Bioresour. Technol., 2015, 196, 99–108 CrossRef CAS PubMed.
- S. Changi, M. Zhu and P. E. Savage, ChemSusChem, 2012, 5, 1743–1757 CAS.
- S. Chiaberge, I. Leonardis, T. Fiorani, G. Bianchi, P. Cesti, A. Bosetti, M. Crucianelli, S. Reale and F. De Angelis, Energy Fuels, 2013, 27, 5287–5297 CrossRef CAS.
Footnote |
| † Electronic supplementary information (ESI) available. See DOI: 10.1039/c6se00065g |
| This journal is © The Royal Society of Chemistry 2017 |

