Multicomponent hybrids with surfactant-encapsulated europium polyoxometalate covalently bonded ZnO and tunable luminescence
Bing Yan* and
Yan-Fei Shao
Department of Chemistry, Tongji University, State Key Lab of Water Pollution and Resource Reuse, Siping Road 1239, Shanghai 200092, China. E-mail: byan@tongji.edu.cn; Fax: +86-21-65981097; Tel: +86-21-65984663
First published on 24th October 2013
Abstract
In this paper, europium polyoxometalate (Na9EuW10O36·32H2O, abbreviated as POM) is encapsulated into the surfactant dodecyl(11-(methacryloyloxy)undecyl) dimethylammonium bromide (DMDA) to form surfactant-encapsulated polyoxometalate (SEP). Methacrylic group-modified ZnO nanoparticles (designated ZnO-MAA) are also prepared through a sol–gel reaction between zinc methacrylate and LiOH. Finally, the synthesized SEP, ZnO-MAA and three different ester units (ethyl methacrylate (EMA), 2-hydroxyethyl methacrylate (HEMA) and 2,2,3,4,4,4-hexafluorobutyl methacrylate (HFMA)) are covalently bonded through a copolymerization reaction in the presence of benzoyl peroxide (BPO). A detailed physical characterization and especially the photoluminescence of these hybrid materials are studied in detail. The results provide a method to assemble multicomponent hybrid materials with europium polyoxometalate, a semiconductor compound and polymer unit, whose luminescence can be tuned and integrated.
Introduction
Polyoxometalates are inorganic metal oxide clusters with several nanometers dimension. It is fascinating to use them as building blocks to fabricate large supramolecular structures, because they possess not only a well-defined molecular weight and nano-structure but also chemical, structural, and electronic versatility.1 Their unique properties allow them to play an important role in many fields such as catalysis, electrochemistry, semiconductors and magnets.2,3 The decatungstoeuropate(9−) anion, as a potassium salt, was firstly prepared by Peacock and Weakley in 19714 and its luminescence spectrum was first reported by Stillman and Thomson.5 Later, Blasse et al. studied the luminescence spectrum of solid samples of Na9EuW10O36·18H2O and K9EuW10O36·18H2O.6 Among the known luminescent polyoxometalates, Na9EuW10O36·32H2O (POM) possesses the highest luminescent quantum yield.7 The photoluminescent property of such polyoxometaloeuropates can help us to understand the charge transfer transition state (LMCT) from oxygen to the metal ion. In this polyoxometalloeuropate, the inorganic W5O186− ion affects the coordination geometry of Eu3+ and results in a change in the emission properties of Eu3+. However, POM is only soluble in water generally and the processability of pure POMs is inferior whether they are crystalline or powdered materials, which limits the applications of POMs.So, it is necessary to modify POMs to realize the assembly of POMs and other building blocks, which depends on the electrostatic interaction between the anions and cations of the POMs themselves.8 In recent research, polyoxoanions can be phase transferred into organic media with a necessary functionalization of surfactants.9 Therefore, many water-soluble materials such as POM can be encapsulated into organic ingredients with surfactants, to obtain a surfactant-encapsulated POM (abbreviated as SEP). The countercations on the POM surface are substituted by cationic surfactants.10,11 So, SEP possesses the structure of a hydrophobic surfactant shell and an encapsulated hydrophilic POM core with a certain stoichiometric ratio in an organic medium. Then, the surface properties of the POM are changed and the SEP becomes soluble in organic media such as chloroform, benzene or toluene. This offers an effective approach to obtain some soft materials based on POMs.10,11 Some surfactants possess unsaturated double bonds, which can behave as a linkage for a copolymerization reaction, to form a copolymer with other monomers.10–12 Subsequently, POMs can be introduced into polymer matrices, which can be expected to have promising properties, since polymers are processed easily and have good stability.
In fact, POMs themselves are used as the luminescent center to assemble photofunctional hybrid materials and have been reported for their favorable luminescent performance and crystalline framework. The main method is to compose POMs through an ion exchange reaction.7,13 On the other hand, other luminescent units can be introduced into the hybrid system, such as inorganic semiconductor oxides or sulfides. These photoactive units can be expected to integrate with the POMs to realize the tunable luminescence and even, white luminescence. Among these, ZnO nanoparticles are a popular choice for their cheap, non-toxic and chemically stable virtues. ZnO nanoparticles possess visible emission bands, covering the blue-green region,14 whose emission colors depend on the synthetic methods.15 Generally, the visible emission is related to surface defects, such as oxygen vacancies or zinc interstitials.16 Among these, a long band green and yellow emission is ascribed to electron transition from a shallow donor state to a deep-trapped defect state, while a short band blue emission is due to surface defects. After the composition of ZnO nanoparticles with europium components, the whole hybrid systems often show both the emission of ZnO nanoparticles in the blue-green region and the europium component in the red region. Moreover, ZnO can be easily modified with a polymer shell by the sol–gel route.17 Thus, ZnO nanoparticles can be connected with the SEP and polymer through polymerization.
In this paper, we firstly synthesize surfactant DMDA and POMs and then prepare DMDA-encapsulated polyoxometalloeuropate (SEP). At the same time, methacrylic group-modified ZnO nanoparticles (ZnO-MAA) are prepared. Then, three different ester units with polymerizable groups are chosen to connect with the SEP and ZnO-MAA through an addition polymerization. We assemble the hybrid system including the polyoxometalate, nanoparticles and polymer. The detailed characterizations of the obtained materials are performed, and especially the photophysical properties are discussed in depth.
Experimental section
Materials
Eu(NO)3·6H2O was obtained by dissolving Eu2O3 in concentrated nitric acid. Methacrylic acid (MAA) and lithium hydroxide monohydrate (LiOH·H2O) were purchased from the Shanghai Yaohua chemical plant. Na2WO4·2H2O and methacryloyl chloride were purchased from Aldrich. Three different esters (ethyl methacrylate, 2-hydroxyethyl methacrylate and 2,2,3,4,4,4-hexafluorobutyl methacrylate) were purchased from Aldrich and used as received. 11-Bromo-1-undecanol and N,N-dimethyldodecylamine were purchased from TCI. The solvent tetrahydrofuran (THF) was used, after desiccation with anhydrous magnesium sulfate. All the other reagents were analytically pure and used as received.Synthetic procedures
![[thin space (1/6-em)]](https://www.rsc.org/images/entities/char_2009.gif) :1. The polyoxometalate was extracted and transferred into a chloroform solution. The organic phase was separated, and SEP was obtained by evaporating the chloroform to dryness. The products were washed with deionized water three times, in order to removed the salt NaBr. After re-crystallization with ethanol, the final product was obtained as a light yellow powder. The elemental analysis data suggested the formula with EuW10(DMDA)9: W 27.68, C 47.20, H 7.92. Found (%) W 27.90, C 47.55, H 7.69.
:1. The polyoxometalate was extracted and transferred into a chloroform solution. The organic phase was separated, and SEP was obtained by evaporating the chloroform to dryness. The products were washed with deionized water three times, in order to removed the salt NaBr. After re-crystallization with ethanol, the final product was obtained as a light yellow powder. The elemental analysis data suggested the formula with EuW10(DMDA)9: W 27.68, C 47.20, H 7.92. Found (%) W 27.90, C 47.55, H 7.69.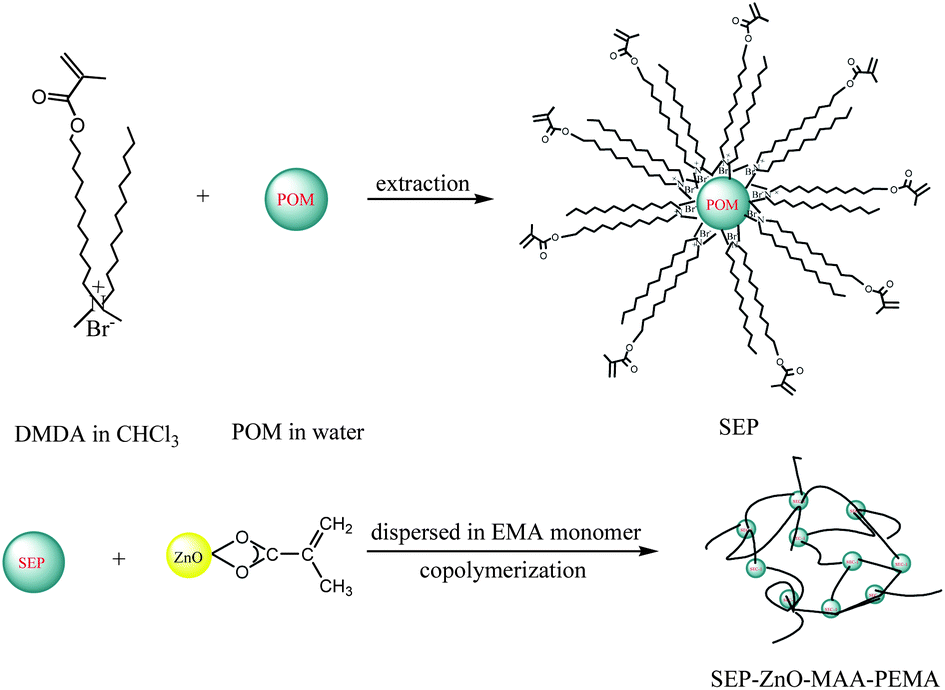 | ||
| Fig. 1 Scheme of the synthesis process of SEP–ZnO-MAA–PEMA. | ||
Physical measurements
Fourier transform infrared (FTIR) spectra were measured within the 4000–400 cm−1 region on a Nexus 912 AO446 spectrophotometer with the KBr pellet technique. The elemental analyses (C, H) were measured with a CARIO-ERBA 1106 elemental analyzer and the contents of the metal element (W) were determined on a Perkin Optima 2100DV Inductively Coupled Plasma Optical Emission Spectrometer (ICP-OES). The UV-vis diffuse reflectance was acquired by a BWS003 spectrophotometer. X-ray powder diffraction patterns (XRD) were recorded on a Rigaku D/max-rB diffractometer equipped with a Cu anode in the 2θ range from 10–70°. The fluorescence excitation and emission spectra were obtained on a RF-5301 spectrophotometer. Luminescence lifetime measurements were carried out on an Edinburgh FLS920 phosphorimeter using a 450 W xenon lamp as the excitation source. Thermogravimetric analysis (TG) was performed on a Netzsch STA 409 under a nitrogen atmosphere in Al2O3 crucibles, at a heating rate of 15 °C min−1 from 30 to 1000 °C. The 1H NMR spectra were recorded on a Bruker Avance-500 spectrometer with tetramethylsilane (TMS) as the internal reference, using DMSO-d6 as the solvent.Results and discussion
As shown in Fig. 1, the key to understanding the multicomponent hybrid systems is the chemical bonding among the different units within them. Dodecyl(11-methacryloyloxyundecyl)dimethylammonium bromide (DMDA) is a kind of polymerizable surfactant, composed of two equal length alkyl chains and containing an unsaturated group at the terminal of one chain. Therefore, the surfactant-encapsulated POM can further be copolymerized to another substrate, such as polymer chains and nanocomposites. The SEP is prepared from the ion exchange between the surfactant DMDA and the POM using the electrostatic attraction force between their different charges.13 MAA modified ZnO nanoparticles are constructed in situ from the reaction of LiOH and the Zn(MAA)2 complex, from Zn(OH)2 and MAA. ZnO colloids are produced via the sol–gel process have methacrylic groups, which originate from the polymer precursor adsorbed on the surface of the ZnO.18,20 Then, the ZnO polymer nanocomposites are assembled with MAA modified ZnO nanoparticles and monomer EMA (HEMA, HFBMA) through the copolymerization reaction between the MAA group and EMA (HEMA, HFBMA). Finally, the final multicomponent hybrid systems are assembled through the copolymerization reaction between the modified ZnO unit and SEP through the saturated bonds among them.The FTIR spectra of the POM, SEP and SEP–ZnO-MAA–PHFMA are shown in Fig. 2. In the spectrum of SEP, the bands at 2924, 2850 cm−1 are attributed to the asymmetric and symmetric CH2 stretching modes of the DMDA alkyl chains, respectively. A C–H bending vibration appears at 1466 cm−1. The existence of the unsaturated group at the terminal of one chain can be proved by the characteristic band located at 1636 cm−1 (νas, C![[double bond, length as m-dash]](https://www.rsc.org/images/entities/char_e001.gif) C). In addition, the stretching vibration absorption bands ν (CO, 1731 cm−1) and ν (C–O, 1255 and 1159 cm−1) are characteristic of a carboxyl group. These bands suggest that the DMDA surfactants have successfully replaced the sodium ions. The band centered at 3452 cm−1 corresponds to the stretching vibration of O–H, which indicates the presence of water molecules and it is a common phenomenon that the SEP enwraps some water in its long alkyl chains. Compared with SEP, the band at 1636 cm−1 for the CC stretching vibration in the spectrum of SEP–ZnO-MAA–PHFMA cannot be observed, as a result of the polymerization reaction.
C). In addition, the stretching vibration absorption bands ν (CO, 1731 cm−1) and ν (C–O, 1255 and 1159 cm−1) are characteristic of a carboxyl group. These bands suggest that the DMDA surfactants have successfully replaced the sodium ions. The band centered at 3452 cm−1 corresponds to the stretching vibration of O–H, which indicates the presence of water molecules and it is a common phenomenon that the SEP enwraps some water in its long alkyl chains. Compared with SEP, the band at 1636 cm−1 for the CC stretching vibration in the spectrum of SEP–ZnO-MAA–PHFMA cannot be observed, as a result of the polymerization reaction.
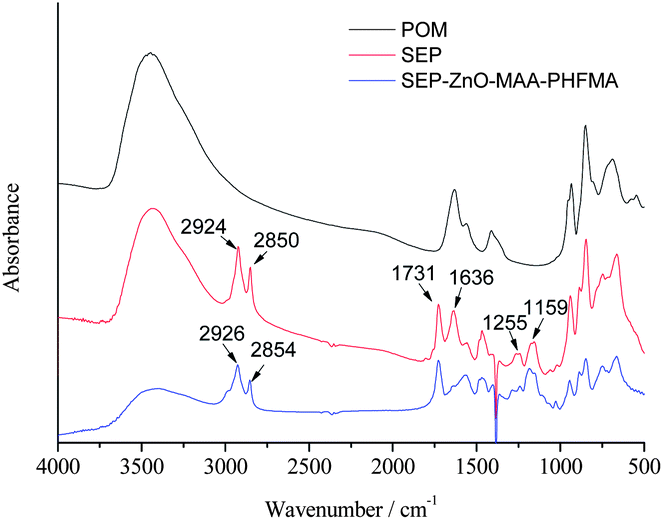 | ||
| Fig. 2 Selected FTIR spectra of POM, SEP and SEP–ZnO-MAA–PHFMA. | ||
The UV-vis diffuse reflection absorption spectra of the obtained materials are given in Fig. 3. From the figure, we can see that all the spectra exhibit a similar broad absorption band in the UV-vis range. This can be attributed to the absorption of the inorganic ligand W5O186− and the influence of the ZnO-MAA and the polymer L (L = PEMA, PHEMA and PHFMA). At the same time, a large broad absorption band from 320 to 490 nm exists in each curve. These partially overlap with the absorption bands of the fluorescent excitation spectra in Fig. 6(a). The two peaks at about 320 and 480 nm in the wide bands originated from the ZnO and POMs, respectively. Furthermore, it can be obviously seen that an inverse absorption peak locates at about 614 nm. This is because of the characteristic emission peaks of Eu3+, excited by the UV component in the incident ray during the measurement.
 | ||
| Fig. 3 Selected UV-vis diffuse reflection absorption spectra of SEP–ZnO-MAA–L (L = PEMA, PHEMA and PHFMA). | ||
The room temperature X-ray diffraction (XRD) patterns from 10 to 70° of the POM, SEP–PEMA-1 and SEP–ZnO-MAA–PEMA are shown in Fig. 4. From the figure, we can see that the XRD pattern of SEP–PEMA-1 shows similar peaks to POM, but a little different. That should be influenced by the surfactant DMDA and the polymer PEMA in the periphery of the POM. Moreover, compared with SEP–PEMA-1, SEP–ZnO-MAA–PEMA also shows differences because of the introduction of ZnO-MAA. The obvious peak of ZnO-MAA is located at approximately 35°, 16 and in the diffraction peak of SEP–ZnO-MAA–PEMA, a peak located at 34° can also be observed. Additionally, some small peaks, dependent on ZnO-MAA can also be found in the SEP–ZnO-MAA–PEMA pattern, but not in SEP–PEMA-1. So, the characteristic ZnO-MAA diffraction peaks appear as a result of the presence of ZnO-MAA in the final hybrid materials and we can predict that the intensity of the ZnO-MAA diffraction peaks may increase with the increase in the ZnO-MAA content.
 | ||
| Fig. 4 Wide-angle X-ray diffraction patterns of POM, SEP–PEMA-1 and SEP–ZnO-MAA–PEMA. | ||
To investigate the thermal stabilities of the obtained materials, the thermogravimetric (TG) and differential thermogravimetry (DTG) analyses were carried out. Fig. 5 (a) and (b) present the TG and DTG curves of SEP–ZnO-MAA–PEMA and SEP–PEMA, respectively. From the TG curve of SEP–ZnO-MAA–PEMA, three main steps in weight loss can be observed. The first weight loss is about 5.0% from 50 to 256.9 °C, which can be attributed to the evaporation of adsorbed water and residual solvent, without any decomposition of the chemical bonds. The second step of weight loss (about 24.0%) between 256.9 and 374.5 °C is due to the first decomposition of the organic ingredient PEMA. This stage has the greatest speed of weight loss, when the temperature reached 349.6 °C. The third mass loss (about 35.2%), beyond 374.5 °C, is assigned to the further decomposition of the surfactant DMDA and organic ingredient MAA. Finally, the material retains a mass of about 35.8%, which represents the weight of ZnO and POM. The TG curve of SEP–PEMA-1 shows a similar three steps of weight loss in comparison with SEP–ZnO-MAA–PEMA. The mass loss (about 2.8%) at about 247 °C is less than the first weight loss (about 5.0%) of SEP–ZnO-MAA–PEMA because of the lack of ZnO-MAA. It may be inferred that ZnO is more inclined to absorb moisture from the air. Another mass loss of 24.0% is also because of the decomposition of organic ingredients PEMA. The third step of mass loss, of 62.9%, is due to the decomposition of DMDA, but not MAA. There is no ZnO-MAA, so the residual mass is relatively low, only 10.3%.
 | ||
| Fig. 5 Derivative thermogravimetric (DTG) and thermogravimetric (TG) curves of SEP–ZnO-MAA–PEMA (a) and SEP–PEMA (b). | ||
The luminescence performances of the lanthanide hybrid materials were investigated at room temperature. Fig. 6 and 7 show the luminescent excitation and emission spectra of hybrids with the ZnO unit SEP–ZnO-MAA–L (L = PEMA, PHEMA and PHFMA) and the hybrids without the ZnO host (SEP–PEMA-1, SEP–PEMA-2), respectively. The excitation spectra are obtained by monitoring the emission of Eu3+ at 614 nm for the SEP–ZnO-MAA–L hybrids and 591 nm for SEP–PEMA-1(2), respectively (Fig. 6). For the hybrid materials containing ZnO-MAA, the broad excitation bands from 240 to 320 nm centered at about 260 nm in the ultraviolet region can be seen, which is attributed to the Eu–O charge transfer transition state of the SEP host. The sensitizers absorb energy and transfer it to the accepting energy level of the lanthanide ions, depending on the energy gap between the triplet state energy of the ligands and the resonance energy level of the central RE3+ ions through the intramolecular energy transfer process. Besides, there exist apparent sharp lines in the 350–500 nm range, ascribed to intra-configurational narrow 4f–4f transitions of Eu3+ in the host lattice, and especially the strongest excitation peaks are at 396 nm (7F0 → 5L6) and 466 nm (7F0 → 5D2), respectively. It can be observed in the figure that the intensities of the 4f–4f transitions are comparable to the charge transfer band.20 Comparing the two kinds of excitation spectra of (a) and (b), the introduction of ZnO decreases the excitation intensity of SEP host containing of Eu–O CTS, which is due to the fact that the content of SEP is decreased. For the hybrid materials SEP–PEMA-1 and SEP–PEMA-2, their excitation bands from 220 nm to 350 nm, centered at about 280 nm in the ultraviolet region can be seen. It is a little different from the materials containing ZnO-MAA, as the excitation bands are broader. Besides, it can be seen that the excitation spectra are identical for SEP–PEMA-1 using different emission wavelengths (orange emission of 594 nm and red emission of 614 nm).
 | ||
| Fig. 6 The excitation spectra of hybrid materials SEP–ZnO-MAA–PEMA (A), SEP–ZnO-MAA–PHEMA (B) and SEP–ZnO-MAA–PHFMA (C) by monitoring emission of 614 nm (λem) (a) and SEP–PEMA-1 (A λem = 614 nm, B 594 nm), and C SEP–PEMA-2 (λem = 614 nm) (b). | ||
 | ||
| Fig. 7 The emission spectra of hybrid materials SEP–ZnO-MAA–L (L = PEMA, PHEMA and PHFMA) (λex = 270 nm) (a) and SEP–PEMA-1, SEP–PEMA-2 (λex = 278 nm) (b). | ||
Fig. 7(a) and (b) show the emission spectra for the excitation and emission spectra of hybrids with the ZnO unit SEP–ZnO-MAA–L (L = PEMA, PHEMA and PHFMA) and the hybrids without the ZnO host (SEP–PEMA-1, SEP–PEMA-2), respectively. From Fig. 7(a) for ZnO-MAA–L hybrids with the polymer functionalized ZnO unit, it can be seen that there are five main emission peaks at around 581, 592, 614, 653 and 702 nm, respectively, corresponding to the 5D0 → 7FJ transition (J = 0, 1, 2, 3, 4). Furthermore, there exists one weak broad emission peak in the range 400 to 550 nm, centered at 470 nm, corresponding to the emission of ZnO in the resulting system. This suggests that the luminescence of the host is quenched by Eu3+ and the energy transfer occurred between them. So, the hybrid system is effective for the luminescence of Eu3+. From Fig. 7(b) for the SEP–PEMA-1, SEP–PEMA-2 hybrids without the ZnO unit, a strong orange luminescence is obtained in the emission spectra. Five main emission peaks in the emission spectra are observed, located at 580, 594, 614, 652 and 701 nm, corresponding to the 5D0 → 7FJ transition (J = 0, 1, 2, 3, 4), respectively. The strongest orange luminescence for them is similar to the pure POM, suggesting that the modification of the surfactant DMDA and polymer cannot change the luminescent performance of the POM. Besides, there is no emission of ZnO. So, it can be inferred that the coordination behavior and environment surrounding Eu3+ in SEP–ZnO-MAA–L hybrids have been changed by the introduction of the ZnO-MAA.
Furthermore, based on the emission both in the blue region from the ZnO unit and the red region for Eu3+ from the SEP, it was expected to realize a tunable color of the luminescence for different excitation wavelengths. Here, we selected SEP–ZnO-MAA–PHFMA as an example. Firstly, we checked the emission spectra monitored using different wavelengths, 270, 320, 350, 396 and 465 nm, respectively (see Fig. 8a). It was found the emission color can be changed to oyster white, light blue and yellow colors (Fig. 8b). Among these, the color is close to white using 270 nm and 396 nm as the excitation wavelength. Considering that the excitation wavelengths at 395 nm and 465 nm are in the visible region (violet light and blue light), the excitation light will integrate with the emission light.
 | ||
| Fig. 8 The luminescent emission spectra (a) A for 320 nm, B for 270 nm, C for 350 nm, D for 396 nm and E for 465 nm and (b) the color coordinate diagram for SEP–ZnO-MAA–PHFMA, the crosses from the bottom to the top are for different excitation wavelengths, 320, 270, 350, 396 and 465 nm, respectively. | ||
Fig. 9(a) and (b) show the color coordinate diagrams based on both the excitation (395 nm, 465 nm) and emission spectra (614 nm), which are close to a white color.
 | ||
| Fig. 9 The luminescent color coordinate diagrams for SEP–PEMA-1 (b), SEP–PEMA-2 (b). | ||
For a further study of the fluorescence properties, we compared the luminescent relative intensities and lifetimes of the five obtained hybrid materials. The typical decay curves that can be described as a single exponential (ln[S(t)/S0] = −k1t = −t/τ) were measured at room temperature, indicating that all the Eu3+ ions occupy the same average coordination environment. For SEP–ZnO-MAA–PEMA, SEP–ZnO-MAA–PHFMA and SEP–ZnO-MAA–PHEMA, their luminescence lifetimes are 0.40, 0.13 and 0.10 ms, respectively, while the lifetimes of SEP–PEMA-1 (0.01 ms) and SEP–PEMA-2 (0.01 ms) are relatively much shorter. These results demonstrate that ZnO-MAA plays a role in protecting the Eu3+ ions from quenching.
On the basis of the emission spectra of these obtained hybrid materials and the lifetimes of the 5D0 emitting level (τ), the emission quantum efficiency (η) can be determined. Assuming that only non-radiative and radiative processes are essentially involved in the depopulation of the 5D0 excited state, η can be defined as follows:21
| η = Ar/(Ar + Anr) | (1) |
Here, Ar and Anr are the radiative and non-radiative transition rates, respectively. Ar can be calculated by summarizing over the radiative rates A0J for each 5D0 → 7FJ (J = 0–4) transitions of Eu3+ as follows:
| Ar = ∑A0J = A00 + A01 + A02 + A03 + A04 | (2) |
Because the branching ratio for the 5D0 → 7F5 and 5D0 → 7F6 transitions are both not detected experimentally, their influence can be ignored in the depopulation of the 5D0 excited state. Since 5D0 → 7F1 belongs to the isolated magnetic dipole transition and is nearly independent of the chemical environments around Eu3+, it can be considered as an internal reference for the whole spectrum. A0J, the experimental coefficients of spontaneous emission, can be calculated according to the following equation:22a
| A0J = A01 (I0J/I01)(ν01/ν0J) | (3) |
Here, A0J are the experimental coefficients of spontaneous emission. A01 is the Einstein coefficient of spontaneous emission between the 5D0 and 7F1 energy levels. In a vacuum, the value of A01 is 14.65 s−1, when an average index of refraction n equal to 1.506 is considered, the value of A01 can be determined to be about 50 s−1 (A01 = n3A01(vac)) in an air atmosphere.23 The emission intensity I can be seen as the integrated intensity of the 5D0 → 7FJ (J = 0–4) emission bands with ν01 and ν0J (ν0J = 1/λJ) energy centers, respectively. ν0J directs at the energy barrier and can be determined by the 5D0 → 7FJ emission transitions peaks of Eu3+.
The lifetime (τ), radiative (Ar), and non-radiative (Anr) transition rates are related according to the following equation:
| τexp = (Ar + Anr) −1 | (4) |
According to above discussion, we can find that the value of η mainly depends on the values of the lifetimes and the I02/I01 ratio. The quantum efficiency must be high when the lifetimes and red-orange ratio are large. As clearly shown in Table 1, the luminescent efficiencies of three ZnO-containing hybrid materials have been calculated in the following order SEP–ZnO-MAA–PEMA > SEP–ZnO-MAA–PHFMA > SEP–ZnO-MAA–PHEMA. We can find that the material SEP–ZnO-MAA–PEMA has the largest I02/I01 ratio and the longest lifetime, so its quantum efficiency is the highest. Furthermore, the absolute quantum yields are also measured using an integrating sphere attachment, showing a similar order to the calculated data, except for the higher value.
| Hybrids | I02/I01 | τa (ms) | ηb (%) |
|---|---|---|---|
| a The luminescent lifetimes of 5D0 → 7F2 transition for SEP–ZnO-MAA–PEMA (PHFMA, PHEMA) and of 5D0 → 7F1 transition for SEP–PEMA-1(2).b The luminescent quantum yields for absolute value using integrating sphere and calculated data from lifetime and spectrum in bracket. | |||
| SEP–ZnO-MAA–PEMA | 5.44 | 0.70 | 24.6 (14.1) |
| SEP–ZnO-MAA–PHFMA | 5.05 | 0.63 | 20.9 (13.0) |
| SEP–ZnO-MAA–PHEMA | 4.66 | 0.60 | 20.3 (12.5) |
| SEP–PEMA-1 | 0.64 | 1.20 | 35.3 |
| SEP–PEMA-2 | 0.25 | 1.11 | 31.0 |
Conclusions
We have prepared the polyoxometalate Na9EuW10O36·32H2O and the surfactant DMDA and encapsulated the polyoxometalate into the surfactant to obtain surfactant-encapsulated POM clusters (SEP). Then, in the presence of benzoyl peroxide (BPO) as the initiator, the synthesized SEP, ZnO-MAA and three different ester units were covalently bonded by an additional polymerization reaction. In contrast, we also synthesized hybrid materials that do not contain ZnO-MAA. The ZnO-containing materials have a strong red emission and one weak broad emission peak corresponding to the emission of ZnO, while the hybrids without ZnO show a stronger orange emission than red emission and have no emission band of ZnO. Meanwhile, the luminescence lifetime and emission quantum efficiency have also been compared in two kinds of different materials. Compared to the hybrids without the ZnO unit, the introduction of ZnO nanoparticles modified by the methacrylic group changes the red/orange ratio, to change the chemical environment around the Eu3+. The luminescence color can be adjusted by changing the excitation wavelength. Composing the violet-blue excitation and orange or red emission, a white luminescence can be observed for the whole hybrid system. This provides a new strategy to obtain white luminescence materials using hybrids.Acknowledgements
This work was supported by the National Natural Science Foundation of China (20971100, 91122003), and the Program for New Century Excellent Talents in University (NCET 2008-08-0398).Notes and references
- (a) C. L. Hill, Chem. Rev., 1998, 98, 1 CrossRef CAS PubMed; (b) M. T. Pope and A. Müller, Angew. Chem., Int. Ed. Engl., 1991, 30, 34 CrossRef.
- (a) T. Yamase, E. Ishikawa, K. Fukaya, H. Nojiri, T. Taniguchi and T. Atake, Inorg. Chem., 2004, 43, 8150 CrossRef CAS PubMed; (b) N. Casañ-Pastor and P. Gómez-Romero, Front. Biosci., 2004, 9, 1759 CrossRef PubMed.
- (a) V. Luca and J. M. Hook, Chem. Mater., 1997, 9, 2731 CrossRef CAS; (b) E. Coronado and C. Mingotaud, Adv. Mater., 1999, 11, 869 CrossRef CAS; (c) M. Chemente-leon, B. Agricole, C. Mingotaud, C. J. Gomez-Garcfa, E. Coronado and P. Delhaes, Angew. Chem., Int. Ed. Engl., 1997, 36, 1114 CrossRef.
- R. D. Peacock and T. J. R. Weakley, J. Chem. Soc. A, 1971, 1836 RSC.
- M. J. Stillman and A. J. Thomson, J. Chem. Soc., Dalton Trans., 1976, 1138 RSC.
- (a) G. Blasse, G. J. Dirkens and F. Zonnevijlle, J. Inorg. Nucl. Chem., 1981, 43, 2847 CrossRef CAS; (b) G. Blasse, G. J. Dirkens and F. Zonnevijlle, Chem. Phys. Lett., 1981, 83, 449 CrossRef CAS.
- (a) M. Sugeta and T. Yamase, Bull. Chem. Soc. Jpn., 1993, 66, 444 CrossRef CAS; (b) K. Binnemans, Chem. Rev., 2009, 109, 4283 CrossRef CAS PubMed.
- G. Decher, Science, 1997, 277, 1232 CrossRef CAS.
- (a) W. F. Bu, L. X. Wu and A. Q. Tang, J. Colloid Interface Sci., 2004, 269, 472 CrossRef CAS PubMed; (b) F. Bu, W. Li, H. L. Li, L. X. Wu and A. Q. Tang, J. Colloid Interface Sci., 2004, 274, 200 CrossRef PubMed; (c) W. F. Bu, H. L. Li, W. Li, L. X. Wu, C. X. Zhai and Y. Q. Wu, J. Phys. Chem. B, 2004, 108, 12276 CrossRef; (d) Y. Y. Zhao, Y. Li, W. Li, Y. Q. Wu and L. X. Wu, Langmuir, 2010, 26, 18430 CrossRef CAS PubMed.
- (a) W. Bu, J. Zhang, L. Wu and A. C. Tang, Chin. J. Chem., 2002, 20, 1514 CrossRef CAS; (b) W. Bu, L. Wu, X. Hou, H. Fan, C. Hu and X. Zhang, J. Colloid Interface Sci., 2002, 251, 120 CrossRef CAS PubMed.
- (a) S. Polarz, B. Smarsly and M. Antonietti, ChemPhysChem, 2001, 2, 457 CrossRef CAS; (b) D. Volkmer, A. Du Chesne, D. G. Kurth, H. Schnablegger, P. Lehmann, M. J. Koop and A. Müller, J. Am. Chem. Soc., 2000, 122, 1995 CrossRef CAS; (c) D. G. Kurth, P. Lehmann, D. Volkmer, H. Cölfen, M. J. Koop, A. Müller and A. Du Chesne, Chem.–Eur. J., 2000, 6, 385 CrossRef CAS.
- (a) H. L. Li, W. Qi and W. Li, Adv. Mater., 2005, 17, 2688 CrossRef CAS; (b) M. Xu, C. L. Liu, H. L. Li, W. Li and L. X. Wu, J. Colloid Interface Sci., 2008, 323, 176 CrossRef CAS PubMed.
- (a) T. R. Zhang, C. Spitz, M. Antonietti and C. F. J. Faul, Chem.–Eur. J., 2005, 11, 1001 CrossRef CAS PubMed; (b) G. Hungerford, M. Green and K. Suhling, Phys. Chem. Chem. Phys., 2007, 9, 6012 RSC.
- (a) R. C. Wang, C. P. Liu, J. L. Huang and S. J. Chen, Appl. Phys. Lett., 2005, 87, 053103 CrossRef PubMed; (b) A. B. Djurisic, Y. H. Leung, K. H. Tam, L. Ding, W. K. Gew, H. Y. Chen and S. Gwa, Appl. Phys. Lett., 2006, 88, 103107 CrossRef PubMed; (c) H. Zeng, G. Duan, Y. Li, S. Yang, X. Xu and W. Cai, Adv. Funct. Mater., 2010, 20, 561 CrossRef CAS.
- (a) M. K. Patra, M. Manoth, V. K. Singh, G. Siddaramana Gowd, V. S. Choudhry, S. R. Vadera and N. Kumar, J. Lumin., 2009, 129, 320 CrossRef CAS PubMed; (b) X. Tang, E. S. G. Choo, L. Li, J. Ding and J. Xue, Chem. Mater., 2010, 22, 3383 CrossRef CAS; (c) H. Q. Shi, W. N. Li, L. W. Sun, Y. Liu, H. M. Xiao and S. Y. Fu, Chem. Commun., 2011, 47, 11921 RSC.
- (a) A. van Dijken, E. A. Meulenkamp, D. Vanmaekelbergh and A. Meijerink, J. Phys. Chem. B, 2000, 104, 1715 CrossRef CAS; (b) Z. Fang, Y. Wang, D. Xu, Y. Tan and X. Liu, Opt. Mater., 2004, 26, 239 CrossRef CAS PubMed; (c) Y. B. Lv, W. Xiao, W. Y. Li, J. M. Xue and J. Ding, Nanotechnology, 2013, 24, 175702 CrossRef PubMed.
- (a) H. M. Xiong, Z. D. Wang, D. P. Liu, J. S. Chen, Y. G. Wang and Y. Y. Xia, Adv. Funct. Mater., 2005, 15, 1751 CrossRef CAS; (b) H. M. Xiong, Z. D. Wang and Y. Y. Xia, Adv. Mater., 2006, 18, 748 CrossRef CAS.
- M. Sugeta and T. Yamase, Bull. Chem. Soc. Jpn., 1993, 66, 444 CrossRef CAS.
- (a) Y. F. Shao and B. Yan, Dalton Trans., 2012, 41, 7423 RSC; (b) Y. F. Shao, B. Yan and Z. Y. Jiang, RSC Adv., 2012, 2, 9192 RSC; (c) Y. F. Shao, B. Yan and Q. P. Li, Eur. J. Inorg. Chem., 2013, 381 CrossRef CAS.
- M. D. Regulacio, M. H. Pablico, J. A. Vasquez, P. N. Myers, S. Gentry, M. Prushan, S. W. Tam-Changand and S. L. Stoll, Inorg. Chem., 2008, 47, 1512 CrossRef CAS PubMed.
- P. C. R. Soares-Santos, H. I. S. Nogueira, V. Félix, M. G. B. Drew, R. A. S. Ferreira, L. D. Carlos and T. Trindade, Chem. Mater., 2003, 15, 100 CrossRef CAS.
- (a) L. D. Carlos, Y. Messaddeq, H. F. Brito, R. A. S. Ferreira, V. de Zea Bermudez and S. J. L. Ribeiro, Adv. Mater., 2000, 12, 594 CrossRef CAS; (b) E. S. Teotonio, J. G. P. Espínola, H. F. Brito, O. L. Malta, S. F. Oliveria, D. L. A. de Foria and C. M. S. Izumi, Polyhedron, 2002, 21, 1837 CrossRef CAS; (c) M. F. Hazenkamp and G. Blasse, Chem. Mater., 1990, 2, 105 CrossRef CAS.
- M. H. V. Werts, R. T. F. Jukes and J. W. Verhoeven, Phys. Chem. Chem. Phys., 2002, 4, 1542 RSC.
| This journal is © The Royal Society of Chemistry 2014 |