 Open Access Article
Creative Commons Attribution 3.0 Unported Licence
Sustainable synthesis of titanium based photocatalysts via surfactant templating: from kerosene to sunflower oil†
Reece M. D.
Bristow
 a,
Peter J. S.
Foot
 a,
James D.
McGettrick
 b,
Joseph C.
Bear
 a and
Ayomi S.
Perera
 *a
*a
aDepartment of Chemical and Pharmaceutical Sciences, Faculty of Health, Science, Social Care and Education, Kingston University London, Kingston Upon Thames, KT1 2EE, UK. E-mail: a.perera@kingston.ac.uk
bSPECIFIC IKC, Materials Research Centre, College of Engineering, Swansea University, Bay Campus, Fabian Way, Swansea, SA1 8EN, UK
First published on 2nd January 2024
Abstract
Recent research conducted by the United Nations indicates that 2 billion people worldwide lack access to safe, clean drinking water, while about half of the global population experiences acute water scarcity no less than once every year. Therefore, materials and technologies that sustainably address drinking water pollution and/or its treatment are urgently needed. This study aims to develop novel, sustainable titanosilicate photocatalysts by replacing expensive and harmful oils/surfactants, typically used as templating agents during their synthesis for pore structure generation, by cheap, innocuous and sustainable feedstocks such as sunflower oil. The results indicate that sunflower oil-based titanosilicates are more effective in degradation and removal of model pollutant Rhodamine B via combined photocatalysis-adsorption action, compared to their counterparts synthesized with a fossil-fuel derived kerosene oil mixture. Moreover, the catalysts are shown to be robust, recyclable, are ∼50% cheaper to produce on a laboratory scale and displayed up to three times the reaction rates of their conventional counterparts. Compared to commercial TiO2 photocatalysts, these titanosilicates are shown to have superior overall stability in water. Additionally, they show bandgaps close to or lower than that of TiO2 (3.2 eV), without the use of added dopants, providing more effective UV/visible light absorption. Thus, they have the potential to be used as sustainable yet effective alternatives in the treatment of drinking water.
1. Introduction
The United Nations (UN) considers clean water a key factor in its sustainable development goals (SDGs), as highlighted by SDG 6: clean water and sanitation as: “ensure availability and sustainable management of water and sanitation for all”.1 The impact of clean water availability further extends into SDGs 3, 14 and 15 (good health and wellbeing, life below water and life on land, respectively), highlighting the importance of preserving the world's usable water supply for the sustainable existence of humanity. Safe, clean drinking water in particular is recognized as a dwindling resource globally and the current methods for tackling the issue appear to be widely inadequate.1,2The ramifications of climate change, population growth, the 2020 Covid-19 pandemic and the current global economic crisis have exacerbated the limitations on access to clean drinking water, particularly for underprivileged communities worldwide.3,4 The significant discrepancy between the developed and developing nations’ plans for tackling the interrelated issues of climate change and water treatment worsens the problem. Conventional water treatment methods such as coagulation, flocculation, sedimentation, filtration, and disinfection, are often expensive and/or inadequate.5,6 Increased quantities of organic pollutants are being found in drinking waters,7,8 partly due to the growing use of harmful organic pollutants such as pesticides and pharmaceuticals,9,10 which can lead to widespread contamination of drinking water, putting global public health at risk.11–14 Hence, it is vital to develop novel, sustainable materials and technologies dedicated to the maintenance and preservation of the world's dwindling clean water supply.
One such emerging technology for water purification is photocatalysis, which uses inexhaustible sunlight in lieu of electrical energy or harmful/expensive chemicals, significantly lowering costs, while also being environmentally benign.15 Combined with the general advantages of heterogeneous catalysis such as enhanced stability, facile recovery and recyclability, this offers high potential for such materials to be applied in polluted water treatment on an industrial scale.16 Several classes of photocatalyst have been investigated previously, such as titanium dioxide (the most widely used),17 zinc oxide18 and cadmium sulphide,19 among others.20 However, there are still several hurdles to overcome before their widespread adoption, including mitigation of the cost and the environmentally harsh conditions used to produce the catalysts.21 Moreover, nanosized TiO2 has recently been shown or suspected to be either toxic or carcinogenic.22 Another relevant factor is the limitation of light absorption, which is largely restricted to the UV region due to the wide bandgap of TiO2.23,24
Titanosilicates, which are zeolite-derivatives consisting mainly of Ti, O and Si, are one class of photocatalysts with potential application in drinking water treatment.25 They are presently used for industrial applications in water purification as heavy metal adsorbents, membranes and ion-exchange agents26,27 and are also highly selective and effective industrial heterogeneous catalysts, used particularly for alkene oxidation.28
Recent research has highlighted that titanosilicates are photocatalytically active within the UV-Visible region, are water-stable and have potential for degrading organic pollutants effectively,29 putting them in focus as candidates for water treatment technologies. They are typically used as microsized porous particles and are much more robust in liquid media compared to nanosized particles,29 which is a key advantage for drinking-water-treatment. The efficiency of such applications heavily depends on having a well-distributed pore structure that exposes most of the material surface – and by extension the tetrahedral Ti4+ active sites, to chemical substrates.28 The pore structure of titanosilicates can be tuned as mesoporous, microporous, micro-mesoporous or layered, based on specific synthesis conditions, to suit a wide range of applications.27 For example, microporous titanosilicates are suitable heterogeneous catalysts for oxidation reactions of small alkenes, whereas, mesoporous ones are more compatible with larger/bulkier alkene substrates. Mesoporous and layered titanosilicates are used as ion exchange agents/membranes in water purification (among other applications). Conventionally, hydrothermal synthesis has been used for such customized synthesis of titanosilicates, which was effective but not environmentally benign, due to the use of high temperatures over long periods, which also increased production cost.30,31 Surfactant templating can be a more sustainable approach,28,32 but it requires harmful and/or costly oils such as kerosene and surfactants such as Span® 80. Thus, the potential large-scale usage of titanosilicates as photocatalysts for water purification depends on the development of alternative greener synthetic routes.
In a previous study,29 we demonstrated the development of a novel titanosilicate using conventional petrochemical-based templating agents as an effective agent for removal of organic pollutants. This material was found to follow a bimodal adsorption-photocatalytic mechanism for pollutant removal, facilitated via a robust microporous structure.33 The bimodal mechanism allowed for fast reaction rates that surpassed those of commercial nanosized TiO2 photocatalysts,34 without the use of any additives or dopants.35 The synthesis of this material included a mixture of kerosene oil and Span® 80 surfactant, which were blended with an aqueous titanosilicate precursor at high speed, followed by calcination, to generate a highly porous and robust structure, which directly contributed to its high adsorbent-photocatalytic performance. However, despite these advantages, the templating agents utilized during the synthesis were toxic36 and costly, rendering their use unsustainable in scaled-up water purification applications.
In this proof-of-concept study, we aim to address the above drawbacks of kerosene oil-based mixtures by employing cost-effective commercial oils including sunflower oil and vegetable (rapeseed) oil as surfactant templates to replace them, with rationale to reduce cost and eliminate toxic reagents. We demonstrate that the novel, optimized titanosilicates obtained exhibit similar pore structures and sizes to those in the literature, while still maintaining, or even exceeding, the previous titanosilicates’ adsorbent-photoactive capability. Thus, we aim to establish an improved, sustainable approach in photocatalyst synthesis that could be used as a viable alternative to current water treatment technologies.
2. Experimental
2.1. Materials
Sunflower oil (1 L) and vegetable oil (1 L) were obtained from J. Sainsbury Ltd, all other synthetic reagents and model pollutant Rhodamine B (95%) were purchased from Merck Life Science UK Ltd and used without further purification. Reference material Aeroxide P25 TiO2 (formerly known as Degussa P25) was kindly provided to us by Evolnik (through Lawrence industries) and titanium dioxide (4![[thin space (1/6-em)]](https://www.rsc.org/images/entities/char_2009.gif) :
:![[thin space (1/6-em)]](https://www.rsc.org/images/entities/char_2009.gif) 1 Anatase
1 Anatase![[thin space (1/6-em)]](https://www.rsc.org/images/entities/char_2009.gif) :
:![[thin space (1/6-em)]](https://www.rsc.org/images/entities/char_2009.gif) Rutile) was purchased from US Research Nanomaterials, Inc. (US Nano). Ultrapure water (15 MΩ cm) was obtained with an ELGA Purelab system and used in all experiments.
Rutile) was purchased from US Research Nanomaterials, Inc. (US Nano). Ultrapure water (15 MΩ cm) was obtained with an ELGA Purelab system and used in all experiments.
2.2. Synthesis of titanosilicate micromaterials
Synthesis of the titanosilicate materials is based on modified procedures described by Perera et al.28,29 Titanium(IV) n-butoxide (97%, 1.0 ml, 2.85 mmol) was added dropwise to 30.0 mL of deionized water, at 4 °C, under magnetic stirring, in order to form a Ti(OH)4 precipitate. The precipitate was filtered under vacuum and washed with DI water. The Ti(OH)4 was then dissolved in 4.0 mL of 4 N HNO3, added to a solution of tetraethyl orthosilicate (TEOS, 98%, 6.6 ml, 28.97 mmol) and 2.0 mL ethanol and stirred vigorously for 30 min to form the precursor solution. The mesoporous structure was then formed using a templating method with either a mixture of oil/surfactant or a single oil. The former method comprised adding the aqueous titanosilicate precursor to a preheated templating solution of oil (26.1 g (w/w) of either kerosene, sunflower oil or vegetable oil) and surfactant (7.9 g (w/w) of either Span® 80 or Tween® 80) both preheated to 80 °C. The single oil templating method comprised of adding the precursor to a preheated oil (34 g of either sunflower oil or vegetable oil), also preheated to 80 °C. These solutions were then homogenized using an Ultra-Turrax T18 homogenizer for 2 h. The sol–gel material formed was then vacuum-filtered and washed with acetone and DI water, followed by drying in oven at 80 °C for 2 h. Finally, materials were calcined at 750 °C for 6 h with a heating rate of 1 °C min−1, in order to remove the oil/surfactant or oil phases. The titanosilicate materials were then collected and stored in a desiccator until further use. These were named according to the templating agents used in their synthesis (Table 1).| Oil (26.1 g) | Surfactant (7.9 g) | Name |
|---|---|---|
| Kerosene | Span® 80 | KS80 |
| Vegetable oil* | Vegetable oil | V |
| Vegetable oil | Tween® 80 | VT80 |
| Sunflower oil* | Sunflower oil | S |
| Sunflower oil | Tween® 80 | ST80 |
2.3. Characterization of titanosilicate materials
The morphology of the titanosilicate materials were characterized via scanning electron microscopy (SEM) using a ZEISS EVO 50 scanning electron microscope (Oxford Instruments, Cambridge, UK). Samples were placed on adhesive carbon pads, affixed to a specimen stub and sputter-coated with Au–Pd alloy prior to the images being taken.Porosities of synthesized titanosilicate materials were evaluated via nitrogen adsorption–desorption experiments, using a Belsorp Mini II (MicrotracBEL, Japan) at 77 K, with a preliminary degassing pre-treatment at 80 °C for 120 min. The data obtained was analysed using Belmaster proprietary software and the specific surface area (SBET) and pore characteristics were calculated using the BET (Brunauer–Emmett–Teller) and BJH (Barrett–Joyner–Halenda) methods respectively.
The chemical structure of the materials was analysed via Fourier-transform infrared spectroscopy (FTIR), Raman spectroscopy and diffuse reflectance UV-Vis spectroscopy (DR UV-Vis). FTIR was conducted using a Nicolet iS5 spectrometer with iD7 ATR accessory (Thermo Scientific, UK), taking 16 scans with a resolution of 1 cm−1. Raman spectra were taken with a green laser on a Renishaw InVia confocal Raman microscope, between 100–1500 cm−1. DR UV-Vis measurements were obtained using a Cary 7000 UV-Vis-NIR spectrophotometer equipped with an internal diffuse reflectance accessory and powder cell. Measurements were taken in the 200–500 nm range, with a resolution of 0.1 nm and an average scan time of 0.250 s. The Kubelka–Munk function was applied to the results, with bandgap values being obtained from their respective Tauc plots.37 X-ray diffraction (XRD) analysis was performed on a Bruker-AXS Model D8-Advance powder diffractometer, using Ni-filtered Cu Kα radiation from a copper anode run at 40 kV and 20 mA. (λ = 1.5418 Angstrom). A step scan over the range 10–60° 2θ was used, with intervals of 0.1° and a counting time of 8 s.
The elemental composition of the titanosilicates were analysed via Energy Dispersive X-Ray Spectroscopy (EDS). EDS scans were taken using an Emcrafts Cube 2 scanning electron microscope (EmCrafts Co. Ltd) and Aztec One TTM Xplore System (Oxford instruments, UK). Samples were sputter-coated with an Au–Pd alloy prior to use and affixed to carbon pads. Samples were scanned in the SEM at an accelerating voltage of 20 kV with a probe width of 10 mm. Scans consisted of 3 sites per sample using the XploreCompact 30 detector and analysed using the AZtecOne software. The scans looked for the elements carbon, oxygen, titanium and silicon, and averages were taken of their atomic composition. X-ray Photoelectron Spectroscopy (XPS) analysis was carried out on as-synthesized powders with a Kratos Axis Supra instrument to determine the composition of titanosilicate materials and for comparison with an Aeroxide P25 TiO2 standard, using a similar method to our previous work.29 Wide scans were collected in triplicate for each sample with a pass energy of 160 eV, using a monochromated Al Kα X-ray source (AlKα at 15 mA and 225 W). High-resolution scans, at 40 eV pass energy, were undertaken for the Ti2p (450–470 eV), O1s (523–543 eV), C1s (278–298 eV) and Si2p (97–112 eV) regions and fitted using the CasaXPS software package (Version 2.3.23, rev1.1 K) using the default GL (mixed Gaussian–Lorentzian) lineshape and Shirley backgrounds unless otherwise stated. For the Ti2p and Si2p regions, doublet separation values of 5.72 eV38 and 0.63 eV39 respectively. The integral charge neutralizer was used throughout.
The viscosity of the surfactant templating mixtures was measured with a Brookfield viscometer dv-ii+pro (Brookfield Ametek, USA) utilizing LV spindle 61 at 100 rpm. All compositions were mixed at 1000 rpm using a magnetic stirrer at 80 °C prior to the measurements being taken.
2.4. Photocatalytic degradation of Rhodamine B
The photocatalytic abilities of the titanosilicates were monitored via degradation of a model pollutant, Rhodamine B (Rh B). A 5 mg L−1 Rh B solution (100 mL) was added to a 250 mL beaker, with a magnetic stirrer. This beaker was placed underneath a solar simulator (Newport, Oriel LCS-100, USA), with the lamp at 7 inches (178 mm) from the surface of the solution to ensure a 1 kW m−2 irradiance, equivalent to AM1.5 or 1 sun. An AM1.5G spectral correction filter was utilized to simulate the total solar spectrum on Earth's surface (a wavelength range of 280 nm to 1680 nm). Before irradiation, 100 mg of the relevant titanosilicate or commercial TiO2 reference compound was added to the Rh B solution, which was magnetically stirred initially for 30 min in the dark to ensure homogeneous dispersion and equilibration. Then the solar simulator lamp was switched on, and 4 ml aliquots of the solution were taken at various intervals up to 3 h. Each sample collected was centrifuged at 3500 rpm for 3 min and the supernatant was then analysed using UV-Vis spectroscopy (Jenway 7315 Spectrophotometer, UK). Next, the photocatalysts were re-suspended in solution using a vortex mixer, then returned to the main solution in the beaker. Dark control experiments were conducted in the same conditions for all titanosilicates, as well as for reference compounds Aeroxide P25 and US Nano TiO2.Radical quenching experiments were conducted using a similar procedure as above, with 1.0 mmol of p-benzoquinone (PBQ) and 13 mmol of isopropanol (IPA) added to the Rh B solution in order to detect O2˙− and ˙OH radicals, respectively (adapted from Fang et al.39).
3. Results and discussion
3.1. Characterization of titanosilicate materials
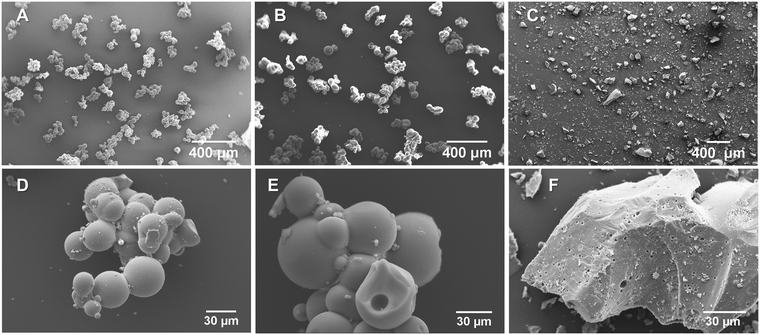
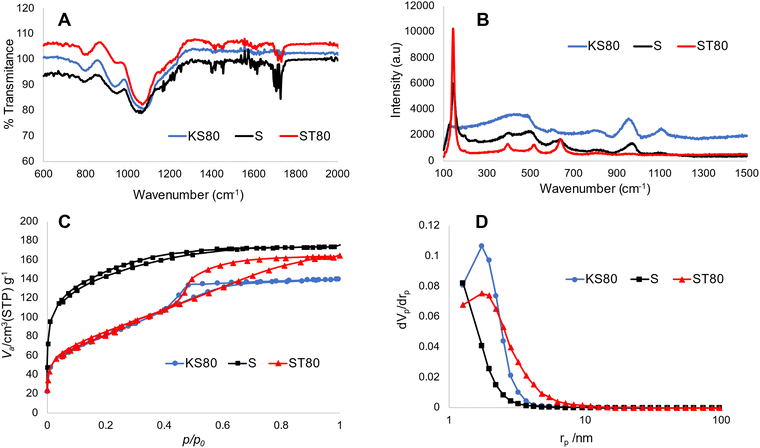
The morphology of the titanosilicate samples appeared to be influenced by the templating agents used during synthesis according to SEM analysis (Fig. 1, ESI† Fig. S1A and B). Varying morphologies, ranging from the previously reported fused and non-fused microspheres to heterogeneously dispersed “debris”-like material, were observed. Both the KS80 and S samples were characterized as microspheres as previously reported,28,32 though there was a greater degree of fusion among the spheres. In contrast, the ST80, V and VT80 consisted of a debris-like morphology with no dominant shape. It can be hypothesised that these morphological changes are a result of the differences between the ratios of hydrophobic/hydrophilic components, or the presence or absence of various functional groups on the oil/surfactant phases (further details in Section 3.6). The KS80 and S samples displayed a homogeneous distribution of sizes, from 60–80 μm, whilst ST80 was polydispersed. All were considerably larger than the commercial reference Aeroxide P25, which had a homogeneous 3–6 μm size range (ESI† Fig. S1C).FTIR peaks obtained for the titanosilicates correspond to those reported by us, and others previously;29,40–42 indicating the presence of isolated Ti–O–Si linkages of titanosilicates, along with discrete TiO2 and SiO2 phases embedded within the overall structure. Use of different templating agents caused minor shifts in the characteristic peaks observed. In samples KS80, S and ST80 (Fig. 2A) (see also V and VT80 in ESI† Fig. S2), the peaks between 1050–1080 cm−1 are characteristic of Si–O–Si linkage, whilst the 930–940 cm−1 peaks represent the characteristic titanosilicate Ti–O–Si asymmetric stretch, unique to titanosilicates and not found in TiO2 or SiO2. The peak at 794 cm−1 is characteristic of O–Si–OH bending.33 Raman spectra indicated the presence of titanium dioxide phases within the samples (Fig. 2B and ESI† Fig. S3), which is a common feature in titanosilicates. The peaks at 145, 400, 517 and 645 cm−1, present in all samples but more prominent in the ST80 sample, belong to typical anatase and rutile crystal structures.43,44 The characteristic Ti–O–Ti symmetric and asymmetric stretching peaks were found prominently at ∼958 and ∼1105 cm−1 for the KS80 sample, as typically seen in amorphous titanosilicates, and not in crystalline TiO2, which was in line with our previous study.29 These peaks were also seen in the S sample, and were less discernible in ST80, due to their low intensity compared to the other TiO2 peaks (i.e., anatase and rutile).42 Peaks at 150 and 450 cm−1, indicative of silica,45 were identified in KS80 and S but were suppressed in ST80, likely for the same reason. The reference sample Aeroxide P25 featured all the characteristic TiO2 peaks mentioned above (see ESI† Fig. S3). The pore structure of the titanosilicates were investigated via nitrogen adsorption–desorption experiments and surface areas were calculated using the Brunauer–Emmett–Teller (BET) method and pore sizes and areas calculated using the Barrett–Joyner–Halenda (BJH) method (Fig. 2C and D, Table 4 and ESI† Fig. S4A and B). Samples KS80, S and ST80 had BET surface areas of 278, 429 and 284 m2 g−1 respectively, along with BJH pore radii of 1.74, 1.26 and 1.74 nm respectively. A robust pore structure that renders a high surface area is crucial to the catalytic ability of a heterogeneous catalyst, as it exposes more active sites to substrate molecules. Similarly, the pore sizes of the network need to allow facile passage of substrate molecules and final products, as smaller pores or bottlenecks can hinder the catalytic process.46,47 Likewise, higher number of pores can lead to larger surface areas, even though particle sizes and/or pore diameters remain relatively similar, driven by the chemical nature of the templating agent (e.g. Sample S has larger BET surface area than KS80 and ST80). Employment of suitable templating agents thus becomes highly relevant when designing optimal pore structures for heterogeneous catalysts.
Diffuse-reflectance UV-Vis spectroscopic studies provided further evidence of the chemical environments as well the phases present within different titanosilicate samples (Fig. 3A and B and ESI† Fig. S5A). Kubelka–Munk plots of samples KS80, S and ST80 (Fig. 3A), show peaks at 221, 228 and 230 nm respectively, which correspond to tetrahedrally-coordinated, isolated Ti4+.42,48,49 In crystalline titanosilicates this peak is more blue-shifted and appears at ∼210 nm;50–52 however, it tends to be more red-shifted in the amorphous forms.53 This explains the values found for our samples, as both previous29 and current XRD patterns indicate that our titanosilicates are predominantly amorphous (see below). Broad shoulders found between 300–350 nm are typical for TiO2.54 These shoulders are pronounced in both the S and ST80 samples, but are less discernible in KT80, which supports the presence of greater amounts of TiO2 in the two former samples, as indicated by our Raman data. This further verifies that the S and ST80 samples contain more crystalline TiO2 than the KS80 sample.
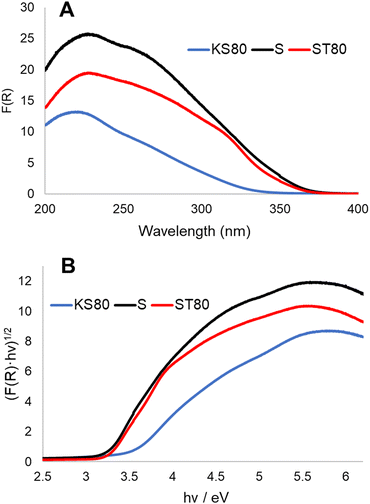 | ||
| Fig. 3 Diffuse reflectance UV-Vis analysis of titanosilicate samples KS80, S and ST80. (A) Kubelka–Munk plots, (B) Tauc plots. | ||
The bandgaps of semiconductors can be calculated by applying the Kubelka–Munk function to form Tauc plots (Fig. 3B and ESI† Fig. S5B).37 Bandgaps of semiconductors can be broadly defined as energy differences between the valence and conduction bands and represent the energy requirement for an electron to be excited to the conduction band.55 This in turn allows electron–hole combinations to form, resulting in charge separation in the material lattice and free conducting electrons that enable photocatalysis – in this case via free radical generation. A lower band gap is advantageous for photocatalysis as it lowers the required electron excitation energy that consequently increases the materials’ photocatalytic capability. TiO2 is considered an industry standard due to its low bandgap of ∼3.2 eV.56 Analysis of the synthesized titanosilicates estimated the bandgaps as 3.37 eV, 3.13 eV and 3.25 eV for KS80, S and ST80 samples, respectively. For S and ST80, the bandgaps are better than KS80, with some of these samples equalling or improving upon our experimental bandgap for commercial Aeroxide P25 (3.25 eV). This is significant, since most other semiconductors require additional dopants to achieve such small bandgap values.
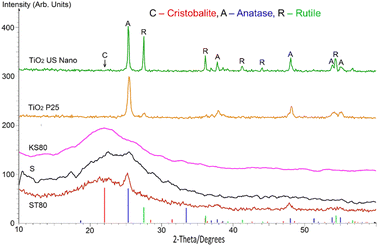
The samples were analysed by powder XRD, and the results are presented in Fig. 4, with coloured markers showing reference peaks from the JCPDS powder diffraction files for Cristobalite (39–1425), Anatase (89–4203) and Rutile (89–4920). The diffractograms show predominantly amorphous structures for the titanosilicates, with the minor presence of typical TiO2 and/or SiO2 nanocrystalline regions, which are in line with our previous work.29
However, key differences based on the templating agent used were observed among the titanosilicate samples. The X-ray diffractogram of ST80 showed a broad, amorphous peak at a deviation 2θ (where θ is the Bragg angle) of about 22°. This corresponds to a lattice spacing d of 4.074 Å, consistent with the strongest reference peak for pure silica (Cristobalite, 39–1425), along with well-defined sharper peaks due to nanocrystalline TiO2 (anatase) at about 25.3, 37.8, 48.1, 53.9 and 55.2°, with corresponding d values of 3.535, 2.379, 1.900, 1.707 and 1.667 Å respectively. The peak width for anatase is 0.90°, from which an effective crystallite size of about 9.5 nm was calculated using the Scherrer equation. There is no apparent evidence of the presence of rutile or any other form of TiO2. The data for KS80 also feature a broad peak at around 21.8° 2 θ (d = 2.076 Å) due to amorphous SiO2 (D ∼ 0.94 nm). There is a weak peak matching that of anatase at 25.3° (d = 3.503 Å), with a FWHM width of 0.72°, which corresponds to a particle size D ∼ 11.8 nm. Again, there is no sign of any other form of TiO2, SiO2 or any other nanocrystalline phase.
The results for sample S are somewhat more complex. Ostensibly, there are peaks attributable to SiO2 (cristobalite) and TiO2 (anatase) at about 22.6 and 25.3° (d = 3.948 and 3.502 Å respectively), but the anatase peak is less marked than for ST80. Although there is still no signature of rutile TiO2, there are a few additional small peaks that may be due to other oxides of Ti or Si. So far, no satisfactory single match has been found.
3.2. Elemental analysis of titanosilicates
Elemental compositions of the titanosilicates and Aeroxide P25 were analysed by EDS. Survey scans revealed only titanium, silicon and oxygen, as expected for synthetic titanosilicate samples (Table 2). Some amount of carbon was seen in KS80 and ST80 samples, likely due to contamination from the adhesive tape used to mount samples onto SEM stubs or from residue templating oil/surfactant phases.![[thin space (1/6-em)]](https://www.rsc.org/images/entities/char_2009.gif) :
:![[thin space (1/6-em)]](https://www.rsc.org/images/entities/char_2009.gif) Ti ratio is given in the final column
Ti ratio is given in the final column
| Sample | Average composition (atom%) | ||||
|---|---|---|---|---|---|
| C | O | Si | Ti | Si![[thin space (1/6-em)]](https://www.rsc.org/images/entities/char_2009.gif) : :![[thin space (1/6-em)]](https://www.rsc.org/images/entities/char_2009.gif) Ti ratio Ti ratio |
|
| P25 | 0.00 | 68.31 | 0.00 | 38.09 | 0.00 |
| KS80 | 15.77 | 59.91 | 22.36 | 1.96 | 11.41 |
| S | 0.00 | 70.58 | 26.00 | 3.43 | 7.58 |
| ST80 | 17.5 | 58.57 | 22.38 | 1.55 | 14.44 |
XPS studies were conducted to investigate the elemental chemical environments within the titanosilicates (Fig. 5). The model used to fit high resolution scans of the Ti 2p region consisted of two components, with a more-oxidised component (i.e., at higher binding energy) attributed to a titanosilicate “TiO2/SiO2” or tetrahedrally coordinated environment, in accordance with literature57 and confirmed by our lab in a previous study.58
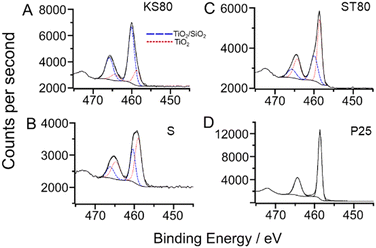 | ||
| Fig. 5 Fitted high resolution Ti 2p X-ray photoelectron scans of: A-sample KS80, B-sample S, C-sample ST80 and D-P25 TiO2 standard. Fitted environments for KS80, S and ST80 were the same as those in our previous paper,29 with a doublet separation of 5.72 eV. Samples KS80, S and ST80 exhibited differing ratios of TiO2 to TiO2/SiO2 components, as listed in Table 2. | ||
These peaks correspond to the Ti–O–Si bonds in the active sites of the titanosilicate. The more-reduced component had binding energy similar to that of titanium in a “TiO2” or octahedrally-coordinated environment,58 which together with the more-oxidised component, formed the basic structure of the titanosilicate material, with isolated Ti–O–Si sites in the vicinity of Ti–O–Ti phases. The “TiO2” peak has a lower binding energy (ca. 458.7 eV for Ti2p3/2) and the “TiO2/SiO2” peak has a higher binding energy (ca. 459.6 eV for Ti2p3/2). The P25 TiO2 standard was fitted with a single environment, with a binding energy of 458.6 eV for the Ti 2p3/2, which is in good agreement with the literature.59,60 It is noteworthy that the KS80 sample exhibited a greater quantity of the higher binding energy TiO2/SiO2 component compared to other samples, in accordance with the Raman, DR UV-Vis results and our previous study (Table 3).29
| Concentration (atom%) | |||
|---|---|---|---|
| Sample | TiO2 peak | TiO2/SiO2 peak | Ratio |
| KS80 | 0.585 | 1.38 | 0.424 |
| S | 0.589 | 0.182 | 3.23 |
| ST80 | 0.611 | 0.310 | 1.97 |
3.3. Photocatalytic characterization of titanosilicates
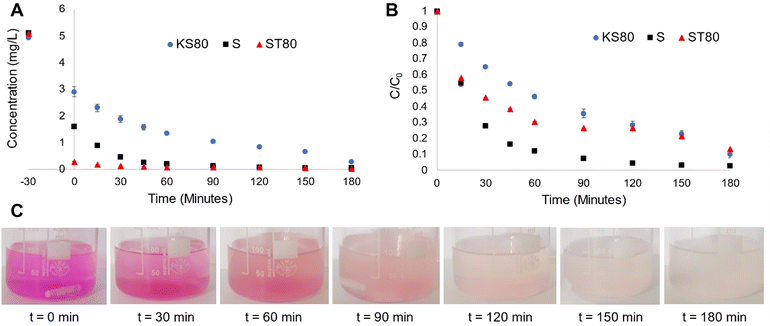
The degradation behaviour of Rh B, a proven model water pollutant dye61 (ESI† Fig. S6) was monitored in 5 ppm solutions, with all titanosilicate samples, to characterize their adsorbent-photocatalytic capability. A solar simulator with 1 sun power output was used as the light source and samples were collected at various time intervals and analysed via UV-Vis spectroscopy to quantify Rh B degradation (Fig. 6A and B and ESI† S7A and B). We had previously shown that pollutant degradation of our titanosilicates occurred via a bimodal adsorption-photocatalysis based pathway.29 The process of adsorption was proven to be a significant factor in efficient removal of the pollutant while also ensuring subsequent fast photocatalysis. Since the synthesis conditions were altered during this study (in the form of templating agents used), the mechanism was revalidated using experiments under simulated light as well as radical quenching studies. Rh B concentration vs. time plots for KS80, S and ST80 samples show that varying degrees of adsorption took place during the initial 30 min equilibration step, conducted in the dark (Fig. 6A). From the t = −30 to 0-min range (i.e., the initial equilibrating step in the dark), sample ST80 was the superior adsorbent by a large margin (95% reduction). Additionally, sample S showed a stronger adsorbent capability (69% reduction of Rh B) in comparison to KS80 (51% reduction). The low Rh B adsorption of KS80 is likely due to bottlenecks in the pore network as evidenced by the narrow hysteresis of its adsorption–desorption isotherms (see Fig. 2C). This observation further reinforces the results of previous BET and BJH calculations, as ST80 had a wider hysteresis of the adsorption–desorption isotherms and widely distributed pore sizes (see Fig. 2D), along with the second-highest surface area, allowing greater access of Rh B molecules to catalytic sites. This in turn enabled faster photocatalysis once the simulator lamp was switched on at t = 0 and ST80 showed ∼100% removal of the pollutant within 60 min of reaction time (Fig. 6A). In contrast, sample S had a much narrower pore size distribution and despite its high surface area; it was apparent that some of the smaller pores acted as bottlenecks, which hindered substrate flow within the pore structure, as evidenced by the narrow/extended hysteresis of its adsorption–desorption isotherms (see Fig. 2C).62,63 This led to an overall reduction in adsorption rate, which impeded the overall pollutant removal ability of sample S, resulting in ∼100% Rh B removal only after 90 min reaction time. It is noteworthy that sample KS80, synthesized using the conventional (and least sustainable) templating agents, kerosene oil and Span® 80, displayed the lowest overall efficiency of Rh B removal of ∼95%, after 180 min of reaction.The impact of initial adsorption can be essentially nullified by plotting normalized C/C0 (i.e., final concentration/initial concentration of Rh B) graphs, which are better indicators for the photocatalytic activity of the titanosilicates (Fig. 6B). These plots indicated that sample S surpassed sample ST80 in terms of pure photocatalytic activity, despite the stronger adsorption performance of the latter. The conventional sample KS80 showed a much slower rate of photocatalytic degradation. However, all three samples provided near-complete removal of Rh B after 180 min of reaction time. This study showed once again that adsorption played a critical role in the fast removal of Rh B by the titanosilicates, and subsequent photocatalysis, which ensured its complete degradation (see images in Fig. 6C). This was further verified by UV-Vis spectroscopy, which indicated that Rh B was degraded completely, and no new product peaks were observed (ESI† Fig. S8). Commercial Aeroxide P25 TiO2 was tested as a reference compound under the same conditions; however, these particles broke down during the reaction and formed a colloidal suspension, which heavily absorbed incident light in the UV and near-UV regions, and hence led to unreliable results (ESI† Fig. S9). This also meant that commercial P25 was unsuitable for water-based applications, while the titanosilicates were proven to be viable (see further details in Section 3.5).
Reaction kinetics for sample KS80 followed the Langmuir–Hinshelwood model and fitted pseudo-first order kinetics (ESI† Fig. S10),64 which are typical for heterogeneous catalysts, in accordance with our previous findings.29 However, the kinetics for samples S and ST80 appears to deviate from the above, with possibly two reaction orders evident during the −30 to 60 min and 60–180 min reaction stages. During the rapid substrate adsorption that occurred during the initial 30-minute equilibration step in the dark (i.e., −30 to 0 min in Fig. 6A), followed by the first 60 min of light reaction (i.e., photocatalysis occurred during 0–60 min), the reaction order appears to follow first order kinetics (see Fig. 6A and ESI† Fig. S11A and B). However, after 60 min the graphs for both S and ST80 appear to be near horizontal until 180 min, approximating zero order kinetics. Such phenomena have been described previously in heterogeneous catalytic systems that had both adsorbent and photocatalytic components.65 These observations also verify the importance of adsorption of Rh B by the titanosilicates and confirm the occurrence of a bimodal adsorption-photocatalysis based mechanism reported by us previously.29
The reaction rates for the initial first order stage of Rh B removal (i.e., −30 to 60 min) were 0.014, 0.037 and 0.042 mg L−1 min−1 for samples KS80, S and ST80 respectively (Table 4). Thus, the sunflower oil-based S and ST80 samples had superior pollutant removal ability compared to the petrochemical-based KS80, with 2.6 and 3 times the reaction rate of the latter respectively. The reaction stage between 90–180 min best fitted the zero-order scale, where the rates were 0.005, 0.012 and 0.008 mg L−1 min−1 respectively for KS80, S and ST80. It must be noted that these rates can be attributed to the pore structure parameters verified by BET and BJH calculations, as discussed previously. However, further insights can be gained by examining elemental and phase composition information gathered via EDS and XPS. It is noteworthy that based on the EDS results, the sample with the smallest Si![[thin space (1/6-em)]](https://www.rsc.org/images/entities/char_2009.gif) :
:![[thin space (1/6-em)]](https://www.rsc.org/images/entities/char_2009.gif) Ti ratio (i.e., highest Ti amount) has the best overall photocatalytic efficiency. Further insights were gathered via XPS results, regarding active phases of the materials. According to XPS, the KS80 sample exhibited a greater quantity of the higher binding energy “TiO2/SiO2” component (i.e., isolated, tetrahedral Ti–O–Si sites) compared to other samples. However, the rate of Rh B degradation was shown to be much higher for the S and ST80 samples, where more of the lower binding energy “TiO2” component (i.e., octahedral Ti–O–Ti oligomers) was present (see Table 2). The mechanism of the Rh B breakdown has been shown to depend on the photoactivated generation of reactive oxygen species and hydroxyl radicals, which is also known to be exhibited by TiO2.66 Therefore, the presence of ‘contaminant’ TiO2 phases appeared to coexist synergistically with isolated tetrahedral (“TiO2/SiO2”) active sites and hence to be beneficial to the overall photocatalytic efficiency of the titanosilicates.59
Ti ratio (i.e., highest Ti amount) has the best overall photocatalytic efficiency. Further insights were gathered via XPS results, regarding active phases of the materials. According to XPS, the KS80 sample exhibited a greater quantity of the higher binding energy “TiO2/SiO2” component (i.e., isolated, tetrahedral Ti–O–Si sites) compared to other samples. However, the rate of Rh B degradation was shown to be much higher for the S and ST80 samples, where more of the lower binding energy “TiO2” component (i.e., octahedral Ti–O–Ti oligomers) was present (see Table 2). The mechanism of the Rh B breakdown has been shown to depend on the photoactivated generation of reactive oxygen species and hydroxyl radicals, which is also known to be exhibited by TiO2.66 Therefore, the presence of ‘contaminant’ TiO2 phases appeared to coexist synergistically with isolated tetrahedral (“TiO2/SiO2”) active sites and hence to be beneficial to the overall photocatalytic efficiency of the titanosilicates.59
| Metric/property | KS80 | S | ST80 |
|---|---|---|---|
| BET surface area (m2 g−1) | 278 | 429 | 284 |
| BJH pore radius (nm) | 1.74 | 1.26 | 1.74 |
| Rate (−30 to 60 min) (mg L−1 min−1) | 0.014 | 0.037 | 0.042 |
| Rate (90 to 180 min) (mg L−1 min−1) | 0.005 | 0.012 | 0.008 |
| Estimated bandgap (eV) | 3.37 | 3.13 | 3.25 |
| Cost to produce (£ per g) | 2.15 | 1.17 | 1.61 |
Our materials are shown either to equal or surpass the previously reported photocatalytic performances of non-doped titanosilicates,29,61 while those that exceed ours tend to have drawbacks such as being expensive to produce, having longer/harsher synthesis conditions etc.35 Such disadvantages need to be mitigated with sustainable alternatives when developing viable photocatalysts for the future – an approach that we have endeavoured to develop during this study.
3.4. Radical quenching experiments: proof of photocatalytic mechanism
The photocatalytic mechanism for titanosilicates typically proceeds via a radical generation mechanism, similar to that of semiconductors such as TiO2.56 Valence electrons within the titanosilicate framework are optically excited to the conduction band and migrate to the interface where they interact with oxygen and water to produce free radicals such as O2−˙ and OH˙ (ESI† Fig. S12).26 The radicals cause the degradation of organic pollutants, ultimately breaking them down to CO2 and H2O. Radical quenching experiments were conducted in order to validate this mechanism for all titanosilicate-based reactions, using IPA and PBQ as radical scavenging agents.39The results indicate that the reaction rate for Rh B degradation with sample S as catalyst slowed down significantly with the presence of PBQ (∼93% in 180 min, as opposed to ∼100% at 60 minutes without it) (Fig. 7A and B), indicating the occurrence of O2−˙ radicals during the reaction. The addition of IPA slowed the reaction even further (∼81% at 180 min), indicating the presence of OH˙ radicals. This also revealed that the OH˙ radical was more prevalent within the mechanism. The scavenger agents had varying degrees of impact upon all titanosilicates tested during the study, indicating that variation of templating agents had an impact on the overall chemical structure and by extension, the adsorption-catalytic ability of the materials. Sample S, synthesized using commercial sunflower oil alone, appeared to be the most effective adsorbent-catalyst for removal of Rh B from water.
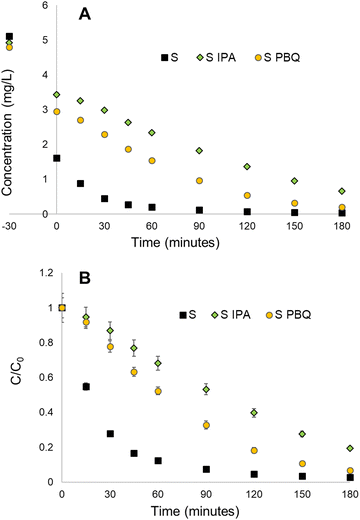 | ||
| Fig. 7 Radical quenching results for the S (sunflower oil) sample, showing that IPA and PBQ scavenger compounds slow down the rate of reaction, with IPA having more of an impact than PBQ. | ||
3.5. Recyclability of titanosilicate photocatalysts
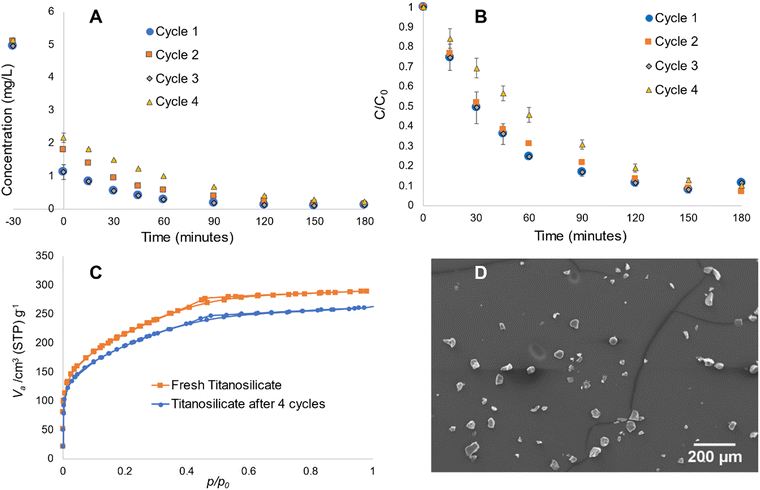
Sample S was used for the recycling experiments due its superior pollutant removal ability. This sample was subjected to the same reaction cycle of Rh B degradation up to four repetitive cycles. In each case, the material was collected by centrifuging after a 180-min reaction and dried at 80 °C under vacuum for 30 min, prior to use in another similar reaction cycle. As depicted in Fig. 8A and B, there are no notable decreases in the absorbance-photocatalytic ability during the first three cycles. The fourth cycle depicts minor decrease in the materials’ overall activity. BET experiments conducted before and after four cycles of reaction indicate some decrease in surface area (Fig. 8C), while the overall pore structure remained intact. SEM experiments showed some breakage of the microspheres, which may explain the reduction in surface area due to partial collapse of the pore structure (Fig. 8D), while the majority remained intact. It must be noted that potential commercial applications will use the material in immobilized form, where its physical structure would be more resilient, without the constant impact of the magnetic stirring process in this work. Therefore, this material appears to be sufficiently robust for application in water purification.3.6. Influence of templating agents on titanosilicate structures and morphologies
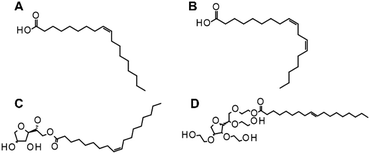
Whilst a full investigation into the differences between all templating agents used in this study is outside the scope of this proof-of-concept study, it is noteworthy to inspect their chemical structures in order to gain preliminary insights into potential causes of the observed material structures. Vegetable oil is primarily derived from monounsaturated acids such as oleic acid (Fig. 9A), whereas sunflower oil is predominantly based on polyunsaturated acids such as linoleic acid (Fig. 9B).67 Kerosene is a fraction of crude oil that boils between about 145 °C and 300 °C and it mainly comprises aliphatic and aromatic hydrocarbons in the C9 to C16 range.68 The surfactants (when used) were Span® 80 (Fig. 9C) and Tween-80 (Fig. 9D). As a monounsaturated oil, vegetable oil (rapeseed/canola oil) is more polar than the polyunsaturated sunflower oil. Its single C![[double bond, length as m-dash]](https://www.rsc.org/images/entities/char_e001.gif) C double bond allows the molecule to move relatively flexibly, giving large degrees of freedom to wrap around other molecules. Polyunsaturated oils such as sunflower oil, on the other hand, have more than one C
C double bond allows the molecule to move relatively flexibly, giving large degrees of freedom to wrap around other molecules. Polyunsaturated oils such as sunflower oil, on the other hand, have more than one C![[double bond, length as m-dash]](https://www.rsc.org/images/entities/char_e001.gif) C bond, which increases their steric hindrance and restricts their rotation.69,70 They are also less polar than monounsaturated oils, which limits the interactions that they might have within an aqueous emulsion. Monounsaturated oils are more resistant to thermal stress and the products that are obtained through thermal oxidative stress are more limited.71
C bond, which increases their steric hindrance and restricts their rotation.69,70 They are also less polar than monounsaturated oils, which limits the interactions that they might have within an aqueous emulsion. Monounsaturated oils are more resistant to thermal stress and the products that are obtained through thermal oxidative stress are more limited.71
It can be hypothesized that the steric effects and lower polarity of sunflower oil compared to kerosene oil and Span® 80 may impact how it interacts with the aqueous titanosilicate precursor. However, such impacts may be minimized or mitigated by the homogenizing conditions (i.e., 3000 rpm at 80 °C) employed during synthesis. Moreover, impurities present in commercial oils may also influence this process. A clear-cut explanation on the matter would require further investigation, which is beyond the scope of this study. Additionally, we did not find any link between the viscosity of the templating solutions and the physiochemical characteristics of the materials made (ESI† Table S1).
3.7. Outlook: A path for sustainable synthesis of titanosilicates
The goal of this study was to investigate sustainable and economical pathways for synthesis of titanium based photocatalysts, as alternatives to conventional methods that are either expensive and/or toxic.72 As indicated in Table 4, the cost per gram of material decreases by 45.6% if the kerosene + Span® 80 mixture is substituted by sunflower oil, a significant factor in making titanosilicate materials more accessible to poorer nations for water treatment solutions. (Note that the prices quoted in the table are based on laboratory costs and not bulk ones, so there is obvious potential for the practical costs to be reduced further).The prices of sunflower oil and vegetable oil have increased beyond standard inflation recently, as the two largest exporters of oil are Ukraine and the Russian Federation.73 Due to the current conflict between these two nations, the prices of grain-related products have all increased and their supplies have been reduced substantially. Nevertheless, the present results are still significant, and the cost benefit of using natural oils is expected to increase as supplies return to a normal rate. Moreover, DAC nations such as Uganda, another global supplier of sunflower oil, may see an increase in their export, thus allowing wider economic influence of the proposed photocatalytic technology.
Comparison of cost versus reaction rates for all titanosilicate samples synthesized during this study (Fig. 10) further emphasizes the advantages of using sunflower oil, as the cost-to-performance is substantially better. The use of a single templating source is also significant, as previous works have looked at dual templating to optimize the pore structures, which requires the sourcing of two materials, thus increasing cost.32
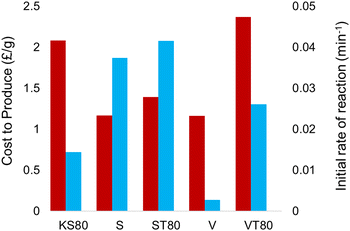 | ||
| Fig. 10 Comparison between the production cost and initial rates of reaction, showing sunflower oil as a viable candidate for a replacement templating technique. | ||
The use of commercial cooking oils such as rapeseed oil and sunflower oil not only lowers the cost of synthesis significantly, but also limits the use of toxic chemicals such as kerosene, which are linked to fossil fuels and are environmentally unsustainable. Additionally, commercial oils are widely available in many developing nations, reducing the roadblocks in local usage of advanced photocatalysts.73 Using recycled or waste oils is another avenue of future exploration, which could further improve the sustainability of photocatalyst production. Although this study shows progress made in development of sustainable, less expensive materials, there is more work to be undertaken, including testing the photocatalysts on actual organic pollutants such as antibiotics and pesticides. Fresh river water experiments are also planned, to test the robustness and capabilities of the photocatalysts in real world, water treatment applications.
4. Conclusions
Novel surfactant techniques were used to synthesize porous photocatalytic titanosilicate materials. The research aimed to substitute conventional petrochemicals with cheaper, sustainable commercial cooking oils including sunflower and vegetable (rapeseed) oil and characterize the resulting photocatalysts. SEM examination of the new titanosilicate catalysts revealed approximately 30 μm particle sizes, and suggestions for the observed changes in morphology were proposed based on the structures of the oils used. BET porosimetry indicated that the materials were microporous, with high surface areas of 278, 429 and 284 m2 g−1 and pore sizes of 1.74, 1.26 and 1.74 nm for samples KS80, S and ST80 respectively. The presence of photoactive Ti4+ sites was confirmed by FTIR, Raman, XPS and UV-Vis diffuse reflectance studies, with XPS showing TiO2![[thin space (1/6-em)]](https://www.rsc.org/images/entities/char_2009.gif) :
:![[thin space (1/6-em)]](https://www.rsc.org/images/entities/char_2009.gif) TiO2/SiO2 ratios of 0.424, 3.23 and 1.97 for titanosilicates KS80, S and ST80 respectively. Diffuse reflectance – Kubelka–Munk analysis provided estimated bandgaps of 3.37, 3.13 and 3.25 eV for KS80, S and ST80 samples respectively and 3.25 eV for commercial TiO2 reference Aeroxide P25. Hence the new materials exhibited similar or lower bandgap energies than TiO2 without the need for added dopants, implying potentially useful levels of violet/near-UV absorption under solar radiation.
TiO2/SiO2 ratios of 0.424, 3.23 and 1.97 for titanosilicates KS80, S and ST80 respectively. Diffuse reflectance – Kubelka–Munk analysis provided estimated bandgaps of 3.37, 3.13 and 3.25 eV for KS80, S and ST80 samples respectively and 3.25 eV for commercial TiO2 reference Aeroxide P25. Hence the new materials exhibited similar or lower bandgap energies than TiO2 without the need for added dopants, implying potentially useful levels of violet/near-UV absorption under solar radiation.
The sunflower oil based titanosilicates S and ST80 were found to be significantly more effective in degrading model pollutant Rh B under simulated sunlight, in comparison to their petrochemical-based counterpart KS80. Sample ST80 had the fastest initial reaction rate of 0.042 mg L−1 min−1 with ∼100% Rh B removal within 60 min of light reaction, largely due to fast adsorption by its well-distributed pore structure. The second fastest Rh B removal was displayed by sample S (∼100% in >90 min, initial rate 0.037 mg L−1 min−1), followed by KS80 (95% in 180 min, initial rate 0.014 mg L−1 min−1), in accordance with pore size distribution and TiO2![[thin space (1/6-em)]](https://www.rsc.org/images/entities/char_2009.gif) :
:![[thin space (1/6-em)]](https://www.rsc.org/images/entities/char_2009.gif) TiO2/SiO2 active site availability. However, normalized data indicated that sample S had superior overall photocatalytic capability, after accounting for the impact of initial adsorption. Sample S was also shown to have good recyclability in terms of adsorbent-photocatalytic ability as well as retention of pore structure over four cycles of light-driven reaction, indicating their potential to be used in tertiary water treatment applications. Further studies must include an investigation into the chemical changes of the oil templating agents before and after the synthesis, as well as testing these materials against common contaminants for comprehensive assessment of their pollutant-removal capability and longevity within a water medium in immobilized form.
TiO2/SiO2 active site availability. However, normalized data indicated that sample S had superior overall photocatalytic capability, after accounting for the impact of initial adsorption. Sample S was also shown to have good recyclability in terms of adsorbent-photocatalytic ability as well as retention of pore structure over four cycles of light-driven reaction, indicating their potential to be used in tertiary water treatment applications. Further studies must include an investigation into the chemical changes of the oil templating agents before and after the synthesis, as well as testing these materials against common contaminants for comprehensive assessment of their pollutant-removal capability and longevity within a water medium in immobilized form.
Abbreviations
| KS80 | Kerosene + span® 80 |
| V | Vegetable (rapeseed) oil |
| VT80 | Vegetable oil + tween® 80 |
| S | Sunflower oil |
| ST80 | Sunflower oil + tween® 80 |
| SEM | Scanning electron microscopy |
| SEM-EDS | Scanning electron microscopy-electron diffraction spectroscopy |
| BET | Brunauer–Emmett–Teller |
| BJH | Barrett–Joyner–Halenda |
| FTIR | Fourier-transformed infrared spectroscopy |
| DR UV-Vis | Diffuse reflectance UV-Vis |
| XRD | X-ray diffraction |
| XPS | X-ray photoelectron spectroscopy |
| Rh B | Rhodamine B |
| PBQ | p-Benzoquinone |
| IPA | Isopropanol |
| LOP | Lipid oxidation products |
| DAC | Development assistance committee |
Author contributions
Reece M. D. Bristow: writing – original draft, review & editing, methodology, investigation, formal analysis and data curation. Peter J. S. Foot: formal analysis, writing – review & editing, methodology, data curation. X-ray diffraction analysis; review and editing. James D. McGettrick: formal analysis. Joseph C. Bear: writing – review & editing, methodology, data curation. Ayomi S. Perera: writing – review, edit final version of draft, project conceptualization & administration, methodology, formal analysis, funding acquisition.Conflicts of interest
The authors confirm that there are no conflicts to declare.Acknowledgements
The authors gratefully acknowledge the funding provided by the Global Challenges Research Fund towards the completion of this work (10.13039/100016270) and the contributions from Mr Simon Crust for his assistance in conducting SEM experiments and Raman spectroscopy, and Mr Owen Lawler for technical support with FTIR analysis.Notes and references
- The United Nations, The Sustainable Development Goals Report 2022, https://unstats.un.org/sdgs/report/2022/The-Sustainable-Development-Goals-Report-2022.pdf, (accessed 19 June 2023).
- UNESCO World Water Assessment Programme, The United Nations World Water Development Report 2022, https://unesdoc.unesco.org/ark:/48223/pf0000380721, (accessed 7 August 2023).
- UNICEF, Water, sanitation and hygiene (WASH) and climate change, https://www.unicef.org/wash/climate, (accessed 29 August 2023).
- United Nations Economic Commission for Europe, Climate change threatens access to water and sanitation, warn UNECE & WHO/Europe, urging reinforced measures under Protocol to boost resilience, https://unece.org/climate-change/press/climate-change-threatens-access-water-and-sanitation-warn-unece-whoeurope, (accessed 29 August 2023).
- H. K. Karapanagioti, Encyclopedia of Food and Health, Elsevier Inc., 2016, pp. 453–457 Search PubMed.
- C. K. Pooi and H. Y. Ng, npj Clean Water, 2018, 1, 11 CrossRef.
- J. U. Ly, Summary Progress Update 2021: SDG 6-water and sanitation for all, https://www.unwater.org/app/uploads/2021/12/SDG-6-Summary-Progress-Update-<?pdb_no 2021?>2021<?pdb END?>_Version-July-2021a.pdf, (accessed 12 May 2023).
- W. Gwenzi and N. Chaukura, Sci. Total Environ., 2018, 619–620, 1493–1514 CrossRef CAS PubMed.
- O. I. González Peña, M. Á. López Zavala and H. Cabral Ruelas, Int. J. Environ. Res. Public Health, 2021, 18, 1–37 Search PubMed.
- A. Sharma, V. Kumar, B. Shahzad, M. Tanveer, G. P. S. Sidhu, N. Handa, S. K. Kohli, P. Yadav, A. S. Bali, R. D. Parihar, O. I. Dar, K. Singh, S. Jasrotia, P. Bakshi, M. Ramakrishnan, S. Kumar, R. Bhardwaj and A. K. Thukral, SN Appl. Sci., 2019, 1, 1446 CrossRef CAS.
- S. Mompelat, B. Le Bot and O. Thomas, Environ. Int., 2009, 35, 803–814 CrossRef CAS PubMed.
- J. A. Kumar, T. Krithiga, S. Sathish, A. A. Renita, D. Prabu, S. Lokesh, R. Geetha, S. K. R. Namasivayam and M. Sillanpaa, Sci. Total Environ., 2022, 831, 154808 CrossRef PubMed.
- M. Syafrudin, R. A. Kristanti, A. Yuniarto, T. Hadibarata, J. Rhee, W. A. Al-Onazi, T. S. Algarni, A. H. Almarri and A. M. Al-Mohaimeed, Int. J. Environ. Res. Public Health, 2021, 18, 1–15 Search PubMed.
- W. Guo, B. Pan, S. Sakkiah, G. Yavas, W. Ge, W. Zou, W. Tong and H. Hong, Int. J. Environ. Res. Public Health, 2019, 16, 4361 CrossRef CAS PubMed.
- G. Ren, H. Han, Y. Wang, S. Liu, J. Zhao, X. Meng and Z. Li, Nanomaterials, 2021, 11, 1804 CrossRef CAS PubMed.
- M. B. Tahir, T. Iqbal, M. Rafique, M. S. Rafique, T. Nawaz and M. Sagir, in Nanotechnology and Photocatalysis for Environmental Applications, ed. M. B. Tahir, M. Rafique and M. S. Rafique, Elsevier, 2020, pp. 65–76 Search PubMed.
- A. Jańczyk, E. Krakowska, G. Stochel and W. Macyk, J. Am. Chem. Soc., 2006, 128, 15574–15575 CrossRef PubMed.
- E. S. Elmolla and M. Chaudhuri, J. Hazard. Mater., 2010, 173, 445–449 CrossRef CAS PubMed.
- Q. Li, X. Li, S. Wageh, A. A. Al-Ghamdi and J. Yu, Adv. Energy Mater., 2015, 5, 1500010 CrossRef.
- I. F. Waheed, O. Yasin Thayee Al-Janabi and P. J. S. Foot, J. Mol. Liq., 2022, 357, 119084 CrossRef CAS.
- B. Stieberova, M. Zilka, M. Ticha, F. Freiberg, P. Caramazana-González, J. McKechnie and E. Lester, J. Cleaner Prod., 2019, 241, 118325 CrossRef.
- M. Shakeel, F. Jabeen, S. Shabbir, M. S. Asghar, M. S. Khan and A. S. Chaudhry, Biol. Trace Elem. Res., 2016, 172, 1–36 CrossRef CAS PubMed.
- A. T. Le, T. D. H. Le, K. Y. Cheong and S. Y. Pung, J. Environ. Chem. Eng., 2022, 10, 108505 CrossRef CAS.
- S. Y. Lee and S. J. Park, J. Ind. Eng. Chem., 2013, 19, 1761–1769 CrossRef CAS.
- M. W. Anderson, O. Terasaki, T. Ohsuna, A. Philippou, S. P. MacKay, A. Ferreira, J. Rocha and S. Lidin, Structure of the microporous titanosilicate ETS-10, 1994.
- D. M. Poojary, R. A. Cahill and A. Clearfield, Chem. Mater., 1994, 6, 2364–2368 CrossRef CAS.
- A. S. Perera and M.-O. Coppens, Catalysis, The Royal Society of Chemistry, 2016, vol. 28, pp. 119–143 Search PubMed.
- A. S. Perera, P. Trogadas, M. M. Nigra, H. Yu and M. O. Coppens, J. Mater. Sci., 2018, 53, 7279–7293 CrossRef CAS PubMed.
- A. S. Perera, P. M. Melia, R. M. D. Bristow, J. D. McGettrick, R. J. Singer, J. C. Bear and R. Busquets, Microporous Mesoporous Mater., 2022, 345, 112276 CrossRef CAS.
- C. Z. Costa, E. F. Sousa-Aguiar, M. A. P. G. Couto and J. F. S. D. C. Filho, Catalysts, 2020, 10, 843 CrossRef CAS.
- N. Kaur, M. Singh, A. Moumen, G. Duina and E. Comini, Materials, 2020, 13, 1–21 CrossRef PubMed.
- W. Li and M. O. Coppens, Chem. Mater., 2005, 17, 2241–2246 CrossRef CAS.
- T. D. Nguyen-Phan, E. W. Shin, V. H. Pham, H. Kweon, S. Kim, E. J. Kim and J. S. Chung, J. Mater. Chem., 2012, 22, 20504–20511 RSC.
- A. Fujishima, T. N. Rao and D. A. Tryk, J. Photochem. Photobiol., C, 2000, 1, 1–21 CrossRef CAS.
- A. K. Adepu, R. Anumula and V. Narayanan, Microporous Mesoporous Mater., 2017, 247, 86–94 CrossRef CAS.
- R. P. Chilcott, Kerosene Toxicological overview Key Points, https://assets.publishing.service.gov.uk/government/uploads/system/uploads/attachment_data/file/337529/hpa_kerosene_toxicological_overview_v2.pdf, (accessed 18 July 2021).
- P. Makuła, M. Pacia and W. Macyk, J. Phys. Chem. Lett., 2018, 9, 6814–6817 CrossRef PubMed.
- S. J. Gregg and K. S. W. Sing, Adsorption, surface area, and porosity, 2nd edn, 1995 Search PubMed.
- S. Fang, K. Lv, Q. Li, H. Ye, D. Du and M. Li, Appl. Surf. Sci., 2015, 358, 336–342 CrossRef CAS.
- R. Bai, M. T. Navarro, Y. Song, T. Zhang, Y. Zou, Z. Feng, P. Zhang, A. Corma and J. Yu, Chem. Sci., 2020, 11, 12341–12349 RSC.
- A. S. Perera, J. K. Cockcroft, P. Trogadas, H. Yu, N. Kapil and M. O. Coppens, J. Mater. Sci., 2019, 54, 335–345 CrossRef CAS PubMed.
- G. Ricchiardi, A. Damin, S. Bordiga, C. Lamberti, G. Spanò, F. Rivetti and A. Zecchina, J. Am. Chem. Soc., 2001, 123, 11409–11419 CrossRef CAS PubMed.
- O. Frank, M. Zukalova, B. Laskova, J. Kürti, J. Koltai and L. Kavan, Phys. Chem. Chem. Phys., 2012, 14, 14567–14572 RSC.
- U. Balachandran and N. G. Eror, Raman Spectra of Titanium Dioxide, 1982, vol. 42.
- E. Berrier, C. Zoller, F. Beclin, S. Turrell, M. Bouazaoui and B. Capoen, J. Phys. Chem. B, 2005, 109, 22799–22807 CrossRef CAS PubMed.
- R. Bai, Y. Song, Y. Li and J. Yu, Trends Chem., 2019, 1, 601–611 CrossRef CAS.
- M. Iwamoto, Y. Tanaka, N. Sawamura and S. Namba, J. Am. Chem. Soc., 2003, 125, 13032–13033 CrossRef CAS PubMed.
- V. Smeets, E. M. Gaigneaux and D. P. Debecker, Microporous Mesoporous Mater., 2020, 293, 109801 CrossRef CAS.
- L. Emdadi, D. T. Tran, J. Zhang, W. Wu, H. Song, Q. Gan and D. Liu, RSC Adv., 2017, 7, 3249–3256 RSC.
- D. Aldhayan, K. Kalíková, M. R. Shaik, M. R. H. Siddiqui and J. Přech, Catalysts, 2020, 10, 1–12 CrossRef.
- J. Wang, Y. Zhao, T. Yokoi, J. N. Kondo and T. Tatsumi, ChemCatChem, 2014, 6, 2719–2726 CrossRef CAS.
- M. Sasaki, Y. Sato, Y. Tsuboi, S. Inagaki and Y. Kubota, ACS Catal., 2014, 4, 2653–2657 CrossRef CAS.
- G. Xiong, Q. Jia, Y. Cao, L. Liu and Z. Guo, RSC Adv., 2017, 7, 24046–24054 RSC.
- A. B. Murphy, J. Phys. D: Appl. Phys., 2006, 39, 3571–3581 CrossRef CAS.
- S. M. Sze, Y. Li and K. K. Ng, Physics of semiconductor devices, John wiley & sons, 2021 Search PubMed.
- H. Dong, G. Zeng, L. Tang, C. Fan, C. Zhang, X. He and Y. He, Water Res., 2015, 79, 128–146 CrossRef CAS PubMed.
- S. Contarini, P. A. W. Van Der Heide, A. M. Prakash and L. Kevan, J. Electron Spectrosc. Relat. Phenom., 2002, 125, 25–33 CrossRef CAS.
- J. C. Bear, V. Gomez, N. S. Kefallinos, J. D. McGettrick, A. R. Barron and C. W. Dunnill, J. Colloid Interface Sci., 2015, 460, 29–35 CrossRef CAS PubMed.
- R. Quesada-Cabrera, C. Sotelo-Vazquez, J. C. Bear, J. A. Darr and I. P. Parkin, Adv. Mater. Interfaces, 2014, 1, 1400069 CrossRef.
- N. Uekawa, M. Watanabe, K. Kaneko and F. Mizukami, Mixed-valence Formation in Highly Oriented Ti-doped Iron Oxide Film, 1995.
- P. Wilhelm and D. Stephan, J. Photochem. Photobiol., A, 2007, 185, 19–25 CrossRef CAS.
- S. Brunauer, P. H. Emmett and E. Teller, Adsorption of Gases in Multimolecular Layers, 1938 Search PubMed.
- M. Kruk and M. Jaroniec, Chem. Mater., 2001, 13, 3169–3183 CrossRef CAS.
- G. W. Roberts and C. N. Satterfield, Chemical Kinetics and Chain Reactions, UTC, 1954, vol. 8 Search PubMed.
- H. Gulyas, J. Adv. Chem. Eng., 2016, 4, 1000108 Search PubMed.
- C. Sotelo-Vazquez, R. Quesada-Cabrera, M. Ling, D. O. Scanlon, A. Kafizas, P. K. Thakur, T. L. Lee, A. Taylor, G. W. Watson, R. G. Palgrave, J. R. Durrant, C. S. Blackman and I. P. Parkin, Adv. Funct. Mater., 2017, 27, 1605413 CrossRef.
- G. Ampem, A. Le Gresley, M. Grootveld, S. De Mars and D. P. Naughton, Food Chem., 2022, 375, 131823 CrossRef CAS PubMed.
- U.S. Environmental Protection Agency, Screening-Level Hazard Characterization Kerosene/Jet Fuel Category Sponsored Chemicals Kerosene (petroleum) Hydrodesulfurized kerosene (petroleum) Acid treated light distillate, light Chemically neutralized light distillates (petroleum) Hydrotreated light distillates (petroleum) Heavy aliphatic solvent naphtha (petroleum), https://www.epa.gov/chemrtk/pubs/general/guidocs.htm., (accessed 15 June 2023).
- Y. Zhang, H. Han, M. Zhang, H. Wang, Y. Chen, C. Zhai, J. Sun, J. Deng, H. Song and C. Zhang, J. Solid State Chem., 2021, 297, 122035 CrossRef CAS.
- S. A. Rackley, in Carbon Capture and Storage, ed. S. A. Rackley, Butterworth-Heinemann, Boston, 2010, pp. 353–372 Search PubMed.
- G. Ampem, A. Le Gresley, M. Grootveld and D. P. Naughton, Front. Nutr., 2021, 8, 721736 CrossRef PubMed.
- G. K. Maiyoh, R. W. Njoroge and V. C. Tuei, Environ. Toxicol. Pharmacol., 2015, 40, 57–70 CrossRef CAS PubMed.
- Food and Agriculture Organization of the United Nations, FAO Statistical Database License: CC BY-NC-SA 3.0 IGO, https://www.fao.org/faostat/en/#data/QCL/visualize, (accessed 29 June 2022).
Footnote |
| † Electronic supplementary information (ESI) available: For physiochemical characterisation of additional templating mixtures, as well as additional data and structural information. See DOI: https://doi.org/10.1039/d3ma00957b |
| This journal is © The Royal Society of Chemistry 2024 |

