
 Open Access Article
 This Open Access Article is licensed under a
 Creative Commons Attribution 3.0 Unported Licence
Iron phthalocyanine integrated with boron-doped reduced graphene oxide for highly selective four-electron oxygen reduction: an experimental study†
Vikram
Rathour
a,
Smita
Singh
a,
Varsha
Singh
a,
Devesh Kumar
Singh
b,
Mamta
Yadav
a,
Ananya
Tiwari
a and
Vellaichamy
Ganesan
 *a
*a
aDepartment of Chemistry, Institute of Science, Banaras Hindu University, Varanasi 221005, UP, India. E-mail: velganesh@yahoo.com
bKutir Post Graduate College, Chakkey, Jaunpur 222146, UP, India
First published on 26th March 2024
Abstract
Iron phthalocyanine (FePc) has been integrated on boron-doped reduced graphene oxide (B-RGO) resulting in the composite, FePc@B-RGO. Boron alters the electronic structure around FePc and shows a higher selectivity than that of the benchmark catalyst, Pt/C, for four-electron oxygen reduction. FePc@B-RGO exhibits high oxygen reduction reaction activity with a high onset potential and half-wave potential (0.95 and 0.85 V vs. RHE respectively). FePc@B-RGO also shows a low Tafel slope of 39 mV dec−1 and high efficiency, stability, and methanol crossover for oxygen reduction in basic media.
Introduction
The fuel crisis and fuel price hikes are increasing day by day at alarming rates. Switching from a non-renewable to a renewable source of energy is the need of the hour. Currently, platinum on carbon (Pt/C) is the benchmark electrocatalyst for the oxygen reduction reaction (ORR); however, it suffers from drawbacks like high cost, carbon monoxide poisoning, methanol cross-over, and a few stability issues which limit its use in fuel cells and other devices based on the ORR.1,2 The replacement of the benchmark Pt/C catalyst by a non-precious electrocatalyst is necessary for the large-scale commercialization of the devices based on the ORR.3–5 Two-dimensional materials like graphene have a huge surface area, electrical conductivity, and durability which make it an efficient candidate for the ORR. Furthermore, doping of an appropriate amount of heteroatoms like N, P, S, or B increases the activity of graphene towards the ORR.7–10 It is reported that the heteroatom (N and P) doping alters the electroneutrality of graphene and the carbon atoms near to the doped heteroatoms become active sites for the ORR and increase the catalytic activity.11 Yang et al. established that in the boron-doped carbon nanotubes, boron itself became an active site for the ORR since boron is less electronegative than carbon and carries a positive charge, which is appropriate for the chemisorption of O2.12 MN4 macrocyclic compounds like metal phthalocyanines show efficient ORR performance. Immobilization of iron phthalocyanine (FePc) on graphene via non-covalent, i.e. π–π, interactions prevents the aggregation of FePc and enhances the electron transfer and conductivity of the material.13–15 FePc has a square planar structure and two axial positions are empty; however, one site is usually occupied by O2 during the ORR and the other coordination is satisfied by the atoms of the support material. The preliminary step of the ORR is the adsorption of oxygen on the catalytic site, which is the iron center in our case. Firstly, oxygen transfers charge to the dz2 orbital of iron and raises the energy level of the dxz and dyz orbitals, while decreasing the energy level of the π* orbital of O2. Then, iron transfers the charge from the dxz and dyz orbitals to the oxygen π* orbital through the back bonding, which further strengthens the bond between oxygen and iron.6 A deliberate alteration to the surroundings of iron in FePc (by changing the properties of the catalytic support), can change the electronic structure of the iron and lead to an improvement in the oxygen reduction by weakening the O–O bond of the OOH* intermediate during the ORR on the surface of the electrode. Recently, Naomi et al.16 computationally compared the FePc immobilized on nitrogen-doped graphene (NGFePc) and boron-doped graphene (BGFePc) in their work. They calculated the O2 adsorption energy at NGFePc and BGFePc. BGFePc has lower O2 adsorption energy than NGFePc (chemo-adsorption of O2 on active site should be neither too strong nor too weak) and the ORR overpotential at BGFePc becomes lower than the NGFePc. They also showed that the boron atom alters the electronic property of the eg orbital of Fe which enhances the catalytic performance of the composite towards the ORR.16 To the best of our knowledge, until now, no experimental study on FePc incorporated on boron-doped reduced graphene oxide exists. Therefore, in this work, reduced graphene oxide (RGO) and boron-doped RGO (B-RGO) are synthesized and FePc is immobilized onto them by the non-covalent interactions of FePc with the RGO and B-RGO (FePc@RGO and FePc@B-RGO, respectively). As per the literature, it is expected that the thickness of the synthesized RGO could be around 5 nm which corresponds to an average of 5 RGO layers.17,18 This work focuses on the doping of boron on RGO (B-RGO) and further incorporation of FePc on B-RGO (FePc@B-RGO) to experimentally support the theoretically reported results.16 This composite gives desirable ORR activity in alkaline medium which makes it a profitable cathode catalyst for alkaline fuel cells. FePc@B-RGO and control samples (RGO, B-RGO, and FePc@RGO) were synthesized by a solvothermal process and equilibration (for the detailed procedure, refer to the ESI†).Results and discussion
Characterization
The materials are characterized by powder XRD (ESI,† Fig. S1A) and the peak observed at (2θ = 25°) for RGO corresponds to the (002) plane of graphitic carbon. The shift in the 2θ value by 0.9° (2θ = 24.1°) in the case of B-RGO and FePc@B-RGO indicates the successful doping of boron on these materials.8 This shift in (002) diffraction suggests that the doping of electropositive boron alters the lattice structure of graphene.19 The peak at the 2θ value of 43.1° corresponds to the (100) plane of the hexagonal arrangement of graphene.8,9 In the Raman spectra (ESI,† Fig. S1B), two peaks are observed at 1346 and 1597 cm−1, which are attributed to the D and G bands. The intensity ratios of the D and G bands (ID/IG) for RGO, B-RGO, FePc@RGO, and FePc@B-RGO are 0.91, 1.07, 0.96, and 1.09, respectively. The higher ID/IG ratio means more defects present in the material. The higher ID/IG ratio of B-RGO and FePc@B-RGO indicates that boron is doped into these materials.20 However, the ID/IG ratio of FePc@RGO is slightly higher than that of RGO and the ID/IG ratio of FePc@B-RGO is higher than that of B-RGO. This could be due to the formation of defects (to a small extent) owing to the adsorption of phthalocyanine moieties on graphene. In the FT-IR spectra (ESI,† Fig. S1C), the peak depicted at 1720 cm−1 is attributed to the C![[double bond, length as m-dash]](https://www.rsc.org/images/entities/char_e001.gif) O stretching of the carboxyl groups. The peak at 1600 cm−1 is assigned to the aromatic CC bonds, and the broad peak centered at 1121 cm−1 may emerge from C–OH (1221 cm−1) and C–O (1059 cm−1).21 The peak at 728 cm−1 (observed in FePc, FePc@RGO, and FePc@B-RGO) is endorsed to C–H out of plane aromatic stretching showing the successful immobilization of FePc on RGO and B-RGO.13,22–24
O stretching of the carboxyl groups. The peak at 1600 cm−1 is assigned to the aromatic CC bonds, and the broad peak centered at 1121 cm−1 may emerge from C–OH (1221 cm−1) and C–O (1059 cm−1).21 The peak at 728 cm−1 (observed in FePc, FePc@RGO, and FePc@B-RGO) is endorsed to C–H out of plane aromatic stretching showing the successful immobilization of FePc on RGO and B-RGO.13,22–24
Structural and morphological studies on FePc@B-RGO were done by HR-TEM. Sheet structures of B-RGO are visible (Fig. 1(A) and (B)) with some wrinkles at the edges of the sheets. The black dots observed in the images of Fig. 1(A) and (B) are assigned to the FePc particles. The small-sized (5 nm) FePc particles are distributed uniformly throughout the B-RGO sheets and more importantly, no aggregation of FePc particles is seen. Low magnification TEM images (200 nm and 500 nm) are provided in Fig. S2 (ESI†). The energy dispersive X-ray analysis (EDAX)-elemental mapping (ESI,† Fig. S3) of FePc@B-RGO shows the existence of B, C, Fe, N, and O and reveals the successful doping of boron and immobilization of FePc on the graphene sheets. To determine the bonding between the elements, X-ray photoelectron spectroscopy (XPS) is done (Fig. 1(C) and (D)). Boron doping on RGO is confirmed by B 1s XPS (Fig. 1(C)), which can be deconvoluted to BC3, BC2O, BCO2, and B2O3 components. Fe 2p peaks (Fig. 1(D)-(a)) in FePc@B-RGO appear at low binding energy as compared to Fe 2p peaks (Fig. 1(D)-(b)) in FePc@RGO since boron in FePc@B-RGO increases the charge density of Fe in FePc leading to a decrease in the binding energy. The electron sufficiency of RGO promotes an electron donation towards the electron deficient boron centers, thereby making the usual Lewis acidic boron center behave as electron rich under such circumstances.16 This electron rich boron center is capable of donating electrons to the vacant d-orbitals (eg) of the Fe3+ center in FePc.25 Koshevarnikova and co-worker16 stated that “It should be noted that in the case of the systems with boron doping into pure graphene and into graphene with the Stone–Wales defect, the state of the d-orbital of the iron atom is observed near the Fermi energy. In such cases, a charge transfer occurs from the graphene layer to the FePc molecule”. Our results and the theoretical predictions26 indicate the increase in the electron density of the Fe of FePc due to boron doping. Based on this shifting in the XPS peaks, one can conclude that boron changes the electronic structure of FePc in FePc@B-RGO and can favor high efficiency and selectivity towards the ORR. To understand the effect of porosity on the electrocatalytic properties, BET-surface area analyses were carried out. RGO, B-RGO, FePc@RGO, and FePc@B-RGO show type IV hysteresis loops (ESI,† Fig. S4). The BET-surface areas of RGO, B-RGO, FePc@RGO, and FePc@B-RGO are 17, 36, 10, and 15 m2 g−1, respectively (inset Fig. S4, ESI† shows the pore size distribution between 5 and 10 nm). The low surface area of RGO and their composites may be attributed to the hydrothermal treatment, which may decrease the number of functional groups and consequently an increase in pi–pi stacking may occur, leading to a decrease in the BET surface area.27 After the immobilization of FePc on RGO and B-RGO, the BET-surface area is decreased in FePc@RGO and FePc@B-RGO when compared to RGO and B-RGO, respectively. Since FePc@RGO and FePc@B-RGO show almost the same surface area, the electrocatalytic properties of these materials cannot be influenced based on the surface area.28–31
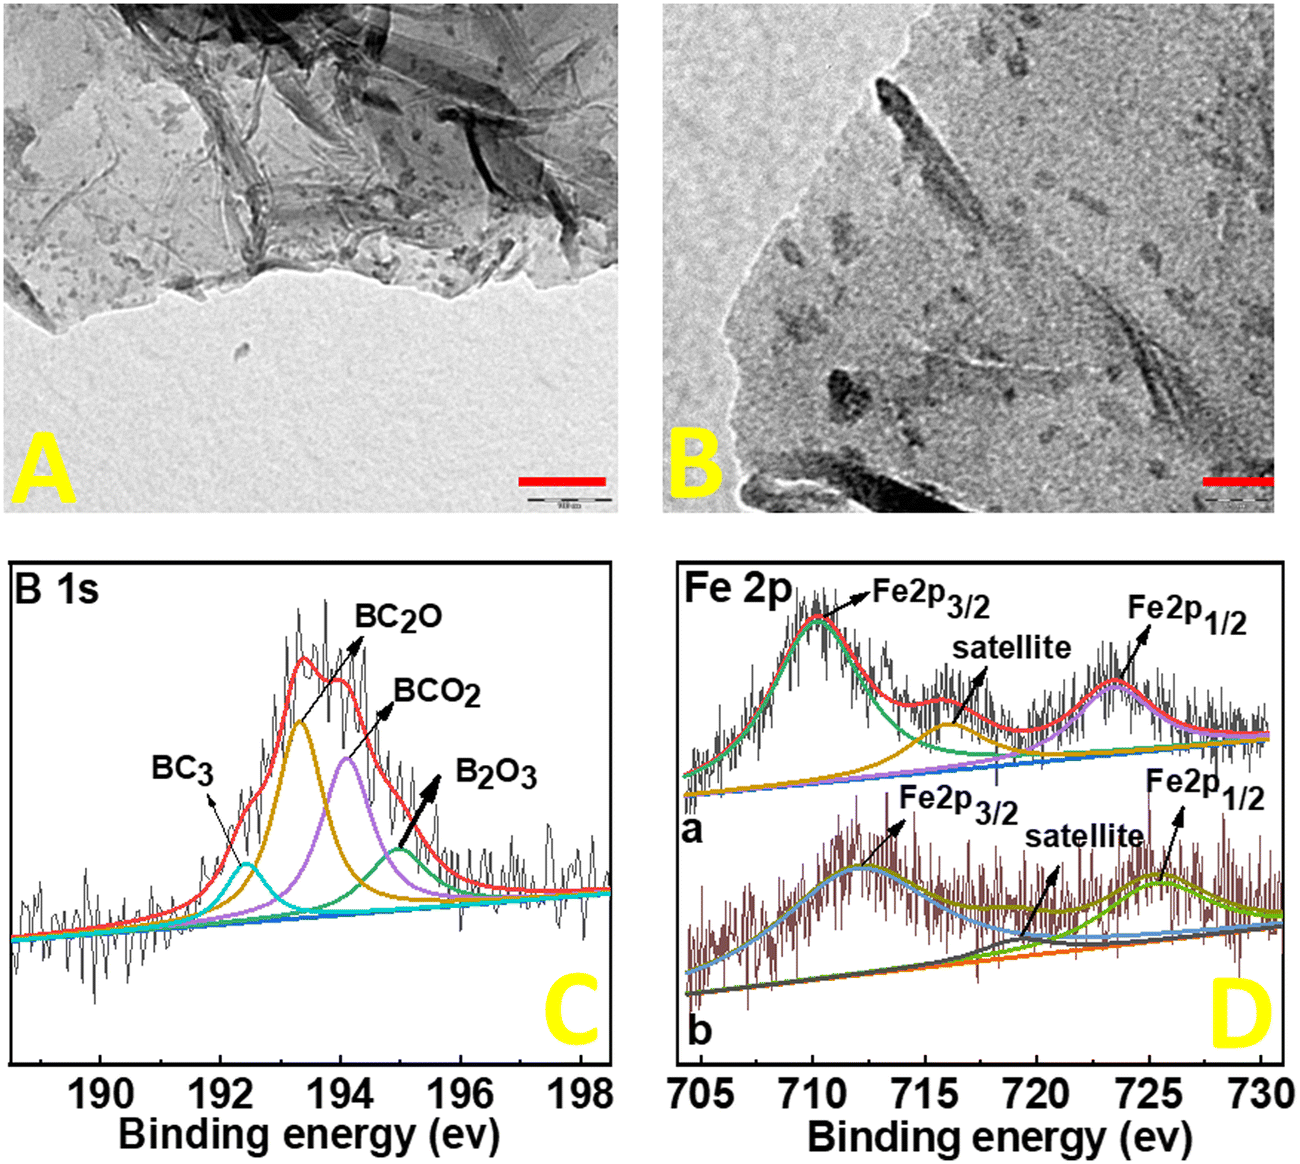 | ||
| Fig. 1 TEM images (A) and (B) of FePc@B-RGO (A: 100 nm scale and B: 20 nm scale) and XPS data of B 1s (C) and Fe 2p (D) in FePc@B-RGO (a) and FePc@RGO (b). | ||
Electrochemical performance in alkaline solution
Electrocatalytic activity towards the ORR is measured in a three-electrode system in 0.1 M KOH solution. Cyclic voltammetry (CV) and hydrodynamic linear sweep voltammetry (LSV) are done on GCRDE in N2 and O2 saturated KOH electrolyte in the potential range of 1.4 to 0.1 V (vs. RHE) at a scan rate of 20 and 5 mV s−1, respectively. Firstly, cyclic voltammograms are recorded for the RGO, B-RGO, FePc@RGO, and FePc@B-RGO materials in the nitrogen saturated environment (ESI,† Fig. S5A) and no characteristic peaks are observed for RGO and B-RGO. Redox peaks related to FePc are seen in the cyclic voltammograms of FePc@RGO (ΔEp = 0.50 V (vs. RHE)), and FePc@B-RGO (ΔEp = 0.07 V (vs. RHE)) (ESI,† Fig. S5B and C) which are due the Fe2+/Fe3+ redox couple.32 The small peak potential difference indicates a faster electron transfer, which is beneficial for the ORR.32–34The broadening of the cyclic voltammogram of B-RGO in comparison to RGO is due to the doping of B on RGO, which alters the nature of the support. In the oxygen-saturated solution, distinct cathodic peaks are observed (Fig. 2(A)) for the ORR. The LSV responses are used to get insight into the Eonset values (Fig. 2(B)). The Eonset values are 0.62, 0.82, 0.90, and 0.95 V (vs. RHE) for RGO, B-RGO, FePc@RGO, and FePc@B-RGO, respectively. FePc@B-RGO demonstrates the highest Eonset value (0.95 V vs. RHE) among all the studied materials due to the highly efficient ORR at the FePc@B-RGO. In the case of FePc@B-RGO, a lower ΔEp (vide supra) value than FePc@RGO is observed, which indicates that the boron has changed the electron structure of iron and altered the redox behavior of FePc. This enhances the catalytic activity of FePc@B-RGO towards the ORR. The Eonset (0.95 V vs. RHE) and E1/2 (0.85 V vs. RHE) of FePc@B-RGO are nearly equal to the benchmark catalyst, Pt/C (Eonset = 0.98 V and E1/2 = 0.86 V (vs. RHE)).35,36 The LSV polarization curve of FePc@B-RGO shows diffusion-limited current density (JD = 5 mA cm−2), which indicates the efficient ORR. From the LSV responses, one can calculate the efficiency of the material when it is exploited in fuel cells or zinc–air batteries.
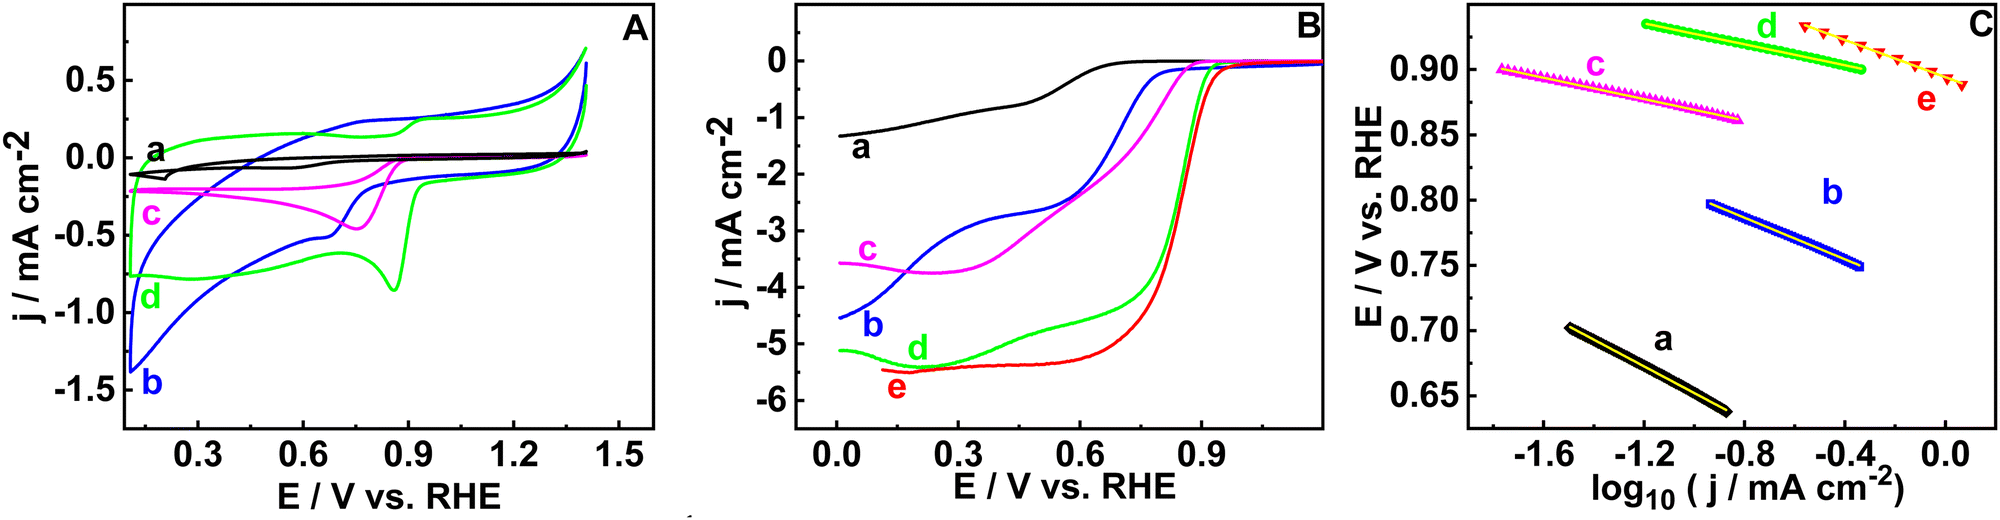 | ||
| Fig. 2 CV responses (A, scan rate: 10 mV s−1), LSV responses (B, scan rate: 5 mV s−1 and rotation rate: 1600 rpm), and Tafel plots (C) of RGO (a), B-RGO (b), FePc@RGO (c), FePc@B-RGO (d), and Pt/C (e) in oxygen-saturated 0.1 M KOH. | ||
Nandan et al.37 experimentally proved that Eonset, E1/2, and JD of the ORR are directly related to the open circuit potential, ohmic loss, and maximum power density, respectively. When the FePc@B-RGO is exploited as a cathode material in the fuel cell, the functioning of the fuel cell can be estimated based on the Eonset, E1/2, and JD.37 The Eonset, E1/2, and JD of FePc@B-RGO are 0.95 V, 0.85 V, and 5 mA cm−2 respectively, which are similar to Pt/C (0.98 V, 0.86 V, and 5.5 mA cm−2) indicating that FePc@B-RGO can be used as a cathode catalyst in the fuel cells. The Tafel slope is used to determine the kinetics of the electrochemical reaction.
Tafel plots were constructed based on the LSV response measured at 1600 rpm of the respective materials in oxygen saturated conditions. Tafel slope values depend on the potential range chosen on the LSV curve. In this study, the kinetic region of the LSV curve is chosen for the analysis. The Tafel slope values for RGO, B-RGO, FePc@R-GO, FePc@B-RGO, and Pt/C are observed as 102, 79, 45, 39, and 71 mV dec−1. FePc@B-RGO has the lowest Tafel slope value (39 mV dec−1), showing faster kinetics than the other materials (Fig. 2(C)).38,39
To determine the number of electrons transferred during the ORR, the LSV responses were recorded at different rotation rates (400 to 2000 rpm) (Fig. 3(A)). The Koutecky–Levich equation (ESI,† eqn (S2)) is used to study the kinetics of the ORR and to estimate the number of electrons transferred. The parallel nature of the K–L plot indicates the first order kinetics of the ORR (Fig. 3(B)) and the number of electrons transferred is 3.99 which matches well with the RRDE studies also. The number of electrons transferred during the ORR and the percentage of H2O2 formed can be calculated based on the disc and ring currents (Fig. 4(A)) from the RRDE data (a detailed discussion is provided in the ESI†).32 Throughout the ORR process, the number of electrons transferred is around 3.9 and the percentage of H2O2 formed is around 1% (Fig. 4(B)). However, RGO, B-RGO, FePc@RGO, and Pt/C (Fig. S6, ESI†) show the number of electrons transferred as 2.9, 2.8, 3.8 and 3.9 and the percentage of H2O2 formed as 46, 56, 10, and 3.5%, respectively.32,40 This demonstrates the highly selective four-electron ORR at the FePc@B-RGO. Such a great selectivity towards the four-electron ORR can be attributed to the doping of boron in RGO, which alters the electronic structure of FePc in the FePc@B-RGO composite.
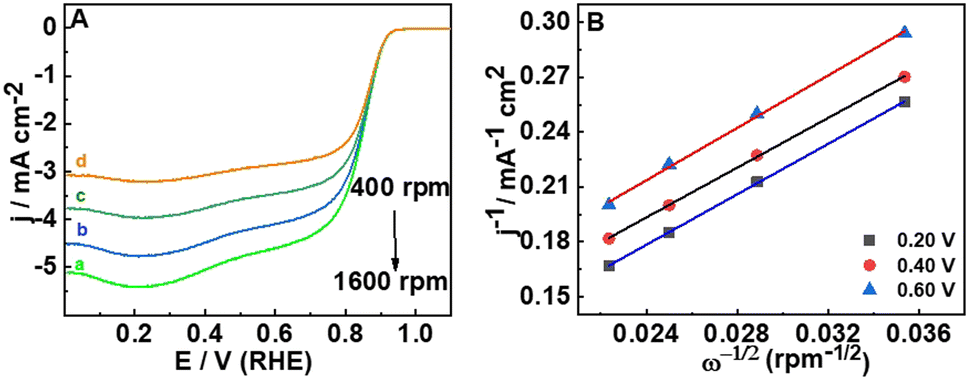 | ||
| Fig. 3 LSV curves of FePc@B-RGO (A) and the resultant Koutecky–Levich (K–L) plots at different potentials (B) at different rotation rates (1600, 1200, 800, and 400 rpm, a–d, respectively). Scan rate: 5 mV s−1. | ||
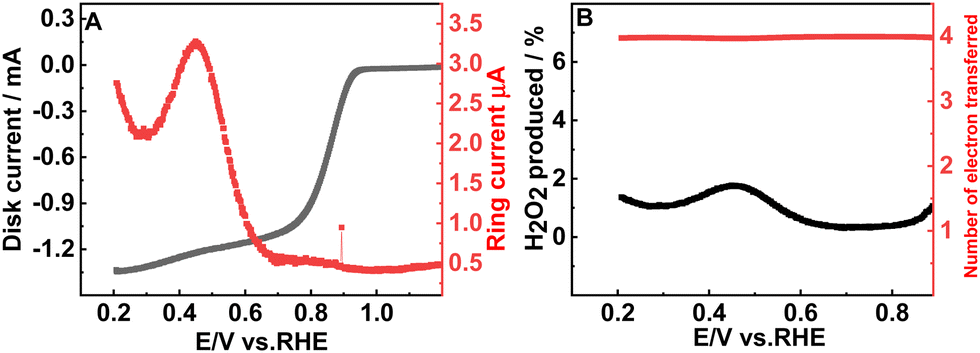 | ||
| Fig. 4 (A) LSV response of FePc@B-RGO showing a disc current in the potential window of 0.2 to 1.2 V vs. RHE and ring current at an applied potential of 1.5 V vs. RHE. (B) Plot showing the percentage of H2O2 formed and the number of electrons transferred during the ORR in 0.1 M KOH. Scan rate: 5 mV s−1 and rotation rate: 1600 rpm. | ||
Such a high ORR activity and selectivity have been reported theoretically16 and to the best of our knowledge, this is the first report where it is being demonstrated experimentally. Table S1 (ESI†) compares the Eonset values obtained for different materials, which clearly demonstrates the superiority of the FePc@B-RGO over the other materials. The methanol tolerance study was done by measuring the LSV curves before and after methanol addition. FePc@B-RGO shows negligible change in the onset potential and current density after the addition of methanol; however, Pt/C shows a decreased current density and oxidizes methanol showing poor tolerance towards methanol (ESI,† Fig. S7A). The electrocatalyst durability test is also important to evaluate the performance of the catalyst. In this work, the durability of the material is checked by chronoamperometry. A potential of −0.5 V vs. SCE was applied for 7200 s in oxygen saturated 0.1 M KOH under the static condition (ESI,† Fig. S7B). In another stability test, accelerated durability testing (ADT) was done. In this test, the LSV curves were recorded (Fig. S8C, ESI†) before and after subjecting the FePc@B-RGO catalyst to 10![[thin space (1/6-em)]](https://www.rsc.org/images/entities/char_2009.gif) 000 CV cycles between 0.6 and 1.0 V vs. RHE (Fig. S8A and B, ESI†). Remarkably, in both stability tests (ESI,† Fig. S7B and S8C), a negligible change in the current density values was observed indicating the high durability of FePc@B-RGO for the ORR.
000 CV cycles between 0.6 and 1.0 V vs. RHE (Fig. S8A and B, ESI†). Remarkably, in both stability tests (ESI,† Fig. S7B and S8C), a negligible change in the current density values was observed indicating the high durability of FePc@B-RGO for the ORR.
Conclusion
In summary, B-RGO is synthesized by the hydrothermal method and FePc is immobilized onto it and the resulting material, FePc@B-RGO is elaborately characterized. The catalytic efficiency of FePc@B-RGO towards the ORR is studied in alkaline medium. Boron doping on reduced graphene oxide not only increases the active sites, but also changes the electronic structure of the immobilized FePc, which alters the intermediate O–O bond and improves the composite's selectivity towards the four-electron reduction of oxygen process. FePc@B-RGO shows high methanol tolerance and high durability also. The onset potential and current density are nearly similar to the benchmark catalyst, Pt/C. Therefore, FePc@B-RGO can be used as a cathode material in fuel cells.Conflicts of interest
All authors declare no conflict of interest.Acknowledgements
Financial support from SERB, India (CRG/2022/003370) and IoE, BHU (incentive grant, scheme number 6031) is appreciatively acknowledged. VR thanks the CSIR, India for the junior and senior research fellowships (JRF and SRF, 09/013(0950)/2020-EMR-I). We thank Mr Vaibhav Verma, Naval Materials Research Laboratory, Ambernath, India for useful suggestions related to BET analysis.Notes and references
- Q. Lenne, M. Retout, B. Gosselin, G. Bruylants, I. Jabin, J. Hamon, C. Lagrost and Y. R. Leroux, Chem. Commun., 2022, 58, 3334–3337 RSC.
- S. Singh, A. Shrivastava, D. K. Singh, M. Yadav, V. Singh, V. Rathour, A. Tiwari, I. Sinha and V. Ganesan, Int. J. Hydrogen Energy, 2024, 56, 188–198 CrossRef CAS.
- C. W. B. Bezerra, L. Zhang, K. Lee, H. Liu, A. L. B. Marques, E. P. Marques, H. Wang and J. Zhang, Electrochim. Acta, 2008, 53, 4937–4951 CrossRef CAS.
- A. Sarapuu, E. Kibena-Põldsepp, M. Borghei and K. Tammeveski, J. Mater. Chem. A, 2018, 6, 776–804 RSC.
- M. M. Hossen, M. S. Hasan, M. R. I. Sardar, J. Bin Haider, Mottakin, K. Tammeveski and P. Atanassov, Appl. Catal., B, 2023, 325, 1–14 CrossRef.
- A. Sarapuu, J. Lilloja, S. Akula, J. H. Zagal, S. Specchia and K. Tammeveski, ChemCatChem, 2023, 15, e202300849 CrossRef CAS.
- E. S. F. Cardoso, G. V. Fortunato, I. Palm, E. Kibena-Põldsepp, A. S. Greco, J. L. R. Júnior, A. Kikas, M. Merisalu, V. Kisand, V. Sammelselg, K. Tammeveski and G. Maia, Electrochim. Acta, 2020, 344, 136052 CrossRef CAS.
- X. Xu, X. Yan, Z. Zhong, L. Kang and J. Yao, Carbon N. Y., 2019, 145, 311–320 CrossRef CAS.
- Y. Dong, Y. Deng, J. Zeng, H. Song and S. Liao, J. Mater. Chem. A, 2017, 5, 5829–5837 RSC.
- R. Sibul, E. Kibena-Põldsepp, U. Mäeorg, M. Merisalu, A. Kikas, V. Kisand, A. Treshchalov, V. Sammelselg and K. Tammeveski, Electrochem. Commun., 2019, 109, 106603 CrossRef CAS.
- J. Woo, J. S. Lim, J. H. Kim and S. H. Joo, Chem. Commun., 2021, 57, 7350–7361 RSC.
- L. Yang, S. Jiang, Y. Zhao, L. Zhu, S. Chen, X. Wang, Q. Wu, J. Ma, Y. Ma and Z. Hu, Angew. Chem., Int. Ed., 2011, 50, 7132–7135 CrossRef CAS PubMed.
- J. S. Park and D. W. Chang, Energies, 2020, 13, 4073 CrossRef CAS.
- Y. Jiang, Y. Lu, X. Lv, D. Han, Q. Zhang, L. Niu and W. Chen, ACS Catal., 2013, 3, 1263–1271 CrossRef CAS.
- I. Kruusenberg, J. Mondal, L. Matisen, V. Sammelselg and K. Tammeveski, Electrochem. Commun., 2013, 33, 18–22 CrossRef CAS.
- N. Helsel and P. Choudhury, J. Phys. Chem. C, 2022, 126, 4458–4471 CrossRef CAS.
- V. Panwar, A. Chattree and K. Pal, Phys. E, 2015, 73, 235–241 CrossRef CAS.
- S. Wang and X. L. Song, Dyes Pigm., 2021, 189, 109254 CrossRef CAS.
- V. Thirumal, A. Pandurangan, R. Jayavel and R. Ilangovan, Synth. Met., 2016, 220, 524–532 CrossRef CAS.
- G. Wang, X. Li, Y. Wang, Z. Zheng, Z. Dai, X. Qi, L. Liu, Z. Cheng, Z. Xu, P. Tan and Z. Zhang, J. Phys. Chem. C, 2017, 121, 26034–26043 CrossRef CAS.
- L. Feng, Z. Qin, Y. Huang, K. Peng, F. Wang, Y. Yan and Y. Chen, Sci. Total Environ., 2020, 698, 134239 CrossRef CAS PubMed.
- V. Sharma, Y. Jain, M. Kumari, R. Gupta, S. K. Sharma and K. Sachdev, Macromol. Symp., 2017, 376, 1–5 Search PubMed.
- M. A. Nasseri, A. Allahresani and H. Raissi, RSC Adv., 2014, 4, 26087–26093 RSC.
- T. F. Emiru and D. W. Ayele, Egypt. J. Basic Appl. Sci., 2017, 4, 74–79 Search PubMed.
- A. Bäcker, Y. Li, M. Fritz, M. Grätz, Z. Ke and R. Langer, ACS Catal., 2019, 9, 7300–7309 CrossRef.
- A. Koshevarnikov and J. A. Majewski, arXiv, 2022, preprint, arXiv:2210.01025 DOI:10.48550/arXiv.2210.01025.
- U. Chasanah, W. Trisunaryanti, Triyono, H. S. Oktaviano, I. Santoso and D. A. Fatmawati, Commun. Sci. Technol., 2022, 7, 103–111 CrossRef.
- V. Verma, S. R. Choudhury, V. Rathour, S. R. Choudhury and V. Ganesan, Microporous Mesoporous Mater., 2024, 367, 113005 CrossRef CAS.
- V. Paranthaman, K. Sundaramoorthy, B. Chandra, S. P. Muthu, P. Alagarsamy and R. Perumalsamy, Phys. Status Solidi A, 2018, 215, 1–9 Search PubMed.
- T. K. Shruthi, M. S. Kumar, M. Arjunan, A. Pratap and N. Chandrasekaran, RSC Adv., 2015, 5, 93423–93432 RSC.
- K. Rhili, S. Chergui, J. C. Abergo-Martinez, A. S. El Douhaibi and M. Siaj, Mater. Adv., 2023, 4, 5263–5272 RSC.
- D. K. Singh, M. Natchimuthu Karuppusamy, A. Shrivastava, T. Palanisamy, I. Sinha and V. Ganesan, ACS Catal., 2023, 4155–4167 CrossRef CAS.
- P. H. van Langevelde, E. Kounalis, L. Killian, E. C. Monkcom, D. L. J. Broere and D. G. H. Hetterscheid, ACS Catal., 2023, 13, 5712–5722 CrossRef CAS PubMed.
- A. Alsudairi, J. Li, N. Ramaswamy, S. Mukerjee, K. M. Abraham and Q. Jia, J. Phys. Chem. Lett., 2017, 8, 2881–2886 CrossRef CAS PubMed.
- H. Guo, Q. Feng, J. Zhu, J. Xu, Q. Li, S. Liu, K. Xu, C. Zhang and T. Liu, J. Mater. Chem. A, 2019, 7, 3664–3672 RSC.
- N. Komba, G. Zhang, Q. Wei, X. Yang, J. Prakash, R. Chenitz, F. Rosei and S. Sun, Int. J. Hydrogen Energy, 2019, 44, 18103–18114 CrossRef CAS.
- R. Nandan, O. Y. Bisen and K. K. Nanda, J. Phys. Chem. C, 2021, 125, 10378–10385 CrossRef CAS.
- D. K. Singh, V. Ganesan, D. K. Yadav and M. Yadav, Langmuir, 2020, 36, 12202–12212 CrossRef CAS PubMed.
- V. Singh, P. S. Thakur, V. Ganesan and M. Sankar, J. Electroanal. Chem., 2022, 919, 116536 CrossRef CAS.
- X. Zhang, Y. Ke, T. Wang, J. Cai, Q. Huang and S. Lin, Catalysts, 2022, 12(3), 259 CrossRef CAS.
Footnote |
| † Electronic supplementary information (ESI) available: Figures, table, and text as mentioned. See DOI: https://doi.org/10.1039/d3ma00975k |
| This journal is © The Royal Society of Chemistry 2024 |