 Open Access Article
Sulfur-regulated metal–support interaction boosting the hydrogen evolution performance of Ru clusters in seawater at industrial current densities†
Ranran
Tang‡
a,
Ping
Yan‡
 b,
Yitong
Zhou
*a and
Xin-Yao
Yu
 *b
*b
aInstitutes of Physical Science and Information Technology, Anhui University, Hefei 230601, P. R. China. E-mail: zhouyt@ahu.edu.cn
bSchool of Materials Science and Engineering, Anhui University, Hefei 230601, P. R. China. E-mail: yuxinyao@ahu.edu.cn
First published on 24th May 2024
Abstract
Regulating the metal–support interaction (MSI) is an effective strategy to enhance the catalytic activity of electrocatalysts. Herein, taking Ru clusters as an example, we report a hybrid electrocatalyst with ultrafine Ru nanoclusters anchored on sulfur and nitrogen co-doped carbon (Ru/SNC) hollow spheres for efficient hydrogen evolution reaction (HER) in an alkaline electrolyte and real seawater. The optimal Ru/SNC hollow spheres on a glassy carbon electrode exhibit superior HER activity, with small overpotentials of only 12 and 30 mV to reach 10 mA cm−2 in alkaline media and alkaline real seawater, respectively. When loaded on carbon paper, the Ru/SNC hollow spheres only need small overpotentials of 171 (in alkaline solution) and 205 mV (in alkaline real seawater) to deliver an industrial current density of 1000 mA cm−2. Furthermore, the assembled Ru/SNC||RuO2 electrolysis cell displays a high current density of 1000 mA cm−2 at a cell voltage of 2.3 V and impressive stability up to 100 h at a current density of 1000 mA cm−2 in alkaline real seawater at an elevated temperature of 80 °C. Density functional theory (DFT) calculations suggest that S-doping can induce a strong MSI between Ru clusters and the carbon support to boost the HER activity and stability. S-doping triggers the downshift of the d-band center, weakening the adsorption of H* on Ru clusters and thereby enhancing the hydrogen spillover.
Broader contextElectrocatalytic water splitting (EWS) is a promising way to produce green hydrogen. However, most of the reported EWS systems use pure water as the hydrogen source. Seawater, as a green, cheap, and abundant water resource, is expected to replace pure water in the field of EWS. Unfortunately, due to the complex composition of natural seawater, it is still a great challenge to develop highly active and durable electrocatalysts for the hydrogen evolution reaction (HER) at industrial current densities. In this study, we develop a S-doping strategy to modulate the metal–support interaction (MSI) between Ru nanoclusters and the carbon support to boost the HER performance of Ru nanoclusters in real seawater at high current densities. This work provides new insights into the design of effective HER electrocatalysts for seawater splitting through the manipulation of the MSI. |
Introduction
Regulating the metal–support interaction (MSI) is an important means to achieve the activity, stability, and selectivity control of supported metal catalysts.1,2 The support material can optimize the electronic structure of the metal through strong MSI. For example, Lu et al. reported that oxygen vacancy-enriched TiO2 can effectively reverse charge transfer and enhance the hydrogen spillover of the anchored platinum nanoclusters, leading to promoted hydrogen evolution reaction (HER) activity.3 Han et al. found that Ti vacancy clusters in Ti3C2Tx (Ti3C2Tx-Vc) create a unique lattice carbon ligand environment toward Ru species, inducing ultra-strong MSI between Ru clusters and Ti3C2Tx. Ru@Ti3C2Tx-Vc exhibits the optimized balance of H2O adsorption/dissociation and OH/H desorption, thereby delivering enhanced alkaline HER performance.4 Therefore, the structure regulation of the support is an effective approach to improve the electrocatalytic performance of metal catalysts.Recently, many high-performance electrocatalysts containing platinum-group elements have been developed for the HER.5–11 Owing to the inherent high activity, similar hydrogen adsorption free energy to Pt, and relatively low price to Pt (about one-third the price of Pt), Ru-based catalysts have been widely investigated for hydrogen production.12–15 To improve the utilization and activity, the particle size of Ru is usually reduced to nanoparticles, nanoclusters, and even single atoms.16–18 However, when the particle size is reduced to the nanoscale, the electronic and geometrical structure of the metal particles will be quite different from those of bulk-phase metals and change significantly with the particle size, which is the so-called size effect.19,20 Taking Ru as a typical example, the adsorption of hydrogen on Ru exhibits a certain dependence on the size of Ru.21,22 Unlike bulk Ru, the adsorption of hydrogen on Ru nanoclusters is too strong, resulting in poor HER activity. To improve the HER performance of Ru clusters, various supports have been developed such as carbon nanomaterials,23,24 metal carbides,25 metal oxides,26 metal hydroxides27 and so on to regulate the electronic structure of Ru clusters. Despite great achievements, Ru-cluster based HER catalysts are rarely evaluated in real seawater at high current densities. Using earth-abundant seawater as the feedstock is crucial to decrease the cost of water splitting.28–30 Unfortunately, due to the complex environments of seawater, it is still a great challenge to develop highly active and durable HER catalysts which can work in real seawater at industrial scale current densities.
In this work, an intriguing S-doping strategy is developed to regulate the MSI between Ru clusters and the carbon support, thus improving the HER performance of Ru clusters. Ru cluster-anchored S, N co-doped carbon (Ru/SNC) hollow spheres are designed and prepared using a template method. Benefiting from the hollow structure and modulated MSI, the optimal Ru/SNC hollow spheres exhibit outstanding HER activity and stability in alkaline electrolyte and alkaline real seawater at high current densities. The origin for the enhanced HER performance is elaborately illustrated by in situ characterizations and density functional theory (DFT) calculations.
Results and discussion
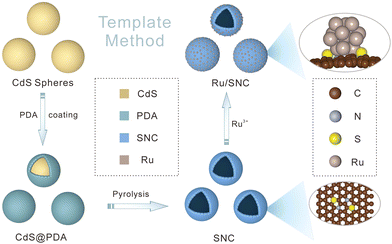
The preparation process of Ru/SNC hollow spheres is illustrated in Fig. 1.31 Firstly, CdS spheres are prepared by a facile solvothermal method. Subsequently, a polydopamine (PDA) layer is coated on the surface of the CdS spheres to obtain core–shell structured CdS@PDA spheres.32 Then, the CdS@PDA spheres are converted to S, N co-doped carbon (SNC) hollow spheres through a high-temperature pyrolysis process, during which the CdS spheres decompose and the PDA coating layer is simultaneously converted to N-doped carbon. The decomposition of CdS spheres results in the doping of sulfur into the PDA-derived N-doped carbon. Finally, Ru clusters are decorated on the surface of the SNC hollow spheres by a spontaneous redox reaction in RuCl3·xH2O solution.The X-ray diffraction (XRD) and scanning electron microscopy (SEM) results confirm the successful synthesis of CdS spheres (Fig. S1, ESI†). The average size of the as-synthesized CdS spheres is around 420 nm. After PDA coating, a uniform coating layer with a thickness of about 25 nm can be clearly seen on the surface of the CdS spheres (Fig. S2, ESI†). After pyrolysis, the core–shell structured CdS@PDA spheres are transformed into amorphous SNC hollow spheres with an average size of about 400 nm (Fig. S3a–c, ESI†).33 The energy dispersive spectroscopy (EDS) elemental mapping images demonstrate the successful co-doping of sulfur and nitrogen into carbon (Fig. S3d, ESI†), while negligible Cd element is maintained. The existence of typical defect (D) and graphitic (G) bands in the Raman spectrum of SNC spheres further verifies the formation of carbon (Fig. S4a, ESI†). The introduction of S and N elements into the carbon substrate is also validated by the X-ray photoelectron spectroscopy (XPS) measurement (Fig. S4b–e, ESI†).
After reaction with RuCl3, the amorphous carbon structure of SNC spheres is maintained (Fig. S5a, ESI†). The absence of characteristic peaks of Ru may be attributed to the small size of Ru particles.34,35 The morphology and microstructure of the final product are observed by SEM, transmission electron microscopy (TEM), high-resolution TEM (HRTEM), and aberration corrected high-angle annular dark-field scanning transmission electron microscopy (AC-HAADF-STEM). As illustrated in Fig. 2a–c, the hollow structure of the SNC spheres is well retained. HRTEM and AC-HAADF-STEM images reveal that ultrafine clusters with a size of ∼1.5 nm are densely anchored on the surface of the SNC spheres (Fig. 2d and e). The clear lattice fringes with a calculated distance of 0.22 nm can be attributed to the (002) plane of metallic Ru (Fig. 2f). Therefore, the final product is denoted as Ru/SNC spheres. The HAADF-STEM elemental mapping images of an individual Ru/SNC sphere in Fig. 2g show that the C, N, S, and Ru elements are uniformly distributed on the whole Ru/SNC sphere. Based on the thermogravimetric analysis (TGA) and element analysis (EA) results, the Ru, N, and S contents in Ru/SNC spheres are approximately determined to be 18.1 wt%, 1.98 wt%, and 4.53 wt%, respectively (Fig. S5b and Table S1, ESI†). In order to elucidate the role of sulfur in Ru/SNC spheres, Ru-decorated N-doped carbon (denoted as Ru/NC) hollow spheres with a similar Ru loading are synthesized by using SiO2 spheres as templates (Fig. S6 and S7, ESI†).
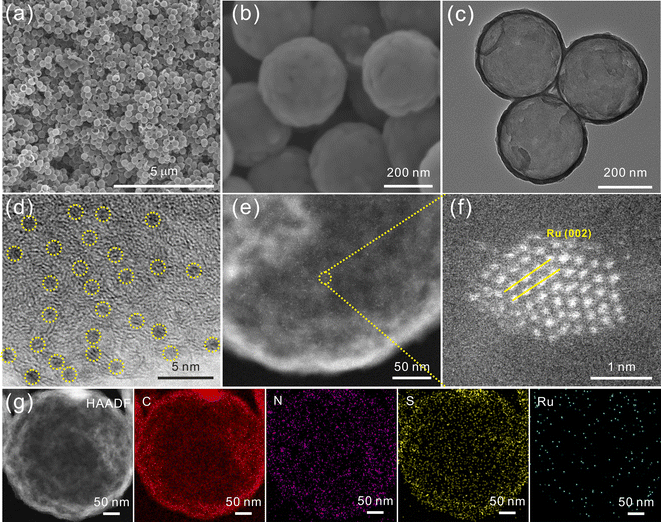 | ||
| Fig. 2 (a) and (b) SEM images, (c) TEM image, (d) HRTEM image, (e) and (f) AC-HAADF-STEM images, and (g) HAADF-STEM image and the corresponding elemental mapping images of Ru/SNC spheres. | ||
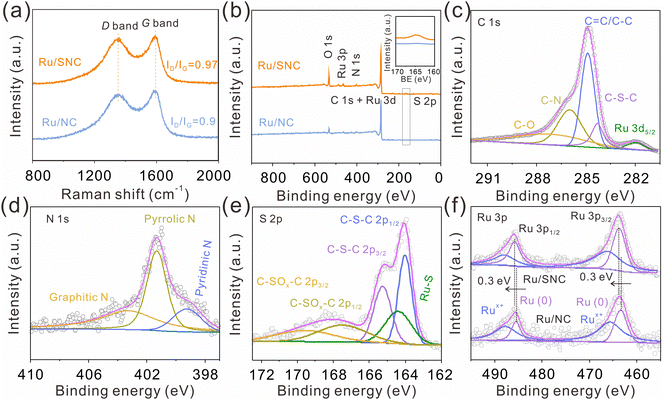
As displayed in the Raman spectra (Fig. 3a), the ID/IG intensity ratio of the Ru/SNC spheres (0.97) is higher than that of Ru/NC spheres (0.9), suggesting the formation of more disordered carbon structures by the introduction of sulfur. X-ray photoelectron spectrometer (XPS) is then used to investigate the elemental composition and valence state of the samples. The XPS survey spectra disclose the co-existence of C, N, and Ru elements in both Ru/SNC and Ru/NC spheres (Fig. 3b), while the S element can only be observed in the Ru/SNC spheres. Compared with the high-resolution C 1s XPS spectra of Ru/NC spheres (Fig. S8a, ESI†), the C 1s XPS spectra of the Ru/SNC spheres exhibit an additional C–S–C peak in addition to C–O, C–N, C![[double bond, length as m-dash]](https://www.rsc.org/images/entities/char_e001.gif) C/C–C, and Ru 3d5/2 peaks (Fig. 3c),36 further demonstrating the successful doping of S into the carbon matrix. In the N 1s XPS spectra of both Ru/SNC and Ru/NC spheres, the typical peaks at 403.36, 401.3, and 399.3 eV can be attributed to graphitic N, pyrrolic N, and pyridinic N, respectively (Fig. 3d and Fig. S8b, ESI†).37,38 As illustrated in the S 2p XPS spectra of Ru/SNC spheres (Fig. 3e), two peaks with binding energies of 164 and 165.2 eV are assigned to C–S–C 2p1/2 and C–S–C 2p3/2, respectively, in agreement with the C 1s spectra. The peak located at 164.4 eV can be attributed to the Ru–S bond, determined to occupy 18.8% of the total S element.39 The formation of the Ru–S bond is probably to modulate the MSI between Ru clusters and the carbon support as well as to improve the stability of Ru clusters during the HER. The other two peaks at 167.5 and 169.9 eV match with C–SOx–C 2p1/2 and C–SOx–C 2p3/2, the generation of which may be due to oxidation during preparation and storage.40 The peaks at 485.9 and 463.7 eV in the Ru 3p XPS spectra (Fig. 3f) suggest that the Ru element in the Ru/SNC spheres mainly exists in the form of metallic ruthenium.41,42 In comparison to Ru/NC spheres, the peaks of Ru0 in the Ru 3p XPS spectra of Ru/SNC spheres exhibit a positive shift, indicating that S-doping can effectively tune the MSI between Ru clusters and the carbon substrate (Fig. 3f).
C/C–C, and Ru 3d5/2 peaks (Fig. 3c),36 further demonstrating the successful doping of S into the carbon matrix. In the N 1s XPS spectra of both Ru/SNC and Ru/NC spheres, the typical peaks at 403.36, 401.3, and 399.3 eV can be attributed to graphitic N, pyrrolic N, and pyridinic N, respectively (Fig. 3d and Fig. S8b, ESI†).37,38 As illustrated in the S 2p XPS spectra of Ru/SNC spheres (Fig. 3e), two peaks with binding energies of 164 and 165.2 eV are assigned to C–S–C 2p1/2 and C–S–C 2p3/2, respectively, in agreement with the C 1s spectra. The peak located at 164.4 eV can be attributed to the Ru–S bond, determined to occupy 18.8% of the total S element.39 The formation of the Ru–S bond is probably to modulate the MSI between Ru clusters and the carbon support as well as to improve the stability of Ru clusters during the HER. The other two peaks at 167.5 and 169.9 eV match with C–SOx–C 2p1/2 and C–SOx–C 2p3/2, the generation of which may be due to oxidation during preparation and storage.40 The peaks at 485.9 and 463.7 eV in the Ru 3p XPS spectra (Fig. 3f) suggest that the Ru element in the Ru/SNC spheres mainly exists in the form of metallic ruthenium.41,42 In comparison to Ru/NC spheres, the peaks of Ru0 in the Ru 3p XPS spectra of Ru/SNC spheres exhibit a positive shift, indicating that S-doping can effectively tune the MSI between Ru clusters and the carbon substrate (Fig. 3f).
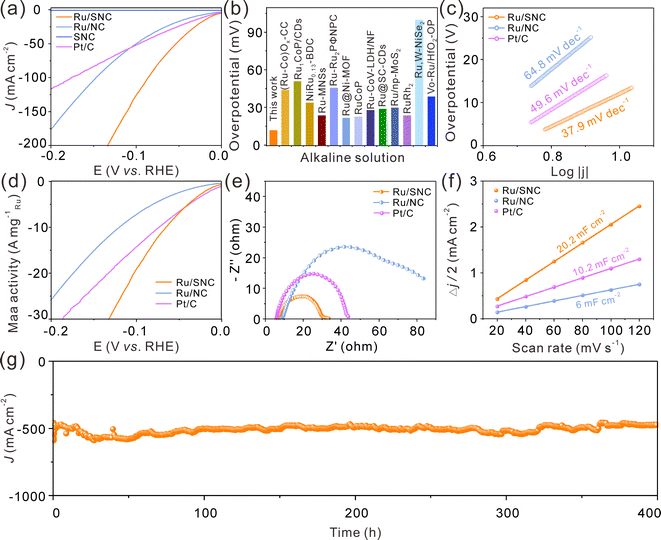
The electrocatalytic HER performance of the Ru/SNC spheres is then investigated in 1.0 M KOH with SNC spheres, Ru/NC spheres, and commercial Pt/C catalyst as references. The glassy carbon electrode-loaded powder catalysts are employed as the working electrode. The iR-compensated linear scanning voltammogram (LSV) curves of these four samples are displayed in Fig. 4a. Obviously, the SNC spheres are inactive for the HER, whereas the Ru/SNC spheres only require an ultra-small overpotential of 12 mV to reach a current density of 10 mA cm−2, suggesting that the Ru clusters are the main active sites for the HER. Such an overpotential of Ru/SNC spheres is much lower than that of Ru/NC spheres (31.7 mV), strongly verifying the positive role of S-doping in promoting the HER activity. Impressively, the activity of Ru/SNC spheres is also superior to that of commercial Pt/C catalyst and most of the reported Ru-based HER catalysts (Fig. 4a and b and Table S2, ESI†). In addition, Fig. 4c shows that the Ru/SNC spheres exhibit a lower Tafel slope of 37.9 mV dec−1 than Ru/NC spheres (64.8 mV dec−1) and commercial Pt/C (49.6 mV dec−1), suggesting that Ru/SNC spheres offer a faster reaction kinetics. Moreover, the HER mass activity of Ru/SNC spheres at an overpotential of 100 mV is as high as 19.44 A mg−1Ru which is higher than that of Ru/NC spheres (7.35 A mg−1Ru) and the commercial Pt/C catalyst (14.42 A mg−1Pt), respectively (Fig. 4d).
To evaluate the interfacial charge transfer kinetics, electrochemical impedance spectroscopy (EIS) is recorded at a potential of −0.96 V vs. RHE (Fig. 4e). The Ru/SNC spheres demonstrate a relatively small semicircle in the mid-frequency region among all the contrast samples, disclosing that Ru/SNC spheres display a faster charge transfer rate at the electrocatalyst/electrolyte interface. The double layer capacitance (Cdl) is then used to assess the electrochemical specific area (ECSA) of different catalysts (Fig. 4f and Fig. S9, ESI†). Among the tested catalysts, the Ru/SNC spheres exhibit the largest Cdl of 20.2 mF cm−2, indicating that more electrochemically active sites are exposed by Ru/SNC spheres. Additionally, the ECSA-normalized polarization curves and turn over frequency (TOF) curves confirm that Ru/SNC spheres display higher intrinsic activity than Ru/NC spheres and the commercial Pt/C catalyst (Fig. S10, ESI†). During the HER process, the Faradaic efficiency (FE) value of Ru/SNC spheres exceeds 98% at a current density of 30 mA cm−2 (Fig. S11, ESI†), suggesting that nearly all of the electrons are utilized for the HER. We also investigate the effects of Ru loading and S-doping amount on the HER activity (Fig. S12–16, ESI†). The Ru loading and S-doping amount are optimized to 18.1 wt% and 4.53 wt%, respectively.
In addition to high activity, the Ru/SNC spheres also present long-term catalytic stability. The catalytic stability of the Ru/SNC catalyst is evaluated by both chronoamperometry and chronopotentiometry measurements. At an overpotential of 12 mV, corresponding to a current density of about 10 mA cm−2, the Ru/SNC spheres can stably catalyze the HER up to 500 h (Fig. S17, ESI†). Even at an industrial scale current density of 500 mA cm−2, the Ru/SNC spheres still demonstrate excellent stability without significant activity degradation during 400 h of operation (Fig. 4g), unveiling the practical application of Ru/SNC spheres. After the long-term durability test, the microstructure and chemical composition of Ru/SNC spheres are well maintained, verifying the favorable structural stability of the Ru/SNC spheres (Fig. S18 and S19, ESI†).
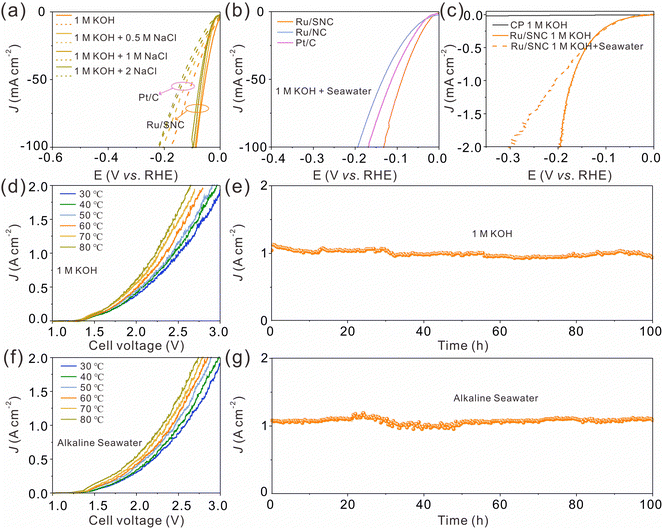
Next, the HER activity of the catalysts in alkaline simulated seawater and real seawater was assessed.43Fig. 5a shows the LSV curves of the Ru/SNC spheres and the commercial Pt/C catalyst in different alkaline NaCl solutions with concentrations ranging from 0.5 to 2 M. In all NaCl solutions, the HER activity of the Ru/SNC spheres is higher than that of the Pt/C catalyst. With the increase of NaCl concentrations, the catalytic activity decay of the Ru/SNC spheres is not significant, whereas the catalytic activity of Pt/C declines rapidly. Impressively, in real seawater, the Ru/SNC spheres still exhibit higher HER activity than Ru/NC spheres and the Pt/C catalyst (Fig. 5b). To deliver 10 mA cm−2, the Ru/SNC spheres only require a small overpotential of 30 mV. Faster HER reaction kinetics is also demonstrated by Ru/SNC spheres with a small Tafel slope of 41.5 mV dec−1 (Fig. S20a, ESI†). When coated on carbon paper (CP), the Ru/SNC spheres present remarkable activity at industrial current densities in both alkaline solution and alkaline real seawater (Fig. 5c).13,43 Small overpotentials of only 171 and 205 mV are needed for Ru/SNC spheres to reach 1000 mA cm−2 in alkaline media and alkaline real seawater, respectively. Moreover, the Ru/SNC spheres also show outstanding HER stability in alkaline real seawater at 1000 mA cm−2 for 100 h (Fig. S20b, ESI†).
In view of the high HER activity of Ru/SNC spheres, a water electrolyzer is assembled based on Ru/SNC spheres and the commercial oxygen evolution catalyst (RuO2). A Pt/C-based electrolyzer is also fabricated for comparison. In order to reduce the applied voltage for overall water splitting, the operating temperature in industrial water splitting systems typically ranges from 50 to 80 °C.44–46 Therefore, the performance of the electrolyzer in this work is evaluated at 30–80 °C. As can be seen, the voltage required to achieve the same current density decreases with the increase of the electrolyte temperature for both Ru/SNC||RuO2 and Pt/C||RuO2 electrolyzers (Fig. 5d and f and Fig. S21, ESI†). When operating in the alkaline electrolyte, to reach 1000 mA cm−2, the Ru/SNC||RuO2 electrolysis cell only needs voltages of 2.34, 2.28, and 2.23 V at temperatures of 60, 70, and 80 °C (Fig. 5d), respectively. In contrast, much larger voltages of 2.63, 2.57, and 2.54 V are required by the Pt/C||RuO2 electrolyzer to deliver the same current density at the corresponding temperatures (Fig. S21a, ESI†). The performance of the Ru/SNC||RuO2 electrolyzer is also better than that of the Pt/C||RuO2 electrolyzer in alkaline real seawater at all tested temperatures (Fig. 5f and Fig. S21b, ESI†). To be specific, at a current density of 1000 mA cm−2 and a temperature of 80 °C, the applied voltage of the Ru/SNC||RuO2 electrolysis cell is only 2.3 V, while a higher voltage of 2.62 V is needed for Pt/C||RuO2, disclosing the real application potential of Ru/SNC spheres. Moreover, the Ru/SNC||RuO2 electrolyzer also exhibits good stability. As shown in Fig. 5e and g, the current density of the electrolyzer can be stabilized at 1000 mA cm−2 for 100 h at a temperature of 80 °C in both alkaline solution and alkaline real seawater. Therefore, the Ru/SNC spheres are very promising for large-scale hydrogen production.
In situ Raman, in situ EIS, and deuterium kinetic isotopic effect (KIE) measurements are then performed to illustrate the reason for the superior alkaline HER activity of Ru/SNC spheres. The broad peak at ∼3400 cm−1 in the in situ Raman data for Ru/SNC and Ru/NC spheres can be assigned to the interfacial water (Fig. S22, ESI†).47 Obviously, the intensity of the interfacial water peak decreases with the increase of overpotential for both Ru/SNC and Ru/NC spheres. However, the peak intensity of the Ru/SNC spheres decreases much faster than that of Ru/NC spheres, demonstrating that water is rapidly consumed on the surface of the Ru/SNC spheres. In situ EIS tests were carried out to differentiate the basic elementary reactions in the HER.48 The Ru/SNC spheres display only one phase angle associated with the Volmer–Tafel mechanism, whereas the Ru/NC spheres exhibit two phase angles, corresponding to the Volmer–Heyrovsky mechanism (Fig. S22, ESI†). Compared to Ru/NC spheres, the phase angles of Ru/SNC spheres in the middle-frequency region decrease more rapidly with the increase of overpotential, suggesting the accelerated kinetics of the Volmer step (water dissociation) on Ru/SNC spheres.49 The deuterium KIE tests are used to examine the proton transfer kinetics during water dissociation (Fig. S22, ESI†). The average KIE value of the Ru/SNC spheres is calculated to be 2.16 which is lower than that of Ru/NC spheres (4.43), also revealing the promoted kinetics of water dissociation on the Ru/SNC spheres.50
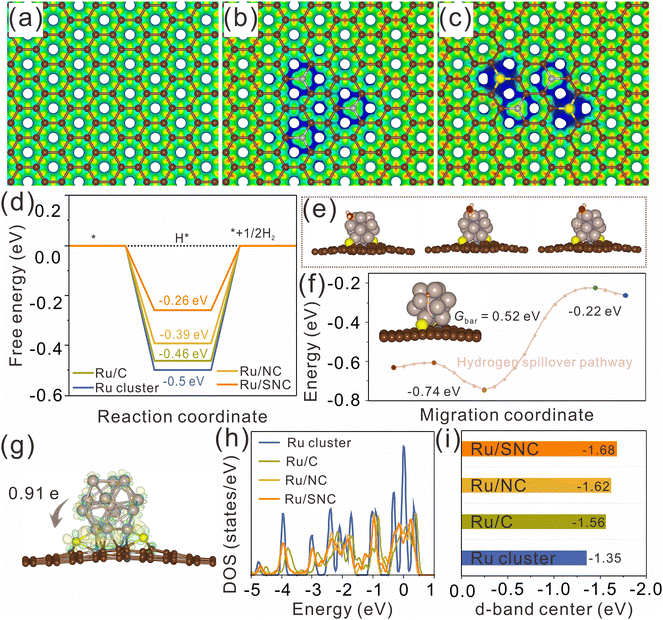
DFT calculations were further performed to clarify the effect of S-doping on the MSI and the enhanced HER activity. The atomic structures of pure carbon (C), N-doped carbon (NC), and S, N co-doped carbon (SNC) are first constructed and optimized using graphene nanosheets as models (Fig. S23, ESI†). The electrostatic potentials of the optimized atomic models for C, NC, and SNC are further calculated (Fig. 6a–c). It can be clearly observed that both N-doping and S, N co-doping can effectively tune the electrostatic potential of the carbon support (the blue region represents the place where the electrostatic potential is low). The blue region in SNC is larger than that in NC, revealing that the electrostatic potential in SNC is lower than that in NC. The decrease of the electrostatic potential in the doped region is expected to promote the charge transfer from Ru clusters to the carbon support and then adjust the H* adsorption energy on Ru. The Ru clusters with 13 Ru atoms are selected to construct the atomic models of Ru/C, Ru/NC, and Ru/SNC (Fig. S24, ESI†). The geometric configurations of H* adsorption on Ru clusters, Ru/C, Ru/NC, and Ru/SNC are also constructed (Fig. S25a, ESI†). The H* adsorption site of Ru/SNC is the Ru atom near the Ru–S bond. As can be seen from Fig. 6d, Ru clusters exhibit the highest H* adsorption free energy (ΔGH*) value (−0.5 eV), indicating that Ru clusters are not conducive to hydrogen release. The ΔGH* value of Ru/NC is −0.39 eV, lower than that of Ru/C (−0.46 eV), disclosing the role of N-doping in decreasing the hydrogen adsorption energy. After S-doping, the ΔGH* value of Ru/SNC is further decreased to −0.26 eV. Therefore, compared to Ru clusters, Ru/C, and Ru/NC, the Ru/SNC presents the highest HER activity.
Our calculation results reveal that water adsorption is unstable on the side surface of Ru clusters but stable on the upper surface of Ru clusters. Consequently, the upper surface of the Ru cluster serves as the site for water adsorption and dissociation (Fig. 6e). Compared with Ru/NC (0.70 eV), Ru/C (0.71 eV), and Ru clusters (0.73 eV), Ru/SNC manifests a relatively low energy barrier value (0.69 eV) for water dissociation (Fig. S25b, ESI†), demonstrating the promoting effect of S-doping on water dissociation kinetics. We postulate that following the adsorption and dissociation of water on the upper surface of the Ru clusters, the adsorbed hydrogen atom migrates from the hydrolytic dissociation site to the hydrogen evolution site via a hydrogen spillover mechanism. The migration pathway of the hydrogen atom on Ru/SNC is computationally determined, as depicted in Fig. 6f. The calculated migration energy barrier (Gbar) of hydrogen is merely 0.52 eV, confirming that hydrogen spillover can occur over Ru/SNC.51
The differential charge density map reveals the electron transfer at the interface between Ru clusters and the carbon support, with charge accumulation observed on the carbon support side (yellow region) and depletion on the Ru cluster side (cyan region). Bader charge analysis (Fig. 6g and Fig. S26, ESI†) shows that Ru clusters in Ru/SNC manifest a higher positive charge (+0.91 e) than those in Ru/C (+0.32 e) and Ru/NC (+0.46 e), suggesting the strong MSI between the Ru clusters and the SNC support.52 It also implies that S-doping can promote the electron transfer from Ru clusters to the carbon support and enhance the stability of the anchored Ru clusters. The density of states (DOS) of Ru clusters, Ru/C, Ru/NC, and Ru/SNC is also calculated (Fig. S27, ESI†). In comparison to Ru clusters, Ru/C, and Ru/NC, the d-band center of Ru/SNC shifts farther away from the Fermi energy level (Fig. 6h). According to d-band center theory, the downshift of the d-band center can weaken the adsorption of H*, thereby facilitating hydrogen spillover and subsequent H2 production.53 In addition, it is found that further increasing the content of S cannot ensure better electronic structure and optimal adsorption energy for hydrogen adsorption (Fig. S28, ESI†). Therefore, an appropriate doping amount of sulfur is necessary.
Conclusions
In summary, we demonstrate an effective S-doping strategy to trigger the strong MSI between Ru clusters and the carbon support for the purpose of enhancing the HER performance of Ru clusters in real seawater at industrial current densities. As a proof-of-concept demonstration, ultrafine Ru cluster-loaded S, N co-doped carbon (Ru/SNC) hollow spheres are synthesized using a template method. Benefiting from the synergistic effect of electronic structure modulation and the advanced morphological structure, the Ru/SNC hollow spheres manifest excellent activity and stability at industrial scale current densities and elevated temperatures in both alkaline solution and real seawater. In situ measurements and theoretical studies demonstrate that S-doping can enhance the interaction between Ru clusters and the carbon support, optimizing the hydrogen adsorption energy and accelerating the water dissociation kinetics, thus ensuring high HER activity and stability.Author contributions
The manuscript was written through contributions of all authors. R. T. and X. Y. Y. conceived and designed the experiments. R. T. performed the preparation of the HER electrocatalysts and a series of data measurements, characterization, and wrote the manuscript. P. Y. characterized part of the materials. Y. Z. supervised and analysed the DFT calculations. X. Y. Y. edited the manuscript and provided resources as a supervisor. All authors agreed to the final version of the manuscript.Conflicts of interest
There are no conflicts to declare.Acknowledgements
This work is supported by the National Natural Science Foundation of China (12075002), the Natural Science Research Project of Universities in Anhui Province (KJ2021A0070 and 2022AH050121), and the China Postdoctoral Science Foundation (2023M730012). The Hefei advanced computing center is acknowledged for DFT calculations.Notes and references
- Z. Luo, G. Zhao, H. Pan and W. Sun, Adv. Energy Mater., 2022, 12, 2201395 CrossRef CAS.
- J. Wang, C. Hu, L. Wang, Y. Yuan, K. Zhu, Q. Zhang, L. Yang, J. Lu and Z. Bai, Adv. Funct. Mater., 2023, 33, 2304277 CrossRef CAS.
- Z. Wei, H. Wang, C. Zhang, K. Xu, X. Lu and T. Lu, Angew. Chem., Int. Ed., 2021, 60, 16622–16627 CrossRef CAS PubMed.
- X. Wang, J. Ding, W. Song, X. Yang, T. Zhang, Z. Huang, H. Wang, X. Han and W. Hu, Adv. Energy Mater., 2023, 13, 2300148 CrossRef CAS.
- J. N. Tiwari, N. K. Dang, S. Sultan, P. Thangavel, H. Y. Jeong and K. S. Kim, Nat. Sustainability, 2020, 3, 556–563 CrossRef.
- J. N. Tiwari, S. Sultan, C. W. Myung, T. Yoon, N. Li, M. Ha, A. M. Harzandi, H. J. Park, D. Y. Kim, S. S. Chandrasekaran, W. G. Lee, V. Vij, H. Kang, T. J. Shin, H. S. Shin, G. Lee, Z. Lee and K. S. Kim, Nat. Energy, 2018, 3, 773–782 CrossRef CAS.
- J. N. Tiwari, A. M. Harzandi, M. Ha, S. Sultan, C. W. Myung, H. J. Park, D. Y. Kim, P. Thangavel, A. N. Singh, P. Sharma, S. S. Chandrasekaran, F. Salehnia, J.-W. Jang, H. S. Shin, Z. Lee and K. S. Kim, Adv. Energy Mater., 2019, 9, 1900931 CrossRef.
- Z. Pu, J. Zhao, I. S. Amiinu, W. Li, M. Wang, D. He and S. Mu, Energy Environ. Sci., 2019, 12, 952–957 RSC.
- H. Jin, M. Ha, M. G. Kim, J. H. Lee and K. S. Kim, Adv. Energy Mater., 2023, 13, 2204213 CrossRef CAS.
- M. Duan, T. Shu, J. Li, D. Zhang, L.-Y. Gan, K. X. Yao and Q. Yuan, Nano Res., 2023, 16, 8836–8844 CrossRef CAS.
- H. Jin, S. Sultan, M. Ha, J. N. Tiwari, M. G. Kim and K. S. Kim, Adv. Funct. Mater., 2020, 30, 2000531 CrossRef CAS.
- G. Meng, H. Tian, L. Peng, Z. Ma, Y. Chen, C. Chen, Z. Chang, X. Cui and J. Shi, Nano Energy, 2021, 80, 105531 CrossRef CAS.
- R. Liu, M. Sun, X. Liu, Z. Lv, X. Yu, J. Wang, Y. Liu, L. Li, X. Feng, W. Yang, B. Huang and B. Wang, Angew. Chem., Int. Ed., 2023, 62, e202312644 CrossRef CAS PubMed.
- R. Tang, Y. Yang, Y. Zhou and X. Y. Yu, Adv. Funct. Mater., 2024, 34, 2301925 CrossRef CAS.
- W. Li, Y. Zhao, Y. Liu, M. Sun, G. I. N. Waterhouse, B. Huang, K. Zhang, T. Zhang and S. Lu, Angew. Chem., Int. Ed., 2021, 60, 3290–3298 CrossRef CAS PubMed.
- P. Yan, T. Yang, M. Lin, Y. Guo, Z. Qi, Q. Luo and X. Y. Yu, Adv. Funct. Mater., 2023, 33, 2301343 CrossRef CAS.
- J. Yu, X. Yong and S. Lu, Energy Environ. Mater., 2024, 7, e12587 CrossRef CAS.
- G. Zhao, J. Chen, W. Sun and H. Pan, Adv. Funct. Mater., 2021, 31, 2010633 CrossRef CAS.
- Y. Kim and D. H. Kim, Appl. Catal., B, 2019, 244, 684–693 CrossRef CAS.
- J. Ma, X. Tan, Q. Zhang, Y. Wang, J. Zhang and L. Wang, ACS Catal., 2021, 11, 3352–3360 CrossRef CAS.
- J. Kang, W. Deng, Q. Zhang and Y. Wang, J. Energy Chem., 2013, 22, 321–328 CrossRef CAS.
- Y.-Q. Jiao, H.-J. Yan, C.-G. Tian and H.-G. Fu, Acc. Mater. Res., 2023, 4, 42–56 CrossRef CAS.
- K. Xiong, J. Li, K. Liew and X. Zhan, Appl. Catal., A, 2010, 389, 173–178 CrossRef CAS.
- Y. Li, Y. Jiao, H. Yan, G. Yang, Y. Liu, C. Tian, A. Wu and H. Fu, Angew. Chem., Int. Ed., 2023, 62, e202306640 CrossRef CAS PubMed.
- X. Yu, C. Zhao, L. Yang, J. Zhang and C. Chen, EES Catal., 2024, 2, 811–822 RSC.
- J. Yu, X. Qin, Y. Yang, M. Lv, P. Yin, L. Wang, Z. Ren, B. Song, Q. Li, L. Zheng, S. Hong, X. Xing, D. Ma, M. Wei and X. Duan, J. Am. Chem. Soc., 2024, 146, 1071–1080 CrossRef CAS PubMed.
- Y. Tang, Y. Kobayashi, N. Masuda, Y. Uchida, H. Okamoto, T. Kageyama, S. Hosokawa, F. Loyer, K. Mitsuhara, K. Yamanaka, Y. Tamenori, C. Tassel, T. Yamamoto, T. Tanaka and H. Kageyama, Adv. Energy Mater., 2018, 8, 1801772 CrossRef.
- H. Xie, Z. Zhao, T. Liu, Y. Wu, C. Lan, W. Jiang, L. Zhu, Y. Wang, D. Yang and Z. Shao, Nature, 2022, 612, 673–678 CrossRef CAS PubMed.
- X. Wang, M. Geng, S. Sun, Q. Xiang, S. Dong, K. Dong, Y. Yao, Y. Wang, Y. Yang, Y. Luo, D. Zheng, Q. Liu, J. Hu, Q. Wu, X. Sun and B. Tang, J. Mater. Chem. A, 2024, 12, 634–656 RSC.
- Y. Ma, Y. Zhang, W. Yuan, M. Du, S. Kang and B. Qiu, EES Catal., 2023, 1, 892–920 RSC.
- Y. Zhao, Y. Guo, X. F. Lu, D. Luan, X. Gu and X. W. Lou, Adv. Mater., 2022, 34, 2203442 CrossRef CAS PubMed.
- S. L. Zhang, X. F. Lu, Z. Wu, D. Luan and X. W. Lou, Angew. Chem., Int. Ed., 2021, 60, 19068–19073 CrossRef CAS PubMed.
- D. Y. Chung, K. J. Lee, S. Yu, M. Kim, S. Y. Lee, O. Kim, H. Park and Y. Sung, Adv. Energy Mater., 2015, 5, 1401309 CrossRef.
- J. Ding, Q. Shao, Y. Feng and X. Huang, Nano Energy, 2018, 47, 1–7 CrossRef CAS.
- X. Qin, L. Zhang, G. Xu, S. Zhu, Q. Wang, M. Gu, X. Zhang, C. Sun, P. B. Balbuena, K. Amine and M. Shao, ACS Catal., 2019, 9, 9614–9621 CrossRef CAS.
- K. Wang, S. Wang, K. S. Hui, H. Gao, D. A. Dinh, C. Yuan, C. Zha, Z. Shao, Z. Tang and K. N. Hui, Carbon Energy, 2022, 4, 856–866 CrossRef CAS.
- Q. Yang, B. Zhu, F. Wang, C. Zhang, J. Cai, P. Jin and L. Feng, Nano Res., 2022, 15, 5134–5142 CrossRef CAS.
- Y. Liu, J. Zhang, Y. Li, Q. Qian, Z. Li, Y. Zhu and G. Zhang, Nat. Commun., 2020, 11, 1853 CrossRef CAS PubMed.
- Z. Xu, M. Fan, S. Tan, R. Wang, W. Tu, X. Huang, H. Pan, H. Zhang and H. Tang, J. Colloid Interface Sci., 2024, 657, 870–879 CrossRef CAS PubMed.
- L. Li, S. Huang, R. Cao, K. Yuan, C. Lu, B. Huang, X. Tang, T. Hu, X. Zhuang and Y. Chen, Small, 2022, 18, 2105387 CrossRef CAS PubMed.
- Y. Liu, X. Li, Q. Zhang, W. Li, Y. Xie, H. Liu, L. Shang, Z. Liu, Z. Chen, L. Gu, Z. Tang, T. Zhang and S. Lu, Angew. Chem., Int. Ed., 2020, 59, 1718–1726 CrossRef CAS PubMed.
- Q. Zhang, S. Jiao, B. Wang, Z. Wang, X. Lv, W. Wang, Y. Tan, C. Cui and Y. Chen, Int. J. Hydrogen Energy, 2021, 46, 26329–26339 CrossRef CAS.
- D. Wu, B. Liu, R. Li, D. Chen, W. Zeng, H. Zhao, Y. Yao, R. Qin, J. Yu, L. Chen, J. Zhang, B. Li and S. Mu, Small, 2023, 19, 23000300 Search PubMed.
- T. Wu, Y. Sun, X. Ren, J. Wang, J. Song, Y. Pan, Y. Mu, J. Zhang, Q. Cheng, G. Xian, S. Xi, C. Shen, H. Gao, A. C. Fisher, M. P. Sherburne, Y. Du, J. W. Ager, J. Gracia, H. Yang, L. Zeng and Z. J. Xu, Adv. Mater., 2023, 35, 2207041 CrossRef CAS PubMed.
- F. Wang, N. Xu, C. Yu, J. Xie, B. Dong, X. Zhang, Y. Dong, Y. Zhou and Y. Chai, Appl. Catal., B, 2023, 330, 122633 CrossRef CAS.
- H. Lei, Q. Wan, S. Tan, Z. Wang and W. Mai, Adv. Mater., 2023, 35, 2208209 CrossRef CAS PubMed.
- J. Zhu, H. Yang, W. Zhang, Y. Mao, S. Lyu and J. Chen, Inorg. Chem. Front., 2020, 7, 1892–1899 RSC.
- J. Li, H. Liu, W. Gou, M. Zhang, Z. Xia, S. Zhang, C. Chang, Y. Ma and Y. Qu, Energy Environ. Sci., 2019, 12, 2298–2304 RSC.
- F. Cheng, X. Peng, L. Hu, B. Yang, Z. Li, C. Dong, J. Chen, L. Hsu, L. Lei, Q. Zheng, M. Qiu, L. Dai and Y. Hou, Nat. Commun., 2022, 13, 6486 CrossRef CAS PubMed.
- L. Rebollar, S. Intikhab, J. D. Snyder and M. H. Tang, J. Phys. Chem. Lett., 2020, 11, 2308–2313 CrossRef CAS PubMed.
- H. Q. Fu, M. Zhou, P. F. Liu, P. Liu, H. Yin, K. Z. Sun, H. G. Yang, M. Al-Mamun, P. Hu, H.-F. Wang and H. Zhao, J. Am. Chem. Soc., 2022, 144, 6028–6039 CrossRef CAS PubMed.
- V. Verdinelli, A. Juan and E. German, Int. J. Hydrogen Energy, 2019, 44, 8376–8383 CrossRef CAS.
- B. Hammer and J. K. Norskov, Nature, 1995, 376, 238–240 CrossRef CAS.
Footnotes |
| † Electronic supplementary information (ESI) available. See DOI: https://doi.org/10.1039/d4ey00076e |
| ‡ These two authors contributed equally to this work. |
| This journal is © The Royal Society of Chemistry 2024 |

