Impact of noncovalent interactions on structural and photophysical properties of zero-dimensional tellurium(IV) perovskites†
Aaron D.
Nicholas
 ,
Benjamin W.
Walusiak
 ,
Leah C.
Garman
 ,
Mehrun N.
Huda
 and
Christopher L.
Cahill
 *
*
Department of Chemistry, The George Washington University, Washington, DC 20052, USA
First published on 1st February 2021
Abstract
Reported is the synthesis and characterization of eight new halotellurate(IV) compounds consisting of isolated [TeX6]2− (X = Cl, Br) octahedra charge balanced by halopyridinium (XPy; X = H, Cl, Br, I) cations and assembled via non-covalent interactions (NCIs) in the second coordination sphere. Computational density functional theory (DFT) based natural bonding orbital (NBO) and density of state (DOS) methods were utilized to (i) map the band structure, (ii) quantify and categorize noncovalent interaction strength and type, and (iii) deconstruct metal–halide bonding orbitals. Our findings demonstrate the influence of NCIs on Te–X bonding, particularly atomic orbital hybridization, and the ability to tune band gap energies as a function of noncovalent interaction type and strength. In brief, band gap energies for the [TeCl6]2− materials are shown to decrease with increasing NCI strength, whereas the opposite is true for [TeBr6]2− compounds. This report is a useful platform for probing the relationship between second sphere effects and the structural and photophysical properties within the halotellurate(IV) family of low dimensional perovskites.
Introduction
Reports on hybrid (organic–inorganic) metal halides continue to expand the family of perovskite materials since the first published structure of methylammonium lead iodide in 1978.1–5 Sought after for their optoelectronic properties, including low band gap energies, over 40 years of research has resulted in perovskite based solar cell scaffolds with power conversion efficiencies of >22%,6,7 on par with commercialized crystalline silicon and CuInxGa(1−x)Se2 thin-films.8 Most recently, work on hybrid perovskites has focused on tuning the photophysical properties of these materials while simultaneously addressing longstanding issues such as photo- and environmental instability.9,10 One method for enhancing resistance to environmental factors such as heat and humidity has been the reduction of perovskite dimensionality through variation of the charge balancing organic cation and separation of inorganic components. The wide availability of organic cations has led to a remarkably diverse family of (hybrid) low dimensional perovskite derivatives, which typically exhibit higher phase purity as well as higher environmental stability compared to their 3D analogs. These structural gains are offset, however, by the loss of beneficial optical properties owing to the rise of localized electronic states, manifesting as large band gap energies, rapid electron/hole recombination, and poor electron carrier capacity.11 As such, challenges remain for developing high efficiency, small band gap, low dimensional perovskite materials.Efforts to prepare stable, lead-free, low dimensional perovskites have demonstrated that the post transition metal ions possessing a valence s2 configuration (e.g., Bi3+, Sb3+, Te4+ and Sn2+) are viable candidates for complete or partial substitution of Pb2+ ions,12–14 with Sn2+ and Bi3+ having garnered the most attention.15–18 Despite the rich chemistry of the post transition metals and the diverse examples of perovskite derivative systems reported, hybrid Te4+ halide perovskites remain under developed. In particular, those featuring N-heterocyclic cations are sorely underrepresented with less than 40 structures reported in the Cambridge Structural Database (CSD version 5.41, 2020).19–41 These materials feature supramolecular motifs similar to those of low dimensional lead-based perovskites, and most commonly contain isolated (monomeric) Te4+ halide octahedra as the inorganic species. Of the available reports, research on these materials has produced promising initial results for optoelectronic applications such as tunable band gap energies and semi-conductive behavior. More work is needed, however, to understand and direct the structural aspects and resultant photophysical behavior of this class of compounds.
We have recently become interested in the interplay between noncovalent interactions and the construct of the frontier molecular orbitals as a viable method to influence the photophysical properties of perovskite derivatives. Inspired by the works of Egger42 and Adonin43 on hybrid metal–halides, we previously reported on the supramolecular assembly and photophysical properties of an isomorphous series of hybrid In3+ and Sb3+ halide dimers ([In2X10]4−/[Sb2X10]4−) paired with halogenated pyridinium cations.44 From these systems we demonstrated the importance of hybridization between the metal s-states and halide p-states in the valence band to produce materials with appreciably low band gap energies. For example, In3+ (5s05p0) containing compounds failed to produce hybridized metal/halide orbitals and featured large band gap energies >2.9 eV whereas the analogous Sb3+ (5s25p0) compounds, where hybridization was observed, had much lower band gap energies at <2.4 eV. Mapping the electronic structure of this family confirmed the presence of a hybridization valence (HOMO) band in the Sb3+ complexes constructed of the metal s-states and halide p-states. Insertion of this band into the electronic structure effectively reduced the band gap energy. Excitingly, hybridization of the metal s-states and halide p-states can be tuned by noncovalent interactions (such as halogen and hydrogen bonding) via varying the halogen composition on either the metal halide anion or the organic cation. Moreover, analysis of the corresponding conduction band (LUMO) revealed energetically assessable organic cation π* molecular orbitals acting as electron acceptors, indicating a photoinduced charge transfer behavior between organic and inorganic components. As such, we are interested in probing materials possessing similar orbital constructs, and Te–halides are a logical extension.
We present herein a new family of isostructural zero-dimensional Te4+ based perovskite materials (Scheme 1) that feature isolated [TeX6]2− anions and halogenated pyridinium cations assembled via hydrogen and halogen bonding. These compounds exhibit tunable band gap energies and luminescence behavior as a function of noncovalent interaction type and strength, both of which may be modulated by varying the halogen composition on either the anion or cation. Systematically varying the halogen at the metal halide or pyridinium cation provides a controlled platform to analyze the role of noncovalent interactions in influencing the construct of the atomic and molecular orbitals involved, and consequently, the overall photophysical properties. Results from solid state UV-Vis and variable temperature luminescence measurements indicate the correlation of band gap and emission energies to second sphere noncovalent interactions at the [TeX6]2− anions. Spectroscopic results are interpreted using density functional theory (DFT) based density of state (DOS) and natural bonding orbital (NBO) calculations, both of which map the electronic structure, and provide information on atomic orbitals involved in Te–X bonding and within NCIs. This work not only represents a substantial addition to the known examples of hybrid [TeX6]2− materials, but also demonstrates how noncovalent interactions influence the atomic and molecular orbital construct about the inner coordination sphere thereby altering the structural and electronic properties.
 | ||
| Scheme 1 The family of hybrid perovskites assembled from anionic [TeX6]2− octahedra and halopyridinium cations presented herein. | ||
Experimental
General
All reagents were purchased from Sigma Aldrich or Acros and used as received. Concentrated hydrobromic acid was distilled prior to use to remove Br2 impurities.General synthesis of (C5NH5X)2[TeCl6] and (C5NH5X)2[TeBr6] (X = H, Cl, Br, I)
Tellurium oxide (0.125 mmol) and 4-Xpyridine (X = H, Cl, Br, I) (0.0624 mmol) were combined with 1 ml of 0.25 M HCl or 0.25 M HBr in a one-dram vial. Reaction conditions are shown in Scheme 2. The solution was stirred and left undisturbed to allow remaining solids to settle. Aliquots of the solution layer were deposited onto clean glass slides to allow evaporation of the solution over 24 h. Solutions yielded dark yellow or orange plate crystals. Single crystals were physically separated from the solution and stored at ambient conditions prior to analysis. Harvested crystals were phase pure as indicated by single crystal X-ray diffraction (below).X-Ray crystallography
Crystals of 1–8 were harvested from mother liquors and mounted on 20 μm MiTeGen mounts. All measurements were made using monochromated microfocus Mo Kα (λ = 0.71073) radiation on a Bruker D8 Quest, equipped with a Photon II detector. All reflection data were collected at 100(2) K with 0.5° φ and ω scans. Initial space group determination was based on a matrix consisting of 180 frames operating in shutterless mode using the APEX III software suite. The data were reduced using SAINT,45 and empirical absorption correction applied using SADABS.46 Structures solutions, solved using intrinsic phasing, and refinement were performed using the ShelXT package47 and ShelXL48 in APEX III.45 All atoms were refined anisotropically where aromatic hydrogen atoms were placed in idealized positions and allowed to ride on the coordinates of the parent atom with isotropic thermal parameters (Uiso) fixed at 1.2 Ueq. Details of the X-ray diffraction experiments and crystal data are summarized in Table 1. ORTEP renderings and select bond lengths and bond angles of 1–8 can be found in the ESI.†| 1 | 2 | 3 | 4 | |
|---|---|---|---|---|
| a R = R1 = ∑|Fo| − |Fc||/∑|Fo| for observed data only. Rw = wR2 = {∑[w(Fo2 − Fc2)2]/∑[w(Fo2)2]}1/2 for all data. | ||||
| CCDC no. | 2033160 | 2033161 | 2033162 | 2033163 |
| Formula | (C5H5NH)2TeCl6 | (C5H5NCl)2TeCl6 | (C5H5NBr)2TeCl6 | (C5H5NI)2TeCl6 |
| Formula weight | 500.52 | 569.40 | 658.30 | 752.30 |
| Crystal system | Triclinic | Monoclinic | Monoclinic | Monoclinic |
| Space group |
P![[1 with combining macron]](https://www.rsc.org/images/entities/char_0031_0304.gif) |
P21/c | P21/c | P21/n |
| a, Å | 7.199(5) | 8.5752(13) | 8.2920(13) | 8.6332(4) |
| b, Å | 7.980(5) | 16.942(3) | 16.532(3) | 7.4476(3) |
| c, Å | 8.046(5) | 6.9993(9) | 7.0432(12) | 15.9893(9) |
| α, ° | 82.393(13) | 90 | 90 | 90 |
| β, ° | 66.181(17) | 112.504(7) | 97.658(6) | 102.507(2) |
| γ, ° | 83.673(16) | 90 | 90 | 90 |
| Volume, Å3 | 418.3(5) | 939.4(2) | 956.9(3) | 1003.66(8) |
| Z | 1 | 2 | 2 | 2 |
| ρ calc., g cm−3 | 1.978 | 2.013 | 2.285 | 2.489 |
| μ, mm−1 | 2.723 | 2.713 | 6.560 | 5.350 |
| Radiation | 0.71073 | 0.71073 | 0.71073 | 0.71073 |
| Temp., K | 100(2) | 100(2) | 100(2) | 100(2) |
| Residuals:aR; Rw | 0.0528; 0.0850 | 0.0139; 0.0318 | 0.0272; 0.0625 | 0.0223; 0.0517 |
| Goodness of fit | 1.009 | 1.056 | 1.067 | 1.056 |
| 5 | 6 | 7 | 8 | |
|---|---|---|---|---|
| CCDC no. | 2033164 | 2033165 | 2033166 | 2033167 |
| Formula | (C5H5NH)2TeBr6 | (C5H5NCl)2TeBr6 | (C5H5NBr)2TeBr6 | (C5H5NI)2TeBr6 |
| Formula weight | 767.22 | 836.10 | 925.00 | 1019.00 |
| Crystal system | Triclinic | Monoclinic | Triclinic | Monoclinic |
| Space group |
P![[1 with combining macron]](https://www.rsc.org/images/entities/char_0031_0304.gif) |
P21/c |
P![[1 with combining macron]](https://www.rsc.org/images/entities/char_0031_0304.gif) |
P21/n |
| a, Å | 7.422(5) | 8.7464(9) | 7.2851(10) | 8.9647(15) |
| b, Å | 8.222(4) | 17.5435(9) | 8.5325(12) | 7.5318(13) |
| c, Å | 8.248(5) | 7.2116(5) | 9.3609(6) | 16.476(2) |
| α, ° | 83.086(14) | 90 | 74.465(6) | 90 |
| β, ° | 67.185(17) | 112.301(4) | 84.590(6) | 103.618(7) |
| γ, ° | 84.495(17) | 90 | 68.607(6) | 90 |
| Volume, Å3 | 459.9(5) | 1023.80(14) | 521.99(13) | 1081.2(3) |
| Z | 1 | 2 | 1 | 2 |
| ρ calc., g cm−3 | 2.771 | 2.712 | 2.943 | 3.130 |
| μ, mm−1 | 14.641 | 13.416 | 16.728 | 15.313 |
| Radiation | 0.71073 | 0.71073 | 0.71073 | 0.71073 |
| Temp., K | 100(2) | 100(2) | 100(2) | 100(2) |
| Residuals:aR; Rw | 0.0219; 0.0451 | 0.0168; 0.0346 | 0.0360; 0.0882 | 0.0201; 0.0348 |
| Goodness of fit | 1.089 | 1.042 | 1.218 | 1.067 |
Photophysical measurements
Diffuse reflectance spectra were collected on solid samples at 298 K. The light source was a Mikropack DH-2000-BAL deuterium and halogen light source coupled with an Ocean Optics Flame detector. Scattered light was collected with a fiber-optic cable. Spectra were referenced with BaSO4. Data were processed using OceanView spectroscopy software. Tauc plots of reflection data can be found in the ESI.† Steady-state luminescence scans of 1–8 were collected at 298 K and 78 K. Spectra were collected with a Fluorolog®-3 photoluminescence spectrophotometer from Horiba using a 450 W xenon arc lamp combined with a double excitation monochromator and double emission monochromator. A photomultiplier tube at 950 V was used as the emission detector. Low temperature luminescence measurements were collected on solid samples under vacuum using a Janis VPF-100 cryostat equipped with UV-grade fused silica windows coupled with a Lakeshore model 325 temperature controller. Samples were mounted on a quartz plate using non-emitting high vacuum grease.Computational methods
Electrostatic potential surfaces
The noncovalent interactions between building units of 1–8 were investigated via electrostatic potential (ESP) analysis. ESP surfaces were calculated using Density Functional Theory (DFT) in the Gaussian 16 software (Gaussian Inc.).49 Calculations were performed on individual building blocks using both the B3LYP50,51 functional with the modified scalar-relativistic effective core potential (ECP) basis set def2-TZVP52,53 for all atoms as implemented in the software with the def2-TZVP pseudopotential applied to I and Te atoms. We developed molecular models for the TeX species and organic cations using the unoptimized X-ray diffraction data as input. Electrostatic potentials were generated on an electron density surface at 0.002 ε bohr−1 where areas of positive/negative potential indicate electron-rich/deficient regions. Electrostatic potentials generated at this isodensity value have been determined by previous studies to be an accurate indicator for supramolecular assembly.54,55Density of states (DOS) and natural bond orbitals (NBO)
To determine the band structure and presence of hybridization, DFT based density of state and natural bonding orbital calculations were performed on crystallographic models of 1–8 using the functional and bases set described above. Density of states (DOS) and bond critical point electron density (including Laplacian density) data were extracted and analyzed using the Multiwfn program.56 The DOS was divided into select partial density of states (PDOS) including the tellurium s and p shells, the pyridinium π and π* (p shell) molecular orbitals, and the metal-bound halide p shell. NBO calculations were performed using NBO7 on building units of 1–8 constructed from crystallographic fragments. NBO second order perturbation theory was applied to quantify the magnitude of the donor–acceptor interaction between the halide donor and the halogen or hydrogen bond acceptor and monitor shifts in atomic orbital contribution and composition for metal–halide bonding. Models generated and used for DOS and NBO calculations as well as details on Wiberg and electron density calculations can be found in the ESI.†Results and discussion
Synthetic strategy
Examples of low dimensional TeX containing hybrid perovskites are remarkably rare compared to reports on other closely related post-transition metals (i.e. Sb3+, In3+, Sn2+, Bi3+). Of these, only a handful explore the optical properties such as absorption and luminescence.21–24,26–30,32–34,57 As such, there is little literature precedence on the electronic structure and photophysical behavior of Te4+ containing hybrid perovskites, making any spectroscopic observations in such a family difficult to interpret. As such, to determine the influence of noncovalent interactions on supramolecular assembly, electronic structure, and metal–halide bonding in Te4+ containing materials we require a systematic family which by varying the synthetic conditions differ by a single variable at a time. Such a family has been prepared using a combination of HCl or HBr acidic solutions and monosubstituted pyridinium cations at the para position. The result is a series of compounds which vary primarily through (i) the noncovalent interactions involved in assembly i.e. halogen or hydrogen bonding and (ii) tellurium halide composition i.e. [TeCl6]2− or [TeBr6]2−. Compounds grouped as 1–4 and 5–8, for example, vary only by the pyridinium halogen substituent where the hydrogen is replaced systematically by more polarizable halogens (H < Cl < Br < I). Such a closely related family of Te4+ materials affords the ability to probe and rationalize not only spectroscopic properties such as band gap energy and electronic structure, but also structural properties such as octahedral distortion and tellurium–halide bonding as a function of noncovalent interactions.Structural descriptions
Local structure
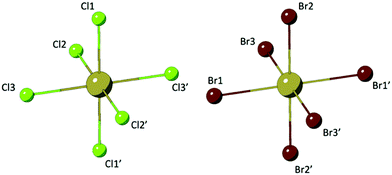
Compounds 1–8 are assembled from isolated [TeX6]2− octahedra (X = Cl, Br) charge balanced by para-halopyridinium (XPy, Py = pyridinium, X = H, Cl, Br, I) cations via extended noncovalent bonding including hydrogen and halogen bonding. Two representative TeX species are presented in Fig. 1. In general, the [TeX6]2− octahedra of 1–8 are completed via an inversion center at the metal center where three halides (Cl or Br) are crystallographically unique. For these TeX species, the Te–Cl bonds range between 2.521(1) Å and 2.565(1) Å while the Te–Br bonds are elongated between 2.680(1) Å and 2.719(1) Å. Corresponding ranges of bonding angles are between 87.6° and 91.5° for Cl–Te–Cl and between 87.3° and 92.6° for Br–Te–Br.Crystal structures and supramolecular assembly
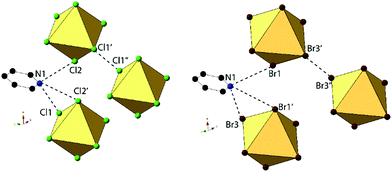
Compounds 1 and 5, (Py)2[TeCl6] and (Py)2[TeBr6] are isomorphous structures that crystallize in the space group P![[1 with combining macron]](https://www.rsc.org/images/entities/char_0031_0304.gif) . These structures consist of [TeX6]2− octahedra linked to charge balancing pyridinium cations predominantly via halogen bonding and trifurcated hydrogen bonds (Fig. 2). As a representative structure, compound 1 (for which a polymorph has been previously reported40) features a [TeX6]2− octahedron and pyridinium cation. For the three crystallographically unique Cl atoms, the average Te–Cl bond is 2.541 Å and Cl–Te–Cl angle is 88.8°. Halogen bonding occurs between neighboring [TeCl6]2− octahedra via Cl1′⋯Cl1′′ at a distance of 3.311(2) Å (94.6% of the van der Waals radii) and θ1 = θ2 of 178.7°. In this work we consider a halogen bond to be present when the two atoms are within or very close to the sum of their van der Waals (vdW) radii.59
. These structures consist of [TeX6]2− octahedra linked to charge balancing pyridinium cations predominantly via halogen bonding and trifurcated hydrogen bonds (Fig. 2). As a representative structure, compound 1 (for which a polymorph has been previously reported40) features a [TeX6]2− octahedron and pyridinium cation. For the three crystallographically unique Cl atoms, the average Te–Cl bond is 2.541 Å and Cl–Te–Cl angle is 88.8°. Halogen bonding occurs between neighboring [TeCl6]2− octahedra via Cl1′⋯Cl1′′ at a distance of 3.311(2) Å (94.6% of the van der Waals radii) and θ1 = θ2 of 178.7°. In this work we consider a halogen bond to be present when the two atoms are within or very close to the sum of their van der Waals (vdW) radii.59
Hydrogen bonding occurs between the pyridinium cation at the protonated nitrogen end and two [TeCl6]2− octahedra. For 1, the cation interacts with distinct [TeCl6]2− anions through either a bifurcated hydrogen bond to one octahedron and a monofurcated hydrogen bond to the other. Measured donor to acceptor distances for compound 1 are 3.406(4) (N1⋯Cl2), 3.380(5) (N1⋯Cl2′), 3.252(6) Å (N1⋯Cl1), and N–H⋯X angles of 137.4, 123.0, and 117.8°, respectively. Complete halogen and hydrogen bonding information is presented in Table 2 and Table S9 (ESI†), respectively, and a detailed structural description for the isomorphous compound 5 is provided in the ESI.† The global structure of compound 1 (Fig. 3) consists of columns of halogen bonded [TeCl6]2− octahedra assembled via hydrogen bonding with pyridinium cations. Noncovalent π⋯π stacking occurs between pyridinium rings, with a centroid to centroid distances of 3.69 Å and β angle of 21.8°. The β angle describes the angle of offset between one centroid and the vector normal to the plane of the aromatic ring passing through the other centroid. For our purposes we take centroid–centroid distances of less than 3.80 Å and β angles of about 20° or less to be indicative of π–π stacking.60 This interaction does not occur between each consecutive pyridinium ring in a continuous manner, but rather between separate sets of pyridinium rings throughout the structure. It is worth noting that within this series of compounds, only 1 and 5 exhibit π⋯π stacking between pyridinium rings.
| Interaction pairs | X1⋯X2 | d (Å) (X1⋯X2)a,b | θ 1 (deg.) ∠(Te–X1⋯X2) | θ 2 (deg.) ∠([Py or Te]–X2⋯X1) | |
|---|---|---|---|---|---|
| a Percentage of the sum of the van der Waals radii shown in parentheses, %vdW = (d/(ra + rb). b vdW radii values obtained from Bondi.58 X1 = Te bound halide; X2 = pyridine or Te bound halide. | |||||
| 1 | [TeCl6]2−⋯[TeCl6]2− | Cl⋯Cl | 3.311 (94.6%) | 179.1 | 179.1 |
| 2 | [TeCl6]2−⋯ClPy | Cl⋯Cl | 3.515 (100.4%) | 150.0 | 144.8 |
| Cl⋯Cl | 3.551 (101.5%) | 140.9 | 131.8 | ||
| 3 | [TeCl6]2−⋯BrPy | Cl⋯Br | 3.235 (89.9%) | 171.2 | 106.2 |
| 4 | [TeCl6]2−⋯IPy | Cl⋯I | 3.452 (92.6%) | 156.4 | 146.9 |
| 5 | [TeBr6]2−⋯[TeBr6]2− | Br⋯Br | 3.338 (90.2%) | 178.6 | 178.6 |
| 6 | [TeBr6]2−⋯ClPy | Br⋯Cl | 3.603 (100.2%) | 150.1 | 145.0 |
| Br⋯Cl | 3.625 (100.7%) | 141.6 | 132.7 | ||
| 7 | [TeBr6]2−⋯BrPy | Br⋯Br | 3.484 (94.2%) | 137.6 | 157.1 |
| 8 | [TeBr6]2−⋯IPy | Br⋯I | 3.530 (92.2%) | 156.9 | 146.6 |
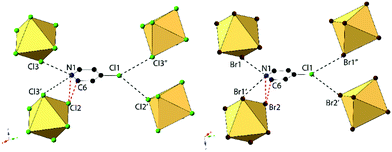
Compounds 2 and 6, (ClPy)2[TeCl6] and (ClPy)2[TeBr6], are isomorphous and crystallize in space group P2(1)/c. They both consist of XPy moieties exhibiting bifurcated hydrogen bonding with two different [TeX6]2− octahedra via the protonated nitrogen. Organic XPy moieties also interact with [TeX6]2− octahedra via bifurcated halogen bonding between the pyridinium Cl and the metal bound halides which has been observed in closely related halobismuthate(III) hybrid materials feature halopyridinium cations.61,62 Short X⋯C/N distances (<vdW) between the metal bound halide and the pyridinium nitrogen and an adjacent carbon atom are also observed in both 2 and 6 (Fig. 4). Curiously, these X⋯C/N exclude any of the associated hydrogen atoms and are not suitably positioned for interaction with the π cloud. For the representative structure 2, the three unique Cl atoms have an average Te–Cl bond of 2.540 Å and Cl–Te–Cl angle of 91.0°. A detailed description of isomorphous compound 6 is provided in the ESI.†
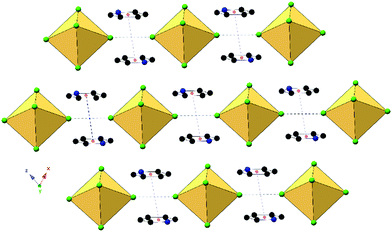
An expanded view of the packing in 2, as a representative compound, is shown in Fig. 5. Halogen bonding for compound 2 occurs via Cl1⋯Cl3′′ and Cl1⋯Cl2 at distances of 3.514(1) Å and 3.551(1) with θ1 = 149.9°, θ2 = 144.9° and θ1 = 140.8°, θ2 = 131.81° respectively. Halogen⋯halogen distances for Cl1⋯Cl3′′ and Cl1⋯Cl2 represent 100.5% and 101.5% of the vdW radii respectively. Direct halogen bonding between octahedra (as in compounds 1 and 5) is no longer observed. Hydrogen bonding between the protonated nitrogen on the pyridinium ring and the [TeCl6]2− octahedra have PyH⋯X distances of 3.314(1) (N1⋯Cl3) and 3.248(6) Å (N1⋯Cl3′), with X⋯HPy angles of 132.4° and 138.7°, respectively. Additional hydrogen bonding is present between [TeCl6]2− octahedra and carbon bound hydrogens, tabulated in Table S9 (ESI†). Short X⋯C/N contacts between a metal bound halide and the pyridinium ring occur via Cl2⋯N1 and Cl2⋯C6, with distances of 3.306(3) Å and 3.410(2) Å, respectively (99.6% and 95.3% of the vdW radii). A detailed description of 6 is presented in the ESI.†
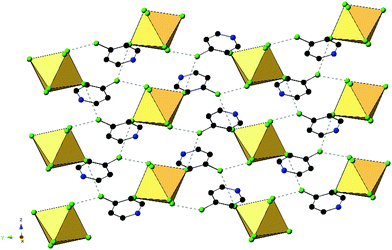 | ||
| Fig. 5 Packing of 2 highlighting the extended halogen bonding (dashed lines) between [TeCl6]2− octahedra and associated ClPy cations. | ||
Compounds 3 and 7, (BrPy)2[TeCl6] and (BrPy)2[TeBr6], despite containing the same bromopyridinium cation, are not isomorphous. Compound 3 crystallizes in space group P2(1)/c whereas compound 7 assumes P![[1 with combining macron]](https://www.rsc.org/images/entities/char_0031_0304.gif) symmetry. The change in space group is due to the different coordination scheme between the [TeX6]2− octahedra and pyridinium units, where the cation in compound 3 is hydrogen bonded to two different [TeCl6]2− octahedra via the protonated nitrogen, and the cation in 7 is hydrogen bonded to only one octahedron (Fig. 6). Both 3 and 7 exhibit a single instance of halogen bonding between the pyridinium substituent and a [TeX6]2− octahedron, as well as a short X⋯C contact between a metal bound halide and the pyridinium ring. This interaction is consistent with those described above as no contacts with the associated hydrogens are observed. The three unique Cl atoms of the octahedron in compound 3 have an average Te–Cl bond of 2.539 Å and Cl–Te–Cl angle of 89.52°. For compound 7, the average Te–Br bond is 2.696 and Br–Te–Br angle is 88.15°.
symmetry. The change in space group is due to the different coordination scheme between the [TeX6]2− octahedra and pyridinium units, where the cation in compound 3 is hydrogen bonded to two different [TeCl6]2− octahedra via the protonated nitrogen, and the cation in 7 is hydrogen bonded to only one octahedron (Fig. 6). Both 3 and 7 exhibit a single instance of halogen bonding between the pyridinium substituent and a [TeX6]2− octahedron, as well as a short X⋯C contact between a metal bound halide and the pyridinium ring. This interaction is consistent with those described above as no contacts with the associated hydrogens are observed. The three unique Cl atoms of the octahedron in compound 3 have an average Te–Cl bond of 2.539 Å and Cl–Te–Cl angle of 89.52°. For compound 7, the average Te–Br bond is 2.696 and Br–Te–Br angle is 88.15°.
Halogen bonding in 3 occurs via Br1⋯Cl2′′ at a distance of 3.235(1) Å with θ1 and θ2 of 171.2 and 106.2° respectively (Fig. 6). In 7, halogen bonding occurs via Br1⋯Br3 at a distance of 3.484(1) Å with θ1 and θ2 of 157.1 and 137.7 respectively. van der Waals overlap in 3 occurs via Cl3⋯C6, at a distance of 3.408(4) Å (98.8% of the vdW radii, Fig. 6). A similar interaction occurs in 7, involving Br2′, and localized on C2 of the pyridinium ring, (3.444(1) Å, 97.0% of the vdW radii). Hydrogen bonding in 3 occurs via hydrogen donor N1 to Cl2 and Cl2′ in two separate [TeCl6]2− octahedra, with distances and N–H⋯X angles of 3.259(3) Å, 3.235(3) Å and 137.8°, 134.2° respectively. In 7, hydrogen bonding occurs via N1 to Br1 and Br3 on a single [TeBr6]2− octahedron at a distance of 3.470(5), 3.456(4) Å and at angles of 130.4 and 144.0° respectively. Additional hydrogen bonding between [TeX6]2− octahedra and carbon bound hydrogens occur in both 3 and 7, which are tabulated in Table S9 (ESI†). The difference in packing of 3 and 7 owing to variation in NCIs can be seen in Fig. 7.
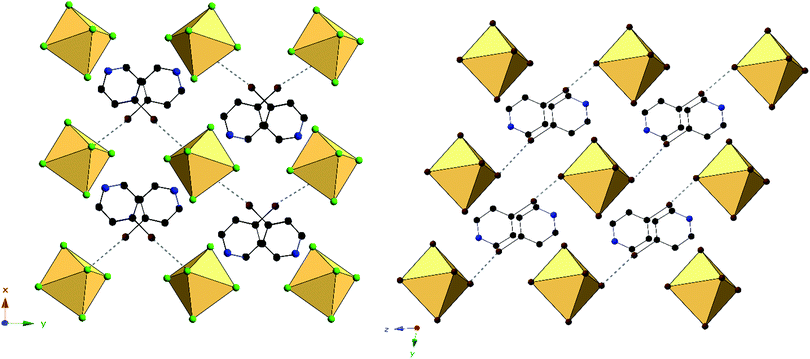 | ||
| Fig. 7 Packing of 3 (left) and 7 (right) directly along c-axis or a-axis, respectively, showing differences in halogen bonding (black dashed lines) between XPy halogens and [TeX6]2− octahedra. | ||
Compounds 4 and 8, (IPy)2[TeCl6] and (IPy)2[TeBr6], are isomorphous, both assuming the P2(1)/n space group. For the representative compound 4, the average Te–Cl bond is 2.552 Å and Cl–Te–Cl angle is 88.3°. Each compound exhibits bifurcated hydrogen bonding via the pyridinium nitrogen to a single [TeX6]2− octahedron, as well as halogen bonding via the pyridinium iodide to a single octahedron (Fig. 8 and 9). Despite being in a different crystal system, the noncovalent interactions of 4 and 8 are very similar to those found in compound 7 and as such the system may be considered isostructural. Halogen bonding in 4 occurs via I1⋯Cl2 at a distance of 3.452(1) Å with θ1 = 146.9° and θ2 = 156.4° (Fig. 8). Bifurcated hydrogen bonding in 4 occurs via the N1 to octahedral Cl1 and Cl3 at a distance of 3.214(3) Å, 3.473(2) Å with angles of 147.7° and 125.1°, respectively. Additional weak hydrogen bonding between [TeX6]2− octahedra and carbon bound hydrogens is tabulated in Table S9 (ESI†). No X⋯C contacts are observed in 4, the absence of which serves as the only major difference in NCIs present in 4/8 from 7, and likely at least partially explains the difference in assembly. A detailed structural description of 8 is provided in the ESI.†
 | ||
| Fig. 8 Local structure of isomorphous compounds 4 (left) and 8 (right) showing hydrogen- and halogen bonding (dashed lines). | ||
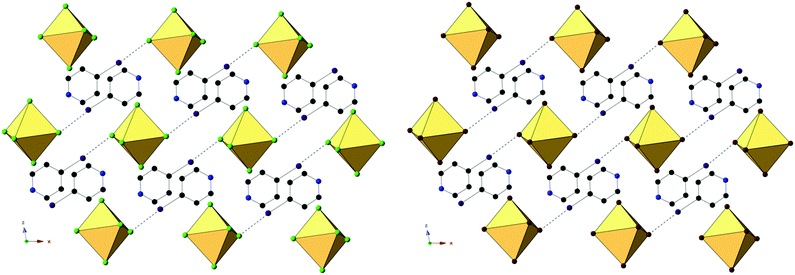 | ||
| Fig. 9 Packing of 4 (left) and 8 (right) as seen directly along the b-axis, showing halogen bonding (black dashed lines) between pyridinium halogens and [TeX6]2− octahedra. | ||
Across the series, the specific means of assembly between the pyridinium cations and metal halide octahedra is dependent mainly on the pyridinium substituent. Generally, each (XPy)2[TeCl6] compound is isomorphous with their bromo analog, with the exception of those involving BrPy. Halogen bonding data, including vdW overlap, for all compounds is tabulated in Table 2. Somewhat unexpectedly, the van der Waals overlap of the halogen bonded atoms for compounds 3 and 4 are notably short at 89.9% and 92.6% of the vdW radii, respectively. Typically, increased halogen polarizability is associated with significant van der Waals overlap in halogen⋯halogen bonding,63–65 and consequently, we expected a gradual increase in overlap with increasing halogen size on the cation in our materials. This occurs in 6–8 whose vdW overlap increases on the order of Cl < Br < I. The vdW overlap in 3 (Br⋯Cl), however, sharply deviates from this trend, displaying the greatest overlap of the series despite involving a small Cl halogen. Strikingly, the vdW overlap in 6, which also involves a Cl⋯Br interaction like that of 3, has one of the smallest overlaps in the series. Electrostatic potential surfaces (ESPs) generated on [TeX6]2− octahedra (Fig. S9, ESI†) confirm that [TeCl6]2− is a better donor compared to [TeBr6]2− and explains the greater vdW overlap found in 1–4.
Optical properties and electronic structure
Optical properties
We have performed diffuse reflectance and luminescence measurements to quantify the impact of halogen variation within both [TeX6]2 anions and pyridinium cations on spectroscopic properties in 1–8. Diffuse reflectance measurements (Fig. 10 and Table 3) for compounds 1–8 reveal broad absorption bands spanning the UV and visible regions. The [TeCl6]2− containing compounds 1–4 absorb strongly between 225 nm and 500 nm, tapering off around 525 nm. For 1–3, this is observed as a single absorption band. Only compound 4 features an additional second weaker, lower energy band centered at 615 nm. Of the [TeBr6]2− compounds 5–8, a single strong absorption band occurs between 225 nm and 550 nm. A weak shoulder in 8 is observed at 630 nm.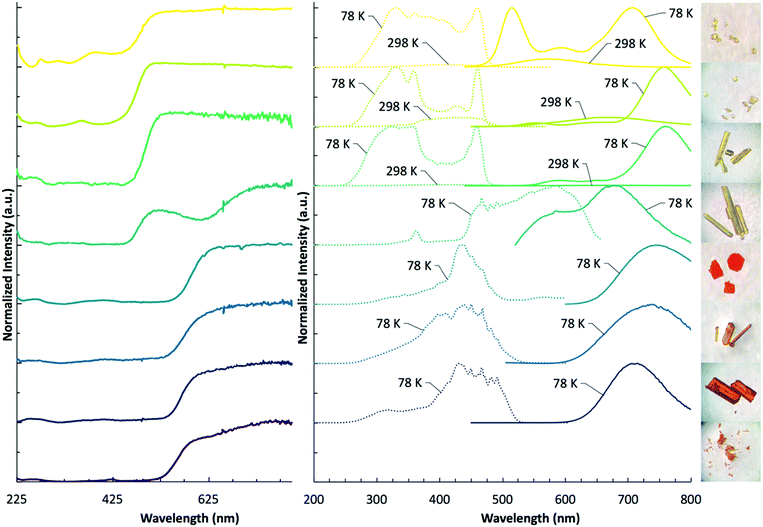 | ||
| Fig. 10 DRS (left) at 298 K, luminescence spectra (right) at 298 K and 78 K, and photo images of 1–8. Crystal sizes range from 100 μm to 0.5 mm. | ||
| Bandgap (eV) |
λ
Ex![[thin space (1/6-em)]](https://www.rsc.org/images/entities/char_2009.gif) Max (nm) Max (nm) |
λ
Em![[thin space (1/6-em)]](https://www.rsc.org/images/entities/char_2009.gif) Max (nm) Max (nm) |
Stokes shift (cm−1) | |
|---|---|---|---|---|
| 1 | 2.58 | 460 | 706 | 7580 |
| 2 | 2.57 | 330 | 756 | 17![[thin space (1/6-em)]](https://www.rsc.org/images/entities/char_2009.gif) 100 100 |
| 3 | 2.54 | 324 | 758 | 17![[thin space (1/6-em)]](https://www.rsc.org/images/entities/char_2009.gif) 700 700 |
| 4 | 2.51 | 586 | 676 | 2270 |
| 5 | 2.13 | 438 | 740 | 9320 |
| 6 | 2.15 | 450 | 735 | 8620 |
| 7 | 2.22 | 430 | 714 | 9250 |
| 8 | 2.26 | — | — | — |
The absorption edge of the [TeBr6]2− complexes typically occur at lower energies than those of the [TeCl6]2− compounds (with the exception of 4), resulting in a shift in observed crystal color from yellow to orange/red. The band gaps for this series were calculated from the Tauc plot (Fig. S10, ESI†) at: 1 2.58 eV, 2 2.57 eV, 3 2.54 eV, 4 2.51 eV, 5 2.13 eV, 6 2.15 eV, 7 2.22 eV, 8 2.26 eV. Of note is that band gap energies of the [TeCl6]2− compounds 1–4 generally follow the trend in polarizability of the pyridinium substituent, occurring on the order of HPy > ClPy > BrPy > IPy, whereas the [TeBr6]2− complexes 5–8 display the reverse trend: IPy > BrPy > ClPy > HPy.
Of the compounds reported herein, only 1–7 show luminescence behavior under UV irradiation where 1–3 are luminescent between 298 K and 78 K and compounds 4–7 only emit at low temperature. Luminescence measurements (Fig. 10 and Table 3) reveal a broad range of emission and excitation energies at 298 K and 78 K. The emission and excitation intensity of 1–3 is weak at 298 K. At 298 K, compound 1 features a broad emission and absorption band at 574 nm and 420 nm, respectively. When cooled to 78 K, the emission intensity increases, and two dominant bands are observed at 516 nm and 706 nm. A less intense band occurs at 596 nm. At 78 K, the excitation band increases in intensity and broadens significantly with a band max at 330 nm and 460 nm. Compound 2, at 298 K reveals broad emission and excitation bands at 664 nm and 438 nm, respectively. When cooled to 78 K, the dominant emission band increases in intensity with a max value occurring at 756 nm. Two less intense emission bands are present at 552 nm and 654 nm. The corresponding excitation energy at 78 K reveals two dominant bands at 330 nm and 460 nm, and a less pronounced band at 428 nm. At 298 K, compound 3 features low intensity emission and excitation bands at 682 nm and 450 nm, respectively. When cooled to 78 K the excitation and emission bands become more intense with the dominant emission band occurring at 758 nm. Two less pronounced emission bands occur at 590 nm and 650 nm. The corresponding excitation bands occur at 324 nm and 458 nm. Compounds 4–7 are not luminescent at 298 K and were thus measured at 78 K, where compound 4 reveals a broad emission band with λmax values at 586 nm and 676 nm. The excitation band is broad as well with λmax values at 466 nm and 586 nm. Compound 5 features narrow emission and excitation bands at 744 nm and 438 nm, respectively. Compound 6 features similar narrow emission and excitation bands shifted to 735 nm and 450 nm, respectively. Compound 7 continues the trend of a single, narrow emission band with a maximum value occurring at 714 nm. The corresponding excitation band is found at 430 nm. Compound 8 is not luminescent at 298 K, or when cooled to 78 K. At 298 K, the max value of the emission and excitation bands of compounds 1–3 trend according to the polarizability of the halogen substituent on the pyridinium cation in the following order: HPy < ClPy < BrPy. Upon cooling to 78 K, this trend continues for the emission bands of compounds 1–3, yet deviates for their excitation energies as these bands broaden considerably. Similar to the band gap energies, emission bands of [TeBr6]2− compounds 5–7 trend in reverse to compounds 1–3 BrPy < ClPy < HPY. This trend is not apparent in the broad excitation bands of compounds 5–7. The broad luminescence bands and large Stokes shifts (>2272 cm−1) for compounds 1–7 suggest either a photoinduced mixed halide/metal to ligand charge transfer (X/MLCT) or metal to ligand charge transfer (MLCT). We have observed such photoinduced charge transfer in closely related zero-dimensional In3+ and Sb3+ halide perovskites paired with pyridinium cations.44 In this process the electron rich metal halide acts as an electron donor for the electron deficient organic pyridinium acceptor and constitutes delocalization of the electron throughout the material.
Mapping the band structure
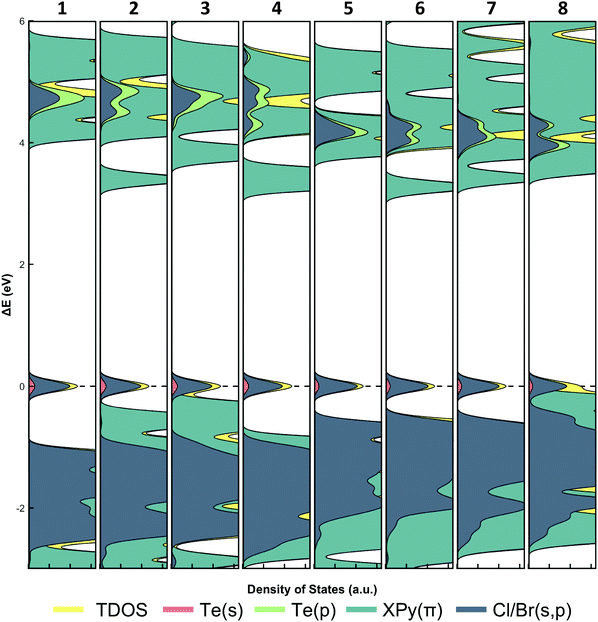
In traditional 3D halide perovskites, such as CH3NH3PbI3, the absorption bands arise from electron transfer between the hybridized Pb 6s/I 6p valence band and the Pb 6p conduction band.66,67 This atomic orbital construct of the frontier orbitals enables modulation of band gap energy via the valence band through halide substitution, and has been demonstrated extensively.68–70 This approach, however, does not take advantage of tuning the band gap by influencing the conduction band. In our materials the introduction of aromatic cations into the lattice provides a second pathway for photoinduced charge transfer, mainly by the insertion of energetically accessible π* molecular orbitals as excited electron acceptors. Our group44 and others42,71 have demonstrated that band gap tuning in similar In3+, Sn2+, or Sb3+ halide analogs paired with N-hetero cyclic organic cations involves a combination of metal/halide hybridization and organic π* acceptor energies. For example, in [XPy]2In2X10 (X = Cl; Br; I) the In3+ s-states fail to hybridize with the halide p-states and the pyridinium cations act as electron acceptors, whereas in (EtPy)SbBr6 the Sb5+ hybridizes with the Br p-states and the cation does not participate in the conduction band. Considering the range of possible band configurations, assigning the origin of absorption behavior is therefore not straight-forward.The density of states (DOS) for 1–8 were generated (Fig. 11) using the crystallographic data in an effort to definitively assign and determine the absorption and emission band origins as either a X/MLCT or MLCT as suggested by the DRS and luminescence data. In all cases, an intermediate band is observed as the highest occupied molecular orbital (HOMO).
The presence of an intermediate band is important when considering reduction of band gap energies in low-dimensional perovskites as it is effectively inserted between what would otherwise be the conduction and valence bands. For compounds 1–8, this band arises from hybridization of the Te4+ s-states and halide p-states and is similar to other PbX and SbX perovskites.42,72,73 Unlike inorganic (e.g. non-hybrid) PbX and SbX perovskites, however, DOS calculations reveal that the lowest unoccupied molecular orbital (LUMO) in our [TeX6]2− compounds is composed of the pyridinium π* molecular orbitals. The metal p-states, which traditionally populate the conduction band, are higher in energy than the π* molecular orbitals and thus are energetically inaccessible. This is supported by TD-DFT UV-vis spectra and transitions of TeX units (monomeric and dimeric) which show Te4+ p acceptor orbitals in the absence of organic cations (Fig. S13 and S14, ESI†). Based on these DOS calculations, we posit that photoexcitation of 1–8 proceeds as a X/MLCT transition where the [TeX6]2− octahedra serve as electron donors and the organic cations acts as excited electron acceptors. The capture of excited electrons by the organic cation is encouraging as spatial separation of the electron/hole pairs is useful in preventing rapid recombination. Furthermore, it also demonstrates that photoinduced charge transfer in 1–8 produces delocalized electrons which may be subsequently harvested in optoelectronic devices. As a final note, the DOS calculations provide an explanation as to the lack of photoemissive behavior for 8 at either 298 K and 78 K. Careful inspection of the intermediate band reveals that the π molecular orbitals from the IPy cation are higher in energy, and energetically overlap the hybridized Te4+/Br s-states/p-states. Presumably, these filled π orbitals may also act as an electron donor and thus would lead to a secondary π → π* pathway. It is reasonable that the π → π* transition provides a nonradiative relaxation pathway in 8, leading to quenching of emission. Based on this we modify our initial assignment of 8 to now include an intramolecular π → π* charge transfer alongside the X/MLCT.
Computational analysis of inner sphere bonding and outer sphere NCIs
Inner sphere Te–X bonding
As 1–8 assemble via noncovalent interactions, our efforts (above) have focused on the extent to which these interactions impart changes about the metal center, (i.e. Te–X bonding), and resulting photophysical properties. As such, we set about utilizing molecular orbital theory via natural bonding orbital (NBO) calculations. It is noteworthy that this hybrid experimental/computational approach provides information on the Te–X bonds through quantification of the bond strength and determination of atomic orbitals involved in coordination as well as a rationale for the experimental observations.Natural localized molecular orbital (NLMO) analysis affords the opportunity to analyze the molecular orbital constructs involved in metal–halide bonding as a function of NCI. An isodensity rendering of the naturally localized molecular orbitals involved in Te–X bonding for 1 and 5 as representative octahedra is shown in Fig. 12, where we clearly see a filled hybridized spx halide atomic orbital overlapping with an empty Te4+ 5p atomic orbital, forming a Te–X σ bond. At first glance there does not appear to be a large discrepancy between the orbital profiles of the [TeCl6]2− or [TeBr6]2− species.
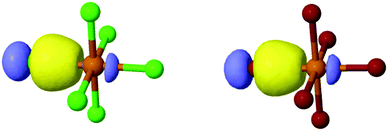 | ||
| Fig. 12 Naturally localized atomic orbitals involved in Te–X bonding for (left) [TeCl6]2− and (right) [TeBr6]2− taken from 1 and 5, respectively. | ||
Deconstruction of the Te–X bond into individual atomic components for 1–8 in Table 4, however, reveal subtle differences in atomic hybridization about the halide atom and Te4+ p orbital contribution as a function of second sphere influences. First, the halide contribution to the overall molecular bond is dominant (>74%) in all cases where the Te4+ atom contribution remains minor (<23%). No Te4+ s-orbitals are involved in bonding, leaving only unhybridized 5p atomic orbitals. For the [TeCl6]2− species, the halide s-character is 12–13% and p-character is 86–88%. A marked drop in halide s-character is observed for the corresponding [TeBr6]2− species with percent contributions 9–11% and corresponding p-character contributions ∼89.5%.
| Te–X | Halide | Metal | ||||
|---|---|---|---|---|---|---|
| Contribution (%) | s-Orbital (%) | p-Orbital (%) | Contribution (%) | p-Orbital (%) | ||
| 1 | Te–Cl | 80.5 | 12.9 | 86.9 | 18.3 | 98.0 |
| 2 | Te–Cl | 79.3 | 12.7 | 87.1 | 18.2 | 98.0 |
| 3 | Te–Cl | 79.6 | 12.7 | 87.1 | 18.3 | 98.0 |
| 4 | Te–Cl | 79.9 | 12.3 | 87.5 | 18.3 | 98.0 |
| 5 | Te–Br | 76.6 | 10.5 | 89.3 | 21.7 | 98.1 |
| 6 | Te–Br | 74.7 | 10.3 | 89.5 | 22.2 | 98.2 |
| 7 | Te–Br | 76.6 | 10.2 | 89.6 | 21.7 | 98.1 |
| 8 | Te–Br | 75.8 | 9.86 | 89.6 | 21.5 | 97.9 |
The reduction in halide s-character indicates a lowering of relative atomic orbital hybridization for the Te–Br bonds compared to Te–Cl bonds. In tandem with this behavior, the [TeBr6]2− species feature Te–X bonds with a higher Te4+ contribution from the p-orbitals compared to the chloro analogs. In 5–8, containing a [TeBr6]2− unit, the Te4+ p orbital contribution is >21% while for 1–4, containing a [TeCl6]2− unit, the Te4+ p orbital contribution is <19%. Most strikingly, the NLMO analysis points to the fact that both a lowering of halide hybridization and an increase in Te4+ p contribution are occurring simultaneously as a result of second sphere influences. For example, in 5–8 the Br 5s orbital contribution clearly decreases as the pyridinium halogen changes from H > Cl > Br > I (i.e. polarization). This shift in hybridization occurs irrespective of the overall halide contribution which shows no apparent change as a function of pyridinium substituent. The Te4+ participation in bonding, as measured either by contribution or hybridization, is unaffected in all cases by changes in the organic cation. The resistance to orbital reorganization presumably is due to shielding of the metal center by the coordinated halide atoms. NLMO metrics for individual Te–X bonds for compounds 1–8 can be found in Table S12 (ESI†).
Quantifying and isolating noncovalent interactions
Whereas we have described changes in Te–X bonding across the family, we nevertheless must quantify the strengths of the noncovalent interactions responsible for these changes as well as provide an orbital level description of the interactions involved. Second order perturbation theory (SOPT) calculations are particularly well suited to explore NCIs in molecular solids by providing (i) the interaction strength in kcal mol−1 as well as (ii) the atomic and molecular orbitals involved between ion pairs. Beyond simple electrostatic attraction, noncovalent interactions may also be explained by a charge transfer model,74–76 where the interaction arises from the electron transfer between paired orbitals designated as either an acceptor or donor. A charge transfer of electrons thus produces a stabilization effect whose energy can be calculated by SOPT. We have categorized the NCIs into four subgroups by acceptor atom identity: halogen⋯halogen, halogen⋯hydrogen, halogen⋯carbon pairs, and halogen⋯π and calculated the corresponding strengths for the three crystallographically unique Te–X bonds in 1–8. Quantified stabilization energies are presented in Table 5 and isodensity surfaces of representative molecular orbitals involved in noncovalent interactions from 3 and 7 are shown in Fig. 13.| TeX/XPy pairs | Halogen | Hydrogen | Carbon | π | Total | |
|---|---|---|---|---|---|---|
| kcal mol−1 | ||||||
| 1 | TeCl/HPy | 0.00 (0%) | 4.67 (59%) | 1.43 (18%) | 1.87 (23%) | 7.97 |
| 2 | TeCl/ClPy | 0.82 (8%) | 6.51 (61%) | 1.30 (12%) | 2.06 (19%) | 10.69 |
| 3 | TeCl/BrPy | 3.27 (26%) | 7.05 (55%) | 1.79 (14%) | 0.61 (5%) | 12.72 |
| 4 | TeCl/IPy | 2.54 (23%) | 5.83 (54%) | 1.50 (14%) | 0.95 (9%) | 10.82 |
| 5 | TeBr/HPy | 0.00 (0%) | 5.39 (60%) | 1.59 (18%) | 2.03 (23%) | 9.01 |
| 6 | TeBr/ClPy | 1.04 (9%) | 7.11 (59%) | 1.38 (12%) | 2.47 (21%) | 12.00 |
| 7 | TeBr/BrPy | 2.05 (16%) | 7.09 (56%) | 1.01 (8%) | 2.61 (20%) | 12.76 |
| 8 | TeBr/IPy | 2.30 (17%) | 8.92 (65%) | 0.97 (7%) | 1.62 (12%) | 13.81 |
 | ||
| Fig. 13 Dominant naturally localized molecular orbitals involved in noncovalent interactions for (top) 3 and (bottom) 7, as representatives, grouped by interaction type. | ||
Total stabilization energies for the interactions involving the Te–X bonds range between 7.97 kcal mol−1 (1) and 13.81 kcal mol−1 (8) indicating moderate stabilization.77,78 Halogen bonding contributes a minor portion towards the overall stabilization energy in all cases (excluding those involving HPy), ranging from 0.82 kcal mol−1 (2) to 3.27 kcal mol−1 (3). These halogen⋯halogen interactions are characterized by a typical charge transfer between donor orbitals of the metal-bound halide lone pair and acceptor orbitals of the C–X σ*. Hydrogen bonding contributes greatest to the overall NCI stabilization energy, accounting for >54% in all cases. Stabilization energy values ranges from 4.67 kcal mol−1 (1) to 8.92 kcal mol−1 (8). The charge transfer arises from interactions between a halide lone pair donor and a C/N–H σ* orbital acceptor. As expected, the strongest hydrogen bonding occurs at the protonated nitrogen of the cation as this hydrogen exhibits the highest electrostatic potential value. Weaker hydrogen bonding is realized with the remaining carbon bound hydrogen atoms.
Stabilization from halogen⋯π interactions fluctuate unpredictably in 1–8. In 3, these interactions only account for 5% of the total stabilization energy. But these values can swing upwards to 23% as in the case of 1 and 5. Generally speaking, the relative contribution of the π interaction appears to occur at the expense of the halogen bonding interaction. As seen in 1 and 3, relatively lower halogen bonding lends to greater π bonding while higher halogen bonding invokes weaker π bonding. Unexpectedly, appreciable stabilization in 1–8 occurs from interactions between the halogen and pyridinium C/N atoms. It is important to distinguish these interactions from hydrogen or π bonding since an H atom is not involved nor are C/N p orbitals associated with the π cloud. Instead, these interactions arise predominantly between the halide lone pairs (donors) and the C–C or C–N σ* molecular orbitals (acceptors). Here the sp2 hybridized C/N atomic orbitals have a minor lobe axial to the C–C or C–N bond that is directly canted towards the halide lone pairs and of the appropriate phase. The C–C or C–N σ* acceptor orbitals identify this charge transfer behavior as the recently reported noncovalent ‘carbon bonding’ interaction.79–82 As a recently classified NCI, we believe this is the first report of carbon bonding in a hybrid perovskite. Interestingly, this carbon bonding component can be comparable to or even greater than the π interactions, accounting for up to 18% of the total stabilization energies; calculated values range between 0.97 kcal mol−1 (8) and 1.79 kcal mol−1 (3).
Inspection of the SOPT calculations highlight that halogen bonding strength, as indicated by stabilization energy, does not necessarily follow the ‘polarization rule’ where greater polarizability yields stronger halogen bonding. From this polarization point of view, we expected 8, involving a Br⋯I pairing of highly polarizable halogen atoms, to display the strongest halogen bonding. Instead the strongest halogen bonding can be found in 3, involving a Cl⋯Br interaction. Critically, the SOPT data demonstrates that metal-bound halides always participate in charge transfer behavior as an electron donor where Cl atoms, having more negative electrostatic potentials, serve as better electron donors as compared to their Br analogs. As such, the better electron donor Cl in anionic [TeCl6]2− building units contribute to stronger interactions with acceptor pyridinium cations.
Moreover, we note the significance and frequency of carbon bonding contributions to overall stabilization in this family of materials. Calculated stabilization energies indicate these interactions are on par with halogen and π bonding in certain cases. As a recently realized NCI, these interactions are unreported in perovskite structures, yet we are beginning to evaluate them for their roles in materials assembly. Whereas we have identified their presence and calculated their energies, we hesitate to speculate on any possible influence of photophysical behavior. We draw attention to these interactions nevertheless to suggest further investigation thereof is warranted.
Structure and photophysical properties correlation
With the NCI strengths determined via stabilization energy we set about to correlate these interactions to the structural and photophysical behavior. Returning to crystallographically derived parameters, investigations of electronic and photophysical properties for higher-dimensional perovskites often focus on higher-dimensional features such as lattice distortions owing to ‘tilting’ between adjacent octahedra.83,84 For lower dimensional perovskites, however, distortion within the metal coordination sphere is more relevant for reconciling (for example) photophysical properties. In Table 6 we present the calculated octahedral distortion (Δd) for 1–8. Here, higher Δd values indicate greater deviation from the ideal Oh symmetry. Elongated Jahn–Teller distortion is realized for both [TeCl6]2− and [TeBr6]2− units with the chloro species showing significantly higher distortion than their bromo analogs. Moreover, Δd values rapidly diminish with increased halogen substituent size on the order of HPy > ClPy > BrPy > IPy.| Te–X1 | Te–X2 | Te–X3 | Δda | |
|---|---|---|---|---|
a Octahedral distortion (Δd) is expressed by the average difference in Te–X bond lengths by the equation  .85 .85
|
||||
| 1 | 2.5646 | 2.5280 | 2.5212 | 5.64 × 10⁻⁵ |
| 2 | 2.5648 | 2.5334 | 2.5302 | 3.77 × 10⁻⁵ |
| 3 | 2.5614 | 2.5355 | 2.5350 | 2.35 × 10⁻⁵ |
| 4 | 2.5561 | 2.5489 | 2.5434 | 0.416 × 10⁻⁵ |
| 5 | 2.7189 | 2.6889 | 2.6797 | 3.85 × 10⁻⁵ |
| 6 | 2.7201 | 2.6970 | 2.6934 | 1.91 × 10⁻⁵ |
| 7 | 2.7106 | 2.7006 | 2.6989 | 0.364 × 10⁻⁵ |
| 8 | 2.7083 | 2.7021 | 2.6960 | 0.345 × 10⁻⁵ |
With distortion parameters in hand, we correlate the structural, optical, and noncovalent interaction properties of 1–8 in Fig. 14 grouped by TeX species ([TeCl6]2− or [TeBr6]2−). These plots show the relationship between the stabilization energy, Wiberg bond index, octahedral distortion, and band gap energies. For the [TeCl6]2− species, the band gap energy decreases proportionately with lower octahedral distortion. In the [TeBr6]2− species this relationship is inverted, where a reduction in band gap energy is achieved by increasing the distortion about the Te4+ center. In turn the octahedral distortion and Wiberg index values for both species correlates well with the changes in stabilization energy, and thus NCI strength, demonstrating that Te–X bonding in the inner sphere can be modulated by surrounding NCIs. Additionally, the correlation plots show an inverse relationship towards NCIs in shifting the band gap energies between TeX species where stronger NCIs decrease the band gap energy for [TeCl6]2− and increase the energy for [TeBr6]2−. The exact mechanism by which this behavior arises presumably involves the ability of NCIs to indirectly affect the hybridization and atomic orbital participation about the halide atomic orbitals involved in Te–X bonding as evidenced by the shift in Te–X Wiberg bond and electron density values coupled with changes in halide s-character and Te4+ p orbital contribution. We believe this is the first report that definitively demonstrates active tuning of band gap energies of Te-based low dimensional perovskites via modulation of Te–X bonding by second sphere influences and warrants further detailed exploration.
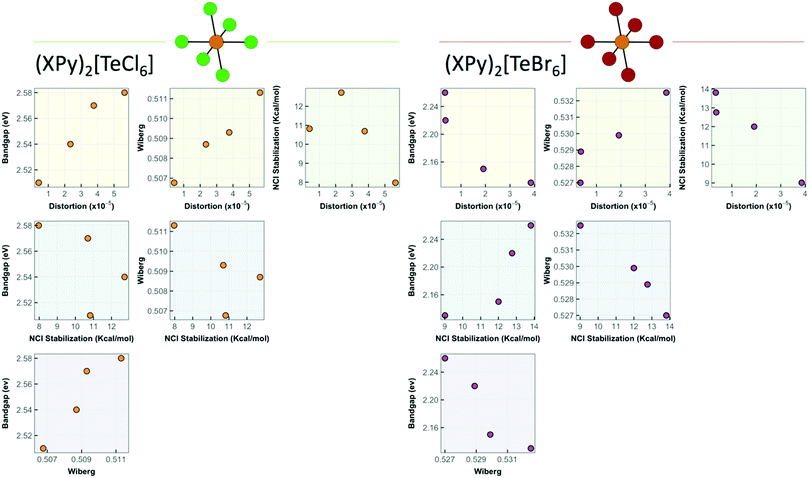 | ||
| Fig. 14 Correlation plots relating NCI stabilization energy, band gap energy, Wiberg index values, and octahedral distortion of 1–8. | ||
Conclusions
We have synthesized and characterized a series of eight Te4+ halide perovskite-derivatives containing isolated anionic [TeX6]2− octahedra charge balanced by halopyridinium cations. These materials organize into supramolecular assemblies via noncovalent hydrogen and halogen bonding between ion pairs. Spectroscopic measurements of 1–8 reveal semi conductive band gap energies despite being zero-dimensional. Measured band gap energies show surprising tunability as a function of TeX speciation as well as halogen substituent on the pyridinium cation. In [TeCl6]2− compounds, a more polarizable halogen on the pyridinium cation decreases the band gap energy, whereas for [TeBr6]2 compounds, greater polarization leads to an increase in band gap energy. Density of state calculations reveal that the origin of absorption is a mixed halide/metal to ligand charge transfer in all cases, and features a hybridized HOMO composed of metal s-states and halide p-states. Moreover, natural bonding orbital calculations used to quantify the strength of NCIs reveal the presence of ‘carbon bonding’ interactions between halide lone pairs and C–C or C–N σ* molecular orbitals. This is the first report of these relatively unexplored NCIs in low dimensional perovskites, and further investigation of their role(s) is warranted. Finally, our comprehensive analysis of the tellurium–halide bonds shows that second sphere noncovalent interactions directly influence the photophysical properties of 1–8 by altering the inner sphere orbital constructs involved in bonding. These findings highlight a new avenue for influencing the photophysical properties of low dimensional hybrid perovskite materials by promoting and manipulating noncovalent interactions between inorganic and organic components.Conflicts of interest
There are no conflicts to declare.Acknowledgements
This work was supported by the Columbian College of Arts and Sciences at the George Washington University. Additinal support for LCG came from a Luther Rice Undergraduate Research Fellowship at GW.Notes and references
- D. Weber, Z. Naturforsch., B: Anorg. Chem., Org. Chem., 1978, 33, 1443–1445 Search PubMed.
- D. B. Mitzi, 2007, pp. 1–121.
- B. Saparov and D. B. Mitzi, Chem. Rev., 2016, 116, 4558–4596 CrossRef CAS.
- A. K. Jena, A. Kulkarni and T. Miyasaka, Chem. Rev., 2019, 119, 3036–3103 CrossRef CAS.
- M. A. Green, A. Ho-Baillie and H. J. Snaith, Nat. Photonics, 2014, 8, 506–514 CrossRef CAS.
- W. S. Yang, B.-W. Park, E. H. Jung, N. J. Jeon, Y. C. Kim, D. U. Lee, S. S. Shin, J. Seo, E. K. Kim, J. H. Noh and S. Seok, Science, 2017, 356, 1376–1379 CrossRef CAS.
- R. Azmi, N. Nurrosyid, S.-H. Lee, M. Al Mubarok, W. Lee, S. Hwang, W. Yin, T. K. Ahn, T.-W. Kim, D. Y. Ryu, Y. R. Do and S.-Y. Jang, ACS Energy Lett., 2020, 5, 1396–1403 CrossRef CAS.
- NREL, Best Research-Cell Efficiency Chart, https://www.nrel.gov/pv/cell-efficiency.html, accessed 26 September 2020.
- Q. Sun, W.-J. Yin and S.-H. Wei, J. Mater. Chem. C, 2020, 8, 12012–12035 RSC.
- M. D. Smith, B. A. Connor and H. I. Karunadasa, Chem. Rev., 2019, 119, 3104–3139 CrossRef CAS.
- D. Han, H. Shi, W. Ming, C. Zhou, B. Ma, B. Saparov, Y.-Z. Ma, S. Chen and M.-H. Du, J. Mater. Chem. C, 2018, 6, 6398–6405 RSC.
- H. Fu, Sol. Energy Mater. Sol. Cells, 2019, 193, 107–132 CrossRef CAS.
- R. Nie, R. R. Sumukam, S. H. Reddy, M. Banavoth and S. Il Seok, Energy Environ. Sci., 2020, 13, 2363–2385 RSC.
- X. Wang, T. Zhang, Y. Lou and Y. Zhao, Mater. Chem. Front., 2019, 3, 365–375 RSC.
- W. Yang, F. Igbari, Y. Lou, Z. Wang and L. Liao, Adv. Energy Mater., 2020, 10, 1902584 CrossRef CAS.
- A. Toshniwal and V. Kheraj, Sol. Energy, 2017, 149, 54–59 CrossRef CAS.
- M. Konstantakou and T. Stergiopoulos, J. Mater. Chem. A, 2017, 5, 11518–11549 RSC.
- Z. Jin, Z. Zhang, J. Xiu, H. Song, T. Gatti and Z. He, J. Mater. Chem. A, 2020, 8, 16166–16188 RSC.
- K. V. Vasudevan, B. L. Scott and J. C. Gordon, Main Group Chem., 2012, 11, 45–52 CAS.
- A. Michelet, P. Toffoli and N. Rodier, Acta Crystallogr., Sect. C: Cryst. Struct. Commun., 1986, 42, 413–415 CrossRef.
- A. A. Dotsenko, O. L. Shcheka and V. I. Vovna, J. Struct. Chem., 2017, 58, 1090–1100 CrossRef CAS.
- T. V. Storozhuk, B. V. Bukvetskii, A. G. Mirochnik and V. E. Karasev, J. Struct. Chem., 2003, 44, 880–884 CrossRef CAS.
- B. V. Bukvetskii and A. G. Mirochnik, J. Struct. Chem., 2005, 46, 672–682 CrossRef CAS.
- B. V. Bukvetskii, T. V. Sedakova and A. G. Mirochnik, J. Struct. Chem., 2012, 53, 306–312 CrossRef CAS.
- S. Smaoui, A. Kabadou, A. Van Der Lee, A. Ben Salah and M. Abdelmouleh, J. Saudi Chem. Soc., 2018, 22, 155–164 CrossRef CAS.
- N.-N. Shen, M.-L. Cai, Y. Song, Z.-P. Wang, F.-Q. Huang, J.-R. Li and X.-Y. Huang, Inorg. Chem., 2018, 57, 5282–5291 CrossRef CAS.
- V. R. Shayapov, A. N. Usoltsev, S. A. Adonin, M. N. Sokolov, D. G. Samsonenko and V. P. Fedin, New J. Chem., 2019, 43, 3927–3930 RSC.
- T. V. Sedakova and A. G. Mirochnik, Opt. Spectrosc., 2016, 120, 268–273 CrossRef CAS.
- T. V. Sedakova, A. G. Mirochnik and V. E. Karasev, Opt. Spectrosc., 2011, 110, 755–761 CrossRef CAS.
- D. J. Stufkens, Recl. Trav. Chim. Pays-Bas, 2010, 89, 1185–1201 CrossRef.
- A. N. Usoltsev, S. A. Adonin, A. S. Novikov, D. G. Samsonenko, M. N. Sokolov and V. P. Fedin, CrystEngComm, 2017, 19, 5934–5939 RSC.
- A. V. Novikov, A. N. Usoltsev, S. A. Adonin, A. A. Bardin, D. G. Samsonenko, G. V. Shilov, M. N. Sokolov, K. J. Stevenson, S. M. Aldoshin, V. P. Fedin and P. A. Troshin, J. Mater. Chem. A, 2020, 8, 21988–21992 RSC.
- A. N. Usoltsev, S. A. Adonin, P. A. Abramov, A. S. Novikov, V. R. Shayapov, P. E. Plyusnin, I. V. Korolkov, M. N. Sokolov and V. P. Fedin, Eur. J. Inorg. Chem., 2018, 3264–3269 CrossRef CAS.
- A. N. Usoltsev, S. A. Adonin, A. S. Novikov, M. N. Sokolov and V. P. Fedin, J. Coord. Chem., 2019, 72, 1890–1898 CrossRef CAS.
- C. J. Carmalt, N. C. Norman and L. J. Farrugia, Polyhedron, 1995, 14, 1405–1413 CrossRef CAS.
- E. Faoro, G. M. de Oliveira, E. S. Lang and C. B. Pereira, J. Organomet. Chem., 2010, 695, 1480–1486 CrossRef CAS.
- R. M. Fernandes, G. M. de Oliveira, E. Schulz Lang and E. M. Vazquez-Lopez, Z. Anorg. Allg. Chem., 2004, 630, 2687–2691 CrossRef CAS.
- S. Sato, H. Ishida, M. Nagae, S. Kashino, Y. Furukawa and A. Weiss, J. Mol. Struct., 1998, 441, 39–46 CrossRef CAS.
- A. N. Usoltsev, S. A. Adonin, P. E. Plyusnin, P. A. Abramov, I. V. Korolkov, M. N. Sokolov and V. P. Fedin, Polyhedron, 2018, 151, 498–502 CrossRef CAS.
- P. Khodadad, B. Viossat, P. Toffoli and N. Rodier, Acta Crystallogr., Sect. B: Struct. Crystallogr. Cryst. Chem., 1979, 35, 2896–2899 CrossRef.
- J. M. Ryan and Z. Xu, Inorg. Chem., 2004, 43, 4106–4108 CrossRef CAS.
- D. A. Egger, J. Phys. Chem. Lett., 2018, 9, 4652–4656 CrossRef CAS.
- S. A. Adonin, L. A. Frolova, M. N. Sokolov, G. V. Shilov, D. V. Korchagin, V. P. Fedin, S. M. Aldoshin, K. J. Stevenson and P. A. Troshin, Adv. Energy Mater., 2018, 8, 1701140 CrossRef.
- A. D. Nicholas, R. N. Halli, L. C. Garman and C. L. Cahill, J. Phys. Chem. C, 2020, 124, 25686–25700 CrossRef CAS.
- SAINT Version 8.34a, 2013 Search PubMed.
- G. M. Sheldrick, SADABS, 2005.
- G. M. Sheldrick, Acta Crystallogr., Sect. A: Found. Crystallogr., 2008, 64, 112–122 CrossRef CAS.
- C. B. Huebschle, G. M. Sheldrick and B. Dittrich, J. Appl. Crystallogr., 2011, 44, 1281–1284 CrossRef CAS.
- M. J. Frisch, G. W. Trucks, H. B. Schlegel, G. E. Scuseria, M. A. Robb, J. R. Cheeseman, G. Scalmani, V. Barone, B. Mennucci, G. A. Petersson, H. Nakatsuji, M. Caricato, X. Li, H. P. Hratchian, A. F. Izmaylov, J. Bloino, G. Zheng, J. L. Sonnenberg, M. Hada, M. Ehara, K. Toyota, R. Fukuda, J. Hasegawa, M. Ishida, T. Nakajima, Y. Honda, O. Kitao, H. Nakai, T. Vreven, J. A. Montgomery, J. E. Peralta Jr., F. Ogliaro, M. Bearpark, J. J. Heyd, E. Brothers, K. N. Kudin, V. N. Staroverov, R. Kobayashi, J. Normand, K. Raghavachari, A. Rendell, J. C. Burant, S. S. Iyengar, J. Tomasi, M. Cossi, N. Rega, J. M. Millam, M. Klene, J. E. Knox, J. B. Cross, V. Bakken, C. Adamo, J. Jaramillo, R. Gomperts, R. E. Stratmann, O. Yazyev, A. J. Austin, R. Cammi, C. Pomelli, J. W. Ochterski, R. L. Martin, K. Morokuma, V. G. Zakrzewski, G. A. Voth, P. Salvador, J. J. Dannenberg, S. Dapprich, A. D. Daniels, O. Farkas, J. B. Foresman, J. V. Ortiz, J. Cioslowski and D. J. Fox, Gaussian 16, Revision B.01, Gaussian, Inc., Wallingford CT, 2016 Search PubMed.
- A. D. Becke, J. Chem. Phys., 1993, 98, 5648–5652 CrossRef CAS.
- C. Lee, W. Yang and R. G. Parr, Phys. Rev. B: Condens. Matter Mater. Phys., 1988, 37, 785–789 CrossRef CAS.
- F. Weigend and R. Ahlrichs, Phys. Chem. Chem. Phys., 2005, 7, 3297 RSC.
- F. Weigend, Phys. Chem. Chem. Phys., 2006, 8, 1057 RSC.
- M. Borovina, I. Kodrin and M. Đaković, Cryst. Growth Des., 2019, 19, 1985–1995 CrossRef CAS.
- M. Borovina, I. Kodrin and M. Đaković, CrystEngComm, 2018, 20, 539–549 RSC.
- T. Lu and F. Chen, J. Comput. Chem., 2012, 33, 580–592 CrossRef CAS.
- S. Smaoui, A. Kabadou, A. Van Der Lee, A. Ben Salah and M. Abdelmouleh, J. Saudi Chem. Soc., 2018, 22, 155–164 CrossRef CAS.
- A. Bondi, J. Phys. Chem., 1964, 68, 441–451 CrossRef CAS.
- G. Cavallo, P. Metrangolo, R. Milani, T. Pilati, A. Priimagi, G. Resnati and G. Terraneo, Chem. Rev., 2016, 116, 2478–2601 CrossRef CAS.
- C. Janiak, J. Chem. Soc., Dalton Trans., 2000, 3885–3896 RSC.
- S. A. Adonin, I. D. Gorokh, A. S. Novikov, P. A. Abramov, M. N. Sokolov and V. P. Fedin, Chem. – Eur. J, 2017, 23, 15612–15616 CrossRef CAS.
- S. A. Adonin, I. D. Gorokh, A. S. Novikov, D. G. Samsonenko, I. V. Yushina, M. N. Sokolov and V. P. Fedin, CrystEngComm, 2018, 20, 7766–7772 RSC.
- P. Politzer, J. S. Murray and T. Clark, Phys. Chem. Chem. Phys., 2013, 15, 11178 RSC.
- P. Sjoberg and P. Politzer, J. Phys. Chem., 1990, 94, 3959–3961 CrossRef CAS.
- T. Clark, M. Hennemann, J. S. Murray and P. Politzer, J. Mol. Model., 2007, 13, 291–296 CrossRef CAS.
- W.-J. Yin, T. Shi and Y. Yan, J. Phys. Chem. C, 2015, 119, 5253–5264 CrossRef CAS.
- J. S. Manser, J. A. Christians and P. V. Kamat, Chem. Rev., 2016, 116, 12956–13008 CrossRef CAS.
- G. E. Eperon, S. D. Stranks, C. Menelaou, M. B. Johnston, L. M. Herz and H. J. Snaith, Energy Environ. Sci., 2014, 7, 982 RSC.
- B. Suarez, V. Gonzalez-Pedro, T. S. Ripolles, R. S. Sanchez, L. Otero and I. Mora-Sero, J. Phys. Chem. Lett., 2014, 5, 1628–1635 CrossRef CAS.
- J. H. Noh, S. H. Im, J. H. Heo, T. N. Mandal and S. Il Seok, Nano Lett., 2013, 13, 1764–1769 CrossRef CAS.
- P.-P. Sun, D. R. Kripalani, M. Hao, W. Chi, W. Li and K. Zhou, J. Phys. Chem. Lett., 2020, 11, 5234–5240 CrossRef CAS.
- J. H. Lee, J.-H. Lee, E.-H. Kong and H. M. Jang, Sci. Rep., 2016, 6, 21687 CrossRef CAS.
- E. Mosconi, A. Amat, M. K. Nazeeruddin, M. Grätzel and F. De Angelis, J. Phys. Chem. C, 2013, 117, 13902–13913 CrossRef CAS.
- M. Loipersberger, Y. Mao and M. Head-Gordon, J. Chem. Theory Comput., 2020, 16, 1073–1089 CrossRef CAS.
- S. V. Rosokha, I. S. Neretin, T. Y. Rosokha, J. Hecht and J. K. Kochi, Heteroat. Chem., 2006, 17, 449–459 CrossRef CAS.
- V. Angarov and S. Kozuch, New J. Chem., 2018, 42, 1413–1422 RSC.
- P. Hobza, Acc. Chem. Res., 2012, 45, 663–672 CrossRef CAS.
- J. C. Flick, D. Kosenkov, E. G. Hohenstein, C. D. Sherrill and L. V. Slipchenko, J. Chem. Theory Comput., 2012, 8, 2835–2843 CrossRef CAS.
- V. R. Mundlapati, D. K. Sahoo, S. Bhaumik, S. Jena, A. Chandrakar and H. S. Biswal, Angew. Chem., 2018, 130, 16734–16738 CrossRef.
- S. P. Thomas, M. S. Pavan and T. N. Guru Row, Chem. Commun., 2014, 50, 49–51 RSC.
- D. Quiñonero, Phys. Chem. Chem. Phys., 2017, 19, 15530–15540 RSC.
- E. C. Escudero-Adán, A. Bauzá, A. Frontera and P. Ballester, ChemPhysChem, 2015, 16, 2530–2533 CrossRef.
- D. Ghosh, A. R. Smith, A. B. Walker and M. S. Islam, Chem. Mater., 2018, 30, 5194–5204 CrossRef CAS.
- L. Qiao, X. Sun and R. Long, J. Phys. Chem. Lett., 2019, 10, 672–678 CrossRef.
- J. A. Alonso, M. J. Martínez-Lope, M. T. Casais and M. T. Fernández-Díaz, Inorg. Chem., 2000, 39, 917–923 CrossRef CAS.
Footnote |
| † Electronic supplementary information (ESI) available: Description of crystallographic structures, DFT derived ESPs, Tauc plot, additional NBO/NLMO calculations, TD-DFT calculations, and QTAIM details. CCDC 2033160–2033167 and 2042032–2042035. For ESI and crystallographic data in CIF or other electronic format see DOI: 10.1039/d0tc06000c |
| This journal is © The Royal Society of Chemistry 2021 |


