 Open Access Article
An automated computational approach to kinetic model discrimination and parameter estimation†
Connor J.
Taylor
 a,
Hikaru
Seki
 b,
Friederike M.
Dannheim
 b,
Mark J.
Willis
c,
Graeme
Clemens
d,
Brian A.
Taylor
d,
Thomas W.
Chamberlain
 *a and
Richard A.
Bourne
 *a
*a
aInstitute of Process Research and Development, School of Chemistry and School of Chemical and Process Engineering, University of Leeds, Leeds, LS2 9JT, UK. E-mail: t.w.chamberlain@leeds.ac.uk; R.A.Bourne@leeds.ac.uk
bDepartment of Chemistry, University of Cambridge, Cambridge, CB2 1EW, UK
cSchool of Engineering, University of Newcastle, Newcastle upon Tyne, NE1 7RU, UK
dChemical Development, Pharmaceutical Technology & Development, Operations, AstraZeneca, Macclesfield, UK
First published on 7th May 2021
Abstract
We herein report experimental applications of a novel, automated computational approach to chemical reaction network (CRN) identification. This report shows the first chemical applications of an autonomous tool to identify the kinetic model and parameters of a process, when considering both catalytic species and various integer and non-integer orders in the model's rate laws. This kinetic analysis methodology requires only the input of the species within the chemical system (starting materials, intermediates, products, etc.) and corresponding time-series concentration data to determine the kinetic information of the chemistry of interest. This is performed with minimal human interaction and several case studies were performed to show the wide scope and applicability of this process development tool. The approach described herein can be employed using experimental data from any source and the code for this methodology is also provided open-source.
Introduction
Rapid process development can be critical for the commercial success of new chemical products. For example, within the pharmaceutical industry time-to-market from initial discovery is one of the most important factors for companies to maximise commercial viability.1 As the cost of this product development can be up to 35% of the total cost of bringing a new drug to market,2 there is an emphasis on fast and efficient process optimisation and scale-up of active pharmaceutical ingredients (APIs).3–5 Ideally to achieve this a detailed understanding of all elements of the process in question is required, including fundamental synthetic chemistry considerations such as the reaction mechanism and kinetics, and the effects of chemical engineering aspects such as transport phenomena (transfer of heat, mass etc.). Statistical techniques are commonly used to map the design space during process development in modern industrial labs typically through a design of experiments (DoE) approach,6–8 with closed loop algorithm methods also becoming more popular.9–11 However, a more robust description of the process can be determined by developing an accurate mechanistic rate model of the chemical reaction steps.”12,13Such kinetic models can be complex and occur over many reaction steps, involving many measurable and immeasurable intermediates. This allows quantitative chemical synthesis information to be obtained, allowing classical reaction engineering principles to be applied to shorten process development times and lower costs.14 In these instances, obtaining stoichiometric and kinetic descriptions of the individual transformations is often more important than detailed mechanistic insights and rationales.15 For a system involving multiple reactions, each featuring multiple species with differing stoichiometric coefficients and respective kinetic parameters, this is referred to as a chemical reaction network (CRN). Upon determination of a CRN, mathematical relationships are thereby established between participating species, allowing simulations and process engineering to drive reaction understanding and ultimately optimise chemical systems through a reduction in laboratory experiments.16–18 However, in this report we will be explicitly focussing on the identification of the process CRN from apparent kinetics; for further discussions on the scale-up of chemical processes, refer to work by Levin19 and Khang and Levenspiel.20
There are many reports in the literature involving the use of computation to evaluate aspects of a CRN,21–27 many of which are based on work reported by Aris and Mah,28 then later Bonvin and Rippin.29 However, there are no CRN identification tools to date that identify catalytic reaction pathways or non-integer species orders, which greatly limits the applicability of these techniques for many chemical systems. Other techniques have also emerged, such as the use of model-based design of experiments (MBDoE) for various applications.30–35 Whilst there is an increased scope for this methodology, assigning a model may be difficult for noisy systems due to standalone measurements in otherwise empty chemical space.36 Furthermore, expert chemical intuition is necessary in compiling initial model candidate sets for evaluation and many models may be excluded based on their presumed inability to occur.
We recently illustrated the first experimental application of a comprehensive CRN determination methodology,37 initially reported by Tsu et al.14 This machine-learning-based tool identifies and evaluates all possible kinetic models, then uses statistical analysis to establish which model is most likely to be correct. The user simply inputs the mass of each participating species and experimental data, then the approach autonomously identifies the most likely CRN. This paper reports significant improvements to this technique, including how the scope of application has been expanded to zero- and non-integer-order reactions and catalytic processes. This work represents the first CRN determination tool in the literature with these capabilities. Two new experimental case studies are herein reported and one further case study was revisited due to the applicability of this tool to its unusual and complex kinetic model. The methodology can be used with data from any source and any analytical technique, although this work features exclusively reactions in batch using both NMR sampling and HPLC analysis. This upgraded open-source tool serves as a comprehensive, automated resource for the process development of almost any chemistry, where scalable process understanding can be achieved with minimal need for high-level chemical intuition.38
The approach
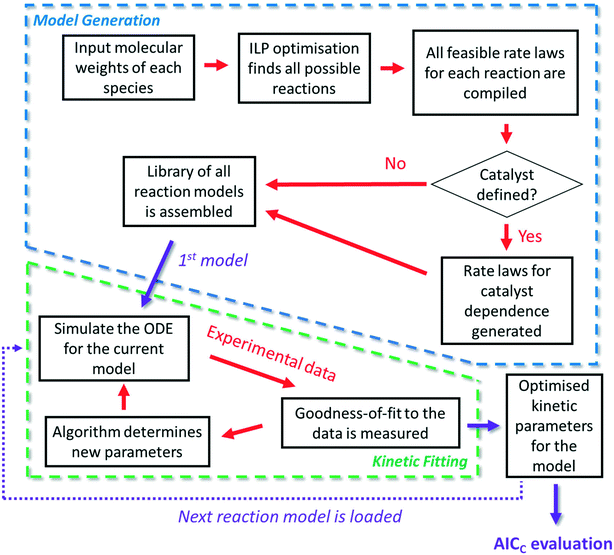
It is firstly important to note that following from the initial inputs of the measurable species of interest and the experimental time-series data, the approach behaves as a black box to identify the most likely reaction model and corresponding kinetic parameters. Initially, every possible chemical transformation is identified based on mass balance alone using an integer linear programming (ILP) optimiser. All feasible rate laws for these reactions are then constructed – this relates to different allowed species orders: 0, 0.5 and 1. These species orders are considered as they are the most likely to be encountered, whereas further non-integer orders are not considered due to their rarity and significantly increased computational burden their inclusion would cause. If a catalytic species is also present, this is incorporated into the respective rate laws at this point. Each of these reactions can then be treated as building blocks for potential CRNs. Every combination of these reactions (and therefore every possible CRN) is then built and saved to a CRN library, therefore describing the chemistry in every feasible way – this stage of the approach is referred to as the model generation stage. The total number of possible models, η, is equal to the sum of the binomial coefficients for every number of individual reaction rate laws in the model, up to the total number of possible reactions, δ, as shown in eqn (1): | (1) |
The second stage of the approach relates to the suitability of each individual CRN, or model, to the supplied experimental data, referred to as the kinetic fitting stage. A cycle is conducted as a CRN is loaded, then a gradient-based local minimisation algorithm is used to optimise kinetic parameters and fit simulated kinetic curves to the data points using the CRN's respective rate laws, thereby measuring the convergence of the CRN to the chemical data. These simulated kinetic curves are referred to as ordinary differential equations (ODEs), as they are a result of solving a linked set of differential equations. The sum of squared error (SSE) measurement between the measured (experimental) and estimated (simulated) concentrations is the objective function that is minimised to ensure maximum convergence of the model to the data. This SSE value is calculated using eqn (2), where NData is the number of data points sampled, Ej is the jth experimental point and Sj is the jth simulated point:
 | (2) |
 | (3) |
This approach serves as an automated tool that removes high-level chemical expertise from both model and kinetic parameter determination during process development. Conducting this model discrimination, without chemical intuition, creates a system whereby a model is identified based purely on the most statistically accurate and quantitative physical-organic description of the chemistry. This allows experts to spend their human resource on more challenging aspects of process development that cannot be otherwise automated, including critically appraising the resultant list of model candidates. For example, after this initial model discrimination experts can alter the identified CRN based on perceptions of chemistries that are unlikely to be true, as model terms may be included due to anomalies in the experimental data provided. More advanced engineering principles may also be applied or further experiments may be prescribed by experts to discriminate between the list of ranked CRNs generated.
Results and discussion
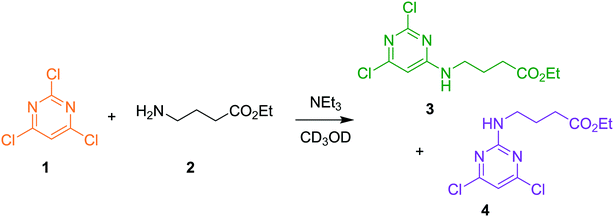
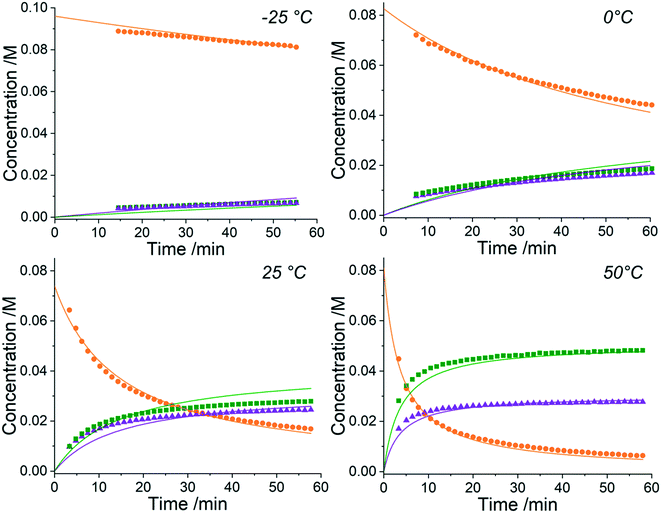
The approach can receive inputs from many different analytical sources and the implementation, scope and accuracy of this methodology was demonstrated via several pharmaceutically relevant case studies. The first case study of interest is the SNAr reaction of 2,4,6-trichloropyrimidine, 1, with ethyl 4-aminobutanoate, 2, to form the major 4-substituted product, 3, and the minor 2-substituted product, 4, and forming HCl, 5, after each step - this is shown in the presupposed model in Scheme 1. As the desired major product from this reaction can be further functionalised to synthesise bioactive derivatives of pharmaceuticals,40,41 this initial transformation is of interest in the transfer of these molecules to scale up, meaning that kinetic information would be very useful for process development.Experiments were undertaken at various temperatures between −25 °C and 50 °C using an NMR tube within a 500 MHz NMR machine with a constant acquisition rate, thereby obtaining complete reaction profiles. This experimental data could then be inputted into the computational approach, as well as the species involved (1–5) to identify all possible elementary reactions. Every combination of these reactions (in every form of their corresponding rate laws) were then constructed and comprehensively assessed, resulting in 3320 unique model evaluations. It was found via AICC analysis that the most likely model is the reaction model shown in Scheme 1 with a first-order dependence of both 1 and 2 in forming the major and minor products. The approach also determined the kinetic parameters of the transformation to the major product: k25°C = 0.499 ± 0.006 M−1 min−1, Ea = 44.19 ± 0.57 kJ mol−1 and to the minor product: k25°C = 0.384 ± 0.009 M−1 min−1, Ea = 36.57 ± 0.88 kJ mol−1. In this example the user has only inputted the experimental data, the molecular weights of each of the species and indicated that the reaction is not catalytic. All kinetic analysis was then performed autonomously, producing the list of ranked CRNs to be evaluated by a trained chemist shown in Table 1. After appraisal, this newly obtained information can subsequently be used to significantly shorten the overall process development time during pharmaceutical manufacture. The top-ranked model and the corresponding kinetic parameters allowed a fit to the experimental data with an average residual of less than 0.3% and is shown in Fig. 2. Full experimental details and raw data can be found in the ESI† (Section 3).
| Rank | Reaction model | Kinetic parameters | SSE/103 M | AICC | |
|---|---|---|---|---|---|
| k 25°C/Mα min−1 | E a/kJ mol−1 | ||||
| 1 | 1 + 2 → 3 + 5 | 0.499 | 44.19 | 1.614 | −51.91 |
| 1 + 2 → 4 + 5 | 0.384 | 36.57 | |||
| 2 | 1 + 2 → 3 + 5 | 0.407 | 40.61 | 3.723 | −48.57 |
| 1 + 20.5 → 4 + 5 | 0.073 | 31.01 | |||
| 3 | 1 + 2 → 3 + 5 | 0.466 | 42.25 | 3.777 | −48.51 |
| 10 + 2 → 4 + 5 | 0.017 | 27.56 | |||
It is clear from the kinetic plots that the fit of the ODEs to the experimental data do not result in normally-distributed residuals. This could be for one of many reasons but is most likely due to either NMR integrations errors, evaporation of solvent (CD3OD) into the headspace at higher temperatures or changes in solvent viscosity at these differing temperatures. It is also possible that liberation of HCl as the reaction progresses forms rapid equilibria with the base, NEt3, and partial protonation of the nucleophile leading to reduced reactivity. Although this approach can automatically determine the most likely reaction model and kinetic parameters from experimental data, all of these factors must still be considered by a trained chemist upon completion of the computation to confirm the methodology output. In this case, however, the residuals are only a small consideration and it can be observed that the model still provides a good fit to the data. This kinetic information can then be used to optimise this process for the highest yields of the 4-substituted product, 3, when scaling up production of the material.
The next case study conducted was a chemical system featuring the protection of an amino acid for further functionalisation, where alanine methyl ester (Al-Me), 6, reacts with 9-bromo-9-phenylfluorene (PfBr), 7, to form the protected amino acid (Pf-Al-Me), 8, and hydrobromic acid, 9, as shown in Scheme 2 as a presupposed model. PfBr is the reagent used to introduce the 9-phenylfluorene (Pf) protecting group in synthesis. Pf is a pharmaceutically relevant and bulky protecting group, that can be introduced as a more acid stable alternative to the more commonly used trityl group.42,43 This case study is the protection step involved in the total synthesis of (S)-eleagnine from L-alanine. Therefore, understanding this transformation by performing kinetic analysis would lower costs and accelerate process development in the overall bioactive alkaloid manufacture,44 following promising reports of potent analgesic properties.45
Three experiments were run between 30 °C and 40 °C in a batch vessel, then the four identified species (6–9) and all experimental data were inputted into the computational approach. In this system a heterogeneous base, K3PO4, was added to remove the HBr as it formed. Two feasible mass-balance-allowed reactions were calculated, then each combination of these reactions (in every variant of their rate laws) were assessed by the approach automatically, resulting in 30 unique model evaluations. The most likely representation of the model was identified by the approach as the presupposed forward reaction shown in Scheme 2, with a first-order dependence on PfBr (7) and a zero-order dependence on Al-Me (6). This has not been reported elsewhere in the literature, but this discovery makes chemical sense as the bulky aromatic rings would stabilise the cation formed, should the reaction proceed via a traditional SN1 mechanism; this means that the rate-determining step is likely to be the loss of the bromide ion, followed by a fast nucleophilic addition by the alanine methyl ester. The approach also determined the kinetic parameters of this transformation to be k35°C = 1.06 × 10⁻² ± 0.01 × 10⁻² min−1, Ea = 62.91 ± 0.23 kJ mol−1. This example further proves how using this automated methodology in conjunction with chemical study helps to both elucidate reaction mechanisms and gain process understanding for real-life applications. The top-ranked model and corresponding parameters allowed a fit to the experimental data with an average residual of less than 0.4% and is shown in Fig. 3. Full experimental details, raw data and model rankings can be found in the ESI† (Section 4).
The final case study explored was the chemical system involving maleic acid, 10, reacting with methanol, 11, to form the monomethylated maleic acid ester (mono-product), 12, and the dimethylated maleic acid ester (di-product), 13, each liberating a molecule of water, 14, as shown in the presupposed model in Scheme 3. Our collaborators at AstraZeneca were interested in this reaction following the contamination of a batch of an API maleate salt with the corresponding monomethyl maleate salt, as this contamination could be mitigated if the impurity formation was well understood.
Kinetic experiments were run using this system and the findings were published, as it was found that the reaction forming the mono-product was self-catalytic.46 In this case, the reaction was found to be catalytic with an order of 0.5, meaning that the overall order with respect to the maleic acid was 1.5 in forming the mono-product. The consecutive reaction forming the di-product is also catalytic with respect to the maleic acid with a 0.5 order dependence. As methanol is the solvent in this reaction with an effective concentration of ∼24 M, pseudo-order conditions are assumed and rate laws with non-zero-order dependence on methanol were removed from consideration for simplicity. Although the kinetics of this process are now known and reported, it took several months for physical-organic chemists to decipher this model as the reactivity is not immediately intuitive. Therefore, this case study was run to validate the approach in elucidating non-intuitive reaction models, and how this methodology can serve as a viable, automated substitute for many hours spent on a project by experts that could be working on other aspects of process development.
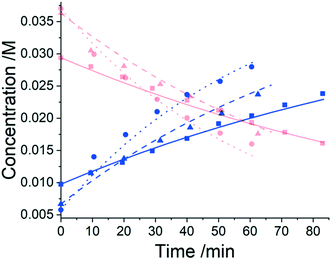
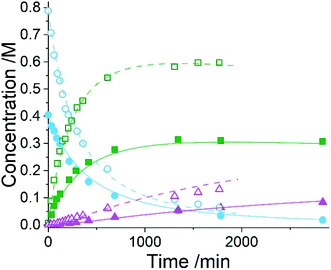
Five experiments were conducted in batch at differing starting concentrations and temperatures in the range of 40 °C to 60 °C and analysed using 1H NMR sampling. This experimental data and the five species (10–14) were inputted into the approach, resulting in six mass-balance-allowed transformations identified. The catalyst was defined, then every combination of these catalytic reactions (and corresponding rate law variants) were compiled into different reaction models, resulting in 5086 automatic unique model evaluations. Each of these models were then ranked based on their AICC and it was found that the most likely representation of the system is the reaction model shown in Scheme 3, but each step is catalysed by maleic acid with an apparent species order dependence of 0.5. These are the same findings that our collaborators made during their kinetic analysis, as they also employed a pragmatic approximation of a 0.5 catalytic order in maleic acid due to the observation of specific acid catalysis. The approach also determined the kinetic parameters of this transformation to be: kmono 50°C = 3.85 × 10⁻³ ± 0.01 × 10⁻³ M−0.5 min−1, Ea = 72.61 ± 0.12 kJ mol−1 and kdi 50°C = 4.66 × 10⁻⁴ ± 0.01 × 10⁻⁴ M−0.5 min−1, Ea = 69.74 ± 0.10 kJ mol−1. These parameters are in agreement with those obtained by our collaborators. This model and the corresponding kinetic parameters allowed a fit to the experimental data with an average residual of less than 0.2% and two experimental fittings at 50 °C are shown in Fig. 4. Full experimental details, raw data and model rankings can be found in the ESI† (Section 5).
As the model was already identified by our collaborators, this methodology has corroborated their findings and shown that process understanding can be accelerated using this approach. This approach automatically identified the correct reaction model in ∼17 hours of computational time, whereas the more traditional science-led approach took appreciably longer with significant human resource required. Clearly the use of this comprehensive model-based approach would be an asset to kinetic specialists during similar case studies when there is significant time pressure to find robust solutions to manufacturing problems identified.
Conclusion
It has been shown from these case studies that in using this computational methodology as a black box approach, scalable process understanding can be automatically achieved without the need for high-level chemical intuition in the model determination and parameter estimation steps. The widened scope of this new approach has been proven to be effective in three experimental case studies, each with differing rate laws and kinetic structural motifs. The efficiency and accuracy of the approach remain robust in all cases, when observing ‘typical’ kinetic models where each species has a first-order dependence, for zero-order and non-integer rate laws and for catalytic species of variable integer- and non-integer-orders.It has also been shown from these case studies that using this methodology can greatly accelerate process development and reduce the workload of kinetic analysis for physical-organic chemists. After experimentation, all kinetic analysis can be implemented autonomously whilst experts focus on other aspects of process development. After the computational evaluations have finished running, these experts can then work in conjunction with the approach to identify which models are the most likely to be statistically and scientifically correct as well as determine if further studies are necessary. The increased breadth of scope of this reported approach serves as an open-source enabling tool in discriminating kinetic models, thereby greatly reducing the time and cost barriers to complete process understanding.
Conflicts of interest
There are no conflicts to declare.Acknowledgements
CJT, TWC and RAB thank the School of Chemical and Process Engineering and the School of Chemistry at the University of Leeds for their support, and EPSRC (EP/R032807/1) and AstraZeneca (EP/N509681/1) for their funding and support. The authors thank Ian W. Ashworth for his contributions and help in the preparation of the manuscript. HS and FMD thank Duncan J. Howe and Andrew Mason for analytical support, Trinity College Cambridge, and AstraZeneca and BBSRC, respectively, for studentship support. RAB was supported by the Royal Academy of Engineering under the Research Chairs and Senior Research Fellowships scheme (RCSRF1920\9\38).References
- J. Prašnikar and T. Škerlj, New product development process and time-to-market in the generic pharmaceutical industry, Ind. Mark. Manag., 2006, 35(6), 690–702 Search PubMed.
- P. Suresh and P. K. Basu, Improving pharmaceutical product development and manufacturing: impact on cost of drug development and cost of goods sold of pharmaceuticals, J. Pharm. Innov., 2008, 3(3), 175–187 Search PubMed.
- M. Grom, et al., Modelling chemical kinetics of a complex reaction network of active pharmaceutical ingredient (API) synthesis with process optimization for benzazepine heterocyclic compound, Chem. Eng. J., 2016, 283, 703–716 Search PubMed.
- S. Diab, et al., Process Design and Optimization for the Continuous Manufacturing of Nevirapine, an Active Pharmaceutical Ingredient for HIV Treatment, Org. Process Res. Dev., 2019, 23(3), 320–333 Search PubMed.
- F. L. Muller and J. Latimer, Anticipation of scale up issues in pharmaceutical development, Comput. Chem. Eng., 2009, 33(5), 1051–1055 Search PubMed.
- C. J. Taylor, et al., Flow chemistry for process optimisation using design of experiments, J. Flow Chem., 2021, 11(1), 75–86 Search PubMed.
- S. A. Weissman and N. G. Anderson, Design of experiments (DoE) and process optimization. A review of recent publications, Org. Process Res. Dev., 2015, 19(11), 1605–1633 Search PubMed.
- S. Beg, et al., Application of design of experiments (DoE) in pharmaceutical product and process optimization, in Pharmaceutical quality by design, Elsevier, 2019, pp. 43–64 Search PubMed.
- A. D. Clayton, et al., Algorithms for the self-optimisation of chemical reactions, React. Chem. Eng., 2019, 4(9), 1545–1554 Search PubMed.
- V. Sans and L. Cronin, Towards dial-a-molecule by integrating continuous flow, analytics and self-optimisation, Chem. Soc. Rev., 2016, 45(8), 2032–2043 Search PubMed.
- C. Mateos, M. J. Nieves-Remacha and J. A. Rincón, Automated platforms for reaction self-optimization in flow, React. Chem. Eng., 2019, 4(9), 1536–1544 Search PubMed.
- M. Ehly, et al., Scale-up of batch kinetic models, Anal. Chim. Acta, 2007, 595(1–2), 80–88 Search PubMed.
- B. R. Hough, D. T. Schwartz and J. Pfaendtner, Detailed kinetic modeling of lignin pyrolysis for process optimization, Ind. Eng. Chem. Res., 2016, 55(34), 9147–9153 Search PubMed.
- J. Tsu, V. H. G. Díaz and M. J. Willis, Computational approaches to kinetic model selection, Comput. Chem. Eng., 2019, 121, 618–632 Search PubMed.
- M. J. Willis and M. von Stosch, Inference of chemical reaction networks using mixed integer linear programming, Comput. Chem. Eng., 2016, 90, 31–43 Search PubMed.
- J. P. Unsleber and M. Reiher, The exploration of chemical reaction networks, Annu. Rev. Phys. Chem., 2020, 71, 121–142 Search PubMed.
- D. Langary and Z. Nikoloski, Inference of chemical reaction networks based on concentration profiles using an optimization framework, Chaos, 2019, 29(11), 113121 Search PubMed.
- M. Al Jamri, R. Smith and J. Li, Integration of Renewable Resources into Petroleum Refining, in Computer Aided Chemical Engineering, Elsevier, 2018, pp. 1439–1444 Search PubMed.
- M. Levin, Pharmaceutical process scale-up, CRC Press, 2001 Search PubMed.
- S. J. Khang and O. Levenspiel, New scale-up and design method for stirrer agitated batch mixing vessels, Chem. Eng. Sci., 1976, 31(7), 569–577 Search PubMed.
- M. Amrhein, B. Srinivasan and D. Bonvin, Target factor analysis of reaction data: Use of data pre-treatment and reaction-invariant relationships, Chem. Eng. Sci., 1999, 54(5), 579–591 Search PubMed.
- N. Bhatt, et al., Incremental identification of reaction systems—A comparison between rate-based and extent-based approaches, Chem. Eng. Sci., 2012, 83, 24–38 Search PubMed.
- M. Brendel, D. Bonvin and W. Marquardt, Incremental identification of kinetic models for homogeneous reaction systems, Chem. Eng. Sci., 2006, 61(16), 5404–5420 Search PubMed.
- C. Georgakis and R. Lin, Stoichiometric Modeling of Complex Pharmaceutical Reactions, in Proceedings of the Annual AIChE meeting in Cincinnati, OH, November, 2005 Search PubMed.
- S. C. Burnham, et al., Inference of chemical reaction networks, Chem. Eng. Sci., 2008, 63(4), 862–873 Search PubMed.
- E. J. Crampin, S. Schnell and P. E. McSharry, Mathematical and computational techniques to deduce complex biochemical reaction mechanisms, Prog. Biophys. Mol. Biol., 2004, 86(1), 77–112 Search PubMed.
- D. P. Searson, et al., Inference of chemical reaction networks using hybrid s-system models, Chem. Prod. Process Model., 2007, 2(1), 10 Search PubMed.
- R. Aris and R. Mah, Independence of chemical reactions, Ind. Eng. Chem. Fundam., 1963, 2(2), 90–94 Search PubMed.
- D. Bonvin and D. Rippin, Target factor analysis for the identification of stoichiometric models, Chem. Eng. Sci., 1990, 45(12), 3417–3426 Search PubMed.
- C. Waldron, et al., An autonomous microreactor platform for the rapid identification of kinetic models, React. Chem. Eng., 2019, 4(9), 1623–1636 Search PubMed.
- F. Galvanin, S. Macchietto and F. Bezzo, Model-based design of parallel experiments, Ind. Eng. Chem. Res., 2007, 46(3), 871–882 Search PubMed.
- F. Galvanin, M. Barolo and F. Bezzo, Online model-based redesign of experiments for parameter estimation in dynamic systems, Ind. Eng. Chem. Res., 2009, 48(9), 4415–4427 Search PubMed.
- T. Lohmann, H. G. Bock and J. P. Schloeder, Numerical methods for parameter estimation and optimal experiment design in chemical reaction systems, Ind. Eng. Chem. Res., 1992, 31(1), 54–57 Search PubMed.
- M. Fujiwara, et al., First-principles and direct design approaches for the control of pharmaceutical crystallization, J. Process Control, 2005, 15(5), 493–504 Search PubMed.
- F. Galvanin, et al., A joint model-based experimental design approach for the identification of kinetic models in continuous flow laboratory reactors, Comput. Chem. Eng., 2016, 95, 202–215 Search PubMed.
- G. Franceschini and S. Macchietto, Model-based design of experiments for parameter precision: State of the art, Chem. Eng. Sci., 2008, 63(19), 4846–4872 Search PubMed.
- C. J. Taylor, et al., Rapid, Automated Determination of Reaction Models and Kinetic Parameters, Chem. Eng. J., 2020, 127017 Search PubMed.
- C. J. Taylor, Computational Approach Kinetic Fitter, 2020. Available from: https://github.com/ConnorJTaylor/CompKineticFitter Search PubMed.
- H. Akaike, A new look at the statistical model identification, IEEE Trans. Autom. Control, 1974, 19(6), 716–723 Search PubMed.
- S. Skerratt, Recent progress in the discovery and development of TRPA1 modulators, in Progress in Medicinal Chemistry, Elsevier, 2017, pp. 81–115 Search PubMed.
- H. Binch, et al., Aminopyridine derivatives having Aurora A selective inhibitory action, US Pat., US8367690B2, 2013 Search PubMed.
- C. S. Lood, et al., Synthesis of Chiral (Indol-2-yl) methanamines and Insight into the Stereochemistry Protecting Effects of the 9-Phenyl-9-fluorenyl Protecting Group, Eur. J. Org. Chem., 2015, 3793, 3805 Search PubMed.
- J.-F. Poisson, A. Orellana and A. E. Greene, Stereocontrolled synthesis of (−)-kainic acid from trans-4-hydroxy-L-proline, J. Org. Chem., 2005, 70(26), 10860–10863 Search PubMed.
- C. Lood, M. Nieger and A. Koskinen, Enantiospecific gram scale synthesis of (S)-eleagnine, Tetrahedron, 2015, 71(30), 5019–5024 Search PubMed.
- S. L. Oputah, et al., Phytochemical and antibacterial properties of ethanolic seed extracts of Chrysophyllum albidum (african star apple), Orient. J. Phys. Sci., 2016, 1(1) DOI:10.13005/OJPS01.0102.02.
- I. W. Ashworth, et al., Where has my acid gone? Understanding the self-catalyzed esterification of maleic acid in methanol during salt formation, Org. Process Res. Dev., 2012, 16(10), 1646–1651 Search PubMed.
Footnote |
| † Electronic supplementary information (ESI) available. See DOI: 10.1039/d1re00098e |
| This journal is © The Royal Society of Chemistry 2021 |

