New approach to consecutive CO oxidation and CO2 chemisorption using Li2CuO2 ceramics modified with Na- and K-molten salts
Susana
Hernández-Castillo
 a,
Héctor
Martínez-Hernández
 b and
J. Arturo
Mendoza-Nieto
 *a
*a
aLaboratorio 111, Departamento de Fisicoquímica, Facultad de Química, Universidad Nacional Autónoma de México, Ciudad Universitaria, Coyoacán, CP 04510, Ciudad de México, Mexico. E-mail: jamn1986@quimica.unam.mx; Tel: +52 (55) 5622 3777
bDepartamento de Ingeniería en Metalurgia y Materiales, Escuela Superior de Ingeniería Química e Industrias Extractivas, Instituto Politécnico Nacional, UPALM-Zacatenco, IPN Av. Gustavo A. Madero, C.P. 07738, Ciudad de México, Mexico
First published on 11th May 2021
Abstract
To analyze for the first time the effect of alkali carbonate addition to lithium cuprate during the consecutive process of carbon monoxide (CO) oxidation and subsequent carbon dioxide (CO2) capture, a series of X-containing Li2CuO2 (X = Na and/or K) materials were prepared by mechanically adding different mixtures of sodium and potassium carbonates to lithium cuprate. According to results, the presence of carbonate allowed the improvement of both the CO conversion and the CO2 chemisorption in a moderate temperature range, between 400 and 650 °C. According to the reaction mechanism proposed in this work, this enhancement was produced due to the formation of a new phase between the mechanically added Na and K carbonates and the Li carbonate produced during the CO2 capture on the ceramic surface. The composition of this phase changes depending on the temperature used and the amount of lithium carbonate formed on the surface. Once the newly formed carbonate phase melts, the diffusion of both reactants (CO and O2) is enhanced towards the bulk material, promoting the oxidation of CO and later CO2 capture. Another benefit was detected on the ratio between CO2 captured and released. According to this parameter, the samples modified with a single carbonate, Na- or K–Li2CuO2 samples, showed a high tendency to capture the CO2 formed during the CO oxidation, allowing the simultaneous elimination of two toxic and harmful gases, CO and CO2. The results are promising, considering that at an industrial level, two different materials are required for this process: a heterogeneous catalyst followed by a chemical adsorbent, which can be replaced with a single modified-Li2CuO2 material studied in this work.
1. Introduction
Hydrogen (H2) has drawn significant attention in recent years due to its versatile applications in the chemical, oil, and energy industries. It is a feedstock for several processes to obtain high value-added chemicals, such as Fischer–Tropsch hydrocarbons and ammonia.1 Likewise, hydrogen is nowadays one of the fuels with the greatest environmental benefits among alternatives to fossil fuels.2,3To address its growing demand, one of the major research areas is hydrogen purification. Upon its industrial production, hydrogen is found in syngas, which, depending on the process conditions, typically contains between 25–30 mol% of hydrogen and 30–60 mol% of carbon monoxide.4 Afterwards, a conversion step called “water-gas shift reaction” (WGSR) may be needed for hydrogen purification, reaching up to 0.5–3.0 mol% concentrations of CO.5–8 However, for hydrogen use in ammonia production and fuel cells, this concentration should be below 100 ppm; this is because a higher CO concentration tends to poison the catalyzers involved in the aforementioned processes in which high-purity hydrogen is employed.9–11 Among the different purification technologies, pressure swing adsorption (PSA) and partial condensation are currently the most employed.1,2,12,13 Nevertheless, they possess certain drawbacks; for example, energy-intensive operating conditions and hazardous reagents are evidenced in partial condensation, while high production costs along with increased CO2 generation are the case for PSA.1,2 To overcome these limitations, several alternatives have been developed, such as preferential catalytic oxidation (PROX) of CO. PROX is a very promising method, given the high CO sorption capacity yielded and its simplicity of implementation.1,6,7,12,14–16 Noble metals (Pd, Pt, Ru, Au, etc.) supported on transition metal oxides have been the focus of many works due to their high catalytic activity in PROX.7,12,16,17 However, their high production costs still limit their application, as well as the excess oxygen needed to perform the reaction. Many of these materials require more than 2.0% of O2 to oxidize 1.0% of CO, although only 0.5% of oxygen is necessary, stoichiometrically.14,18 Thus, the H2 combustion risk remains, decreasing the fuel capacity.
Analogous to these materials, alkaline ceramics have been discovered to be bifunctional materials, serving as catalysts of the CO oxidation reaction and then as captors of the CO2 produced, without needing more than the stoichiometric amount of O2 in the gas stream.19 Within these materials, sodium and lithium zirconates (Na2ZrO3 and Li2ZrO3),20–24 sodium cobaltate (NaCoO2),25–27 lithium ferrites (LiFeO2, Li5FeO4),28–30 and lithium cuprate (Li2CuO2)31–34 have been studied in wide temperature ranges (300–800 °C), among others. More of these latter unconventional alkaline ceramics include doped materials, such as ceria-based materials doped with samarium and strontium, KOH–hopcalite materials, and even nickel, manganese, or iron-doped lithium cuprate.35–37 Nevertheless, the catalytic and storage capacity of these materials is hindered at higher temperatures due to the formation of a carbonate shell on their surface produced by the chemisorption reaction.38–40 This phenomenon has been compensated for in previous works by adding alkali carbonates, such as Na2CO3, K2CO3, MgCO3, and CaCO3, to CO2 trapping materials.21,32,41–50 These modifications favor the formation of molten eutectic phases between the external carbonate layer and the added carbonates, which enhances the diffusive processes allowing the CO2 chemisorption reaction to continue through the shell and into the core of the material.
In particular, lithium cuprate has proven to be an effective catalyst for CO oxidation, showing total CO conversion between 440 and 520 °C, as well as a good CO2 captor.31,32,51–53 These behaviors have been attributed to copper's ability to change its oxidation state, favoring the oxygen release and enhancing the dual oxidation and capture process.31,54 Although the effect of alkali carbonate addition has been recently studied for direct CO2 capture in Li2CuO2,32 it has been reported that the CO–O2 system may be a condition yielding better performance.28,31 In this line, Yañez-Aulestia et al.31 concluded that lithium cuprate showed higher thermodynamic stability and higher CO2 capture when reacting with a CO–O2 atmosphere versus a CO2 atmosphere. Lara-García et al.28 explained this by linking these results to the highly exothermic CO–O2 reaction, which may favor the carbonation process. Notably, these works operated under a CO concentration of less than 5.0%, very similar to that found in low-CO hydrogen applications, such as the abovementioned hydrogen fuel cells and ammonia production. Thus, if CO2 capture was significantly enhanced in Li2CuO2 by alkali carbonate addition, CO2 capture by the dual oxidation–capture process in a CO–O2 atmosphere represents a great opportunity for its application in low-CO concentration purification processes. The purpose of this work was, therefore, to analyze for the first time the effect of alkali carbonate addition to Li2CuO2 on CO2 capture in a moderate temperature range (300–700 °C), now considering the dual process of CO oxidation and subsequent CO2 chemisorption, which has not been previously explored for this type of material modification nor its application in low-CO hydrogen purification. The CO oxidation and CO2 capture abilities of these materials were observed and quantified, then compared with the different carbonate mixtures studied.
2. Experimental section
Pure lithium cuprate (Li2CuO2) was synthesized via a solid-state reaction as described in previous works.31,32,51 Starting materials were lithium oxide (Li2O, Aldrich 99.0%) and copper oxide (CuO, Meyer, 97.0%) powders, which were mechanically mixed in an agate mortar and then calcinated in an air atmosphere at 800 °C for 6 h. Due to lithium's sublimation tendency at temperatures greater than 720 °C, a 20 wt% excess of lithium was added to compensate for it.32,52 Afterwards, a diffractometer (Bruker AXS D8-Advance) coupled to a copper anode X-ray tube was used to confirm the formation of the Li2CuO2 crystalline phase through powder X-ray diffraction (XRD). Once the crystalline structure was identified, pure Li2CuO2 was mechanically mixed with sodium carbonate (Na2CO3, Aldrich 99.9%) and potassium carbonate (K2CO3, Aldrich 99.0%) in different ratios: 10.0–0.0, 7.5–2.5, 5.0–5.0, 2.5–7.5 and 0.0–10.0 wt% of each carbonate, maintaining in all cases a total addition of 10.0 wt%.32 Hereinafter, these samples are labeled as Na–Li2CuO2, Na75–Li2CuO2, Na–K–Li2CuO2, K75–Li2CuO2, and K–Li2CuO2, respectively. The last portion of pristine lithium cuprate was used as a reference for the ensuing experiments, labeled as Li2CuO2. For Na- and K-containing Li2CuO2 materials, XRD was used to corroborate the presence of the carbonate crystalline phases.The prepared powders were characterized microstructurally by nitrogen adsorption–desorption analyses (Bel-Japan Minisorp II) at 77 K. Samples were previously vacuum degassed at room temperature for 12 h. Through these analyses, the BET surface area and the monolayer volume were obtained. Furthermore, endothermic and exothermic peaks throughout the thermal evolution of selected materials were recorded through differential scanning calorimetry (DSC) using an Instrument Specialist Incorporated Pressure-DS calorimeter. These experiments were conducted using a ∼5.0 mg powder sample and heating it from 30 to 600 °C at 10 °C min−1, in a nitrogen (Praxair, grade 4.8) atmosphere or a 5.0% CO in N2 (Praxair certificate standard) and 3.0% O2 (Praxair, grade 2.6) atmosphere for a combined CO–O2 flow.
To examine the effect of carbonate addition on consecutive CO oxidation29,55,56 and CO2 chemisorption,22,37,57 pure Li2CuO2 and modified Na- and K-containing Li2CuO2 samples were tested by thermogravimetric analysis (TGA) in a thermobalance (TA Instruments Q500, ∼15.0 mg) and a catalytic reactor (Bel-Japan Bel-Rea, 200.0 mg) under dynamic and isothermal conditions. For dynamic tests in both equipment, samples were heated from 30 to 900 °C at 5 °C min−1 under a 97.0% of CO (5.0% in N2, Praxair certificate standard) and 3.0% of O2 (Praxair, grade 2.6) flow, with a 100 mL min−1 total flow. For isothermal experiments, samples were heated from room temperature to the selected temperature (400, 500, 600, 650, and 700 °C) at 15 °C min−1, using N2 (40 mL min−1) as a carrier gas. Once the temperature was reached, the gas flow was switched to the 97.0–3.0% CO–O2 mixture and maintained for 3 h. The effluent gas composition from the catalytic experiments was analyzed by using a gas chromatograph (Shimadzu GC-2014). The CO2 production was calculated by comparing the concentration of CO in the gas feed and the reactor outlet.
3. Results and discussion
3.1 Na- and K-containing Li2CuO2 structural and microstructural characterization
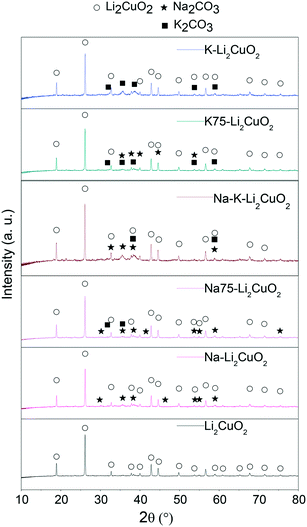
To determine the crystalline structure of all the synthesized samples, XRD was used to obtain the patterns of pristine Li2CuO2 and the samples modified mechanically with carbonates (Fig. 1). Lithium cuprate's diffraction pattern only shows the signals associated with the crystalline planes of Li2CuO2 in the orthorhombic phase, reported in JCPDS 01-084-1971. In this sample, no reflections from residual CuO and/or Li2CO3 were observed, showing that the solid-state method used was effective in converting both reactants into lithium cuprate.51Furthermore, the XRD patterns of Na- and K-containing Li2CuO2 ceramics show the expected reflections of Li2CuO2 crystalline structure, along with the corresponding signals due to the presence of alkali-carbonates. These last reflections were assigned according to the JCPDS 37-0451 file for Na2CO3 in the monoclinic phase and the JCPDS 01-087-0730 file for K2CO3 in the monoclinic phase. Considering that the position of the principal reflections of Li2CuO2 was preserved in all Na- and K-containing Li2CuO2 patterns, it can be established that the mechanical addition of alkali carbonates did not modify the originally ordered arrangement of atoms in lithium cuprate, as would be expected.
The nitrogen (N2) physisorption technique was employed as a means to quantify the effect of the addition of alkali carbonates on the textural characteristics of Li2CuO2. The N2 adsorption–desorption isotherms of Li2CuO2 and Na- and K-containing Li2CuO2 ceramics are shown in Fig. 2. The isotherm shape in all the solids can be classified as type II(b) according to IUPAC classification, corresponding to non-porous materials with inter-particle capillary condensation.58–60 Furthermore, a hysteresis loop was observed in all the isotherms and it was classified as a H3 loop, except for the Na75– Li2CuO2 and K75–Li2CuO2 samples, in which no hysteresis was obtained. In general, the H3 loop is related to a low degree of pore curvature and non-rigidity of the aggregate structure.61 Additionally, the textural characteristics, monolayer volume (Vm), and specific surface areas (SBET) were determined from the N2 adsorption curves in the relative pressure (P/P0) range between 0.05 and 0.35, using the BET model (Table 1).62 The starting surface area obtained for the pristine Li2CuO2 sample was 3.2 m2 g−1, which falls within the observed range for lithium cuprate synthesized through the solid-state method.31,32,63 Carbonate addition impacted the SBET values of the modified samples depending on the type and amount of each carbonate. For example, in the Na–Li2CuO2 sample, the one with the greatest increment, sodium carbonate addition improved the SBET value up to 4.2 m2 g−1. In contrast, the surface area of the K75–Li2CuO2 sample, the one with the largest specific surface area decline, lowered to 1.4 m2 g−1. A similar trend amongst the samples was found for the Vm value.
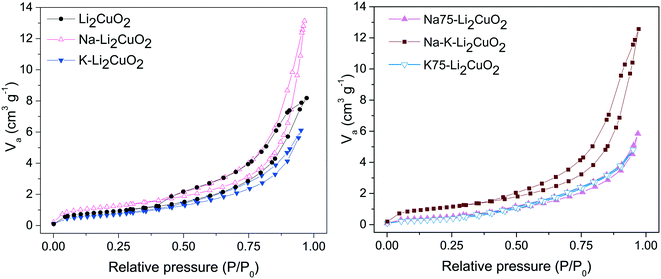 | ||
| Fig. 2 Nitrogen adsorption–desorption isotherms of Li2CuO2 and Na- and K-containing Li2CuO2 materials. | ||
Further characterization of Li2CuO2 and Na- and K-containing Li2CuO2 was conducted through DSC in N2 and CO–O2 atmospheres (Fig. 3). In these analyses, the thermal evolution of the two samples was compared to identify the key differences between their endothermal and exothermal transitions. Fig. 3A shows the thermograms recorded under N2 flow for the aforementioned materials. These display two major endothermic peaks: the first, between 50 and 90 °C, was attributed to the loss of water molecules physisorbed over the ceramic surface. The second endothermic signal was produced between 350 and 450 °C, corresponding to carbonate fusion, which indicates a partial carbonation process probably due to ambient CO2 even in the pure Li2CuO2 sample, a previously observed phenomenon.32 This second peak was shortened and shifted to a lower temperature (395 °C) in Na–K–Li2CuO2, pointing out the favorable effect of carbonate addition in the decrease of the energy required for a partial melting process.
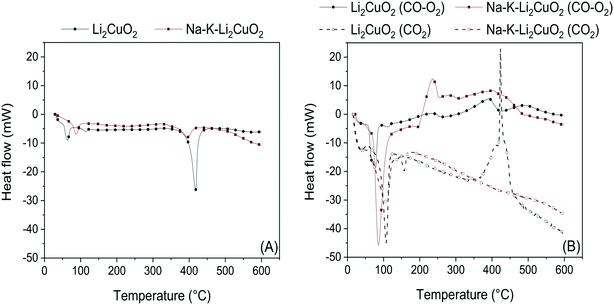 | ||
| Fig. 3 DSC analyses in N2 (A) and CO2/CO–O2 (B) atmospheres for (Na–K)–Li2CuO2 samples. Profiles in dashed lines presented in Fig. 3B were taken from the work published by I. Ham-Liu et al.32 and used as reference experiments conducted under a saturated CO2 atmosphere. | ||
The following DSC experiments (Fig. 3B) show the benchmarking of the thermal profiles of Li2CuO2 and Na–K–Li2CuO2 in a CO–O2 (solid lines) atmosphere against those of the same materials in a CO2 atmosphere (dashed lines).32 The same endothermic signal corresponding to water desorption was observed in all four profiles within the 50–120 °C range, in addition to a minor endothermic peak in Na–K–Li2CuO2 at 145 °C ascribed to intercrystalline dehydroxylation in the alkali carbonate lattice. Then, important differences between the CO–O2 and CO2 systems arose. Samples treated under a CO–O2 flow exhibited a small exothermic peak between 200 and 250 °C, as well as a second one between 350 and 420 °C. In contrast, none of the samples heated in a CO2 atmosphere displayed the first type of signal, while the second type was only seen in the pristine sample. For the first signal, it can be assumed that it is exclusive of the exothermic CO oxidation process, as it has been noted to be faster than the CO/CO2 chemisorption process.31 Furthermore, this signal has also been observed in unsupported copper oxide catalysts for CO oxidation in the presence of oxygen.64 The more intense exothermic signal shown by Na–K–Li2CuO2 implies a higher reactivity in this material. As for the second signal, since there is a peak due to carbonate fusion in the same temperature range in N2, it is evident that the thermal transitions in the CO–O2/CO2 atmospheres are also affected by this process in addition to another one. This process is herein identified as the CO2 chemisorption process, confirming the consecutive CO oxidation–CO2 sequestration process previously reported.31,63
A comparison is drawn between the two systems: under a CO2 flow, only Li2CuO2 shows a sharp exothermic peak; parallel to this, under a CO–O2 flow, the peak is observed in both materials, more pronouncedly in the Li2CuO2 case. This is explained through the exothermic chemisorption–endothermic carbonate fusion counterbalance. In the CO2 system, while direct CO2 chemisorption is energetically higher than carbonate fusion in the Li2CuO2 sample, the latter process seems to be of the same magnitude as the former in Na–K–Li2CuO2, hence ruling out the emergence of a signal. Moreover, carbonate fusion in Na–K–Li2CuO2 involves the melting of a phase composed not only of Na2CO3 and K2CO3 but also of Li2CO3, which will be explored in the following section. Under a CO–O2 flow, however, the energy released during CO2 chemisorption is slightly higher than that required during carbonate fusion in the two samples analyzed. Thus, CO2 chemisorption as an ensuing result of catalytic CO oxidation is a less energy-demanding process than direct CO2 sorption in lithium cuprate materials, in agreement with previous calculations,63 with carbonate addition and fusion of the phase formed having an interesting impact on the dual role of Li2CuO2. Considering the DSC results, it was decided to explore in-depth the effect of carbonate addition; thus, different mixtures of sodium and potassium carbonates were added to lithium cuprate.
3.2 Comparison between direct and indirect CO2 chemisorption
Following the favorable results concerning the effect of carbonate addition on the thermal transitions of the Li2CuO2–CO–O2 system, TG analyses were conducted to better understand this enhancement during the weight increase due to direct CO2 sorption or the indirect pathway obtained through CO oxidation followed by the sorption of the CO2 produced. Fig. 4A shows the thermogravimetric profile of Li2CuO2 under a CO–O2 flow (5.0% CO diluted in N2 and 3.0% O2, with a total flow of 100 mL min−1) along with that under a saturated CO2 flow (60 mL min−1) taken from the work published by Ham-Liu et al.32 Both thermograms depict the behaviors previously reported for this material, which involve the catalytic CO oxidation and subsequent CO2 chemisorption (indirect pathway) for the former flow system, and the direct CO2 sorption for the latter, described by reactions 1–2 and 3, respectively.31,32,51,63 Additionally, Table 2 summarizes the weight changes and temperature ranges associated with every step in both samples. | (1) |
 | (2) |
| Li2CuO2(s) + CO2(g) ↔ Li2CO3(s) + CuO(s) | (3) |
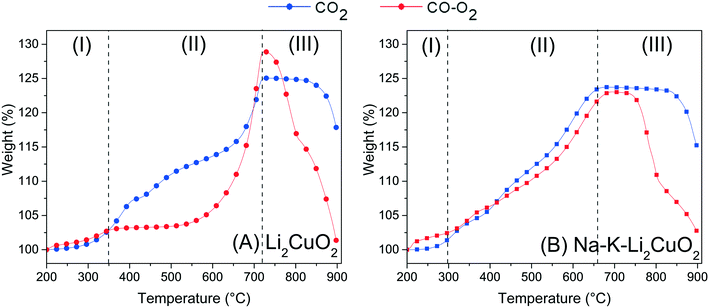 | ||
| Fig. 4 Thermogravimetric profiles for (A) Li2CuO2 and (B) Na–K–Li2CuO2 samples tested as a function of temperature under CO–O2 and CO2 flows. Profiles in dashed lines were taken from the work published by I. Ham-Liu et al.32 and used as reference experiments. After the dehydration process occurred at T < 200 °C, all thermograms were normalized to 100%. | ||
| Process | Li2CuO2 | Na–K–Li2CuO2 | |||
|---|---|---|---|---|---|
| Direct CO2 capture (CO2) | Indirect CO2 capture (CO–O2) | Direct CO2 capture (CO2) | Indirect CO2 capture (CO–O2) | ||
| a Variation of sample weight during each step. b Temperature range attributed to each step. | |||||
| Step I | Superficial chemisorption | 2.70%a | 2.70% | 1.36% | 2.38% |
| 200–350 °Cb | 200–350 °C | 200–300 °C | 200–300 °C | ||
| Step II | Bulk chemisorption | 22.18% | 26.30% | 22.12% | 20.46% |
| 350–720 °C | 525–720 °C | 300–650 °C | 300–675 °C | ||
| Step IIIa | Chemisorption–desorption equilibrium | −0.75% | −0.12% | −0.51% | 0.0% |
| 720–825 °C | 720–735 °C | 650–825 °C | 675–735 °C | ||
| Step IIIb | Desorption | −7.15% | −27.63% | −8.43% | −20.25% |
| 825–900 °C | 735–900 °C | 825–900 °C | 735–900 °C | ||
The weight uptake for this kind of ceramic is typically described by a three-step process.31,32,65 Firstly, there is a superficial capture in which, according to the reactions, an external layer composed of lithium carbonate (Li2CO3) and copper oxide (CuO) is formed (step I). With a step interval from 200 to 350 °C, both systems, direct and indirect captures (CO2 and CO–O2, respectively), stopped CO2 superficial chemisorption with a 2.70 wt% uptake (Table 2). Once the ceramic surface of Li2CuO2 was covered by the shell of chemisorption products, higher temperatures enabled the activation of lithium and oxygen diffusion processes that resumed CO2 capture, now throughout the bulk of the material (step II). While the direct CO2 capture presented a weight increase of 22.18 wt% only in this step, reaching a maximum global of 24.88 wt% at 720 °C, the indirect capture (CO–O2 system) started bulk capture as soon as 525 °C, reaching a maximum global of 29.0 wt% also at 720 °C. According to Table 2, the indirect pathway allowed a higher amount of CO2, 26.30 wt%, to be captured in bulk. Lastly, this maximum capture marked the onset of chemisorption–desorption equilibrium (step IIIa) in the direct CO2 capture system, followed by the CO2 desorption process, which is promoted by Li2CO3 decomposition to CO2 and Li2O at T > 825 °C (step IIIb). On the other hand, the indirect pathway, the CO–O2 system, plunged immediately (T ≈ 735 °C, Table 2) into the desorption of almost all the CO2 previously captured.
When comparing the weight increments of each system for the pristine sample, it must be taken into consideration the fact that the indirect pathway (CO–O2 system) achieved a higher maximum even in a less-saturated gas atmosphere (maximum of 5.0% of CO2 can be formed), showing greater potential for CO2 capture in agreement with the literature.31 This increase, especially during the bulk capture step, is explained by the reported key role of oxygen availability in the system. Its presence in the gas stream enables a homolytic oxygen dissociation via Li2CuO2, whose products, oxygen atoms, take part in the carbonation process (in this case, the CO oxidation and subsequent CO2 sorption) as “backup” for the oxygen in the crystalline structure of Li2CuO2.28,31,63,66 This labile lattice oxygen is limited in quantity and must go through a crystalline diffusion process throughout the bulk of the material to achieve carbonation. By and large, the indirect pathway, the CO–O2 system, provides a better opportunity to improve bulk CO2 capture.
Recalling the results of the previous TGA analysis, another limitation of alkaline ceramics for CO2 capture is the formation of a carbonate and reduced-metal oxide shell, which inhibits the reaction of CO/CO2 with the surface. To counter this, the addition of alkali carbonates to form a molten eutectic or partially melted phase with the produced Li2CO3, allowing further reaction with the core of the material, has been reported for the direct CO2 pathway on lithium cuprate: CO2 system. Therefore, to further study the effect of this addition for indirect CO2 sorption, the CO–O2 system, TGA analyses of Na–K–Li2CuO2 (Fig. 4-B) in the latter system were benchmarked against those of the former one.32 In Fig. 4B, the profiles of both pathways displayed the same overall behavior of their counterparts with pure Li2CuO2 revised in Fig. 4A, but some particular variations were identified. Moreover, both capture routes achieved almost the same maximum at the superficial (∼2 wt%) and bulk capture (∼23 wt%) processes. However, in the bulk case, the direct sorption (CO2 system) reaches the maximum at 650 °C, while the indirect pathway (CO–O2 system) at 675 °C (Table 2). These results showed a shift in the bulk chemisorption process, almost 50 degrees earlier than in both experiments for the Li2CuO2 sample shown in Fig. 4A. Moreover, the benefit of the addition of carbonates in the Na–K–Li2CuO2 sample was observed through the great improvement in CO2 capture during the indirect pathway (CO–O2 system) between 300 and 675 °C. In this case, the bulk capture started at least 225 degrees earlier compared to the pristine sample behavior in the same indirect route (Fig. 4A). Furthermore, in Fig. 4B, it must be considered that even if both pathway systems exhibit almost the same behavior, proving the enhancement of CO2 capture by adding alkali carbonates, the indirect pathway for the CO–O2 system produced less than 10% of the amount of carbon dioxide in the atmosphere to achieve the same results. Finally, the chemisorption–desorption equilibrium in the modified sample also started at least 50 degrees earlier than the experiments for the unmodified sample (Li2CuO2, Fig. 4A), confirming that carbonate addition switched all three steps to a lower temperature range. Considering the above, additional experiments were conducted to elucidate the effect of different carbonate proportions in the modified samples to optimize the indirect pathway composed of CO oxidation and CO2 capture processes.
3.3 CO oxidation tests
To confirm that CO oxidation was effectively occurring as well as to follow the evolution of the CO2 produced and released to the fluid phase, some catalytic experiments were performed in a catalytic reactor. As in the TGA described above, dynamic experiments were carried out from room temperature up to 900 °C under a CO–O2 flow, the indirect pathway (Fig. 5). In pristine lithium cuprate, CO2 formation was first observed at around 200 °C. Then, the highest conversion, 45.6%, was achieved at 480 °C. The CO conversion decline starts at this temperature, which overlaps with the onset of bulk capture in the thermogravimetric analysis of the sample in question (520 °C, see Fig. 4A). From there, the CO2 presence fell until 685 °C (28%), the temperature at which it started to increase exponentially until the end of the experiment. Likewise, the local minimum of CO2 presence at 685 °C is not far away from the maximum weight increase in the material at 725 °C. After the former temperature, CO2 in the stream increased and the capture decreased, which is consistent with the sample desorption due to Li2CO3 decomposition. Meanwhile a decrease of CO2 production, due to its participation in the formation of the solid Li2CO3 shell (eqn (2)), should not be ruled out; thus, a decrease of CO2 in the gas chromatograph recording does not necessarily represent a decline in the catalytic activity of Li2CuO2. On the contrary, it confirms the capture of the CO2 produced and therefore its removal from the gas effluent. Moreover, such a delay in the oxidation–capture temperatures agrees with the fact that CO oxidation is faster than CO2 sorption, and the former reaction must have occurred so that the latter happens through the formation of the Li2CO3 layer.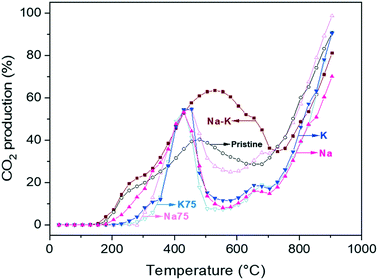 | ||
| Fig. 5 Dynamic evolutions of CO2 produced for Li2CuO2 and Na- and K-containing Li2CuO2 samples tested as a function of temperature under a CO–O2 flow. | ||
A similar behavior was observed with the modified samples, but some particular differences were produced, depending on the temperature range studied. All Na- and K-containing Li2CuO2 samples exhibited an inflection point around 350 °C, which will be used as a reference for the first interval from room temperature up to this point, comparing them amongst their thermogravimetric profiles in section 3.4. During this first temperature interval (200–350 °C), the trend concerning CO2 production was documented as follows: K75 (11.7%) < K (12.4%) < Na75 (22.0%) < Li2CuO2 (24.5%) < Na (28.4%) < Na–K (31.0%). Thus, this equal-carbonate proportion material seems to have the highest performance amongst all the samples tested.
Here, the improvement in CO oxidizing activity originated from the addition of carbonates (300–500 °C), reducing their concentration in the carbonate mixture once Li2CO3 is generated forming a new mixture of carbonates in which the molar fraction of lithium carbonate increases as the reaction advances. Of course, different carbonate mixtures have variable melting points as a function of carbonate composition. The addition of carbonates, therefore, allows the melting point of pure Li2CO3 to be lowered until either a liquid phase or partially melted phase is reached, avoiding the reduction of Li-ion diffusion on solid phases.
As mentioned before, oxygen diffusion in the lithium cuprate system is key to the oxidation–capture processes since it limits the chemisorption reaction.45 Through copper reduction, oxygen is released from the material bulk, where it reacts with CO on the surface. Then, oxygen vacancies are filled by dissociated oxygen coming from the gas feed.63,67 Additionally, Tong et al. reported that molten carbonate phases possess catalytic activity for CO oxidation on their own, in which oxygen also plays a key role, as its dissociation and adsorption onto the carbonate surface is the limiting step.67 If the CO2 production is a result of the synergic effect of the carbonate phase and lithium cuprate, then both oxygen processes must be considered to explain the final and improved trend obtained. For oxygen diffusion in molten Li–Na–K carbonate phases, it has been reported that these carbonates allow for a means of easy transport across the phases, with a trend of Na < K < Li from the least favorable to the most favorable.68 Conversely, oxygen adsorption (originating from the gas stream) and dissociation on the molten carbonate phase presents an inverse path.69 With this in mind, low temperatures (T < 350 °C), if the surface is not covered with solid Li2CO3 (the lowest melting point of Li–Na–K mixtures being 397 °C), may lead eventually to the sintering of the material.70 Then, oxygen must be available on the surface and oxygen dissociation should take precedence. This could explain why sodium mixtures performed better CO/CO2 conversions in this initial temperature range.
Then, between 430 and 455 °C, all the modified samples but Na–K–Li2CuO2 displayed their peak CO2 production, exhibiting approximately the same value, 54%. The Na–K–Li2CuO2 sample conversely had a maximum CO2 conversion of 63.4% at 530 °C. Therefore, the new mixture formed by an equal amount of sodium and potassium carbonates, as well as by lithium carbonate (product of the carbonation), shifted the CO oxidation to higher temperatures with a higher formation CO2 percentage, which is in agreement with a lower CO2 capture ability in this posterior temperature range (see Fig. 7). At these intermediate temperatures, the melting points of the binary and ternary mixtures arise, between 397 and 500 °C.70 Furthermore, the Na75 sample, even if it had a higher melting point than the K sample, perhaps exhibited a higher CO2 presence because of its favorable O2 adsorption tendency. As for the other combinations, the unequal proportions employed did not have any distinct effect on the catalytic behavior concerning the peak of CO2 production. The counterbalance of the influence of oxygen adsorption/diffusion in the molten carbonate phase ruled out any distinct performance. However, they did show a particular phenomenon between 650 and 680 °C. These samples showed a slight enhancement in CO2 formation, up to 18% in Na–Li2CuO2, K–Li2CuO2, and K75–Li2CuO2, while in Na75–Li2CuO2 it was increased by 34%. Considering that the decomposition of Li2CO3 and subsequent desorption of the sample took place afterwards, it can be inferred that this small peak is associated with the CO2 sorption–desorption equilibrium. Since this peak coincides with the maximum capture (see Fig. 7) percentage in all the modified samples (except for Na–K–Li2CuO2), it could be a result of how the material is saturated with CO2 at this point, shifting slowly the equilibrium towards desorption (mirrored in the TGA profiles in Fig. 7 by a very slight decline in the capture), before plunging into full desorption. In general, this phenomenon for all the modified samples was the same at around 705 °C, except for Na–K–Li2CuO2 (730 °C).
To study in-depth the behavior of each sample under different thermal conditions, some isothermal tests were carried out at 400, 500, 600, 650, and 700 °C. All these isotherms showed a typical exponential behavior for CO2 production as a function of time (Fig. 6). Some tests showed a maximum followed by a decrease in the CO2 released into the gas phase, especially after 30 min of reaction at 700 °C. Regarding the pristine material Li2CuO2, the isotherms showed a CO2 formation percentage between 10 and 20%, reaching the maximum amounts at 650 and 700 °C. These results are in line with the dynamic tests shown in Fig. 5, where CO2 formation decreases between 500 and 600 °C and increases exponentially after 650 °C. Then, it was detected that the sample modified with 50% of both carbonates, Na–K–Li2CuO2, presented the best performance for CO oxidation in a low-temperature range, achieving the highest CO2 formation (∼35%) at 500 °C. In contrast, the rest of the modified samples presented similar or better performances than the unmodified material in a high-temperature range, between 650 and 700 °C. The following trends were observed in this range: 1) the best catalytic performance was obtained with samples modified with 75% of sodium or potassium carbonate: K75–Li2CuO2 and Na75–Li2CuO2 and 2) the lowest CO2 productions were observed with the samples modified with a single carbonate: K–Li2CuO2 and Na–Li2CuO2.
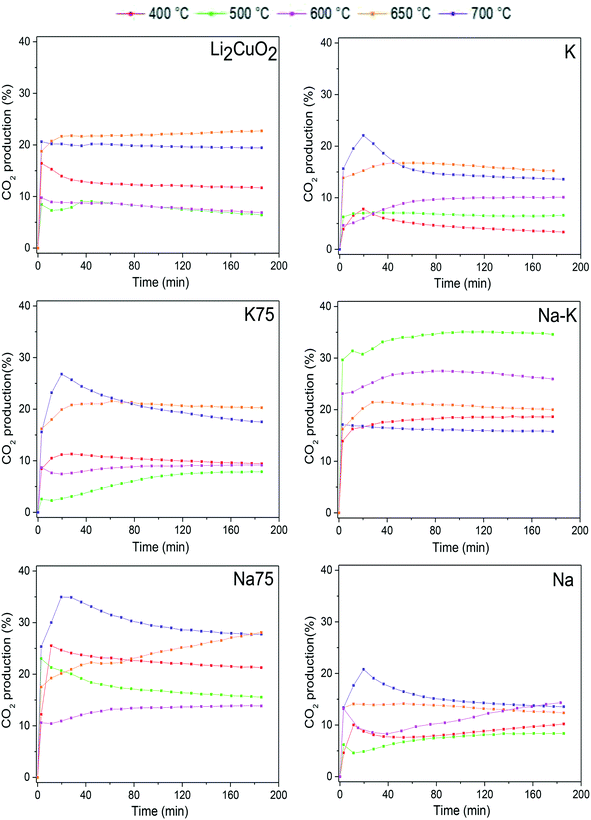 | ||
| Fig. 6 CO2 production isothermal profiles of Li2CuO2 and Na- and K-containing Li2CuO2 samples tested at different temperatures between 400 and 700 °C, during the CO oxidation process. | ||
3.4 CO2 capture tests
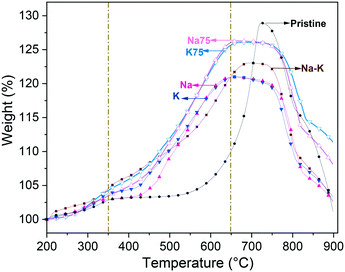
Following capture analyses, in Fig. 7 the TG profiles of Li2CuO2 and Na- and K-containing Li2CuO2 samples are shown. During the first step, the CO2 superficial capture in all the samples presented the same behavior, capturing less than 5.0 wt% at T < 350 °C. Therefore, no significant differences were obtained due to changes in the chemical composition of the samples. Conversely, during the bulk capture, a great difference was obtained. In general, in this step, all Na- and K-containing Li2CuO2 samples presented better CO2 capture abilities than the pristine Li2CuO2 material. Between 350 and 500 °C, the pristine Li2CuO2 sample did not present weight changes, remaining practically constant at 3.5 wt%, whereas all the modified samples displayed weight increases up to 12.5 wt%. In this step, the following trend was observed: Li2CuO2 ≈ K– < Na– < Na75– < K75– < Na–K–. This suggests that samples modified with a single carbonate (Na2CO3 or K2CO3) showed a slight increase in their capture abilities, but mixtures between both carbonates, regardless of the proportions used, allowed for greater weight increments. In the moderate temperature range of 350 to 450 °C, the sample synthesized with equal amounts of carbonates (Na–K–Li2CuO2) presented the best performance, reaching 8.4 wt% at 450 °C. This result may be related to the presence of an exothermic signal in the DSC profile at a very similar temperature for the Na–K–Li2CuO2 sample exposed to a CO–O2 atmosphere (see Fig. 4B). In this temperature interval, we recall that this latter sample Na–K–Li2CuO2 also presented the highest CO2 formation (see Fig. 5). After this point, diffusion processes were quickly activated in all the carbonate-modified samples due to the formation of the corresponding lower-melting point phase between the mechanically-added carbonates (Na2CO3 or K2CO3) and the lithium carbonate formed during CO2 capture (eqn (2) and (3)). Then, the previous trend changed between 450 and 650 °C, showing that the best capture performance (≈25 wt%) was achieved by the samples Na75 and K75 at 650 °C. Both materials showed their maximum CO2 capture at almost 100 °C before the others, along with a weight increase approximately 2.5 times greater than that obtained by the unmodified material. Based on these results, it is possible to establish that a 75–25% proportion of sodium and potassium carbonates, regardless of the type of carbonate used in greater proportion, is the optimal composition to significantly increase the capture abilities of lithium cuprate under the direct pathway (CO–O2 atmosphere). In the last section of the thermograms, only the pristine material presented a significant weight increase from 10.2 wt% at 650 °C to 29 wt% at 725 °C, while the rest of the modified materials did not show any increase in weight due to the chemisorption–desorption equilibrium. This result evidenced that the diffusion process is delayed in the pristine sample due to the absence of a melted or partially melted phase. Finally, at T > 750 °C, all the samples exhibited the same behavior during the desorption process. As a result of the latter, Na- and K-containing Li2CuO2 samples lost all the captured CO2, except for the Na75 and K75 materials which retained 8–11 wt%.Then, isotherms tests were carried out for comparative purposes at the same temperatures as those performed in Fig. 6. In Fig. 8, all TG isothermal profiles showed a typical exponential behavior as a function of time. For Li2CuO2, the isotherms showed that capture increases gradually from 3.6 wt% at 400 °C to 34.0 wt% at 650 °C. Then, the isotherm at 700 °C presented a decrease in capture (25.6 wt%). Once the sorption–desorption equilibrium was established in this sample, no weight gain was observed. Conversely, the isotherm at 650 °C continued to gain weight through the CO2 capture. Under these thermal conditions, the maximum CO2 capture for the pristine material was reached at 180 min with an efficiency (ε) of 84.5%, considering that 40.22 wt% is the maximum theoretical value for a complete CO2 capture reaction in Li2CuO2. On the other hand, the isothermal profiles obtained at T < 650 °C showed that in Na- and K-containing Li2CuO2 samples, the sorption process started faster than in the Li2CuO2 case, reaching higher captures. Similar to Li2CuO2 profiles, those of Na- and K-containing Li2CuO2 showed that the capture rate increases as a function of temperature between 400 and 650 °C. Furthermore, in line with the dynamic profiles in the range of 680–750 °C, the isotherms presented lower weight increases compared to the isotherms tested at 650 °C. This may be due to the CO2 sorption–desorption equilibrium that occurred at T > 650 °C in all the modified samples. Finally, all the isotherms at T > 600 °C showed that once the maximum capture was reached, it remained constant during the rest of the experiment, except for the K75 sample at 700 °C, which exhibited a weight decrease after 15 min of the experiment, showing that the desorption process took place.
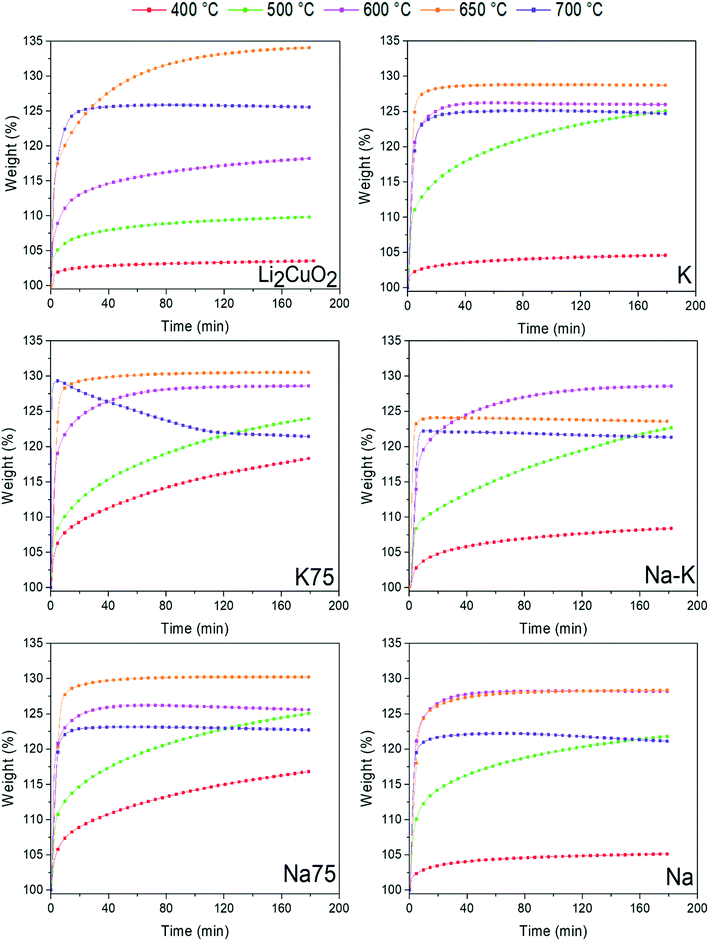 | ||
| Fig. 8 Isothermal profiles of Li2CuO2 and Na- and K-containing Li2CuO2 samples tested at different temperatures (400–700 °C) for CO2 capture. | ||
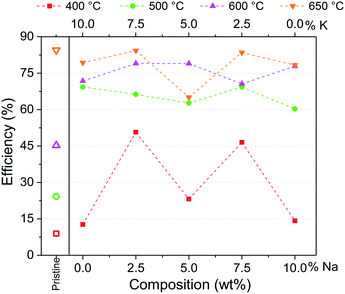
After the isothermal tests, an additional analysis was carried out to inquire about the best thermal conditions for the formation of a possible eutectic or lower-melting point phase during the capture process. For this, the CO2 capture efficiencies (ε) were calculated at 180 min from isothermal profiles between 400 and 650 °C. Moreover, the values from Na- and K-containing Li2CuO2 tests were normalized per gram of Li2CuO2, considering that 90% of the whole samples are composed of Li2CuO2 as described in the experimental section. The results are shown in Fig. 9 as a function of sodium content in Na- and K-containing Li2CuO2 samples. Pristine lithium cuprate efficiencies were added as a benchmark.
In line with the observations in dynamic profiles (see Fig. 7), between 400 and 600 °C, the effect of the addition of carbonates on CO2 capture was evident. The greatest improvement (∼5.5 times) in CO2 capture compared to pristine behavior at 400 °C was obtained with samples K75–Li2CuO2 and Na75–Li2CuO2. Moreover, between 500 and 600 °C, CO2 capture was ∼2–3 times higher than that obtained with pure Li2CuO2. Finally, at 650 °C, efficiencies among the modified materials were closer to the ε obtained with the pristine material (∼84.0%). However, it must be pointed out that the modified samples were synthesized with 10% less of Li2CuO2. This result agrees with the observations in dynamic tests (Fig. 7), where Li2CuO2 showed rapid bulk sorption, while the other samples reached the CO2 sorption–desorption equilibrium. Regarding Na- and K-containing Li2CuO2 results, the greatest differences among the modified samples were observed at 400 °C. Under these conditions, samples with 75% of K or Na carbonate presented ε ∼3.5 times higher than their counterparts modified with a single carbonate. Based on these results, it seems that at 400 °C, a carbonate mixture phase was formed in Na- and K-containing Li2CuO2 materials, mainly in the samples composed of 75% of Na or K carbonate. Then, between 500 and 650 °C, the ε values slowly increase with temperature, except for the Na–K–Li2CuO2 sample at 650 °C, which showed a significant decrease in CO2 capture. In this temperature range, a possible eutectic or lower-melting point phase must be totally formed, improving the diffusional processes in all the samples modified with molten salts; thus, their CO2 capture capacities were similar, highlighting the performance of the K75–Li2CuO2 material (Na composition equal to 2.5%) in all the temperature ranges evaluated.
3.5 Comparison of CO2 captured and released as a function of Na and K content
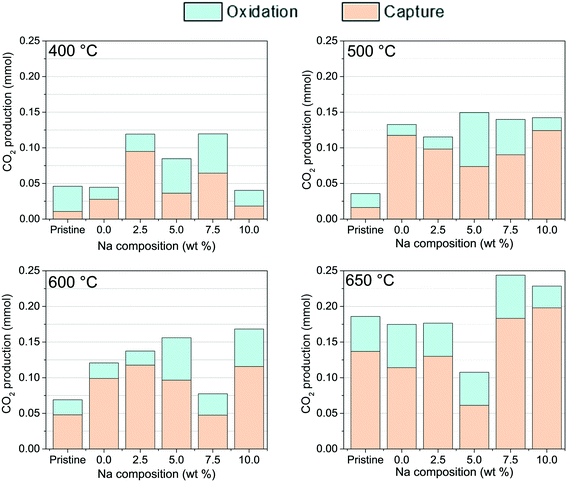
Based on all previous results, CO2 released (section 3.3) and CO2 captured (section 3.4) by each ceramic material strongly depend on the Na and K contents. Therefore, an additional analysis was carried out to compare the behaviors described above and identify the optimal compositions and thermal conditions to enhance the CO2 capture and/or release from the ceramic material. To achieve this, the amounts of CO2, in mmol, were calculated from the maximum isothermal point observed in each profile between 400 and 650 °C (Fig. 6 and 8). The corresponding results are shown in Fig. 10 as a function of sodium content in Li2CuO2 and Na- and K-containing Li2CuO2 samples, where pristine lithium cuprate values were added as a benchmark.From Fig. 10, it is evident that there is a significant enhancement in CO2 captured and released as a consequence of the addition of the carbonate at 400, 500, and 600 °C. Under these thermal conditions, especially at 500 °C, at least three Na- and K-containing Li2CuO2 materials presented twice the total amounts of CO2 released and/or captured compared to unmodified Li2CuO2. At the same temperature, it was also detected at 500 °C that the Na–K–Li2CuO2 sample was the only sample, among all compositions and under thermal conditions tested, with similar amounts of CO2 released and captured, reaching the highest amount of CO2 released. In fact, at the highest temperature (Fig. 10, 650 °C), the ability of the unmodified sample to capture CO2 was increased greatly, reaching similar or higher amounts than Na-containing Li2CuO2 materials with Na contents lower than 5.0%. In these three cases, there were no enhancements due to the carbonate addition, although the samples modified with 7.5 and 10.0% of sodium (Na75–Li2CuO2 and Na–Li2CuO2) exhibited better CO2 capture properties than the unmodified sample. Moreover, the last two materials had the highest total amounts of CO2 formed, captured and released, among all tested materials. These CO2 values are close to the total amount expected (0.233 mmol) for a complete CO oxidation to CO2, showing a slight experimental error lower than the 5% in the Na75–Li2CuO2 sample.
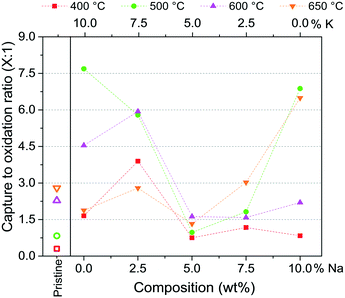
Furthermore, the ratio between CO2 capture and release is presented in Fig. 11 as a function of sodium content and temperature. If the ratio is higher than 1.0, the CO2 captured is higher than the CO2 released. On the contrary, if the ratio is lower than 1.0, the CO2 released is greater. Considering that both CO and CO2 must be eliminated in the gas phase, a ratio higher than 1.0 is expected. In this line, pristine Li2CuO2 showed ratios between 2 and 3 in the high-temperature range (600 and 650 °C). On the other hand, Na- and K-containing Li2CuO2 samples presented two different behaviors, depending on the sodium composition of each material. Regarding materials modified with amounts of sodium lower than 5.0%, the ratio is highly enhanced between 400 and 600 °C, showing the best performance with the sample modified with 10.0% of potassium (Na composition equal to zero). The ratio of 7.7 obtained with this sample at 500 °C represents the greatest improvement in the capture process due to the addition of carbonates among all materials and thermal conditions studied. As the sodium content increases from 0.0 to 5.0 at this temperature, the ratio decreases at 500 °C, implying an increment in the CO2 release and/or a decrease in the CO2 capture. In particular, at 500 °C, the sample modified with equal amounts of Na and K (Na–K–Li2CuO2) showed an equal ratio. In contrast, with temperature increasing from 500 to 650 °C, as Na content increases from 5.0 to 10.0%, higher ratios (6.5 and 6.9) were achieved. This is especially evidenced with the Na–Li2CuO2 material. Thus, it seems that high Na content increased the ratio at high temperatures (650 °C), with an opposite behavior at low temperatures (500 °C). Finally, from Fig. 11 it can be established that the addition of a single carbonate, either potassium or sodium, allowed for a greater increase in the ratio than the materials prepared with a mixture of Na and K carbonates (2.5 ≤ Na ≤ 7.5).
To select the best performing materials during the dual process: CO oxidation followed by CO2 capture, a combination of results from Fig. 10 and 11 must be considered, which provide information on the total amount of CO converted and the ratio between the CO2 captured/released, respectively. Materials able to convert a highly toxic gas, such as CO into CO2, are being sought, but also, they must reduce the concentration of carbon dioxide released to the gas phase, capturing it. Analyzing the results, it can be established that if a CO2 captured/released balanced ratio is desired, the mixed Na–K–Li2CuO2 sample can be used at 500 and 600 °C, where high CO2 formations were detected (∼0.15 mmol, Fig. 10), with a ratio close to 1.0 in Fig. 11. On the other hand, at 500 °C, it was observed that the materials Na–Li2CuO2 and K–Li2CuO2 presented high CO2 formation (0.13–0.14 mmol, Fig. 10), accompanied by a great tendency to capture this greenhouse gas on a ceramic material (ratios equal to 6.9 and 7.7, Fig. 11). Thus, these two materials modified with a single alkali-carbonate are proposed as promising materials for the dual process evaluated at moderate temperatures. Furthermore, the sodium-modified sample (Na–Li2CuO2) also showed a similar trend at 650 °C, making it a potential material for CO conversion–CO2 capture at high temperatures. In this case, a complete CO conversion was detected in Fig. 10. However, a decrease in its ratio value was observed (ratio equal to 6.5) compared to that obtained at 500 °C (ratio equal to 6.9, Fig. 11), which shows that part of the CO2 was released to the gas phase.
Further comparison between the global CO oxidation and CO2 chemisorption (indirect pathway) results of alkali modified Li2CuO2 and those of most-studied materials is due to deepen our understanding of the potential of our proposed materials. In the case of alkali zirconates, one of the pioneers in the study of consecutive oxidation–capture in alkali ceramics, Na2ZrO3 showed superior performance compared to Li2ZrO3, since the latter was not particularly suited for CO2 capture.22,71 Then, Mendoza-Nieto et al.22 and Alcántar-Vázquez et al.71 showed how in similar 5.0 vol% CO and 3.0–5.0 vol% O2 atmosphere, while CO conversion started as early as 445 °C and displayed complete conversion between 500 and 580 °C, significant CO2 capture started around 600 °C. It should be noted that this weight increase is associated with the bulk capture start, noting the limitations of superficial capture in this kind of material. Moreover, this superficial capture, starting at 180 °C, was weakened by CO2 desorption around 320 °C for both materials, showing an unstable CO2 chemisorption–desorption equilibrium attributed to the low CO presence. In terms of isothermal capture, the greatest results were obtained approximately at 600 °C, reaching a 10 wt% weight increase. Overall, although oxidation is performed successfully in zirconate materials, the low gas–ceramic interaction may be a limitation for CO2 capture concerning the dual oxidation–capture process.
A very similar behavior was found in sodium cobaltate (NaCoO2).72 Under an atmosphere of low-CO concentration, CO oxidation took a more prominent impact, with the CO2 presence starting at 160 °C and reaching complete conversion at 490 °C. On the other hand, even if CO2 capture started at 280 °C, significant capture started at 400 °C with the onset of bulk capture, obtaining the best isothermal results at 700 °C with a weight increase of 10 wt%. Once again, CO oxidation seems to strongly overshadow CO2 capture results.
Finally, different results were observed with lithium and sodium ferrites (Li5FeO4, Li/NaFeO2).28–30 For Li5FeO4, CO oxidation started at 350 °C and reached a maximum CO conversion of 55% at 500 °C. CO2 capture, meanwhile, started at 200 °C (superficial capture), remaining constant in CO2 sorption–desorption equilibrium until 600 °C, where bulk capture made the obtention of high weight increase possible. In fact, the greatest weight increase was 49 wt%, at 750 °C, the highest among all the materials studied for this process. In this case, lithium ferrite showed better overall results for CO2 capture and very similar results for CO oxidation to alkali-modified lithium cuprate. Nevertheless, Na- and K-containing Li2CuO2 materials displayed a broader temperature interval in which capture is significant; these materials reached in general weight increases superior to 10 wt% from 460 until 760 °C (start of CO2 desorption), while lithium ferrites reached this increase until 600 °C and started desorption at 700 °C. Therefore, the materials studied in this work may have a wider temperature interval in which they are applicable for CO2 capture. Now, in the case of Li/NaFeO2, just as with cobaltates and zirconates, CO2 capture was negligible and CO oxidation took precedence.
3.6 Mechanism for CO oxidation and CO2 chemisorption
The schematic representation in Fig. 12 is a proposed mechanism, considering the results obtained from TGA and catalytic results, taking firstly into consideration the role of the added carbonates in the synthesis of Na- and K-containing Li2CuO2 samples (step I). When the sample is heated at T > 200 °C and exposed to the CO–O2 atmosphere, it is expected that the oxygen vacancies located on the ceramic surface will be occupied by O2, causing their homolytic dissociation into oxygen atoms (step II). A CO molecule from the fluid phase then reacts with the oxygen atom to form CO2 (step III). Next, the CO2 formed can be either chemisorbed on the Li2CuO2 surface, forming Li2CO3 and CuO as secondary phases (step IV), or it can be desorbed from the ceramic surface to the gas phase (step IVa). After that, as CO conversion continues and lithium carbonate composition increases progressively on the ceramic surface due to the CO2 capture, the possibility of these alkali carbonates combining with the others added during synthesis (Na2CO3 and K2CO3) also increases, resulting in partial melting and promoting the progressive formation of a possible eutectic phase or lower-melting point phase over the solid surfaces. Finally, this molten phase is responsible for enhancing the diffusion of both reagents (CO and O2) throughout the bulk material (step V), promoting the homolytic dissociation of O2, which allows the repetition of the proposed cycle. As result, CO conversion and CO2 chemisorption processes are highly improved, depending on the Na and K contents and temperature tested.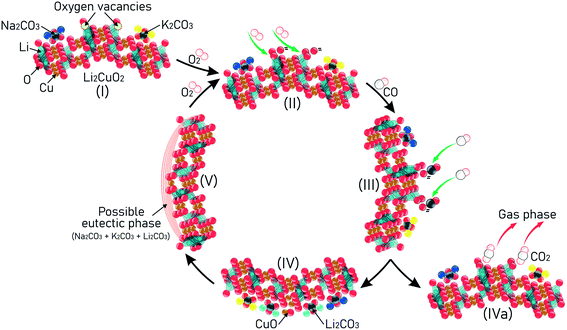 | ||
| Fig. 12 A proposal for the mechanism using Na- and K-containing Li2CuO2 materials in consecutive CO conversion and subsequent CO2 capture. | ||
Conclusions
For the first time, the effect of the addition of different mixtures of sodium and potassium carbonates to lithium cuprate (Li2CuO2) was analyzed, during two consecutive CO oxidation and CO2 chemisorption processes. The results showed that unmodified Li2CuO2 was capable of performing CO oxidation; however, low CO2 formation was obtained. Then, the addition of alkali carbonates to Na- and K-containing Li2CuO2 samples increased and shifted the CO2 production (capture and release) to lower temperatures. Capture capacities were especially improved in all the modified materials in a wide temperature range between 350 and 650 °C. Furthermore, considering the experimental evidence from DSC, TGA, and catalytic analyses, a reaction path was proposed and supported by the formation of new carbonate mixture phases between mechanically added carbonates (Na2CO3 and/or K2CO3) and lithium carbonate (Li2CO3), which is produced as a consequence of the CO2 capture process. The melting of these new phases enhances the diffusion of both reagents (CO and O2) towards the bulk material. This effect promotes, in the first place, the oxidation of CO and then, the capture of CO2. However, the formation of the lower-melting point phases strongly depends not only on the sodium and potassium contents but also on the thermal conditions used. To select the best performing materials, the total CO2 formation was taken into consideration, quantifying the amounts produced and the ratios between captured CO2 to released CO2 from the ceramic as a consequence of the CO oxidation. Although all the Na- and K-containing Li2CuO2 samples showed good performance, the materials modified with a single carbonate (K–Li2CuO2 at 500 °C and Na–Li2CuO2 at 500 and 650 °C) presented the best enhancement of CO2 production with a high ratio of captured/released CO2, ensuring the elimination of both CO and CO2. Likewise, the material modified with equal amounts of sodium and potassium carbonates (Na–K–Li2CuO2) showed high CO2 formation at 500 °C with a balanced ratio between captured and released carbon dioxide. Thus, these modified materials with a high tendency to capture and store CO2 would be tested and become promising options, useful for hydrogen purification from state-of-art produced syngas.Conflicts of interest
There are no conflicts to declare.Acknowledgements
This work was financially supported by PAPIIT-UNAM (IA-106321) and PAIP 5000-91-77 grants.References
- K. Liu, C. Song and V. Subramani, Hydrogen and Syngas Production and Purification Technologies, John Wiley and Sons, Hoboken, NJ, USA, 2009 Search PubMed.
- A. Basile, F. Dalena, J. Tong and T. N. Vezirolu, Hydrogen Production, Separation and Purification for Energy, Institution of Engineering and Technology, London, 2017 Search PubMed.
- R. Houston, N. Labbé, D. Hayes, C. S. Daw and N. Abdoulmoumine, React. Chem. Eng., 2019, 4, 1814–1822 Search PubMed.
- L. Yang and X. Ge, Adv. Bioenergy, 2016, 1, 125–188 Search PubMed.
- Ammonia, ed. A. Nielsen, Springer Berlin Heidelberg, Berlin, Heidelberg, 1995 Search PubMed.
- S. H. Oh and R. M. Sinkevitch, J. Catal., 1993, 142, 254–262 Search PubMed.
- R. M. Torres Sanchez, A. Ueda, K. Tanaka and M. Haruta, J. Catal., 1997, 168, 125–127 Search PubMed.
- J. J. Baschuk and X. Li, Int. J. Energy Res., 2001, 25, 695–713 Search PubMed.
- K. C. Waugh, D. Butler and B. E. Hayden, Catal. Lett., 1994, 24, 197–210 Search PubMed.
- A. Hussain, S. R. Guiot, P. Mehta, V. Raghavan and B. Tartakovsky, Appl. Microbiol. Biotechnol., 2011, 90, 827–836 Search PubMed.
- N. Yan, X.-Z. Fu, K. T. Chuang and J.-L. Luo, J. Power Sources, 2014, 254, 48–54 Search PubMed.
- A. Alihoseinzadeh, A. A. Khodadadi and Y. Mortazavi, Int. J. Hydrogen Energy, 2014, 39, 2056–2066 Search PubMed.
- S. Sircar and T. C. Golden, Sep. Sci. Technol., 2000, 35, 667–687 Search PubMed.
- V. V. Dutov, G. V. Mamontov, V. I. Zaikovskii, L. F. Liotta and O. V. Vodyankina, Appl. Catal., B, 2018, 221, 598–609 Search PubMed.
- A. Manasilp and E. Gulari, Selective CO oxidation over Pt/alumina catalysts for fuel cell applications, 2002, vol. 37 Search PubMed.
- C. Dupont, F. Delbecq, D. Loffreda and Y. Jugnet, J. Catal., 2011, 278, 239–245 Search PubMed.
- O. Pozdnyakova, D. Teschner, A. Wootsch, J. Kröhnert, B. Steinhauer, H. Sauer, L. Toth, F. C. Jentoft, A. Knop-Gericke, Z. Paál and R. Schlögl, J. Catal., 2006, 237, 1–16 Search PubMed.
- H. Igarashi, H. Uchida, M. Suzuki, Y. Sasaki and M. Watanabe, Appl. Catal., A, 1997, 159, 159–169 Search PubMed.
- Y. Zhang, Y. Gao, H. Pfeiffer, B. Louis, L. Sun, D. O'Hare and Q. Wang, J. Mater. Chem. A, 2019, 7, 7962–8005 Search PubMed.
- T. Zhao, M. Rønning and D. Chen, J. Energy Chem., 2013, 22, 387–393 Search PubMed.
- J. I. Ida and Y. S. Lin, Environ. Sci. Technol., 2003, 37, 1999–2004 Search PubMed.
- J. A. Mendoza-Nieto, Y. Duan and H. Pfeiffer, Appl. Catal., B, 2018, 238, 576–585 Search PubMed.
- Q. Xiao, X. Tang, Y. Zhong and W. Zhu, J. Am. Ceram. Soc., 2012, 95, 1544–1548 Search PubMed.
- D. Peltzer, J. Mùnera, L. Cornaglia and M. Strumendo, Chem. Eng. J., 2018, 336, 1–11 Search PubMed.
- E. Vera, B. Alcántar-Vázquez and H. Pfeiffer, Chem. Eng. J., 2015, 271, 106–113 Search PubMed.
- M. T. Nguyen Dinh, P. Rajbhandari, C. Lancelot, P. Blanchard, C. Lamonier, M. Bonne, S. Royer, F. Dumeignil and E. Payen, ChemCatChem, 2014, 6, 328–338 Search PubMed.
- D. Vengust, B. Jančar, T. Sever, A. Šestan, V. Bobnar, Z. Kutnjak, N. Daneu, D. Suvorov and M. Spreitzer, Ceram. Int., 2021, 47(8), 11687–11693 Search PubMed.
- H. A. Lara-García, E. Vera, J. A. Mendoza-Nieto, J. F. Gómez-García, Y. Duan and H. Pfeiffer, Chem. Eng. J., 2017, 327, 783–791 Search PubMed.
- J. F. Gómez-García, J. A. Mendoza-Nieto, A. Yañez-Aulestia, F. Plascencia-Hernández and H. Pfeiffer, Fuel Process. Technol., 2020, 204, 106404 Search PubMed.
- M. Kato, K. Essaki, K. Nakagawa, Y. Suyama and K. Terasaka, J. Ceram. Soc. Jpn., 2005, 113, 684–686 Search PubMed.
- A. Yañez-Aulestia, J. F. Gómez-García, J. A. Mendoza-Nieto, Y. Duan and H. Pfeiffer, Thermochim. Acta, 2018, 660, 144–151 Search PubMed.
- I. Ham-Liu, J. A. Mendoza-Nieto and H. Pfeiffer, J. CO2 Util., 2018, 23, 143–151 Search PubMed.
- K. Oh-ishi, Y. Matsukura, T. Okumura, Y. Matsunaga and R. Kobayashi, J. Solid State Chem., 2014, 211, 162–169 Search PubMed.
- Y. Matsukura, T. Okumura, R. Kobayashi and K. Oh-ishi, Chem. Lett., 2010, 39, 966–967 Search PubMed.
- A. Yañez-Aulestia, M. A. Martínez-Cruz and H. Pfeiffer, J. Phys. Chem. C, 2020, 124, 16019–16031 Search PubMed.
- Y. Guo, C. Zhao, C. Li and S. Lu, in Fire Science and Technology 2015, Springer Singapore, Singapore, 2017, pp. 725–733 Search PubMed.
- O. Ovalle-Encinia, J. A. Mendoza-Nieto, J. Ortiz-Landeros and H. Pfeiffer, Ind. Eng. Chem. Res., 2017, 56, 6124–6130 Search PubMed.
- J. Plou, I. Martínez, G. S. Grasa and R. Murillo, React. Chem. Eng., 2019, 4, 899–908 Search PubMed.
- Y. Zeng, H. Ma, H. Zhang, W. Ying and D. Fang, Fuel, 2014, 137, 155–163 Search PubMed.
- C. Zhang, Y. Li, Y. Yuan, Z. Wang, T. Wang and W. Lei, React. Chem. Eng., 2021, 6, 100–111 Search PubMed.
- G. Pannocchia, M. Puccini, M. Seggiani and S. Vitolo, Ind. Eng. Chem. Res., 2007, 46, 6696–6706 Search PubMed.
- D. J. Fauth, E. A. Frommell, J. S. Hoffman, R. P. Reasbeck and H. W. Pennline, Fuel Process. Technol., 2005, 86, 1503–1521 Search PubMed.
- I. C. Romero-Ibarra, F. Durán-Muñoz and H. Pfeiffer, Greenhouse Gases: Sci. Technol., 2014, 4, 145–154 Search PubMed.
- M. T. Flores-Martínez and H. Pfeiffer, Greenhouse Gases: Sci. Technol., 2015, 5, 802–811 Search PubMed.
- R. Xiong, J. Ida and Y. S. Lin, Chem. Eng. Sci., 2003, 58, 4377–4385 Search PubMed.
- J. Liu, Z. Wang, Z. Wang, J. Song, G. Li, Q. Xu, J. You, H. Cheng and X. Lu, Phys. Chem. Chem. Phys., 2019, 21, 13135–13143 Search PubMed.
- M. Seggiani, M. Puccini and S. Vitolo, Int. J. Greenhouse Gas Control, 2013, 17, 25–31 Search PubMed.
- X. Yang, W. Liu, J. Sun, Y. Hu, W. Wang, H. Chen, Y. Zhang, X. Li and M. Xu, ChemSusChem, 2016, 9, 2480–2487 Search PubMed.
- N. Gao, K. Ma, T. Ding, J. Cai, Y. Tian and X. Li, Chin. Chem. Lett., 2018, 29, 482–484 Search PubMed.
- S. Zhang, Q. Zhang, H. Wang, Y. Ni and Z. Zhu, Int. J. Hydrogen Energy, 2014, 39, 17913–17920 Search PubMed.
- L. M. Palacios-Romero and H. Pfeiffer, Chem. Lett., 2008, 37, 862–863 Search PubMed.
- L. M. Palacios-Romero, E. Lima and H. Pfeiffer, J. Phys. Chem. A, 2009, 113, 193–198 Search PubMed.
- H. A. Lara-García, M. J. Ramírez-Moreno, J. Ortiz-Landeros and H. Pfeiffer, RSC Adv., 2016, 6, 57880–57888 Search PubMed.
- H. A. Lara-García and H. Pfeiffer, Chem. Eng. J., 2017, 313, 1288–1294 Search PubMed.
- L.-C. Daza-Gómez, V.-F. Ruiz-Ruiz, J. A. Mendoza-Nieto, H. Pfeiffer and D. Díaz, Appl. Clay Sci., 2020, 190, 105590 Search PubMed.
- H. Martínez-Hernández, J. A. Mendoza-Nieto, H. Pfeiffer, J. Ortiz-Landeros and L. Téllez-Jurado, Chem. Eng. J., 2020, 401, 125992 Search PubMed.
- A. Cruz-Hernández, J. A. Mendoza-Nieto and H. Pfeiffer, J. Energy Chem., 2017, 26, 942–947 Search PubMed.
- J. B. Condon, Surface area and porosity determinations by physisorption Measurements and theory, Elsevier, Amsterdam, The Netherlands, 1st edn, 2006 Search PubMed.
- F. Rouquerol, J. Rouquerol and K. Sing, in Adsorption by Powders and Porous Solids, Elsevier, 1999, pp. 1–26 Search PubMed.
- K. A. Cychosz, R. Guillet-Nicolas, J. García-Martínez and M. Thommes, Chem. Soc. Rev., 2017, 46, 389–414 Search PubMed.
- K. S. W. Sing and R. T. Williams, Adsorpt. Sci. Technol., 2004, 22, 773–782 Search PubMed.
- B. Sellergren and A. J. Hall, in Fundamental aspects on the synthesis and characterisation of imprinted network polymers, 2001, pp. 21–57 Search PubMed.
- H. A. Lara-García, B. Alcántar-Vázquez, Y. Duan and H. Pfeiffer, J. Phys. Chem. C, 2016, 120, 3798–3806 Search PubMed.
- U. R. Pillai and S. Deevi, Appl. Catal., B, 2006, 64, 146–151 Search PubMed.
- H. Pfeiffer, in Advances in CO2 Conversion and Utilization, 2010, pp. 233–253 Search PubMed.
- K. Ramesh, L. Chen, F. Chen, Y. Liu, Z. Wang and Y. F. Han, Catal. Today, 2008, 131, 477–482 Search PubMed.
- J. Tong, X. Lei, P. Zhang, K. Huang, G. Mbamalu and C. Qin, New J. Chem., 2018, 42, 16372–16377 Search PubMed.
- X. Lei, K. Haines, K. Huang and C. Qin, J. Power Sources, 2016, 305, 161–166 Search PubMed.
- X. Lei, K. Haines, K. Huang and C. Qin, J. Phys. Chem. A, 2015, 119, 8806–8812 Search PubMed.
- A. D. Pelton, C. W. Bale and P. L. Lin, Can. J. Chem., 1984, 62, 457–474 Search PubMed.
- B. Alcántar-Vázquez, Y. Duan and H. Pfeiffer, Ind. Eng. Chem. Res., 2016, 55, 9880–9886 Search PubMed.
- E. Vera, B. Alcántar-Vázquez, Y. Duan and H. Pfeiffer, RSC Adv., 2016, 6, 2162–2170 Search PubMed.
| This journal is © The Royal Society of Chemistry 2021 |

![[thin space (1/6-em)]](https://www.rsc.org/images/entities/char_2009.gif) :
: