 Open Access Article
Enhanced performance of pencil-drawn paper-based electrodes by laser-scribing treatment†
Vanessa N. Ataide‡
*a,
Wilson A. Ameku‡a,
Raphael P. Bacil‡ a,
Lúcio Angnes‡
 a,
William R. de Araujo‡
 b and
Thiago R. L. C. Paixão‡
 a
a
aDepartment of Fundamental Chemistry, Institute of Chemistry, São Paulo University-USP, São Paulo, SP 05508-900, Brazil. E-mail: trlcp@iq.usp.br
bDepartment of Analytical Chemistry, Institute of Chemistry, State University of Campinas-UNICAMP, Campinas, SP 13083-970, Brazil
First published on 5th January 2021
Abstract
Electrochemical Paper-based Analytical Devices (ePADs) are an alternative to traditional portable analytical techniques due to features such as low-cost, easy surface modification with different materials, and high sensitivity. A fast and simple method to fabricate enhanced ePADs using pencil-drawing which involves the CO2 laser treatment of the carbon surface deposited on paper is described. The electrochemical performances of the devices were evaluated using cyclic voltammetry (CV) with different redox probes and electrochemical impedance spectroscopy (EIS). The electrochemical results show that a treated surface presents a lower resistance to charge transfer and changes the approach of the probe and the overlap of its orbitals with the electrode. To investigate the effects of the laser treatment process, chemical and structural characteristics were evaluated using scanning electron microscopy (SEM), X-ray photoelectron spectroscopy (XPS), and Raman spectroscopy. These results indicated that laser treatment promoted the restoration of carbon–carbon double bonds and removed a thin layer of nanodebris present in commercial pencils, resulting in an improvement of the electrochemical kinetics. As a proof-of-concept, the Pencil-Drawing Electrode (PDE) was used for the detection and quantification of furosemide (FUR) in a sample of synthetic urine, exhibiting a limit of detection (LOD) of 2.4 × 10⁻⁷ mol L−1. The percentages of recovery of the FUR added to the samples A and B were 95% and 110%, respectively. The analysis using CO2 laser-treated PDE resulted in a fast, simple, and reliable method for this doping agent.
1 Introduction
The Paper-based Analytical Devices (PADs) proposed by the Whitesides group in 2007 received great attention due to their features such as low-cost, disposability, low volume-sample requirement, and ease-of-use.1 These PADs, have a three-dimensional fibrous structure conferring microfluidic properties, biocompatibility and biodegradability, are easy to modify and available worldwide.2,3 Thus, they provide an alternative method for clinical, environmental, forensics, and food quality control analysis.4–6 Initially, colorimetric detection was the main technique coupled to PADs due to their simplicity. In 2009, Dungchai et al.7 reported the first PAD based on electrochemical detection (ePAD). This approach allows the miniaturization of conductive tracks on paper that with the use of portable potentiostats, enables in-field electrochemical paper-based measurements coupled with different electrochemical techniques making it suitable for application in the analysis of single or multiple species of interest.8 Remarkably, the electrochemical detectors can be fabricated without a considerable increase in the final cost of the device and allow an enhance in selectivity and detectability when compared to the colorimetric setup. Different approaches have been used to create these ePADs, such as inkjet printing,9 pencil drawing,10,11 screen-printing,7 sputtering,12 laser-scribing,13 and microwire attachment.14 Besides, novel methods have been emerging every year, thereby expanding the scope of electroanalytical measurements outside laboratories.One of the simplest ways to fabricate ePADs is by pencil-drawing, which involves the transfer of conductive carbon materials onto paper using a pencil. Also, this technique allows easy and rapid fabrication of ePADs using materials available worldwide15 and with limited resources and/or poor infrastructure.16 These pencil leads are exfoliated and the graphite layers get stuck in the irregular structured cellulose fibers, creating a conductive carbon track with a smooth surface.17 The PDEs can be applied into several fields of interest, such as in the determination of Pb2+ in environmental samples by anodic stripping voltammetry,18 as a flexible anode in ion-potassium and lithium-ion batteries,19 in ion-selective electrodes,20 in glucose biosensing,21 in the contactless conductivity detection (C4D) for sodium and potassium ions,22 among others.
The use of PDEs in electrochemical applications is relatively recent; therefore, the literature still lacks studies regarding the role of the graphite surface in the heterogeneous electron transfer to different redox species. The heterogeneity of the graphite surface in drawing pencils occurs due to the composition of the matrix in which it is inserted. The commercial drawing pencil composition consists of a mixture of graphite, clay, and binding agents, such as waxes, polymers, and resins. The percentages of graphite and the other components of the matrix classify the pencil concerning its hardness. The designation H indicates that the pencil contains a higher amount of clay, so it is harder. The designation B means that the pencil includes higher amounts of graphite, making it softer and creating a darker or black mark.18,23 The presence of clay plays a vital role in modifying the graphite structure, resulting in increasing (hard pencils) or decreasing (soft pencils) structural disorder. The electrochemical behavior of different redox probes is affected by the structural differences of varying graphite surfaces in different matrices.24 On the other hand, the treatment and/or activation of carbon surfaces by different techniques has been widely described in the literature,11,25–28 demonstrating that the nature of the surface plays an important role in electron transfer. In this sense, Santhiago et al.29 reported that an electrochemical surface treatment in PDE improved the electron transfer of potassium ferrocyanide. Given the simplicity of the pencil-drawing technique and the ability to activate/treat the graphite surface, it provides perspectives towards the development of methods for portable electrochemical sensors with enhanced performance in an affordable way.
The use of different laser systems to treat/activate the surface of conventional electrodes is well-known in the literature, it is mainly used for carbon materials such as glassy carbon (GC). Usually, the main effects described are desorption of impurities, ablation of carbon microparticles, and formation or exposure of active regions on the GC surface, which could provide reproducible high electron transfer rates.30,31 However, the literature lacks studies regarding the effects of the simple laser treatment under carbon tracks on paper platform. The superficial laser treatments are dependent on the electrode material, laser system used (type, power, pulse duration, etc.). Thus, a critical factor when making laser photo-thermal activation on graphite film onto the paper substrate is to ensure that it is useful, i.e., providing lower resistances in the graphite surface without burning or destroying the cellulosic substrate. Another challenge is to guarantee reproducibility in the applied power, which is directly related to cleaning the lenses that constitute the optical system of the equipment.
To demonstrate the application of CO2 laser-treated PDEs as portable electrochemical sensors, we studied the detection of furosemide (FUR), a diuretic drug widely used for the treatment of hypertension and renal failure, pulmonary edema, liver cirrhosis, and nephrotic syndrome.32,33 However, it is also a doping agent since it increases the urinary flow and changes its composition to hide the presence of prohibited substances in the body.34
Therefore, in this work, we developed a fast and simple method to fabricate the ePADs using a commercial pencil to create the conductive tracks on office paper and a CO2 laser system to treat/activate this surface and pattern the design of the electrodes. The results showed an improved electron transfer process, which could be attributed to the removal of the debris present in the graphite matrix, and also to the partial restoration of carbon–carbon double bonds on the graphite surface. Additionally, the fabricated PDE was used in the detection of FUR in synthetic urine samples.
2 Experimental
2.1 Materials and chemicals
The office paper (A4 size) used to fabricate the devices were obtained from Chamex® (International Paper, Brazil). Analytical grade hexaammineruthenium(III) chloride, ascorbic acid (AA), and furosemide (FUR) reagents were purchased from Sigma-Aldrich (St. Louis, MO, USA). Potassium hexacyanoferrate(III/IV) and potassium chloride were acquired from Merck (Darmstadt, Germany). Potassium monohydrogen phosphate and potassium dihydrogen phosphate were obtained from Synth (Diadema, SP, Brazil). All reagents were used without further purification. 6B pencils (Faber Castell, Stein, Germany) were purchased from the local market. Silver ink was obtained from Joint Metal Comércio Ltda (Diadema, SP, Brazil). All solutions were prepared in deionized water with a resistivity of 18.2 MΩ cm (at 25 °C, Direct-Q 5 Ultrapure Water Systems, Millipore, MA, USA).Stock solutions of all analytes were prepared by adding the appropriated weighed amounts to known volumes of 0.1 mol L−1 KCl or 0.1 mol L−1 phosphate buffer-supporting electrolytes. Controlled amounts of these stock solutions were then suitably diluted to the desired concentrations with the convenient supporting electrolyte before each experiment.
The commercial screen-printed electrodes of carbon and graphene were purchased from Metrohm DropSens (Switzerland).
2.2 Fabrication of PDEs
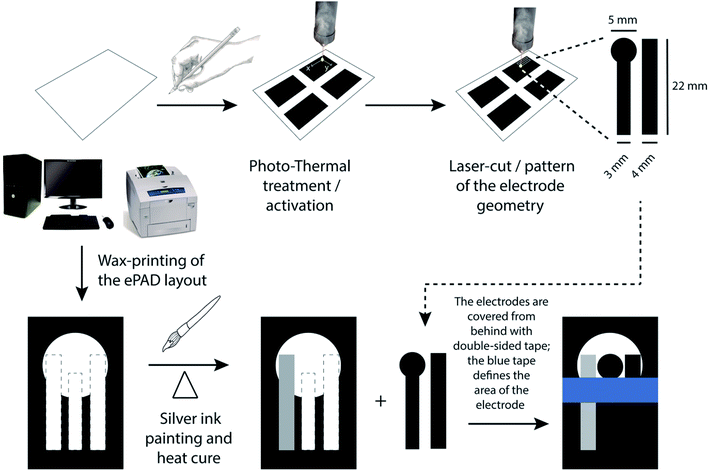
The steps followed in the fabrication of PDEs are presented in Fig. 1. Initially, multiple 4 cm × 4 cm squares were drawn on an A4 office paper using a commercial 6B pencil to create an electrically conductive graphite layer. Then, the graphite surface was subjected to photo-thermal treatment using CO2 pulsed laser (WorkSpecial 9060C, São Paulo, Brazil) with a wavelength of 10.6 μm and at a power of 6.6% (500 mW). The laser output device to the graphite surface was positioned at a distance of 10 mm and the scan rate used was 25 mm s−1. Fig. S1† presents a photo of the graphite surface newly treated by laser. It can be observed that the region that has undergone the photo-thermal treatment becomes slightly clear concerning the initially dark gray color of the graphite, being possible to notice the region of the treated graphite surface visually. Later, the graphite/paper was cut into the desired patterns to be used as working (WE) and counter (CE) electrodes. In this case, the laser power used was 10%, the distance was 10 mm (regarding the ePAD surface), and the laser cutting scan rate was 20 mm s−1. The resistance of PDE treated electrodes was then measured using a multimeter (GoldStar DM-332, South Korea).Subsequently, a Xerox ColorQube 8570 printer from Xerox (Norwalk, Connecticut, USA) was used to print an arrangement of a three-electrode system onto paper. This process enables the creation of hydrophobic barriers in office paper to limit the detection zone. Then, these barriers were melted on a thermal press (Hobby Line Metalnox, Santa Catarina, Brazil) for 30 s at 120 °C to fill the three-dimensional structure of the paper, thus hindering water absorption. Next, a reference electrode (RE) was painted using commercial silver ink, and the WE and CE were attached to the platform using double-sided tape.
2.3 Electrochemical measurements
All the electrochemical measurements were performed using an Autolab PGSTAT 128N potentiostat/galvanostat (Eco Chemie, Utrecht, The Netherlands) with a three-electrode standard configuration controlled using the software NOVA 1.11. Cyclic voltammograms (CVs) for all redox probes were recorded at a voltage scan rate of 10 mV s−1. All the voltage scan rates (ν) used during experiments are presented in the respective figure captions. Calibration curve of FUR was prepared using differential pulse voltammetry (DPV) with an amplitude of 50 mV and potential steps of 10 mV. The electrochemical impedance spectroscopy (EIS) measurements were performed in a 0.1 mol L−1 KCl solution containing 5 mmol L−1 [Fe(CN)6]3−/4− by applying an open circuit potential (OCP, vs. Ag), which the value was 0.22 V. It was also used by applying an alternating potential with an amplitude of 10 mV with a frequency range from 105 to 10−2 Hz.2.4 Interfering species and synthetic urine sample
The selectivity of the CO2 laser-treated PDE in the detection of FUR was evaluated towards the five common urinary metabolites as possible interfering species: ascorbic acid, uric acid, urea, creatinine, and glucose. The ratio of FUR/interfering species was 1![[thin space (1/6-em)]](https://www.rsc.org/images/entities/char_2009.gif) :
:![[thin space (1/6-em)]](https://www.rsc.org/images/entities/char_2009.gif) 2 (100 μmol L−1 of FUR and 200 μmol L−1 of the interfering species). The study was carried out using the DPV in the optimized experimental conditions (described in Section 2.3).
2 (100 μmol L−1 of FUR and 200 μmol L−1 of the interfering species). The study was carried out using the DPV in the optimized experimental conditions (described in Section 2.3).
A synthetic urine sample was used to demonstrate the application of the developed sensor. It was prepared according to the procedure described by Laube et al.35
2.5 Characterization of the Raman spectra
Raman spectra were obtained using a Renishaw inVia spectrometer (United Kingdom) equipped with an objective lens (Olympus) at 100× magnification, using an excitation light with a wavelength of 532 nm and power of 0.88 mW. The spectra were acquired in two modes. The first one was taken in an extended frequency window, with an exposition time of 10 s and an accumulation number of 1, at a randomly selected spot on the surface of the sample. In the second approach, Raman mapping was conducted with a static spectrum mode centered at 1500 cm−1 in an area represented by (33 × 24) μm. The mapping data were obtained from both CO2 laser-treated and non-treated PDEs and processed using MATLAB.2.6 Analysis of the XPS spectra
XPS was performed using a Thermo K-Alpha spectrometer (Thermo Scientific, Inc., UK). All spectra were obtained using an Al Kα micro-focused monochromatized source with a resolution of 0.1 eV, pass energy of 50 eV, and spot size of 400 μm.2.7 Contact angle measurements
Contact angle measurements were performed using a PixeLINK digital camera coupled with Nikon optics (Navitar, Inc., Rochester, New York, USA) to evaluate the surface hydrophilicity of both CO2 laser-treated and non-treated PDEs. Deionized water (5 and 10 μL by volume) was dropped on the surface of the device and a picture of the water drop was taken immediately. The measurement of the angle between the air/solid and air/liquid interfaces was analyzed using the ImageJ software (National Institutes of Health, USA). The average of 15 measurements taken at different regions was considered.2.8 Scanning electron microscopy analysis
The scanning electron microscopy (SEM) images were obtained using a JSM-7401F microscope (JEOL, Inc., Japan). The acceleration voltage was 5 kV, the working distance was 6.2 mm, and the detector used was a secondary electron in-lens (SEI) in both high and low magnifications. To obtain the SEM images of the cross-sectional areas, the PDE devices were cleaved using liquid nitrogen.3 Results and discussion
3.1 PDE morphological and chemical characterization
The PDE surfaces were analyzed through SEM to understand the correlation between electrochemical responses and the morphological nature. The office paper exhibited a cellulose fiber morphology (Fig. 2A and B), which is well recovered after the pencil hand-drawing process forming a continuous graphite layer with a thickness of 13.4 ± 1.9 μm (n = 35) (Fig. S2†). Some agglomeration of graphite particles was observed in the graphite coating (Fig. 2C and D). After the CO2 laser treatment, the surface presented some irregularities in the structure (Fig. 2E and F). These defects increase the active superficial area and the number of active sites responsible for the enhanced charge transfer.36 It is important to highlight, that this process does not affect the integrity of the graphite layer nor its electrical conductivity, thus allowing the use of PDEs as an electrochemical sensor.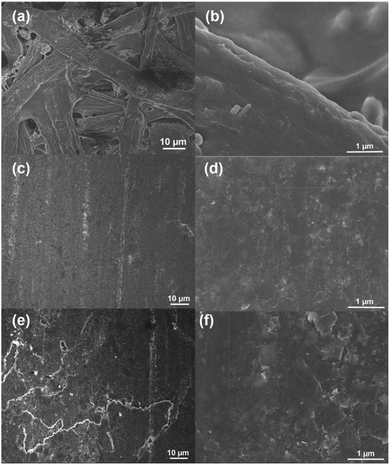 | ||
Fig. 2 SEM images with different magnifications of 1000× and 20![[thin space (1/6-em)]](https://www.rsc.org/images/entities/char_2009.gif) 000×: (a and b) office paper, (c and d) non-treated PDEs, and (e and f) CO2 laser-treated PDEs. 000×: (a and b) office paper, (c and d) non-treated PDEs, and (e and f) CO2 laser-treated PDEs. | ||
Raman spectroscopy was used to evaluate the structural changes in carbon microstructure. The spectra show the D and G bands (Fig. S3†), that are related to disorder in sp2-hybridized carbon and the C–C bond stretching in graphitic materials, respectively.37 These bands appear in the non-treated PDE spectra at 1352 and 1582 cm−1, respectively. In the CO2 laser-treated PDEs, the D and G bands occur at 1347 and 1578 cm−1, respectively. We observed that the intensities of the D and G bands differ greatly depending on the region for which the spectrum is obtained. Therefore, to understand the extent of laser activation in graphite we mapped its surface using Raman spectroscopy.
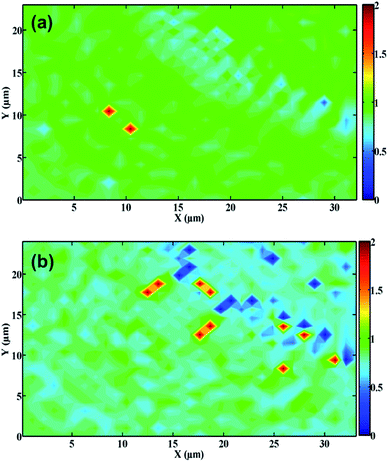
Fig. 3 displays the Raman maps of PDEs. The relative intensity of the D and G bands (ID/IG ratio) was used to determine the effect of laser activation on the graphite surface. High ID/IG ratios indicate that the graphite surface exhibits structural disorder or edge regions (such as the presence of functional groups), while low values are related to the basal plane (highly ordered regions).38–40
As can be observed, the non-treated PDE surfaces presented a more homogenous feature, in which the ID/IG ratio was mostly ∼1 (green regions), as depicted in Fig. 3A. The laser-treated PDE exhibits a heterogeneous surface, where the predominant regions were light blue/dark blue (Fig. 3B), in which the average ID/IG ratio was ∼0.5, indicating that the treatment process promoted a decrease in this ratio. We also observed this behavior in the Raman single spectrum (Fig. S3†). Therefore, we can conclude that this surface presented a low ID/IG ratio, suggesting that the graphite has predominantly structurally ordered regions.41
To verify the changes in the chemical composition promoted by the laser treatment, the surface of both PDEs were characterized by XPS. The C 1s spectra of the office paper (Fig. 4A) show the presence of C–C bonds (peak at 284.6 eV) and oxygen-containing bonds C–O (286.3 eV) and C![[double bond, length as m-dash]](https://www.rsc.org/images/entities/char_e001.gif) O (287.6 eV), which are in agreement with the chemical composition presented in the literature for cellulose.42 Fig. 4B and C show the C 1s spectra for non-treated and CO2 laser-treated PDEs, respectively. As can be observed in Fig. 4B the highest intensity at a binding energy of 284.1 eV was assigned to the π bond between carbons. Other functional groups are also present, such as C–C (284.4 eV), C–O/C–OH (285.3 eV), and C
O (287.6 eV), which are in agreement with the chemical composition presented in the literature for cellulose.42 Fig. 4B and C show the C 1s spectra for non-treated and CO2 laser-treated PDEs, respectively. As can be observed in Fig. 4B the highest intensity at a binding energy of 284.1 eV was assigned to the π bond between carbons. Other functional groups are also present, such as C–C (284.4 eV), C–O/C–OH (285.3 eV), and C![[double bond, length as m-dash]](https://www.rsc.org/images/entities/char_e001.gif) O (289.2 eV).
O (289.2 eV).
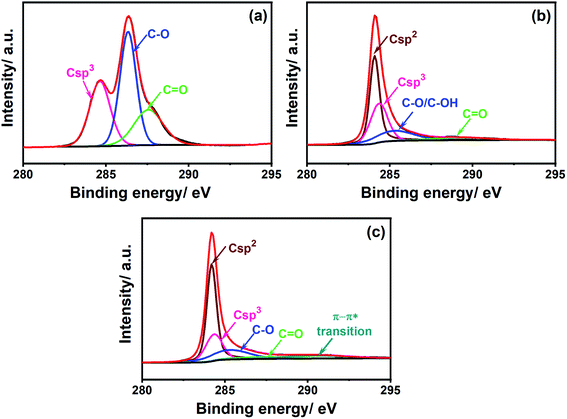 | ||
| Fig. 4 High-resolution C 1s XPS spectra of (a) office paper, (b) non-treated PDEs, and (c) CO2 laser-treated PDEs. | ||
The O 1s spectra (Fig. S4†) confirmed the presence of C–OH groups in both PDEs. The percentage of sp2 and sp3 carbon in the graphite surface was ∼47% and 30%, respectively. The presence of oxygen groups was attributed to the commercial graphite matrix, which has several binders as components (wax, resin, or polymers),23 and the sp3 bond from defective carbon structures.29 In the laser-treated PDEs (Fig. 4C), a slight increase in the amount of sp2 carbon (∼51%) and consequently a decrease in sp3 carbon content was observed. However, no significant changes in the percentages of C–O and C![[double bond, length as m-dash]](https://www.rsc.org/images/entities/char_e001.gif) O groups were observed. These values were 17% and 5.6% for non-treated PDEs and 16% and 4.8% for CO2 laser-treated PDEs. A peak at 290.6 eV associated with π–π* transitions is also observed, indicating an aromatic characteristic to the material.43 These results suggest a partial restoration of the sp2 bonds between carbons, which improves the electron transfer on the graphite surface. The percentages of functional groups for the C 1s and O 1s spectra for both non-treated and CO2 laser-treated PDEs are summarized in Tables S1a and S1b.†
O groups were observed. These values were 17% and 5.6% for non-treated PDEs and 16% and 4.8% for CO2 laser-treated PDEs. A peak at 290.6 eV associated with π–π* transitions is also observed, indicating an aromatic characteristic to the material.43 These results suggest a partial restoration of the sp2 bonds between carbons, which improves the electron transfer on the graphite surface. The percentages of functional groups for the C 1s and O 1s spectra for both non-treated and CO2 laser-treated PDEs are summarized in Tables S1a and S1b.†
Advancing and receding contact angle measurements (Table S2†) show a small change in the hydrophilicity of the analyzed surfaces. However, the contact angle hysteresis is more pronounced in the laser-treated PDEs than in the non-treated PDE, which was 19 and ∼31°, respectively. This probably occurs due to the chemical and topographical heterogeneity of their surface induced by photo-thermal treatment. This result is in agreement with the Raman and SEM images, which confirm that significant changes occur in the superficial structure after the laser scribing procedure.
3.2 Electrochemical characterization
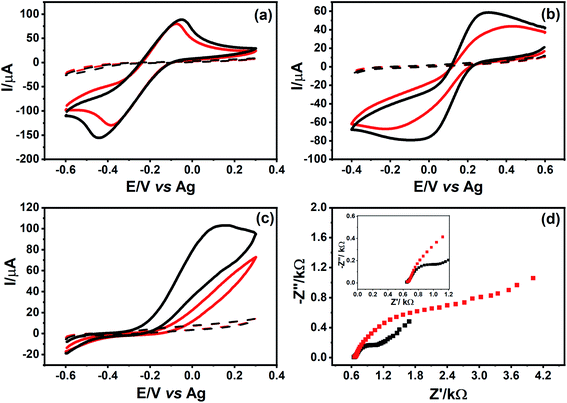
The parameters of the graphite surface treatment using CO2 laser were optimized, to guarantee a compromise between the integrity of the graphite film (avoid film detachment from the paper surface) and low electrical resistance values. The parameters studied were the percentage of power and the laser scan rate (Fig. S6A and B†). The optimized conditions for both parameters were laser power of 6.6% and the laser scanning speed of 25 mm s−1.To evaluate the electrochemical performance of the PDEs, CVs were obtained using different redox probes molecules. In Fig. 5, voltammograms of non-treated PDEs show a sluggish electron transfer kinetics in all cases. On the other hand, voltammograms of CO2 laser-treated PDEs exhibited better electrochemical performance than the non-treated PDEs.
The electrochemical behavior of the [Ru(NH3)6]Cl3 complex was evaluated in both CO2 laser-treated and non-treated PDE surfaces (Fig. 5A). CVs did not show a significant increase in current signals and/or change in the peak-to-peak separation. This behavior can be explained by the type of electron transfer mechanism in this species, which is an ideal outer-sphere complex that is insensitive to surface defects or impurities in carbon materials.38
As indicated in Fig. 5B, the voltammetric profile of K3[Fe(CN)6] obtained using non-treated PDE presented a significant resistance, exhibiting barely defined redox peaks. On the other hand, the electrochemical behavior of this redox probe improved in the laser-treated surface. As an inner-sphere complex, K3[Fe(CN)6] is highly dependent on the material and structural features of the carbon surface, such as the disorder degree, surface cleanliness, and presence of active sites.44
We also studied the electrochemical behavior of an organic molecule (AA) using the PDEs to correlate its oxidation mechanism towards different carbon surfaces. As shown in Fig. 5C, the laser-treatment of the graphite surface caused an improvement in the electronic transfer between the AA and the PDE surface. The oxidation mechanism of the organic compounds on the carbon surface remains uncertain, despite a few hypotheses attempting to explain these interactions, suggesting the promotion of oxidation by the removal of impurities from the surface (which exposes new layers of carbon), and also the presence of functional groups containing oxygen.38,45,46
To characterize the electrochemical properties of the PDE surface, such as electrical resistivity, and to obtain information regarding the interface electrode/solution,47 EIS experiments were performed with both CO2 laser-treated and non-treated PDEs. It is necessary since the system is not only composed of graphite but also contains other agglutinant compounds. Fig. 5D shows a Nyquist plot of CO2 laser-treated and non-treated PDEs. It can be observed from these plots that a capacitive arc is formed in the case of non-treated PDEs, thereby indicating resistance in the transfer of electrons between this surface and the redox species. On the other hand, the treated surface has a smaller capacitive arc, thus strongly suggesting an improvement in the electronic transfer, as observed in the CVs experiments. The resistance to charge transfer (Rct) for both PDE surfaces was calculated and their values were 2.76 kΩ and 0.593 kΩ for the non-treated and laser-treated surfaces, respectively.
To better comprehend how the CO2 laser treatment changes the surface of the PDE and if it results in an improvement regarding the electrochemical kinetics, CVs were performed with two different probes, [Fe(CN)6]3− and [Ru(NH)6]3+, which should have distinct behavior towards the electrode due to their net charges. Resulting in distinct charge transfer coefficients (α and β) that are observed in the Tafel analysis. Fig. S7A† shows the CV of [Fe(CN)6]3− with both PDEs, non-treated and laser-treated. The voltammograms with the non-treated PDE show two undefined redox processes (cathodic and anodic) with a peak to peak separation around 0.7 V. On the other hand, the treated PDE not only presents a significant decrease in the peak to peak separation, but also showed an increase in the peak currents. Despite that, Fig. S7B† shows the mass corrected Tafel analysis to both electrodes coincide. Suggesting that the heterogeneous kinetics does not change. However, the regular Tafel analysis, presented in Fig. S7C and D† does show a significant change in the charge transfer coefficient, of about 20%. This result suggests that the approach and the overlapping of the orbitals of the probe [Fe(CN)6]3− with the electrode is facilitated, resulting in increased electrochemical response. Fig. S7E† shows the voltammograms with the [Ru(NH)6]3+ probe. Unlike the results with [Fe(CN)6]3−, the [Ru(NH)6]3+ presented more discrete improvements. The peak to peak separations decreases around 50 mV with the treated PDE in comparison with the untreated, as the current slightly decreases. Combining these results with the Tafel analysis presents in Fig. S6F–H,† it is observed a slight decrease in the charge transfer coefficients, reinforcing the conclusion that the treatment changes the approach of the probe and the overlap of its orbitals with the electrode.
The reproducibility of the fabrication process was analyzed using [Ru(NH3)6]Cl3 as a redox probe. The variation of the peak currents of the devices (n = 10) was measured for both oxidation and reduction processes of the probe and the coefficients of variation were 5.9% and 8.2%, respectively. As our fabrication process was not automatized, the small variation percentage (below 10%) denotes good reproducibility. This shows that this PDE manufacturing process, albeit simple, is reliable.
3.3 Electrochemical detection of FUR using PDEs
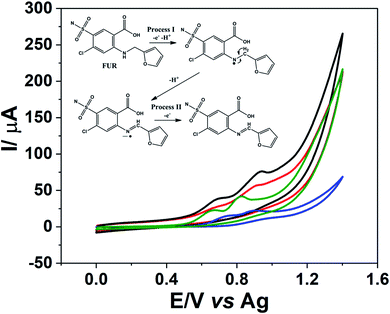
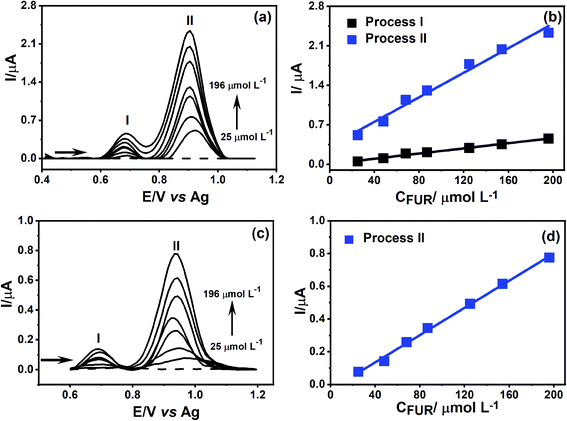
The CO2 laser-treated PDE was applied as an electrochemical sensor for FUR detection. Fig. 6 shows that FUR exhibits two oxidation processes, both proton-coupled electrons transfers, around 0.7 V vs. Ag (process I) and 0.9 V vs. Ag (process II) related to electro-oxidation of the amine functional group, which gives rise to a radical species with one proton release followed by a loss of an additional electron and proton,48 a schematic representation of the FUR oxidation mechanism is shown in the inset of Fig. 6. Additionally, the CO2 laser-treated PDE presented an improvement in the definition of the oxidation peaks and a 4-fold increase in the peak current for the process I (current signals of FUR for non-treated and laser-treated PDEs were 1.3 and 5.3 μA, respectively) and 2-fold for the process II (approximately 5.3 and 11 μA, respectively) when compared to the non-treated PDEs. We recorded CVs using commercial screen-printed carbon and graphene electrodes to compare the electrochemical behavior of FUR. The current signals for processes I and II on the screen-printed carbon electrode were 2.9 and 3.7 μA, respectively. In the screen-printed graphene electrode, the current signal for the process I was 6.4 μA and for process II was 12 μA. We can observe that the current signals for both FUR oxidation processes using the CO2 laser-treated PDE were close to the current signals when the screen-printed graphene electrode was used. Thus, it is clear that the treated PDE's performance is similar to that of a commercial screen-printed graphene electrode. The CVs of FUR on each electrode is shown in Fig. S8.†As a proof of concept, the treated PDEs were used to perform an analytical detection and quantification of FUR, to show the PDEs can be used as a portable and easy-to-use drug test after the laser pretreatment. The electrochemical detection of FUR was performed using DPV. Under the optimal experimental conditions was possible to obtain an analytical curve with dynamic linear concentration ranging from 25 to 196 μmol L−1 for both oxidation processes (Fig. 7a).
To compare the electrochemical behavior of FUR in the CO2 laser-treated PDE, we obtained an analytical curve for the non-treated PDEs. It can be seen in Fig. 7d that the variation of the current signal for the first oxidation (process I) was not linear with the increase of analyte concentration. However, for the second oxidation process (process II) we observed that the increase in current was accompanied by the increase in FUR concentration. This data demonstrates that the treatment of the graphite surface results in a lower effect of FUR adsorption, allowing the quantification of its two-oxidation processes, which not only facilitates the construction of the analytical curve but also a 3-fold increase in the sensitivity of process II.
3.4 Studies of interfering species
Studies of possible interfering species in the detection of FUR were carried out with the following species: ascorbic acid (AA), uric acid (UA), urea (UR), creatinine (CRE), and glucose (GLU). The measurements were registered using DPV (in the optimized experimental conditions) in a ratio of FUR/interfering species of 1![[thin space (1/6-em)]](https://www.rsc.org/images/entities/char_2009.gif) :
:![[thin space (1/6-em)]](https://www.rsc.org/images/entities/char_2009.gif) 2. Fig. S9† shows the variations of the FUR oxidation current signals (processes I and II). The FUR current signals in the presence of AA decreased by 3.5%. For the UA, the current signal of process I increased by 0.3%, with no significant variation for both oxidation current signals of the analyte. There was a significant variation in the signal of oxidation of the FUR in the presence of UR, a decrease of 9.2%. The presence of CRE also caused an increase in the current signals of FUR, which was 5.8%. In the case of GLU, its presence caused a small variation in the current signals from FUR, which represented an increase of 0.24%.
2. Fig. S9† shows the variations of the FUR oxidation current signals (processes I and II). The FUR current signals in the presence of AA decreased by 3.5%. For the UA, the current signal of process I increased by 0.3%, with no significant variation for both oxidation current signals of the analyte. There was a significant variation in the signal of oxidation of the FUR in the presence of UR, a decrease of 9.2%. The presence of CRE also caused an increase in the current signals of FUR, which was 5.8%. In the case of GLU, its presence caused a small variation in the current signals from FUR, which represented an increase of 0.24%.
3.5 Analytical detection of FUR in synthetic urine using CO2 laser-treated PDE
The applicability of the CO2 laser-treated PDE as a portable electrochemical sensor for the detection of FUR was carried out using a sample of synthetic urine. The sample was spiked with 20 μmol L−1 FUR and analyzed using DPV. Table 1 shows the results for the electrochemical detection of FUR in samples A and B with recovery percentages of 95 and 110%, respectively. The limit of detection calculated for the FUR analysis was 2.4 × 10⁻⁷ mol L−1.| [FUR]added (μmol L−1) | [FUR]found (μmol L−1) | Recovery (%) | |
|---|---|---|---|
| Sample A | 20 | 19 ± 2 | 95 |
| Sample B | 20 | 22 ± 2 | 110 |
We can notice that despite the significant variation that the presence of urea (which is present in the composition of the synthetic urine used for the analysis) causes in the oxidation current signs of FUR, it was possible to obtain adequate recovery percentages according to the criteria established by the Brazilian National Health Surveillance Agency (ANVISA) for this type of analysis, which the range is 85–120%.49
4 Conclusions
In conclusion, we reported a simple method to fabricate electrochemical sensors on paper using a pencil-drawn surface activated by a CO2 laser. The process of transferring carbon tracks onto paper was carried out through hand drawing with a 6B pencil followed by a photo-thermal treatment process. The activation by laser promotes the partial restoration of carbon–carbon double bonds and removal of a thin layer of nanodebris present in commercial pencils, thus improving the electron transfer on the graphite surface. The voltammograms of FUR using the laser-treated PDE showed a low and stable background current and the laser treatment minimized the adsorption effect of FUR, even allowing quantification using one or both of the oxidation processes. Thus, we demonstrated the application of the device as a portable electrochemical sensor for FUR detection in a synthetic urine sample. The percentages of recovery of the FUR added to the samples A and B were 95% and 110%, respectively, and LOD calculated of 2.4 × 10⁻⁷ mol L−1. Therefore, our work demonstrates that this method can fabricate improved ePADs that still are low-cost, disposable, and reliable electrodes. In addition to an improved sensibility and less adsorption effect.Conflicts of interest
There are no conflicts to declare.Acknowledgements
The authors acknowledge the following Brazilian Agencies: CAPES (grant number: 3359/2014 Pró-Forenses Edital 25/2014), FAPESP (grant numbers: 2018/14462-0, 2018/08782-1, 2016/16477-9, 2017/10522-5 and 2016/21070-5), and CNPq (grant numbers: 311847/2018-8, 305605/2017-8, 438828/2018-6, 444498/2014-1 and 306690/2015-2) for their support. The authors are also grateful to Brazilian Nanotechnology National Laboratory—LNNano/CNPEM for the XPS infrastructure, Dr D. L. Córtez for the processing of the mappings data from the Raman spectra, Dr S. I. C. Torresi, R. N. P. Colombo and A. C. Silva for the contact angle measurements.Notes and references
- A. W. Martinez, S. T. Phillips, M. J. Butte and G. M. Whitesides, Angew. Chem., Int. Ed., 2007, 46, 1318–1320 CrossRef CAS.
- E. W. Nery and L. T. Kubota, Anal. Bioanal. Chem., 2013, 405, 7573–7595 CrossRef CAS.
- D. M. Cate, J. A. Adkins, J. Mettakoonpitak and C. S. Henry, Anal. Chem., 2015, 87, 19–41 CrossRef CAS.
- D. D. Liana, B. Raguse, J. Justin Gooding and E. Chow, Sensors, 2012, 12, 11505–11526 CrossRef CAS.
- L. Pereira de Oliveira, D. P. Rocha, W. Reis de Araujo, R. A. Abarza Muñoz, T. R. Longo Cesar Paixão and M. Oliveira Salles, Anal. Methods, 2018, 10, 5135–5163 RSC.
- W. R. de Araujo, T. M. G. Cardoso, R. G. da Rocha, M. H. P. Santana, R. A. A. Muñoz, E. M. Richter, T. R. L. C. Paixão and W. K. T. Coltro, Anal. Chim. Acta, 2018, 1034, 1–21 CrossRef CAS.
- W. Dungchai, O. Chailapakul and C. S. Henry, Anal. Chem., 2009, 81, 5821–5826 CrossRef CAS.
- J. Mettakoonpitak, K. Boehle, S. Nantaphol, P. Teengam, J. A. Adkins, M. Srisa-Art and C. S. Henry, Electroanalysis, 2016, 28, 1420–1436 CrossRef CAS.
- C. Hu, X. Bai, Y. Wang, W. Jin, X. Zhang and S. Hu, Anal. Chem., 2012, 84, 3745–3750 CrossRef CAS.
- N. Dossi, R. Toniolo, E. Piccin, S. Susmel, A. Pizzariello and G. Bontempelli, Electroanalysis, 2013, 25, 2515–2522 CrossRef CAS.
- C. W. Foster, D. A. C. Brownson, A. P. Ruas de Souza, E. Bernalte, J. Iniesta, M. Bertotti and C. E. Banks, Analyst, 2016, 141, 4055–4064 RSC.
- L. Y. Shiroma, M. Santhiago, A. L. Gobbi and L. T. Kubota, Anal. Chim. Acta, 2012, 725, 44–50 CrossRef CAS.
- W. R. de Araujo, C. M. R. Frasson, W. A. Ameku, J. R. Silva, L. Angnes and T. R. L. C. Paixão, Angew. Chem., Int. Ed., 2017, 56, 15113–15117 CrossRef CAS.
- J. A. Adkins and C. S. Henry, Anal. Chim. Acta, 2015, 891, 247–254 CrossRef CAS.
- C. L. S. Chagas, L. Costa Duarte, E. O. Lobo-Júnior, E. Piccin, N. Dossi and W. K. T. Coltro, Electrophoresis, 2015, 36, 1837–1844 CrossRef CAS.
- N. Dossi, R. Toniolo, F. Impellizzieri and G. Bontempelli, J. Electroanal. Chem., 2014, 722–723, 90–94 CrossRef CAS.
- N. Dossi, S. Petrazzi, R. Toniolo, F. Tubaro, F. Terzi, E. Piccin, R. Svigelj and G. Bontempelli, Anal. Chem., 2017, 89, 10454–10460 CrossRef CAS.
- K. C. Honeychurch, Anal. Methods, 2015, 7, 2437–2443 RSC.
- Z. Tai, Y. Liu, Q. Zhang, T. Zhou, Z. Guo, H. K. Liu and S. X. Dou, Green Energy Environ., 2017, 2, 278–284 CrossRef.
- T. Fayose, L. Mendecki, S. Ullah and A. Radu, Anal. Methods, 2017, 9, 1213–1220 RSC.
- M. Santhiago and L. T. Kubota, Sens. Actuators, B, 2013, 177, 224–230 CrossRef CAS.
- C. L. S. Chagas, L. Costa Duarte, E. O. Lobo-Júnior, E. Piccin, N. Dossi and W. K. T. Coltro, Electrophoresis, 2015, 36, 1837–1844 CrossRef CAS.
- I. G. David, D. Popa and M. Buleandra, J. Anal. Methods Chem., 2017, 2017, 1–6 CrossRef.
- J. K. Kariuki, J. Electrochem. Soc., 2012, 159, H747–H751 CrossRef CAS.
- J. Wang and M. S. Lin, Anal. Chem., 1988, 60, 499–502 CrossRef CAS.
- T. G. Strein and A. G. Ewing, Anal. Chem., 1991, 63, 194–198 CrossRef CAS.
- Y. W. Alsmeyer and R. L. McCreery, Langmuir, 1991, 7, 2370–2375 CrossRef CAS.
- R. Bowling, R. T. Packard and R. L. McCreery, Langmuir, 1989, 5, 683–688 CrossRef CAS.
- M. Santhiago, M. Strauss, M. P. Pereira, A. S. Chagas and C. C. B. Bufon, ACS Appl. Mater. Interfaces, 2017, 9, 11959–11966 CrossRef CAS.
- M. Poon and R. L. Mccreery, Anal. Chem., 1986, 58, 2745–2750 CrossRef CAS.
- M. Poon, R. L. McCreery and R. Engstrom, Anal. Chem., 1988, 60, 1725–1730 CrossRef CAS.
- S. J. Malode, J. C. Abbar, N. P. Shetti and S. T. Nandibewoor, Electrochim. Acta, 2012, 60, 95–101 CrossRef CAS.
- N. P. Shetti, L. V. Sampangi, R. N. Hegde and S. T. Nandibewoor, Int. J. Electrochem. Sci., 2009, 4, 104–121 CAS.
- P. A. Raymundo-Pereira, S. A. S. Machado, E. A. Ticianelli, T. S. Martins and J. L. Bott-Neto, Sens. Actuators, B, 2018, 276, 378–387 CrossRef.
- N. Laube, B. Mohr and A. Hesse, J. Cryst. Growth, 2001, 233, 367–374 CrossRef CAS.
- E. Bernalte, C. W. Foster, D. A. C. Brownson, M. Mosna, G. C. Smith and C. E. Banks, Biosensors, 2016, 6, 45 CrossRef.
- M. S. Dresselhaus, A. Jorio, M. Hofmann, G. Dresselhaus and R. Saito, Nano Lett., 2010, 10, 751–758 CrossRef CAS.
- R. L. McCreery, Chem. Rev., 2008, 108, 2646–2687 CrossRef CAS.
- S. Kim, O. Park, J. H. Lee and B. Ku, Carbon Lett., 2013, 14, 247–250 CrossRef.
- D. López-Díaz, M. López Holgado, J. L. García-Fierro and M. M. Velázquez, J. Phys. Chem., 2017, 121, 20489–204897 Search PubMed.
- J. Schwan, S. Ulrich, V. Batori, H. Ehrhardt and S. R. P. Silva, J. Appl. Phys., 1996, 80, 440–447 CrossRef CAS.
- V. Kuzmenko, N. Wang, M. Haque, O. Naboka, M. Flygare, K. Svensson, P. Gatenholm, J. Liu and P. Enoksson, RSC Adv., 2017, 7, 45968–45977 RSC.
- S. Kundu, Y. Wang, W. Xia and M. Muhler, J. Phys. Chem. C, 2008, 112, 16869–16878 CrossRef CAS.
- M. T. McDermott, C. a. McDermott and R. L. McCreery, Anal. Chem., 1993, 65, 937–944 CrossRef CAS.
- D. T. Fagan, I. F. Hu and T. Kuwana, Anal. Chem., 1985, 57, 2759–2763 CrossRef CAS.
- I. F. Hu and T. Kuwana, Anal. Chem., 1986, 58, 3235–3239 CrossRef CAS.
- W. Yuan, Y. Zhou, Y. Li, C. Li, H. Peng, J. Zhang, Z. Liu, L. Dai and G. Shi, Sci. Rep., 2013, 3, 1–7 Search PubMed.
- S. J. Malode, J. C. Abbar, N. P. Shetti and S. T. Nandibewoor, Electrochim. Acta, 2012, 60, 95–101 CrossRef CAS.
- Diário Oficial da União-ANVISA, RESOLUÇÃO-RE No. 899, 2003.
Footnotes |
| † Electronic supplementary information (ESI) available. See DOI: 10.1039/d0ra08874a |
| ‡ The manuscript was written through contributions of all authors. All authors have given approval to the final version of the manuscript. All the authors contributed equally to this work. |
| This journal is © The Royal Society of Chemistry 2021 |

