Affinity-free enrichment and mass spectrometry analysis of the ovarian cancer biomarker CA125 (MUC16) from patient-derived ascites†
Naviya
Schuster-Little
 a,
Roberta
Fritz-Klaus
b,
Mark
Etzel
c,
Niharika
Patankar
b,
Saahil
Javeri
b,
Manish S.
Patankar
*b and
Rebecca J.
Whelan
 *a
*a
aDepartment of Chemistry and Biochemistry, University of Notre Dame, Notre Dame, IN, USA. E-mail: rwhelan1@nd.edu
bDepartment of Obstetrics and Gynecology, University of Wisconsin-Madison, Madison, WI, USA. E-mail: patankar@wisc.edu
cDepartment of Food Science, University of Wisconsin-Madison, Madison, WI, USA
First published on 3rd November 2020
Abstract
Developing a mass spectrometry-based assay for the ovarian cancer biomarker CA125 (MUC16) is a desirable goal, because it may enable detection of molecular regions that are not recognized by antibodies and are therefore analytically silent in the current immunoassay. Additionally, the ability to characterize the CA125 proteoforms expressed by individuals may offer clinical insight. Enrichment of CA125 from malignant ascites may provide a high-quality source of this important ovarian cancer biomarker, but a reliable strategy for such enrichment is currently lacking. Beginning with crude ascites isolated from three individual patients with high grade serous ovarian cancer, we enriched for MUC16 using filtration, ion exchange, and size exclusion chromatography and then performed bottom-up proteomics on the isolated proteins. This approach of enrichment and analysis reveals that the peptides detected via mass spectrometry map to the SEA domain and C-loop regions within the tandem repeat domains of CA125 and that peptide abundance correlates with clinical CA125 counts.
Introduction
Accumulation of ascites (peritoneal fluid) is a common clinical finding in patients with advanced stage high grade serous ovarian cancer (HGSOC).1,2 A majority of patients with ascites undergo paracentesis, which alleviates symptoms and discomfort associated with fluid build-up.3 Following removal, ascites is typically discarded. Ascites can therefore be viewed as an underused resource in the analytical characterization of HGSOC biomarkers. Because of its continual contact with ovarian tumors, ascites is enriched with tumor-associated biomolecules, and the analytical characterization of this biofluid may be a fruitful strategy for the identification of new HGSOC biomarkers.3–6 Further, ascites contains high concentrations of known HGSOC biomarkers, including CA125; the concentration of CA125 in ascites is ∼27 times higher than in serum.7CA125—an FDA-approved biomarker for ovarian cancer—is a peptide epitope found on the mucin MUC16. MUC16 (depicted in schematic form in Fig. 1) is a 3–5 MDa transmembrane mucin comprised of three domains: a heavily glycosylated N-terminus; a repeat domain containing 60 or more “tandem repeats”; and a short intracellular C-terminus.8,9 The amino acid sequences of the tandem repeats are largely conserved but not identical. Notable structural features found in each tandem repeat include a SEA domain and a 21-amino acid long cysteine bound loop (C-loop) that had been hypothesized to contain the CA125 epitopes.10,11 It is currently unknown if all repeats are expressed in all proteoforms and individuals, or if expression changes with variables including disease progression.12 Serum CA125 levels are currently measured via a double determinant immunoassay. The reliability of the two antibodies used in the immunoassay—OC125 and M11—has been called into question by several lines of investigation. In one study, Bressan and co-workers used a recombinant expression system to purify six tandem repeats and found that OC125 and M11 did not recognize all repeats uniformly.13 In a separate study, Hoffman and co-workers probed a western blot of ascites with OC125 and M11 and found that proteins other than CA125 were stained.14 The location of the CA125 epitopes remains unknown, despite extensive effort to characterize antibody binding.11,13,15 Though CA125 is a clinically important biomarker, questions remain about its biochemistry and the role that MUC16 plays in the origin and progression of cancer.12,16–18
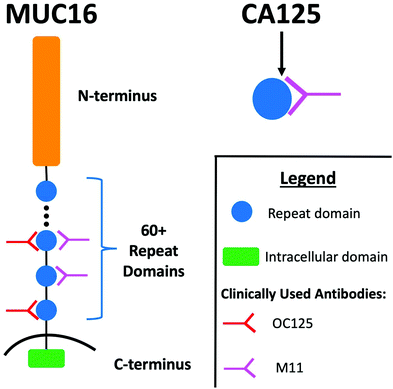 | ||
| Fig. 1 Schematic diagram illustrating the regions of MUC16, the CA125 epitope, and the antibodies that provide recognition in the clinical immunoassay. Adapted from ref. 12. | ||
Achieving a better understanding of CA125/MUC16 will require reliable methods to isolate a majority of its proteoforms in an unbiased way. Nustad and co-workers report six different isolation methods for MUC16, including antibody-based affinity chromatography.19 Such antibody-based protocols capture only those proteoforms that have accessible CA125 epitopes. Post-translational modifications and splicing events are expected to generate at least a subset of proteoforms without accessible CA125 epitopes resulting in an underassessment of the total pool of MUC16 molecules by the serum CA125 diagnostic test. Bias in immunoaffinity purification has been demonstrated for other proteins and peptides.20–22
The primary motivation for this work is to better understand the different proteoforms of MUC16 on the assumption that such understanding will support the development of novel analytical methods suitable to the detection of this complex analyte. Our ultimate goal is advanced characterization of MUC16 to enable the development of alternative assays to detect and quantify CA125 in biofluids. As a step towards this goal, we recently reported a suspension trap-based bottom-up proteomics workflow for MUC16 analysis.23 In the present report, we extend our previous work to the analysis of MUC16 in ascites samples derived from individual ovarian cancer patients. To enable bottom-up proteomics of MUC16, ascites samples first undergo an affinity-free process of filtration, ion exchange, and size exclusion chromatography. This enrichment process is designed to retain MUC16 while excluding high abundance, low-molecular weight proteins that interfere with detection of this mucin. Using this approach, we demonstrate that MUC16 peptides detectable by mass spectrometry predominantly map to the tandem repeat region with a few peptides detected from the N-terminal domain. The number of MUC16 peptides detected is directly proportional to the CA125 counts from the clinical ELISA, while avoiding the bias inherent to antibody-based methods.
Experimental
Reagents and chemicals
Sodium dodecyl sulfate (SDS), iodoacetamide (IAA), triethylammonium bicarbonate (TEAB), ammonium bicarbonate, sodium chloride (NaCl), Q-Sepharose and Sepharose CL-4B were purchased from Millipore Sigma (St Louis, MO). Tris(2-carboxyethyl)phosphine (TCEP), deoxycholic acid (DCA), phosphoric acid, and methanol (Burdick & Jackson) were obtained through VWR. Formic acid (99% purity) (FA), acetonitrile (ACN), and C18 ZipTips were purchased from Fisher Scientific (Hanover Park, IL). S-Traps™ were purchased from Protifi (Huntington, NY). Mass spectrometry-grade trypsin gold was obtained from Promega (Madison, WI) and reconstituted according to manufacturer's instructions.Patient recruitment
Patients suspected of ovarian cancer were recruited for this study. All experiments were performed in accordance with the United States Health and Human Services Basic Policy for Protection of Human Research Subjects and approved by the Institutional Review Board of the University of Wisconsin. Informed consents were obtained from human participants of this study. Ascites samples were obtained from patients as standard-of-care. Only ascites samples from patients (age range 33–66 years) with a confirmed diagnosis of advanced stage (stage III or IV) HGSOC were used to develop the affinity-free method for enriching MUC16. The ascites were obtained prior to the patients receiving any chemotherapy, cytoreductive surgery, or other forms of therapy to prevent effects of the therapy on the molecular presentation of MUC16. This study investigates ascites collected from three patients. Table 1 reports clinical parameters (age; type and stage of cancer; and volume of ascites removed) for these three patients.| Patient # | Age | Cancer type | Cancer stage | Volume of ascites removed |
|---|---|---|---|---|
| 1 | 36 | Serous ovarian | III | 1.5 L |
| 2 | 66 | Serous ovarian | III | 1.5 L |
| 3 | n/a | Serous ovarian | III | 2.0 L |
Concentration of ascites
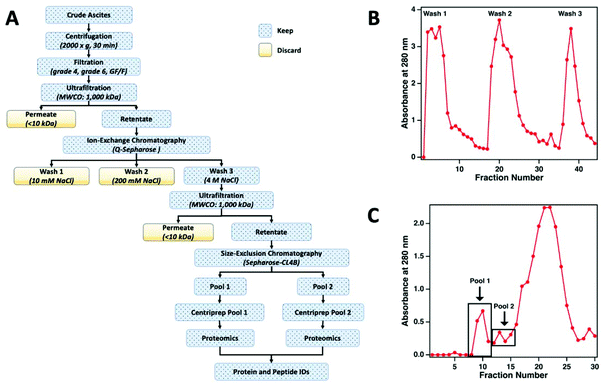
The workflow used to enrich MUC16 from crude ascites is shown in Fig. 2a. To prepare the sample for chromatographic purification of MUC16, ascites samples were first concentrated using tangential flow ultrafiltration. Initially, the ascites fluid was sequentially filtered through Whatman no. 4 (25 μm) and no. 6 (3 μm) filter papers followed by final filtration through a glass fiber (GF/F) filter (0.7 μm) (Millipore-Sigma). In each filtration step, filters were repeatedly replaced to avoid clogging. The final clarified filtrate from the GF/F filtration step was used for subsequent processing. The filtrate was concentrated using a Pellicon tangential flow filtration cassette (cutoff 1 × 10⁶ Da; Millipore-Sigma) to reduce the volume of the fluid. The filtrate was placed in a water bath set at 40 °C and pumped through the cassette at 2 bar using a peristaltic pump to maintain the flow rates of retentate and permeate at 50 mL min−1 and 4 mL min−1, respectively. The permeate flow rate decreased considerably during this ultrafiltration step (typically, 3–5 h). Permeate was collected separately and eventually discarded. Retentate was recirculated through the cassette. On average, the volume of ascites was reduced to half or a third of the original volume with care taken to avoid precipitation of proteins during ultrafiltration. After ultrafiltration, the cassette was regenerated by sequentially washing for 40 min (at 40 °C) each with deionized (DI) water, 0.1% Tergazyme, DI water, 0.1 M sodium hydroxide, and finally with DI water.Ion exchange chromatography
The concentrated ascites samples were separated by ion exchange chromatography on a Q-Sepharose (1.5 cm × 30 cm) column. Concentrated ascites fluid (50 mL) was loaded on the Q-Sepharose column using a low-pressure peristaltic pump. The column was then connected to a Pharmacia FPLC pump (P-500) and eluted (400 mL min−1) with 150 ml of 10 mM Tris-HCl (pH 7.0) followed by washing with 250 mL of 10 mM Tris-HCl (pH 7.0) containing 200 mM NaCl. The eluted solutions from these two washes contained only minimal titers of CA125 Units and were therefore discarded. Fractions from the column effluent (1.5 mL each) were collected and monitored for absorbance at 280 nm (Fig. 2b). The MUC16 bound to the Q-Sepharose column was eluted with 150 mL of 10 mM Tris-HCl (pH 7.0) containing 4 M NaCl. The eluted material was collected and concentrated using the 1 × 10⁶ Da ultrafiltration cassette using the same general protocol described above.Size exclusion chromatography
For further enrichment of MUC16, the concentrated 4 M NaCl wash from the Q-Sepharose column was separated on a Sepharose CL-4B size exclusion chromatography column (Millipore-Sigma, St Louis MO). The concentrated 4 M NaCl wash (5 mL) was loaded on a 2.5 cm × 100 cm Sepharose CL-4B column using a low-pressure peristaltic pump. The column was then connected to the Pharmacia FPLC pump (P-500) and eluted with freshly prepared 10 mM ammonium bicarbonate. Fractions from the column effluent (1.5 mL) were collected and monitored for absorbance at 280 nm (Fig. 2c). The first two high molecular weight fractions contained the majority of the CA125 units and were designated as pool 1 and pool 2, respectively. Each pool was concentrated using a Centriprep ultrafiltration cartridge (10 kDa cut off; Millipore). The concentrated material was stored at −80 °C prior to mass spectrometry.CA125 and protein quantification
At each of the major steps of the separation process, the units of CA125 were monitored using the clinical CA125 assay. Samples were submitted to the clinical pathology laboratory of the University of Wisconsin Hospital and Clinics, and CA125 units were monitored using the Abbott Architect assay. Total protein in each sample was assayed using the bicinchoninic acid assay (BCA, ThermoFisher) using the recommended protocols for 96-well plate format.Proteomics sample processing
Ten micrograms of total protein were denatured and reduced with 6% SDS and 10 mM TCEP at 95 °C for 10 min. 0.2% DCA was included as a passivating agent to prevent protein adsorption, and 100 mM TEAB was included as a buffering agent. Following reduction, protein was alkylated with 10 mM IAA for 30 min at RT in the dark. The alkylation reaction was quenched by addition of phosphoric acid to a final concentration of 1.2%. Excess buffer was evaporated using vacuum centrifugation to increase SDS concentration to 6%. The on-trap digestion process followed manufacturer's instructions. Briefly, the protein solution was precipitated, spun onto a STrap device and washed. 750 ng trypsin in 100 mM TEAB was added to the STrap, and protein was digested overnight at 37 °C. Peptides were eluted with 100 mM TEAB and 0.1% FA, and the digestion reaction was quenched with 10% FA. A third elution was performed using 50% ACN and 0.1% FA. All eluates were combined and dried on a SpeedVac. Peptides were reconstituted in 0.1% FA, desalted using C18 ZipTips, and reconstituted in water containing 4% ACN and 0.5% FA to a final volume of 20 μL. From each patient sample, we digested three portions, yielding three biological replicates per patient sample. Each biological replicate was analyzed three times (technical replicates) as described below. In total, each pool of material derived from one patient was analyzed 9 times (three biological replicates × three technical replicates).Mass spectrometry and data analysis
Peptides were analyzed using a Waters NanoAcquity liquid chromatography (LC) system coupled to a Q-Exactive mass spectrometer (Thermo Scientific). The LC system was equipped with a peptide BEH C18 column (Waters, 100 μm × 100 mm, 1.7 μm particle size). Peptides were separated over a 90 min gradient using a binary solvent system. Solvent A consisted of water with 0.1% FA while solvent B consisted of ACN with 0.1% FA (Burdick & Jackson, VWR). The following linear gradient was used for all samples: 4% B for 0–10 min, 4–7% B from 10–12 min, 7–31% B from 12–70 min, 31–90% B from 70–74 min, 90% B until 78 min, 90–4% B for 1 min, and re-equilibration at 4% B from 79–90 min. The mass spectrometer was operated in top 15 data-dependent acquisition mode with automated switching between MS and MS/MS. The ion source was operated in positive ion mode at 1.8 kV, and the ion transfer tube was maintained at 280 °C. Full MS scans were acquired from 415 to 1900 m/z at resolution of 70![[thin space (1/6-em)]](https://www.rsc.org/images/entities/char_2009.gif) 000, with an AGC target of 3 × 10⁶ ions and a fill time of 60 ms. MS/MS scans were performed from 200 to 2000 m/z at a resolution of 17
000, with an AGC target of 3 × 10⁶ ions and a fill time of 60 ms. MS/MS scans were performed from 200 to 2000 m/z at a resolution of 17![[thin space (1/6-em)]](https://www.rsc.org/images/entities/char_2009.gif) 500 and a maximum fill time of 120 ms. The AGC target was set at 1 × 10⁵ ions. An isolation window of 3.5 m/z was used for fragmentation with a normalized collision energy of 26.5. Dynamic exclusion was set at 40 s. Ions with a charge of +1 or greater than +6 were excluded from fragmentation. Raw data files were searched using Proteome Discoverer (version 2.2) with Mascot and the SwissProt database (July 2014, 546
500 and a maximum fill time of 120 ms. The AGC target was set at 1 × 10⁵ ions. An isolation window of 3.5 m/z was used for fragmentation with a normalized collision energy of 26.5. Dynamic exclusion was set at 40 s. Ions with a charge of +1 or greater than +6 were excluded from fragmentation. Raw data files were searched using Proteome Discoverer (version 2.2) with Mascot and the SwissProt database (July 2014, 546![[thin space (1/6-em)]](https://www.rsc.org/images/entities/char_2009.gif) 000 sequences; this is the most complete available build for MUC16). The taxonomy was set to Homo sapiens and the digestion enzyme was set to trypsin with a maximum of 2 missed cleavages. The peptide mass tolerance was 10 ppm and fragment mass tolerance was 0.4 Da. Carbamidomethylation of C was set as a global modification and oxidation of M was set as a variable modification. A strict and relaxed FDR were set at 0.01 and 0.05, respectively. All keratins were filtered out.
000 sequences; this is the most complete available build for MUC16). The taxonomy was set to Homo sapiens and the digestion enzyme was set to trypsin with a maximum of 2 missed cleavages. The peptide mass tolerance was 10 ppm and fragment mass tolerance was 0.4 Da. Carbamidomethylation of C was set as a global modification and oxidation of M was set as a variable modification. A strict and relaxed FDR were set at 0.01 and 0.05, respectively. All keratins were filtered out.
Results and discussion
Affinity-free enrichment isolates MUC16
Ascites from patients with HGSOC contains high amounts of MUC16 that is released from the tumors. Ascites is therefore an excellent source to enable the analysis of MUC16 from individual HGSOC patients. Considering previous reports that the CA125 epitopes of MUC16 are differentially detected by OC125 and M11—the antibody pair used for quantitation of this biomarker in ovarian cancer patients—we hypothesized that antibody-based purification methods may lead to selective enrichment of only specific proteoforms of MUC16. Such a bias will therefore not provide for accurate mapping of the MUC16 proteoform population present in ascites. We therefore developed a protocol to enrich MUC16 using relatively unbiased separation techniques.Ascites from ovarian cancer patients typically ranges from a few hundred milliliters to liters in volume. The first step for purification of MUC16 from this fluid therefore requires significant concentration of ascites which we accomplished using tangential flow ultrafiltration on a 1000 kDa cut-off Pellicon filter. These devices allowed for relatively rapid concentration of ascites to 40–50% of its original volume. To avoid clogging due to cellular debris and other solid materials present in ascites, the fluid was clarified by sequential vacuum filtration through disc filters of sequentially finer pore size prior to tangential flow ultrafiltration.
The concentrated ascites from each patient was separated in multiple runs on a Q-Sepharose anion exchange chromatography column. Initial experiments indicated that the majority (75–85%) of MUC16 remains bound to the Q-Sepharose column even after washing with low salt buffer containing 200 mM NaCl. The 200 mM NaCl wash, however, removed significant amounts of contaminating non-MUC16 proteins from the concentrated ascites. The bound MUC16 was eluted using high salt buffer containing 4 M NaCl. This step resulted in recovery of approximately 60–70% of the total CA125 counts present in crude ascites.
For further purification, the 4 M NaCl washes from the Q-Sepharose column were pooled and concentrated using the 1000 kDa tangential flow ultrafiltration unit. The concentrated material was subsequently subjected to size exclusion chromatography on a Sepharose CL-4B column. On average, 40–60% of the CA125-positive material was recovered in the exclusion volume (referred to as pool 1) of the Sepharose CL-4B column. An additional 20–30% of the CA125-positive material was eluted as pool 2. The protein concentration and CA125 units in pool 1 and 2 from the CL-4B column resulted in significant enrichment of MUC16 (Table 2). The enriched MUC16 samples from pools 1 and 2 were individually subjected to characterization by mass spectrometry. This MUC16 isolation protocol is now routinely employed in our laboratories to purify the mucin from HGSOC ascites with consistent results. Some variation between the level of purification is expected given the complex nature of the ascites and patient-to-patient variations in the components of this fluid. Here, we present data on proteomic characterization of MUC16 that was isolated from three patients using the new method.
| Patient # | Purification step | Total CA125 (U) | Total protein (mg) | MUC16 purity (CA125 U mg−1 total protein) | Fold enrichment over Q-Sepharose fraction |
|---|---|---|---|---|---|
| 1 | Q-Sepharose 4 M NaCl wash | 23![[thin space (1/6-em)]](https://www.rsc.org/images/entities/char_2009.gif) 254 254![[thin space (1/6-em)]](https://www.rsc.org/images/entities/char_2009.gif) 400 400 |
1850 | 12![[thin space (1/6-em)]](https://www.rsc.org/images/entities/char_2009.gif) 570 570 |
n/a |
| CL-4B pool #1 | 10![[thin space (1/6-em)]](https://www.rsc.org/images/entities/char_2009.gif) 710 710![[thin space (1/6-em)]](https://www.rsc.org/images/entities/char_2009.gif) 000 000 |
15.2 | 704![[thin space (1/6-em)]](https://www.rsc.org/images/entities/char_2009.gif) 605 605 |
56 | |
| CL-4B pool #2 | 6![[thin space (1/6-em)]](https://www.rsc.org/images/entities/char_2009.gif) 698 698![[thin space (1/6-em)]](https://www.rsc.org/images/entities/char_2009.gif) 000 000 |
14.6 | 458![[thin space (1/6-em)]](https://www.rsc.org/images/entities/char_2009.gif) 767 767 |
37 | |
| 2 | Q-Sepharose 4 M NaCl wash | 10![[thin space (1/6-em)]](https://www.rsc.org/images/entities/char_2009.gif) 422 422![[thin space (1/6-em)]](https://www.rsc.org/images/entities/char_2009.gif) 000 000 |
6280 | 1660 | n/a |
| CL-4B pool #1 | 7![[thin space (1/6-em)]](https://www.rsc.org/images/entities/char_2009.gif) 104 104![[thin space (1/6-em)]](https://www.rsc.org/images/entities/char_2009.gif) 000 000 |
10.3 | 689![[thin space (1/6-em)]](https://www.rsc.org/images/entities/char_2009.gif) 709 709 |
416 | |
| CL-4B pool #2 | 2![[thin space (1/6-em)]](https://www.rsc.org/images/entities/char_2009.gif) 806 806![[thin space (1/6-em)]](https://www.rsc.org/images/entities/char_2009.gif) 000 000 |
17.4 | 161![[thin space (1/6-em)]](https://www.rsc.org/images/entities/char_2009.gif) 264 264 |
97 | |
| 3 | Q-Sepharose 4 M NaCl wash | 14![[thin space (1/6-em)]](https://www.rsc.org/images/entities/char_2009.gif) 927 927![[thin space (1/6-em)]](https://www.rsc.org/images/entities/char_2009.gif) 000 000 |
760 | 19![[thin space (1/6-em)]](https://www.rsc.org/images/entities/char_2009.gif) 641 641 |
n/a |
| CL-4B pool #1 | 800![[thin space (1/6-em)]](https://www.rsc.org/images/entities/char_2009.gif) 000 000 |
2.4 | 333![[thin space (1/6-em)]](https://www.rsc.org/images/entities/char_2009.gif) 333 333 |
17 | |
| CL-4B pool #2 | 2![[thin space (1/6-em)]](https://www.rsc.org/images/entities/char_2009.gif) 475 475![[thin space (1/6-em)]](https://www.rsc.org/images/entities/char_2009.gif) 000 000 |
21 | 117![[thin space (1/6-em)]](https://www.rsc.org/images/entities/char_2009.gif) 857 857 |
6 |
Affinity-free enrichment enables mass spectrometry detection of MUC16
Ascites has previously been studied using bottom-up proteomics as a potential source of new biomarkers. Kislinger and co-workers reported the first high-quality proteome of ovarian cancer ascites.4 These researchers performed in-solution and gel-based protein digestion of ascites followed by LC-MS analysis and identified over 2500 proteins in crude ascites isolated from a patient with stage III serous ovarian cancer. Later work from this group identified 500 protein candidate biomarkers in ascites following depletion of twelve high-abundance plasma proteins.5 Despite accomplishing extensive characterization of ascites and identification of new biomarker candidates, these studies did not consistently identify MUC16. To achieve our goal of characterizing MUC16 from individual patients using mass spectrometry, an enrichment strategy targeting high molecular weight proteins was required. The enrichment protocol that we report here enabled identification of this low-abundance protein biomarker in patient ascites, and MUC16 peptides were detected in each ascites sample we analyzed.After enrichment for MUC16, samples corresponding to pool 1 and pool 2 (the first two groupings of fractions collected using size exclusion chromatography, Fig. 2) were processed using an optimized bottom-up proteomics workflow.23 Our approach uses suspension trapping (STrap), which requires microgram amounts of input material, allows the use of harsh MS-incompatible denaturing agents, and produces results consistent with other digestion protocols.24–26 Because there is no straightforward conversion between the clinical assay measurement (CA125 U mL−1) and amount of MUC16, we used the results from BCA assay to determine total protein amounts. Ten micrograms of protein were digested from each patient and pool sample, and the amount of CA125 digested was calculated from the sample purity (Table 2). Table 3 summarizes the input amount of CA125 (U), the total number of proteins and peptides identified, the number of MUC16 peptides detected, and the percent coverage of MUC16. Day-to-day accuracy and precision of the mass spectrometer were 3.8 ppm and 2.7 ppm, respectively. Accuracy and precision were determined from replicate data (N = 17, collected on 14 days spanning 10 months) on the commonly detected MUC16-derived peptide, VAIYEEFLR.
| Patient #. pool # | CA125 (U) | Protein IDs | Peptide IDs | MUC16 peptides | % Cov. MUC16 |
|---|---|---|---|---|---|
| 1.1 | 7044 | 416 ± 32 | 2740 ± 240 | 53 ± 2 | 12 ± 0 |
| 1.2 | 4570 | 327 ± 16 | 2670 ± 150 | 37 ± 2 | 8 ± 0 |
| 2.1 | 6912 | 249 ± 12 | 1160 ± 110 | 26 ± 4 | 9 ± 1 |
| 2.2 | 1610 | 224 ± 10 | 1980 ± 130 | 17 ± 4 | 6 ± 1 |
| 3.1 | 3440 | 243 ± 34 | 1330 ± 150 | 17 ± 2 | 5 ± 1 |
| 3.2 | 1185 | 167 ± 35 | 1250 ± 300 | 2 ± 1 | 1 ± 1 |
A greater number of proteins and MUC16 peptides are identified in pool 1 than pool 2 for all patients (Table 3). We hypothesized that pool 1 and pool 2 would contain different proteins because these pools were collected as different fractions following size exclusion chromatography. This hypothesis is partially supported. Fig. 3 shows Venn diagrams comparing pool 1 and pool 2 proteins and MUC16 peptides identified in each patient. We observe molecular heterogeneity in the population of proteins detected. However, the set of MUC16 peptides detected in pool 2 is almost entirely contained in the set of MUC16 peptides detected in pool 1.
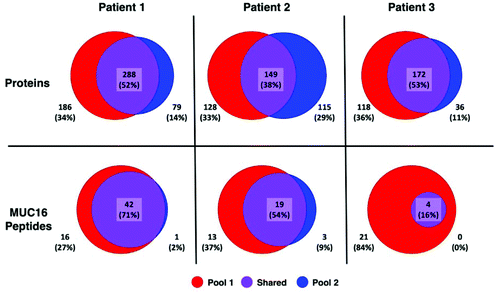 | ||
| Fig. 3 Venn diagrams showing the overlap of proteins (top) and MUC16 peptides identified (bottom) in three individual patients. The total number of proteins and peptides for each patient and pool is a sum of all biological and technical replicates (N = 9). A list of all identified proteins and peptides are in the ESI† spreadsheet. | ||
Our ultimate goal is a better molecular characterization of MUC16 that will enable the development of alternative detection strategies. The overlap of MUC16 peptides identified in pools 1 and 2 suggests that the MUC16 isolated in pool 2 does not differ significantly from that found in pool 1 (Table 3, Fig. 3). Because pool 2 provides little new analytical information, future studies will analyze only the proteins enriched in pool 1, reducing the number of samples and analysis time required per patient.
Proteins identified in enriched ascites span molecular weights of 20–2500 kDa
For this affinity-free enrichment method to be most useful it should retain the majority of MUC16 proteoforms, increasing their concentration in the sample while excluding lower molecular weight, high abundance proteins that might otherwise interfere with mass spectrometry detection. We chose to use size exclusion chromatography on a Sepharose CL-4B column that should exclude globular proteins of molecular weight <60 kDa. We expect to see proteins with the largest molecular weight in the first few fractions (Fig. 2C, pool 1). Subsequent fractions will have proteins of lower molecular weight. Surprisingly, we found that later fractions also exhibited high CA125 counts, so they were also included in analysis (Fig. 2C, pool 2).To determine if the enrichment process eliminated proteins <60 kDa, the molecular weights of proteins identified with high confidence and a Mascot score greater than 100 were investigated. Fig. 4A–C shows that the molecular weights of the proteins identified in enriched ascites span three orders of magnitude. Additionally, MUC16 is the only protein identified with a molecular weight >1000 kDa. Fig. 4D–F shows an enlarged view of proteins ranging from 0–150 kDa. There is substantial overlap in the protein molecular weights identified in pool 1 and pool 2 (Fig. 4). This finding supports our previous claim that there is little new information gained by characterization of pool 2.
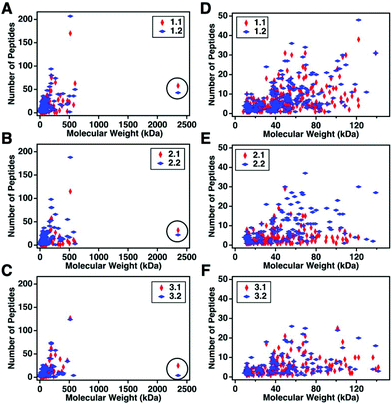 | ||
| Fig. 4 Scatter plots showing the number of peptides identified vs. molecular weight of the corresponding protein. Proteins identified in pool 1 are shown in red and proteins from pool 2 are in blue. A–C represent the full distribution of molecular weights for patients 1–3 respectively, and D–F show the subset of proteins ranging from 0–150 kDa. MUC16 is highlighted in a black circle in A–C. The list of proteins can be found in ESI.† | ||
Surprisingly, the proteins identified have a molecular weight much lower than Sepharose CL-4B column cut-off. One explanation for this finding is that proteins may aggregate and function as larger globular proteins. During the enrichment step using the Sepharose-CL4B size exclusion column, 10 mM ammonium bicarbonate buffer is used due to its compatibility with downstream analyses, however, higher salt concentrations are typically required to prevent aggregation of proteins. A related explanation for this finding is that a subset of the detected proteins may bind specifically or non-specifically to the protein and glycan epitopes of MUC16. These interactions are then broken during the denaturation and reduction steps conducted prior to mass spectrometry. Further investigation into preventing protein aggregation may help eliminate lower molecular weight proteins, which will further reduce sample complexity and lead to detection of an increased percentage of the low abundance MUC16 proteoforms.
MUC16 peptide identifications correlate to CA125 counts
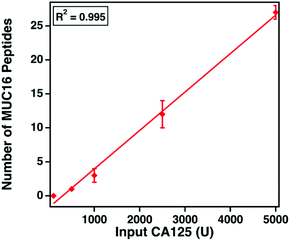
The clinical assay reports CA125 counts in units mL−1. Despite extensive research, the epitopes of the clinically used antibodies have not been identified. We hypothesize that the number of detectable, tryptic MUC16 peptides correlates with the input amount of CA125 measured using the clinical assay. Varied amounts of CA125, ranging from 100 to 5000 U, were digested and characterized. Fig. 5 shows that as the input amount of CA125 (U, determined by Abbot Architect assay) increases (x-axis), the number of MUC16 peptides (y-axis) also increases. This finding supports our hypothesis and suggests the epitopes of the CA125 antibodies used in the clinical assay are amenable to mass spectrometry detection.MUC16 peptides map to the tandem repeat domain
MUC16 contains three domains: a N-terminus (amino acids 1–12![[thin space (1/6-em)]](https://www.rsc.org/images/entities/char_2009.gif) 069); a tandem repeat domain (amino acids 12
069); a tandem repeat domain (amino acids 12![[thin space (1/6-em)]](https://www.rsc.org/images/entities/char_2009.gif) 070–21
070–21![[thin space (1/6-em)]](https://www.rsc.org/images/entities/char_2009.gif) 867); and a C-terminus (amino acids 21
867); and a C-terminus (amino acids 21![[thin space (1/6-em)]](https://www.rsc.org/images/entities/char_2009.gif) 868–22
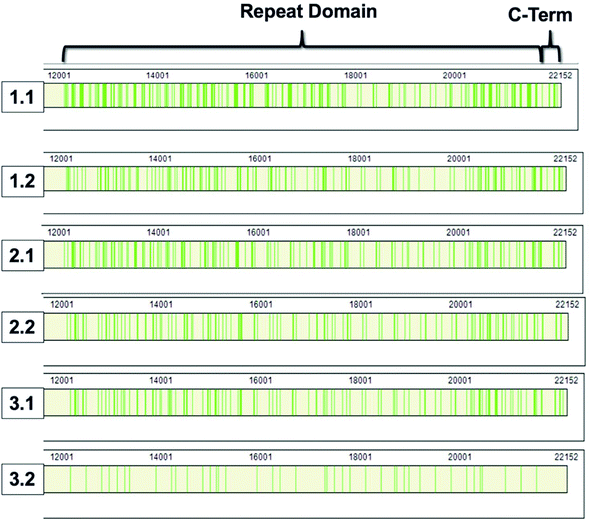
868–22![[thin space (1/6-em)]](https://www.rsc.org/images/entities/char_2009.gif) 152).8,9 The repeat domain consists of 61 complete and 2 partial 156-amino acid repeats that contain both highly conserved and highly variable amino acids (data not shown). Following peptide identification, the MUC16 peptides from each patient sample were mapped to the MUC16 amino acid sequence. Fig. 6 shows that almost all peptides detected via mass spectrometry derive from the repeat domain or C-terminus; only two peptides are identified in the N-terminus, and this identification was only observed in two of the samples (Table 4, patient 1). Fig. 6 highlights the repeat domain and C-terminus of MUC16. Table 4 shows the number of peptides identified within each domain of MUC16. We note that relatively high percent coverage of this protein is possible even when relatively few peptides are identified. A 10 amino acid long peptide, for example, represents 0.045% of the entire MUC16 sequence. Because of the highly conserved nature of the tandem repeat domain, the identification of 2 peptides enables 1% coverage of MUC16 (Table 3, Fig. 7, patient 3.2). Future work will focus on identifying peptides that are conserved in all tandem repeats and identified in multiple patient samples. Completion of this goal will enable development of an affinity agent that binds to the conserved peptides, which could then be used to create an alternative detection assay for MUC16 with a known epitope.
152).8,9 The repeat domain consists of 61 complete and 2 partial 156-amino acid repeats that contain both highly conserved and highly variable amino acids (data not shown). Following peptide identification, the MUC16 peptides from each patient sample were mapped to the MUC16 amino acid sequence. Fig. 6 shows that almost all peptides detected via mass spectrometry derive from the repeat domain or C-terminus; only two peptides are identified in the N-terminus, and this identification was only observed in two of the samples (Table 4, patient 1). Fig. 6 highlights the repeat domain and C-terminus of MUC16. Table 4 shows the number of peptides identified within each domain of MUC16. We note that relatively high percent coverage of this protein is possible even when relatively few peptides are identified. A 10 amino acid long peptide, for example, represents 0.045% of the entire MUC16 sequence. Because of the highly conserved nature of the tandem repeat domain, the identification of 2 peptides enables 1% coverage of MUC16 (Table 3, Fig. 7, patient 3.2). Future work will focus on identifying peptides that are conserved in all tandem repeats and identified in multiple patient samples. Completion of this goal will enable development of an affinity agent that binds to the conserved peptides, which could then be used to create an alternative detection assay for MUC16 with a known epitope.
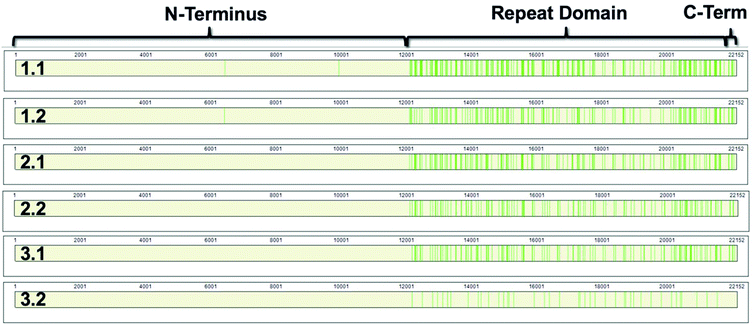 | ||
| Fig. 6 Sequence coverage maps of MUC16 isolated from each patient sample. Green vertical bars represent regions of the amino acid sequence where peptides have been identified. | ||
| Patient #. pool # | N-terminus | Repeat domain | C-terminus |
|---|---|---|---|
| 1.1 | 2 | 55 | 6 |
| 1.2 | 1 | 37 | 6 |
| 2.1 | 0 | 27 | 5 |
| 2.2 | 0 | 20 | 3 |
| 3.1 | 0 | 20 | 5 |
| 3.2 | 0 | 3 | 1 |
The peptides identified in the repeat domain and C-terminus were mapped to each 156mer repeat using the CA125 repeat sequence and numbering (beginning at the repeat proximal to the N-terminus) reported by O'Brien et al.9 We annotated the repeats at each predicted tryptic digestion site (arginine (R) and lysine (K), except when followed by a proline (P)). We then mapped the peptides identified from pool 1 and pool 2 to each individual repeat domain (ESI†). The peptides that we identify map to the SEA domain and C-loop but not the serine/threonine-rich region. The peptides we identified that are unique to pool 1 are located within a 21mer sequence that had been hypothesized to be the location of antibody binding.9,27,28 In a previous study, we used solid phase peptide synthesis to assemble sequence variants of the C-loop and confirmed that they are not sufficient for immunological recognition by OC125 or M11.11,12 Additionally, peptides that are unique to pool 1 are almost always flanked by peptides found in both pools 1 and 2. This further confirms that the analytically useful information is identified in pool 1, and the contents of pool 2 are redundant. Future mass spectrometry analysis of individually expressed tandem repeats may enable discovery of the CA125 epitope.
Conclusions
The study reported here suggests a path forward to characterizing MUC16 sourced from patient ascites. We have identified MUC16 in enriched ascites and are able to map the peptides to their locations in the tandem repeat domain. Further refinement of the enrichment process will enable elimination of high abundance, low molecular weight proteins which in turn will reduce sample complexity and enable deeper sequencing of MUC16. This study focuses on identifying non-glycosylated peptides. We hypothesize that deglycosylation would enable detection of peptides deriving from the highly glycosylated N-terminus and result in greater coverage of MUC16.29 Detection of glycopeptides may enable characterization of the N-terminus. Recently reported mucinases are suitable for the characterization of glycopeptides in mucins.30Conflicts of interest
The authors declare that they have no conflicts of interest.Acknowledgements
This work was supported by the University of Notre Dame Advancing Our Vision Fund in Analytical Science and Engineering (to RJW), by funds from the University of Wisconsin Comprehensive Cancer center pilot grant (to MSP) and by funds from P30CA14520 from the National Cancer Institute. RFK was funded in part by the Wisconsin Alumni Research Foundation. NSL is a fellow of the Chemistry-Biochemistry-Biology Interface (CBBI) Program at the University of Notre Dame, supported by training grant T32GM075762 from the National Institute of General Medical Sciences. The content is solely the responsibility of the authors and does not necessarily represent the official views of the National Institute of General Medical Sciences or the National Institutes of Health. The authors thank Bill Boggess and the University of Notre Dame Mass Spectrometry and Proteomics Facility (MSPF) for expert technical assistance. NSL and RJW thank the members of the Gyna Girls for stimulating discussions and inspiration.References
- G. Becker, D. Galandi and H. E. Blum, Malignant ascites: Systematic review and guideline for treatment, Eur. J. Cancer, 2006 DOI:S0959-8049(05)01077-4.
- A. A. Ayantunde and S. L. Parsons, Pattern and prognostic factors in patients with malignant ascites: A retrospective study, Ann. Oncol., 2007 DOI:S0923-7534(19)42020-6.
- E. Kipps, D. S. Tan and S. B. Kaye, Meeting the challenge of ascites in ovarian cancer: New avenues for therapy and research, Nat. Rev. Cancer, 2013 DOI:10.1038/nrc3432.
- L. Gortzak-Uzan, A. Ignatchenko, A. I. Evangelou, M. Agochiya, K. A. Brown, P. St Onge, I. Kireeva, G. Schmitt-Ulms, T. J. Brown, J. Murphy, B. Rosen, P. Shaw, I. Jurisica and T. Kislinger, A proteome resource of ovarian cancer ascites: Integrated proteomic and bioinformatic analyses to identify putative biomarkers, J. Proteome Res., 2008 DOI:10.1021/pr0703223.
- S. Elschenbroich, V. Ignatchenko, B. Clarke, S. E. Kalloger, P. C. Boutros, A. O. Gramolini, P. Shaw, I. Jurisica and T. Kislinger, In-depth proteomics of ovarian cancer ascites: Combining shotgun proteomics and selected reaction monitoring mass spectrometry, J. Proteome Res., 2011 DOI:10.1021/pr1011087.
- C. Kuk, V. Kulasingam, C. G. Gunawardana, C. R. Smith, I. Batruch and E. P. Diamandis, Mining the ovarian cancer ascites proteome for potential ovarian cancer biomarkers, Mol. Cell. Proteomics, 2009 DOI:10.1074/mcp.M800313-MCP200.
- P. Sedlaczek, I. Frydecka, M. Gabrys, A. Van Dalen, R. Einarsson and A. Harlozinska, Comparative analysis of CA125, tissue polypeptide specific antigen, and soluble interleukin-2 receptor alpha levels in sera, cyst, and ascitic fluids from patients with ovarian carcinoma, Cancer, 2002 DOI:10.1002/cncr.10917.
- T. J. O'Brien, J. B. Beard, L. J. Underwood, R. A. Dennis, A. D. Santin and L. York, The CA 125 gene: An extracellular superstructure dominated by repeat sequences, Tumour Biol., 2001 DOI:10.1159/000050638.
- T. J. O'Brien, J. B. Beard, L. J. Underwood and K. Shigemasa, The CA 125 gene: A newly discovered extension of the glycosylated N-terminal domain doubles the size of this extracellular superstructure, Tumour Biol., 2002 DOI:10.1159/000064032.
- P. Bork and L. Patthy, The SEA module: A new extracellular domain associated with O-glycosylation, Protein Sci., 1995 DOI:10.1002/pro.5560040716.
- Z. T. Berman, L. J. Moore, K. E. Knudson and R. J. Whelan, Synthesis and structural characterization of the peptide epitope of the ovarian cancer biomarker CA125 (MUC16), Tumour Biol., 2010 DOI:10.1007/s13277-010-0062-4.
- M. Felder, A. Kapur, J. Gonzalez-Bosquet, S. Horibata, J. Heintz, R. Albrecht, L. Fass, J. Kaur, K. Hu, H. Shojaei, R. J. Whelan and M. S. Patankar, MUC16 (CA125): Tumor biomarker to cancer therapy, a work in progress, Mol. Cancer, 2014 DOI:10.1186/1476-4598-13-129.
- A. Bressan, F. Bozzo, C. A. Maggi and M. Binaschi, OC125, M11 and OV197 epitopes are not uniformly distributed in the tandem-repeat region of CA125 and require the entire SEA domain, Dis. Markers, 2013 DOI:10.3233/DMA-130968.
- F. Weiland, K. Fritz, M. K. Oehler and P. Hoffmann, Methods for identification of CA125 from ovarian cancer ascites by high resolution mass spectrometry, Int. J. Mol. Sci., 2012 DOI:10.3390/ijms13089942.
- L. Marcos-Silva, Y. Narimatsu, A. Halim, D. Campos, Z. Yang, M. A. Tarp, P. J. Pereira, U. Mandel, E. P. Bennett, S. Y. Vakhrushev, S. B. Levery, L. David and H. Clausen, Characterization of binding epitopes of CA125 monoclonal antibodies, J. Proteome Res., 2014 DOI:10.1021/pr500215g.
- S. Das, P. D. Majhi, M. H. Al-Mugotir, S. Rachagani, P. Sorgen and S. K. Batra, Membrane proximal ectodomain cleavage of MUC16 occurs in the acidifying golgi/post-golgi compartments, Sci. Rep., 2015 DOI:10.1038/srep09759.
- R. Coelho, L. Marcos-Silva, S. Ricardo, F. Ponte, A. Costa, J. M. Lopes and L. David, Peritoneal dissemination of ovarian cancer: Role of MUC16-mesothelin interaction and implications for treatment, Expert Rev. Anticancer Ther., 2018 DOI:10.1080/14737140.2018.1418326.
- I. Matte, P. Garde-Granger, P. Bessette and A. Piche, Ascites from ovarian cancer patients stimulates MUC16 mucin expression and secretion in human peritoneal mesothelial cells through an akt-dependent pathway, BMC Cancer, 2019 DOI:10.1186/s12885-019-5611-7.
- K. Nustad, R. C. Bast, T. J. Brien, O. Nilsson, P. Seguin, M. R. Suresh, T. Saga, S. Nozawa, O. P. Bormer, H. W. de Bruijn, M. Nap, A. Vitali, M. Gadnell, J. Clark, K. Shigemasa, B. Karlsson, F. T. Kreutz, D. Jette, H. Sakahara, K. Endo, E. Paus, D. Warren, S. Hammarstrom, P. Kenemans and J. Hilgers, Specificity and affinity of 26 monoclonal antibodies against the CA 125 antigen: First report from the ISOBM TD-1 workshop. international society for oncodevelopmental biology and medicine, Tumour Biol., 1996 DOI:10.1159/000217982.
- S. Di Palma, A. Zoumaro-Djayoon, M. Peng, H. Post, C. Preisinger, J. Munoz and A. J. Heck, Finding the same needles in the haystack? A comparison of phosphotyrosine peptides enriched by immuno-affinity precipitation and metal-based affinity chromatography, J. Proteomics, 2013 DOI:10.1016/j.jprot.2013.07.024.
- C. Fredolini, S. Bystrom, E. Pin, F. Edfors, D. Tamburro, M. J. Iglesias, A. Haggmark, M. G. Hong, M. Uhlen, P. Nilsson and J. M. Schwenk, Immunocapture strategies in translational proteomics, Expert Rev. Proteomics, 2016 DOI:10.1586/14789450.2016.1111141.
- M. J. Guy, Y. C. Chen, L. Clinton, H. Zhang, J. Zhang, X. Dong, Q. Xu, S. Ayaz-Guner and Y. Ge, The impact of antibody selection on the detection of cardiac troponin I, Clin. Chim. Acta, 2013 DOI:10.1016/j.cca.2012.10.034.
- N. Schuster-Little, S. Madera and R. Whelan, Developing a mass spectrometry-based assay for the ovarian cancer biomarker CA125 (MUC16) using suspension trapping (STrap), Anal. Bioanal. Chem., 2020 DOI:10.1007/s00216-020-02586-9.
- A. Zougman, P. J. Selby and R. E. Banks, Suspension trapping (STrap) sample preparation method for bottom-up proteomics analysis, Proteomics, 2014 DOI:10.1002/pmic.201300553.
- K. R. Ludwig, M. M. Schroll and A. B. Hummon, Comparison of in-solution, FASP, and S-trap based digestion methods for bottom-up proteomic studies, J. Proteome Res., 2018 DOI:10.1021/acs.jproteome.8b00235.
- M. HaileMariam, R. V. Eguez, H. Singh, S. Bekele, G. Ameni, R. Pieper and Y. Yu, S-trap, an ultrafast sample-preparation approach for shotgun proteomics, J. Proteome Res., 2018 DOI:10.1021/acs.jproteome.8b00505.
- D. J. Warren, K. Nustad, J. B. Beard and T. J. O'Brien, Expression and epitope characterization of a recombinant CA 125 repeat: Fourth report from the ISOBM TD-1 workshop, Tumour Biol., 2009 DOI:10.1159/000209988.
- B. W. Yin, A. Dnistrian and K. O. Lloyd, Ovarian cancer antigen CA125 is encoded by the MUC16 mucin gene, Int. J. Cancer, 2002 DOI:10.1002/ijc.10250.
- R. Saldova, W. B. Struwe, K. Wynne, G. Elia, M. J. Duffy and P. M. Rudd, Exploring the glycosylation of serum CA125, Int. J. Mol. Sci., 2013 DOI:10.3390/ijms140815636.
- S. A. Malaker, K. Pedram, M. J. Ferracane, B. A. Bensing, V. Krishnan, C. Pett, J. Yu, E. C. Woods, J. R. Kramer, U. Westerlind, O. Dorigo and C. R. Bertozzi, The mucin-selective protease StcE enables molecular and functional analysis of human cancer-associated mucins, Proc. Natl. Acad. Sci. U. S. A., 2019 DOI:10.1073/pnas.1813020116.
Footnote |
| † Electronic supplementary information (ESI) available: Complete list of identified proteins and maps of identified peptide locations. See DOI: 10.1039/d0an01701a |
| This journal is © The Royal Society of Chemistry 2021 |

