
A TIMS-TOF mass spectrometry study of disaccharides from in situ ESI derivatization with 3-pyridinylboronate†
Lei
Li
 ab,
Jiancheng
Yu
ac,
Chengyi
Xie
ac,
Chenlu
Wang
ab,
Pengfei
Guan
ab,
Jun Jack
Hu
*ab and
Keqi
Tang
*ab
ab,
Jiancheng
Yu
ac,
Chengyi
Xie
ac,
Chenlu
Wang
ab,
Pengfei
Guan
ab,
Jun Jack
Hu
*ab and
Keqi
Tang
*ab
aZhejiang Provincial Key Laboratory of Advanced Mass Spectrometry and Molecular Analysis, Institute of Mass Spectrometry, Ningbo University, Ningbo 315211, P. R. China. E-mail: hujun1@nbu.edu.cn; tangkeqi@nbu.edu.cn
bSchool of Material Science and Chemical Engineering, Ningbo University, Ningbo 315211, P. R. China
cFaculty of Electrical Engineering and Computer Science, Ningbo University, Ningbo 315211, P. R. China
First published on 5th November 2020
Abstract
3-Pyridinylboronate, a zwitterionic boronic acid, displayed effective in situ ESI for reversible covalent tagging of saccharides in both cation and anion modes. The ion mobilities of thus-generated ions were examined with the Bruker timsTOF fleX instrument. Nine disaccharides were examined using this method. They have identical mass-to-charge ratios, differing only in monomer compositions, regio-linkages, and anomeric configurations (α or β). The IMS separations of the disaccharides from this method were compared with those from sodium adducts reported in the literature. The differentiation effects of this method on the disaccharide isomers were increased on average by an order of magnitude. Using this method, all the pairs of disaccharides selected from nine isomers were completely identified by comparing the mobility spectra of single-tagged and double-tagged ions.
Introduction
Ion mobility spectroscopy (IMS) allows gas-phase separations of ions with identical mass-to-charge ratios but different ion mobilities.1,2 It is inherently a gas-phase method that provides easy coupling with mass spectrometry in terms of ion transportation and sampling throughput.3–5 It is also a separation method orthogonal to common chromatographic techniques that provides a new dimension in investigating complex mixtures.6 Recent developments in IMS instrumentation have resulted in various IMS-enhanced mass spectrometric platforms, i.e., DTIMS, TWIMS, TIMS, FAIMS and DMA.7 The latest development of the Waters cyclic IMS system has increased the resolving power to about 750, leading in the IMS commercialization instruments.8–11 It is well known that biomacromolecules are formed from simple monomers of different chemical compositions and stereoisomers with varied sequences and regio-connectivity. These isomeric molecules are particularly challenging for mass spectrometric analysis because they cannot be differentiated by simple mass-to-charge ratio measurements. The fast separation capability of IMS could open new doors to allow high throughput mass spectrometric analyses of a variety of complex biological samples.Herein, we report a new IMS study of nine disaccharides (Fig. 1) using an in situ derivatization in an electrospray ion source on a TIMS-TOF instrument.12 While disaccharides are formed from a handful of monosaccharides by dehydration between two hydroxy groups from each of the two monomers, a great number of closely related structures with the same mass-to-charge ratio are possible due to the complexity of the regio- and stereochemistry of the hydroxy groups.1,13–15 Mass spectrometric analysis of oligosaccharides is a rapid and effective alternative to other analytical techniques including enzymatic and chromatographic methods.16,17 However, the ionization efficiency of nonderivatized sugars has remained low and the structural information that was extracted from the fragment ions has been scarce.18 In this study, we show that the use of 3-pyridinylboronate (PBA) as an in situ derivatization agent enhances not only the ionization efficiencies of the disaccharides but also the IMS resolutions of the isomers.
 | ||
| Fig. 1 Structures of the 9 disaccharides used in this study. | ||
Tagging charge sites to the analytes before ESI is a common derivatization strategy in tandem mass spectrometric analysis of biomacromolecules.19,20 Unlike electrostatic attachment of positive or negative charges such as Na+, Cl−, etc. to the analytes, the covalently linked tags form stable cation or anion sites with functional groups of high gas-phase basicity or gas-phase acidity, respectively, to ensure qualitive and quantitative analysis.21–26In situ derivatization in ESI utilizes the reversible covalent bonding between a boronic acid and sugars in electrospray solutions by simple mixing without separate chemical reaction stages a priori.27–30 When the ions are airborne during ESI into the gas phase, the reversible bonds become irreversible covalent linkages, while the tags carry charges and specific masses for easy detection. Most relevant to this work, Fernández and co-workers11,30 used 3-carboxy-5-nitrophenylboronic acid (3C5NBA) as an in situ anionic tag for sugars. In this case, the boronic acid formed covalent esters with the sugars during the ESI, and the carboxylate formed the anion site.
Several years ago, in the development of a glucose sensor for monitoring diabetes, we discovered PBA, a zwitterionic boronic acid, that formed reversible covalent bonds with sugars with high bi-molecular binding affinities of about 200 in near-neutral aqueous buffers, at least an order of magnitude better than that of phenylboronic acid.31 Electrospray ionization of the PBA/sugar mixtures was carried out on a Thermo LTQ instrument and positive ([M + PBA − 2H2O + H]+) or negative ([M + PBA − 3H2O − H]−) ions of the ester derivatives of the corresponding sugars were observed. CID of the ions for isomeric disaccharides in the ion trap produced MS2 spectra which were too similar to separate them qualitatively. The inconclusive ESI MS and MS2 were included in a patent filing (Scheme 1).32
 | ||
| Scheme 1 The use of PBA as cation or anion tags for in situ ESI analysis of sugars. | ||
Recently, we have been able to carry out new CID studies of the in situ ESI-formed PBA/sugar ester ions on a triple–quadruple instrument (Shimadzu LCMS 8060) under single-collision pressures. Distinctive fragments were observed in the MS2 spectra for isomeric sugars.33 The observed fragmentation patterns were unique which we suspected to be associated with the remote charge sites of the ions and a systematic investigation is underway. In addition, some of the MS2 spectra were more complex than the others and we suspected that isomeric PBA esters were present in the in situ ESI tagging. Therefore, it is necessary to use IMS to examine the purities of the parent ions to interpret the MS2 spectra and systematically study the stereochemistry of the boronic ester formations in the ESI.34
Experimental section
Reagents and chemicals
Sucrose was supplied by Hushi Chemical Co., Ltd (Shanghai, China). Lactose was purchased from Solarbio Science and Technology Co., Ltd (Beijing, China). Maltose, melibiose, cellobiose and isomaltose were obtained from Shanghai Yuanye Biological Technology Co., Ltd (Shanghai, China). Lactulose was bought from Aladdin Co., Ltd (Shanghai, China). Trehalose was purchased from Macklin Co., Ltd (Beijing, China). Nigerose was purchased from Bailingwei Technology Co., Ltd (Beijing, China). Methanol (MEOH) was purchased from Merck, Inc. (Darmstadt, Germany). The derivatization reagent PBA was obtained from Sigma Aldrich (St Louis, MO, USA). Formic acid (FA) was purchased from Fisher Scientific Inc. (Pittsburgh, PA, USA). An ESI low concentration tune mix was obtained from Agilent Technologies (Santa Clara, CA, USA).For disaccharides consisting of glucose units, cellobiose (1,4β) and maltose (1,4α) are the anomers, while trehalose (1,1α), nigerose (1,3α) and isomaltose (1,6α) are the regio- or stereoisomers. For disaccharides consisting of galactose and glucose units, lactose and melibiose are the regioisomers, which differ in linkage sites: 1,4 vs. 1,6, and stereoisomers, β vs. α anomers. The last two disaccharides, sucrose and lactulose, consist of 1,2-linked glucose–fructose and 1,4-linked galactose–fructose, respectively.
Sample preparation
All carbohydrates and the derivatization reagent PBA were individually dissolved in a methanol/water/formic acid solution (49.95![[thin space (1/6-em)]](https://www.rsc.org/images/entities/char_2009.gif) :49.95:0.1, v/v/v) at a concentration of 1 mM for the positive ion mode. For the negative mode, all samples were prepared in methanol/water solution (1:1, v/v) at the same concentration without adding formic acid. The deionization water used was produced from a Milli-Q water purification system (Millipore Corp., Bedford, MA). The carbohydrate solution and PBA solution were mixed in a 1:1 (v/v) ratio at room temperature and diluted to yield a final concentration of 0.5 mM. The reaction mixture was then filtered through a 0.22 μm filter before TIMS-TOFMS analysis.
:49.95:0.1, v/v/v) at a concentration of 1 mM for the positive ion mode. For the negative mode, all samples were prepared in methanol/water solution (1:1, v/v) at the same concentration without adding formic acid. The deionization water used was produced from a Milli-Q water purification system (Millipore Corp., Bedford, MA). The carbohydrate solution and PBA solution were mixed in a 1:1 (v/v) ratio at room temperature and diluted to yield a final concentration of 0.5 mM. The reaction mixture was then filtered through a 0.22 μm filter before TIMS-TOFMS analysis.
Trapped ion mobility spectrometry
TIMS-TOFMS analysis was performed on a TIMS-TOF instrument from Bruker Daltonik (Bremen, Germany) equipped with an ESI source.32 The calibrant solution and samples were directly injected using a syringe pump with a glass syringe of 0.5 mL volume at a flow rate of 3 μL min−1. TIMS was performed in the positive or negative ion mode with an electrospray voltage of 3.6 kV. The ionization source conditions were end plate offset, 500 V; drying gas, 3 L min−1 at 200 °C; and nebulizer pressure, 0.3 bar. The TOFMS settings were rf funnel 1, 300 Vpp; rf funnel 2, 400 Vpp; multipole rf, 500 Vpp; quadrupole ion energy, 5 eV at low mass of 200 m/z; isCID energy, 0 eV; collision energy, 12 eV; collision rf, 1000 Vpp; transfer time, 80 μs; prepulse storage, 7 μs; ramp time, 500 ms and accumulation time, 10 ms; and rolling range, 25×. The mass range was set at m/z 100–3000. The duty cycle was 2%. The TIMS parameters (accumulation and ramp time) were adjusted to obtain the maximum resolving power for a set of saccharides.Calibrations were performed using the Agilent ESI low concentration tune mix before each experiment. The operation of TIMS was divided into the following two steps. Firstly, we scanned a wide voltage range to obtain a general overview and a calibration was performed in a wide mobility range (1/K0, 0.5–2.0) allowing detection of enough ions from the sample solution. Calibration ions from m/z 322.0212 to m/z 2121.9331 were used in the positive ion mode, while calibration ions from m/z 301.9981 to m/z 2233.9114 were used in the negative mode. After detecting the approximate location of sample mobility, we used the higher resolution IMS analysis in the second step. A calibration was performed over a smaller mobility range (1/K0, 0.8–1.45) using three m/z values (622.0290, 922.0098, 1221.9906 in the positive mode and 601.9789, 1033.9881, 1333.9689 in the negative mode).
For tandem mass spectrometry experiments, precursor ions were mass selected in the quadrupole of the TIMS-TOFMS instrument and fragment ions generated in the collision induced dissociation (CID) were detected by the TOF system. The collision energy can be varied from 5 to 65 eV and CID cannot be performed on the mobility-selected ions.
TIMS separation time resolution and collision cross section (CCS) measurement
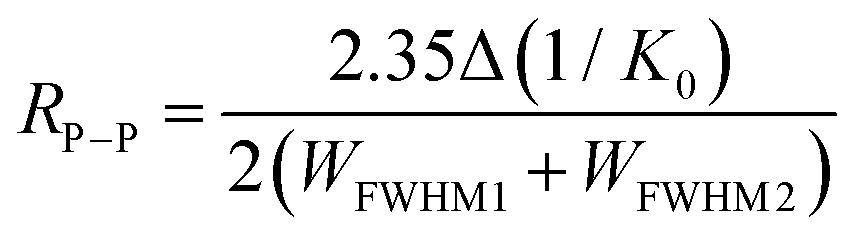
To account for different pressures and temperatures among different instrumental configurations, mobilities are commonly normalized, through a first approximation, for pressure and temperature to yield a reduced mobility value.33–37 The resolving power (R) is defined quantitatively from a single peak as a ratio of the location of the peak divided by its peak width at half height,38 | (1) |
The IMS resolution was calculated based on the following equation:39,40
 | (2) |
Results and discussion
In situ ESI tagging of disaccharides with PBA
The typical mass spectra for the in situ ESI TIMS-TOFMS of a disaccharide (M) in the cation and anion modes are shown in Fig. 2a and b, respectively. In the cation spectrum (Fig. 2a), we assigned m/z 430.1515 to be single-tagged ([M + PBA − 2H2O + H]+) and m/z 517.1795 to be double-tagged ([M + 2PBA − 4H2O + H]+). Doubly charged ions for the double-tagged substrates might be observable if molecules are large enough and electrostatic repulsion between the charges are small. The sodium ion adducts m/z 365.1054 ([M + Na]+) were also observed for all the disaccharides. The mobilograms of [M + Na]+ are shown in Fig. S1.† We used the ion mobilities of [M + Na]+ as the internal references for this PBA tagging method because the mobilities of these adducts were reported previously and confirmed in these experiments.41,42,45 In the anion mode, we assigned m/z 428.1369 to be single-tagged ([M + PBA − 2H2O − H]−) and m/z 515.1901 to be double-tagged ([M + 2PBA − 4H2O − H]−), respectively (Fig. 2b). In the following discussion, we use nominal masses instead of the above exact masses.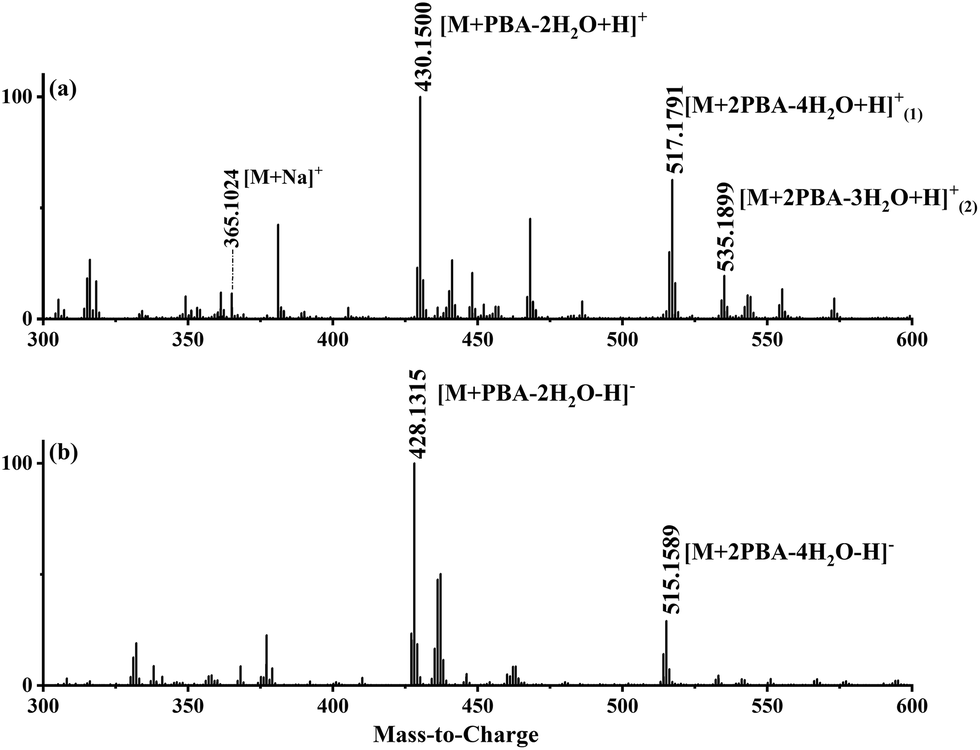 | ||
| Fig. 2 (a) The in situ ESI PBA tagging cation mass spectrum for melibiose and (b) the in situ ESI PBA tagging anion mass spectrum for melibiose. | ||
As a cold ionization method, ESI typically brings solution structures directly into the gas phase without chemical rearrangements. In the in situ ESI tagging, boronic esters are most likely formed in the sample droplets during solvent evaporation in the ESI ion source, because the bi-molecular association constants of the ester formations are too low. The sugars and PBA are most likely separated in the sample solutions before the electrospray. As the concentrations increase during the solvent evaporation, the equilibria shift to the boronic esters, producing the corresponding tagged ions with irreversible covalent bonds. This assumption was supported by the experiments. When both PBA and sugars were diluted below 1 μM, only the protonated PBA was observed in the mass spectra. Stable PBA–sugar ester ion signals were obtained when the sample concentrations increased to above 1 μM. The concentrations were optimized to 0.5 mM for the best IMS resolution. It is well known that the reversible covalent bonding between boronic acid and sugars is pH dependent. The equilibrium shifts from the sugar ester to the free sugar direction when the pH becomes lower and a typical boronic ester dissociates in acidic solutions.31 It is therefore remarkable to observe PBA–sugar ester cations in the positive ESI at the low μM concentration range, indicating that the PBA tag is useful for sugars in positive ESI conditions.
The relative intensity of the cation m/z 535 varied quite a lot in the spectra for the different sugars studied. A similar ion was observed in the negative in situ ESI 3C5NBA tagging for disaccharides by Fernández and co-workers. They assigned it to be an anion with a seven-membered boronic anhydride ring.11,30,43,44 The mechanism for the in situ ESI PBA tagging is shown in Scheme 2. We tentatively assigned the cation m/z 535 to be a double-tagged ion ([M + 2PBA − 3H2O + H]+ with one of the PBA failing to complete the second dehydration step, resulting in an open-ring structure. This assignment agrees well with the stereoselective nature of the boronate sugar ester formations in aqueous solutions. The second PBA tag could react with the sugar to form the first ester bond quickly which could instantaneously close the ring to form the second ester bond and lose H2O, if the stereochemistry is favourable for the formation of rings. In this case, the ion m/z 535 may not be observed in the spectra. However, for some of the sugars, the second ester bond formation could be difficult or even impossible due to stereoelectronic requirements for the ring formations. The rates of the second ester bond formations lead to the variations in the intensities of the m/z 535 ion signals when the ions are airborne, and the covalent bonds become irreversible. This supposition was further supported in the in situ ESI tagging experiments in the anion mode. We did not observe the [M + 2PBA − 3H2O − H]− ion for all the sugars. A mechanism for the anion tagging is proposed as shown in Scheme 3. During the ESI, the boronic ester [M + 2PBA − 2H2O] may produce [M + 2PBA − 3H2O − H]− or [M + PBA − 2H2O − H]− ions by losing [PBA + H]+ or H3O+, respectively. The loss of [PBA + H]+ should be favorable if we consider the basicity of PBA to be higher than that of water. This is consistent with the experimental observations.
 | ||
| Scheme 2 The proposed mechanism for in situ ESI PBA tagging in the cation mode. | ||
 | ||
| Scheme 3 The proposed mechanism for in situ ESI PBA tagging in the anion mode. | ||
Mobilograms of the in situ derivatized disaccharide ions
The mobilograms of a series of disaccharide PBA derivatives from the in situ ESI TIMS-TOFMS were obtained. The mobilogram displayed multiple peaks, each representing a configuration when the reversible covalent bonds become irreversible. Consistent with the literature, most of the peaks were not clearly resolved at current resolutions. In the cation mode, the mobility distributions of single-tagged complexes (m/z 430) and double-tagged complexes (m/z 517, [M + 2PBA − 4H2O + H]+; m/z 535, [M + 2PBA − 3H2O + H]+) are shown in Fig. 3a, Fig. S2 and S3,† respectively. In the anion mode, the mobility distributions of single-tagged complexes ([M + PBA − 2H2O − H]−m/z 428) and double-tagged complexes ([M + 2PBA − 4H2O − H]−m/z 515) are shown in Fig. 3b and Fig. S4,† respectively. | ||
| Fig. 3 (a) Mobilograms of nine PBA single-tagged disaccharide cations (m/z 430) and (b) mobilograms of nine PBA single-tagged disaccharide anions (m/z 428). | ||
The mobilities of the cations for disaccharides with single-tagged PBA are shown in Fig. 3a. We found that most disaccharide PBA derivatives had a major mobility peak, but there were also some derivatives whose major mobility peaks and minor mobility peaks had similar intensities. This observation is consistent with the solution observations that the boronic ester formations are 1,2-diol stereoselective and some disaccharides may allow multiple sites for PBA bonding. The relative intensities of the derivative peaks represented the relative stability of the boronic esters before the formation of the gas phase ions. The derivatization of a disaccharide with a single PBA (m/z 430) produced several mobility distributions (mobility, 1/K0 V s cm−2, the base peaks are in bold): maltose (0.903, 0.93, 0.954, 0.991), melibiose (0.911, 0.935, 0.961, 1.003), cellobiose (0.916, 0.936, 0.961, 0.983, 0.999), isomaltose (0.906, 0.918, 0.948, 0.999) and lactulose (0.905, 0.92, 0.93, 0.942). The derivatization of the following disaccharides produced a major mobility peak and one or two minor peaks: sucrose (0.919, 0.983), lactose (0.91, 0.94, 0.958) and trehalose (0.956, 1.001). The most special case was the derivatization of nigerose (0.922, 0.935, 0.966, 0.999) which produces two major mobility peaks and some minor mobility peaks.
The mobilograms of the anions for disaccharides derivatized with single-tagged PBA are shown in Fig. 3b. Overall, more mobility peaks were observed in the mobilograms than those in the cation mode. The CCS values were also generally smaller than those in the cation mode. The ion mobilities of the main peak and the minor peaks were typically too close to achieve baseline separations. In Table S3,† the CCS values of the disaccharide PBA derivatives in the negative ion mode are listed. In the negative ion mode, for the PBA single-tagged and double-tagged ions, the ranges of the CCS difference of the complexes were similar (9.3 Å2 and 10 Å2). These observations are consistent with the late-stage formation of the third O–B bond of the tetracoordinated boron anion in the ESI. Because the O–B bond is relatively short and strong, the reaction exothermicity for the third B–O bond may lead to kinetically controlled products and more compact structures in the in situ ESI tagging processes.
Comparison of the IMS separation of disaccharides using PBA or sodium cationization
Alkali metal ions have long been used as cationization reagents for saccharides in mass spectrometry and IMS. In general, the differences of the CCS values between alkali metal ion complexes formed with sugars increase as the radius of the metal ions increase.24 The CCS values of the disaccharide sodium complexes obtained by TIMS-TOFMS in this study were compared with those obtained by DTIMS in the literature (Table S1†).42 The differences in the CCS values obtained by the two instruments are negligible. Therefore, the IMS behaviour of disaccharides of sodium cationization in the literature by DTIMS may be directly used to evaluate the effectiveness of this in situ ESI PBA tagging method obtained from TIMS-TOFMS.For the anomers maltose and cellobiose (Fig. 1), it was observed that the separation was not satisfactory using sodium cationization in the TIMS-TOFMS experiments as shown in Fig. 4a. The resolution of the two peaks (Rp–p value) was 0.29, which could not achieve baseline separation. For the single-tagged PBA derivatization, the resolution of the two peaks was improved with the Rp–p value to be 0.49 as shown in Table 1. In addition, for the double-tagged PBA derivatives (m/z 517), we observed that the two isomers achieved baseline separation in the IMS as shown in Fig. 4e.
 | ||
| Fig. 4 Mobilograms of disaccharides with sodium (a, b, c, d) or PBA tagging (e, f, g, h): (a) and (e) are anomeric isomers, (b), (f), (c) and (g) are regio-linkage and monomer compositional isomers, and (d) and (f) are other isomers. | ||
| Disaccharide pair | R P–P | |||||
|---|---|---|---|---|---|---|
| m/z 365 | m/z 430 | m/z 517 | m/z 535 | m/z 428 | m/z 515 | |
| Sucrose–lactose | 0.67 | 4.79 | 1.57 | 1.47 | 0.71 | 0.27 |
| Sucrose–maltose | 1.18 | 0.49 | 0.065 | 0.95 | 0.72 | 1.08 |
| Sucrose–melibiose | 0.69 | 1.24 | 1.38 | 1.14 | 0.48 | 0.41 |
| Sucrose–cellobiose | 1.54 | 1.04 | 3.11 | 2.83 | 0.87 | 1.65 |
| Sucrose–isomaltose | 1.32 | 1.11 | 2.54 | 1.66 | 0.69 | 0.55 |
| Sucrose–lactulose | 0.96 | 3.89 | 1.175 | 3.36 | 2.42 | 2.23 |
| Sucrose–trehalose | 0.59 | 1.18 | 0.89 | 1.63 | 2.79 | 2.64 |
| Sucrose–nigerose | 0.51 | 4.22 | 2.47 | 1.22/1.97/3.52 | 2.64 | 0.98 |
| Lactose–maltose | 0.52 | 5.04 | 1.5 | 0.012 | 0.081 | 1.00 |
| Lactose–melibiose | 0.074 | 6.07 | 0.21 | 0.034 | 0.26 | 0.67 |
| Lactose–cellobiose | 0.88 | 5.84 | 1.82 | 1.5 | 0.094 | 1.74 |
| Lactose–isomaltose | 0.66 | 6.19 | 1.15 | 0.44 | 0.1 | 0.51 |
| Lactose–lactulose | 0.29 | 0.62 | 0.35 | 1.78 | 1.12 | 2.12 |
| Lactose–trehalose | 0.073 | 5.97 | 0.73 | 0.37 | 1.39 | 2.64 |
| Lactose–nigerose | 0.15 | 0.83 | 1.09 | 0.16/0.77/1.93 | 1.49 | 0.98 |
| Maltose–melibiose | 0.41 | 0.71 | 1.34 | 0.41 | 0.32 | 0.78 |
| Maltose–cellobiose | 0.29 | 0.49 | 3.06 | 1.55 | — | 0.47 |
| Maltose–isomaltose | 0.15 | 0.52 | 2.47 | 0.55 | 0.18 | 0.3 |
| Maltose–lactulose | 0.22 | 4.17 | 1.11 | 1.83 | 0.89 | 0.64 |
| Maltose–trehalose | 0.59 | 0.62 | 0.83 | 0.48 | 1.12 | 1.03 |
| Maltose–nigerose | 0.73 | 4.77 | 2.41 | 0.27/0.85/1.97 | 1.26 | 0.12 |
| Melibiose–cellobiose | 0.76 | 0.25 | 1.22 | 0.71 | 0.37 | 1.37 |
| Melibiose–isomaltose | 0.55 | 0.26 | 0.69 | 0.031 | 0.18 | 0.28 |
| Melibiose–lactulose | 0.21 | 4.76 | 0.46 | 0.84 | 1.61 | 1.89 |
| Melibiose–trehalose | 0.14 | 0.12 | 0.75 | 0.095 | 1.92 | 2.35 |
| Melibiose–nigerose | 0.21 | 5.29 | 0.64 | 0.2/0.21/0.94 | 1.94 | 0.66 |
| Cellobiose–isomaltose | 0.22 | — | 0.67 | 1.08 | 0.21 | 0.71 |
| Cellobiose–lactulose | 0.59 | 4.89 | 2.05 | 0.1 | 1.06 | 0.049 |
| Cellobiose–trehalose | 0.95 | 0.13 | 2.47 | 1.22 | 1.34 | 0.47 |
| Cellobiose–nigerose | 1.03 | 5.32 | 0.73 | 1.22/0.7/0.26 | 1.46 | 0.61 |
| Isomaltose–lactulose | 0.37 | 5.46 | 1.42 | 1.33 | 1.42 | 0.89 |
| Isomaltose–trehalose | 0.73 | 0.13 | 1.83 | 0.094 | 1.73 | 1.21 |
| Isomaltose–nigerose | 0.81 | 5.65 | 0.059 | 0.24/0.35/1.48 | 1.79 | 0.21 |
| Lactulose–trehalose | 0.37 | 5.01 | 0.35 | 1.5 | 0.33 | 0.56 |
| Lactulose–nigerose | 0.44 | 0.13 | 1.36 | 1.45/0.88/0.18 | 0.64 | 0.82 |
| Trehalose–nigerose | 0.073 | 5.46 | 1.76 | 0.17/0.45/1.67 | 0.37 | 1.22 |
Disaccharides with the same monomer composition and anomeric orientation but different regio-linkages include maltose, isomaltose, trehalose and nigerose. These disaccharides use α-D-glucose as the monomer unit and differ in the linking positions on the monosaccharide ring. As shown in Fig. 4b and f, the data indicated that the Rp–p values were 0.073 for sodium adducts vs. 5.46 for PBA derivatives for trehalose and nigerose, an increase by 75 times.
Disaccharides with the same linking positions but different monomer compositions include cellobiose and lactulose. As shown in Fig. 4c and g the data indicated that the Rp–p values were 0.59 for sodium adducts vs. 4.89 for PBA derivatives. The single-tagged PBA increased the Rp–p value of the disaccharide pair to about 8 times compared to the sodium adducts.
The other isomers, lactose and melibiose, are both linkage and anomeric isomers, which differ in linkage sites: 1,4 vs. 1,6 and β vs. α anomers. As shown in Fig. 4d, the ion mobilities of the sodium ion adducts were overlapped, and it was impossible to distinguish the two sugars. However, for the PBA derivatives, the Rp–p value was 6.07 as shown in Fig. 4h. The Rp–p value was 80 times higher than that of the sodium adducts. Sucrose and lactulose are 1,2-linked glucose–fructose and 1,4-linked galactose–fructose, respectively. As shown in Table 1, the Rp–p value was 0.96 for sodium adducts. For the PBA derivatives, the Rp–p value was found to be 3.95 which was more than 4 times higher than that of the sodium ion adducts.
Melibiose and trehalose are formed from 1,6-linked galactose–glucose and 1,1-linked glucose–glucose, respectively. In Fig. 5a–d, whether it was sodium ion adduct or single-tagged or double-tagged PBA derivatization, the separation effects of these two sugar isomers were not satisfactory in the positive ion mode. However, we found that the single-tagged and double-tagged PBA derivative ions showed excellent differentiations for these two disaccharide isomers in the negative ion mode (Fig. 5e and f). The Rp–p values were 1.95 and 2.35.
 | ||
| Fig. 5 Mobilograms of melibiose and trehalose: (a) sodium (m/z 365), PBA-tagged cation (b) m/z 430, (c), m/z 517 and (d) m/z 535, and PBA-tagged anion (e) m/z 428 and (f) m/z 515. | ||
Melibiose and trehalose were derivatized with single-tagged PBA and difficult to resolve in the cation mode for the main peaks with an Rp–p value of 0.12. However, melibiose had a secondary peak with a relatively high intensity. The Rp–p value of the secondary peak of melibiose and the main peak of trehalose reached 5.57, and a complete identification was achieved. As shown in Fig. 6b, lactose and lactulose displayed similar situations. The Rp–p value of the main peaks was 0.62. For the two minor peaks of lactose in reference to the main peak of lactulose, the Rp–p values were 1.34 and 2.35, respectively.
 | ||
| Fig. 6 (a) Mobilograms of PBA single-tagged melibiose and trehalose and (b) mobilograms of PBA single-tagged lactose and lactulose. | ||
In Table 1, we compare the effect of PBA tagging derivatization and sodium cationization on the Rp–p values of the disaccharide pairs. The Rp–p values of the disaccharide pairs were significantly improved in both positive and negative ion modes by using the PBA tagging method. For the single-tagged PBA derivatives in the cation mode, the Rp–p values increased by an average of about 12 times. Moreover, the Rp–p value for other complexes tagged with PBA had also been greatly enhanced: m/z 517 about 3.9 times, m/z 535 2.9 times, m/z 428 3.3 times and m/z 515 4 times. In Table S4,† we show the increase of the Rp–p values of all disaccharide complex pairs using PBA tagging. By using the data of single-tagged and double-tagged PBA in cation and anion modes, we can completely identify the disaccharides included in this study. Overall, the PBA tagging method displayed better separation effects for the disaccharides as shown in Table S2.† The maximum difference of the CCS values for the single-tagged PBA method was about 19.1 Å2, while the maximum CCS difference for the sodium ion method was only about 4.6 Å2.
Combining tandem mass spectrometry with the PBA derivatization method can better achieve the distinction of carbohydrate isomers. As shown in Fig. S5,† we measured the fragment ion yields of nine disaccharide PBA derivatives at different collision energies. As the collision energy increases, the ion signals increase in a sigmoid curve. It could be observed that the fragment ion yield curves of lactose, lactulose, sucrose and melibiose were very similar, and the number of fragment ions increased sharply at an activation energy of 15–30 eV. However, the fragment ion yield curves of nigerose, isomaltose, maltose and cellobiose were similar. At 30–50 eV activation energy, the number of fragment ions increased dramatically. Particularly for trehalose, with increasing activation energy, the fragment ion yield was a sigmoid curve. By comparing the yield of different fragment ions, supplementary data for the identification of PBA-derivatized sugar isomers were obtained.
Conclusions
We presented a powerful method for in situ ESI tagging of disaccharides using PBA as either a cationization or an anionization agent for gas-phase ion mobility investigations. TIMS-TOFMS studies of the tagged ions presented characteristic mobilograms for each of the disaccharides, while their masses were identical. The advantages of using this zwitterionic boronate are manifold: firstly, the in situ ESI derivatization method was convenient without chemical operations a priori. Secondly, the boronic ester derivatives acted like typical organic esters that showed resistance to dehydration rearrangements or ion detachment upon activation. More specific fragment ions could be produced for structural interpretations in MS/MS experiments. Thirdly, we showed here that the derivatized disaccharides displayed overall better isomer separations in the IMS experiments. In addition, the PBA reagent is a zwitterion in aqueous solutions allowing both cation and anion formations in in situ ESI. The formation of the sugar derivatives appeared to be stereoselective as in the solutions. However, the rapid ion formation kinetics in ESI might compete with the reversible covalent bonding equilibrium of the boronic ester formation in the sample solution. Finally, the in situ ESI derivatization with the PBA method is general in scope, allowing gas-phase ion studies of several mono-, di-, and trisaccharides. The detailed studies of the stereoselectivity in boronic ester formation and the structure identification of isomeric sugar ions from IMS and triple quadrupole MS2 studies are forthcoming.Conflicts of interest
There are no conflicts to declare.Acknowledgements
This work was supported by the Key Research and Development Program of Zhejiang Province of China (Grant No. 2020C03064) and the Science and Technology Major Project of Ningbo (Grant No. 2018B10075).Notes and references
- J. Hofmann, H. S. Hahm, P. H. Seeberger and K. Pagel, Nature, 2015, 526, 241–244 CrossRef CAS.
- J. C. May and J. A. McLean, Anal. Chem., 2015, 87, 1422–1436 CrossRef CAS.
- A. Garabedian, P. Benigni, C. E. Ramirez, E. S. Baker, T. Liu, R. D. Smith and F. Fernandez-Lima, J. Am. Soc. Mass Spectrom., 2018, 29, 817–826 CrossRef CAS.
- F. Lanucara, S. W. Holman, C. J. Gray and C. E. Eyers, Nat. Chem., 2014, 6, 281–294 CrossRef CAS.
- F. Fernandez-Lima, D. A. Kaplan, J. Suetering and M. A. Park, Int. J. Ion Mobility Spectrom., 2011, 14, 93–98 CrossRef.
- F. Meier, S. Beck, N. Grassl, M. Lubeck, M. A. Park, O. Raether and M. Mann, J. Proteome Res., 2015, 14, 5378–5387 CrossRef CAS.
- J. N. Dodds and E. S. Baker, J. Am. Soc. Mass Spectrom., 2019, 30, 2185–2195 CrossRef CAS.
- K. Giles, J. Ujma, J. Wildgoose, S. Pringle, K. Richardson, D. Langridge and M. Green, Anal. Chem., 2019, 91, 8564–8573 CrossRef CAS.
- J. Ujma, D. Ropartz, K. Giles, K. Richardson, D. Langridge, J. Wildgoose, M. Green and S. Pringle, J. Am. Soc. Mass Spectrom., 2019, 30, 1028–1037 CrossRef CAS.
- D. Ropartz, M. Fanuel, J. Ujma, M. Palmer, K. Giles and H. Rogniaux, Anal. Chem., 2019, 91, 12030–12037 CrossRef CAS.
- K. R. McKenna, L. Li, A. G. Baker, J. Ujma, R. Krishnamurthy, C. L. Liotta and F. M. Fernández, Analyst, 2019, 144, 7220–7226 RSC.
- M. E. Ridgeway, M. Lubeck, J. Jordens, M. Mann and M. A. Park, Int. J. Mass Spectrom., 2018, 425, 22–35 CrossRef CAS.
- J. Hofmann and K. Pagel, Angew. Chem., Int. Ed., 2017, 56, 8342–8349 CrossRef CAS.
- M. T. Campbell, D. Chen and G. L. Glish, Anal. Chem., 2018, 90, 2048–2054 CrossRef CAS.
- M. T. Campbell, D. Chen, N. J. Wallbillich and G. L. Glish, Anal. Chem., 2017, 89, 10504–10510 CrossRef CAS.
- J. Liu, V. Kisonen, S. Willfor, C. Xu and F. Vilaplana, J. Chromatogr. A, 2016, 1463, 110–120 CrossRef CAS.
- R. Kubinec, P. Kotora, V. Ferenczy, J. Blasko, P. Podolec, A. Hengerics Szabo, D. Behulova, V. Bierhanzl, R. Cabala, S. Stuchlik, W. Filipiak and N. M. Thang, J. Sep. Sci., 2018, 41, 449–458 CrossRef CAS.
- J. M. Rabus, M. T. Abutokaikah, R. T. Ross and B. J. Bythell, Phys. Chem. Chem. Phys., 2017, 19, 25643–25652 RSC.
- W. Qi, Y. Wang, Y. Cao, Y. Cao, Q. Guan, T. Sun, L. Zhang and Y. Guo, Anal. Chem., 2020, 92, 8644–8648 CrossRef CAS.
- S. Guan, M. R. Armbruster, T. Huang, J. L. Edwards and B. J. Bythell, Anal. Chem., 2020, 92, 9305–9311 CrossRef CAS.
- B. J. Bythell, M. T. Abutokaikah, A. R. Wagoner, S. Guan and J. M. Rabus, J. Am. Soc. Mass Spectrom., 2017, 28, 688–703 CrossRef CAS.
- M. T. Abutokaikah, J. W. Frye, J. Tschampel, J. M. Rabus and B. J. Bythell, J. Am. Soc. Mass Spectrom., 2018, 29, 1627–1637 CrossRef CAS.
- B. J. Bythell, J. M. Rabus, A. R. Wagoner, M. T. Abutokaikah and P. Maitre, J. Am. Soc. Mass Spectrom., 2018, 29, 2380–2393 CrossRef CAS.
- Y. Huang and E. D. Dodds, Anal. Chem., 2013, 85, 9728–9735 CrossRef CAS.
- C. A. McClary and M. S. Taylor, Carbohydr. Res., 2013, 381, 112–122 CrossRef CAS.
- H. Yang, L. Shi, X. Zhuang, R. Su, D. Wan, F. Song, J. Li and S. Liu, Sci. Rep., 2016, 6, 28079 CrossRef CAS.
- R. Nishiyabu, Y. Kubo, T. D. James and J. S. Fossey, Chem. Commun., 2011, 47, 1124–1150 RSC.
- L. S. Fenn and J. A. McLean, Chem. Commun., 2008, 43, 5505–5507 RSC.
- R. S. Mancini, J. B. Lee and M. S. Taylor, Org. Biomol. Chem., 2016, 15, 132–143 RSC.
- L. Li, K. R. McKenna, Z. Li, M. Yadav, R. Krishnamurthy, C. L. Liotta and F. M. Fernández, Analyst, 2018, 143, 949–955 RSC.
- S. Boduroglu, J. M. El Khoury, D. Venkat Reddy, P. L. Rinaldi and J. Hu, Bioorg. Med. Chem. Lett., 2005, 15, 3974–3977 CrossRef CAS.
- J. Hu, PCT IntWO2006050164A120060511, 2006 Search PubMed.
- J. Hu, Y. Bu, Z. Shao and Y. Shao, 67th ASMS Conference on Mass Spectrometry and Allied Topics, Atlanta, GA, United States, 2019.
- L. Lei and J. Hu, 68th ASMS Conference on Mass Spectrometry and Allied Topics, ASMS 2020 Reboot Online Program, 2020.
- R. Perez-Miguez, B. Bruyneel, M. Castro-Puyana, M. L. Marina, G. W. Somsen and E. Dominguez-Vega, Anal. Chem., 2019, 91, 3277–3285 CrossRef CAS.
- S. H. Kim, K. R. Betty and F. W. Karasek, Anal. Chem., 1978, 50, 2006–2012 CrossRef CAS.
- G. A. Eiceman, E. G. Nazarov and J. A. Stone, Anal. Chim. Acta, 2003, 493, 185–194 CrossRef CAS.
- M. Tabrizchi, Appl. Spectrosc., 2001, 55, 1653–1659 CrossRef CAS.
- G. E. Spangler and C. I. Collins, Anal. Chem., 1975, 47, 403–407 CrossRef CAS.
- H. E. Revercomb and E. A. Mason, Anal. Chem., 2002, 47, 970–983 CrossRef.
- W. F. Siems, C. Wu, E. E. Tarver, H. H. Hill Jr., P. R. Larsen and D. G. McMinn, Anal. Chem., 1994, 66, 4195–4201 CrossRef CAS.
- A. L. Rister, T. L. Martin and E. D. Dodds, J. Am. Soc. Mass Spectrom., 2019, 30, 248–255 CrossRef CAS.
- J. N. Dodds, J. C. May and J. A. McLean, Anal. Chem., 2016, 89, 952–959 CrossRef.
- C. Xie, Q. Wu, S. Zhang, C. Wang, W. Gao, J. Yu and K. Tang, Talanta, 2020, 211, 120719 CrossRef CAS.
- X. Zheng, N. A. Aly, Y. Zhou, K. T. Dupuis, A. Bilbao, V. L. Paurus, D. J. Orton, R. Wilson, S. H. Payne, R. D. Smith and E. S. Baker, Chem. Sci., 2017, 8, 7724–7736 RSC.
Footnote |
| † Electronic supplementary information (ESI) available. See DOI: 10.1039/d0an01677b |
| This journal is © The Royal Society of Chemistry 2021 |