DOI:
10.1039/D0RA05948J
(Paper)
RSC Adv., 2020,
10, 31748-31757
Boron Schiff bases derived from α-amino acids as nucleoli/cytoplasm cell-staining fluorescent probes in vitro†
Received
8th July 2020
, Accepted 24th July 2020
First published on 26th August 2020
Abstract
The size, shape, and number of nucleoli in a cell's nucleus might help to distinguish a malignant from a benign tumor. Cellular biology and histopathology often require better visualization to understand nucleoli-related processes, thus organelle-specific fluorescent markers are needed. Here, we report the design, synthesis, and fully chemo-photophysical characterization of fluorescent boron Schiff bases (BOSCHIBAs), derived from α-amino acids (i.e., phenylalanine, tyrosine and tryptophan), with nucleoli- and cytoplasm-specific staining in cells. It is the first time that Boron Schiff bases derived from α-amino acids act as notorious dual (nucleoli and cytoplasm) cell-staining fluorescent probes. The boron derivatives not only showed good photostability and acceptable quantum yields (∼5%) in solution, but also exhibited low cytotoxicity (>90% cell viability at 0.1 and 1 μg mL−1), which make them good candidates to be used in medical diagnosis.
1. Introduction
In recent years, the development of cellular probes has been important and essential to understand the diverse structures and functions of biological systems. Therefore, the identification the different organelles contained in the cell becomes very important.1,2 Fluorescence bioimaging (FBI) is an imaging technique by epifluorescence and confocal microscopy using a fluorescent dye that allows the location and visualization of individual specific organelles, both in vitro and ex vivo.3–5 Bioimaging techniques normally use specific fluorescent antibodies or fluorescent molecules to stain structures of interest. These methods are expensive, tedious, and normally the cells need to be manipulated before the staining process, so there is always the possibility of undesired structural changes. A more ideal stain agent should allow to be applied directly to cells in a culture to produce images that reflect the physiologic reality. Fluorescent dyes for FBI derived from transition metal and noble metal complexes have been extensively studied to label cell organelles of great importance such as plasmatic membrane, mitochondria, ribosomes, and nucleolus.2,6 Boron-dipyrromethene (BODIPY) have been widely investigated as fluorescent biomarkers however, fluorescent materials from the main group's elements are still quite scarce.7 Some BODIPY dyes can staining the Golgi's apparatus, lysosome, mitochondria, and nucleolus. Nevertheless, the nucleolus is quite poor studied, thereby, efforts and emphasis to design and synthesize a nucleolus specific fluorescent biomarker are needed. The nucleolus synthesizes, processes, and assembles the ribosomes, which are related to cell growth and proliferation, among other cellular processes.8,9 The study of nucleolus includes important parameters such as the shape, size, and number of the nucleoli per cell. Nucleoli's shape can differ from one cell type to another and that, along with its size, may help to distinguish a malignant from a benign tumor.10–12 However, the details of nucleolar dynamic mechanisms are still under investigation since, some decades ago, there was only a few commercial nucleolar stains such as SYTO™ RNA-select™ and Alexa Fluor® 488 (197234) for the study of nucleolus in live cells.13 Last year, some selective biomarkers for nucleoli have been reported. Junhua Yu et al. showed an europium complex as selective nucleoli dye (A) with interesting properties, such as long luminescence lifetime (0.3 ms) and large Stokes shift.14 In another report,15 iridium (B) and osmium–iridium (C) complexes showed nucleoli staining in live cells (Scheme 1). The heterobimetallic complex C exhibits particular optical features: the iridium moiety increases the luminescence due to interaction with RNA, whereas the osmium derivative exhibits near infrared luminescence.15 However, a notable disadvantage of these complexes is their high cost. On the other hand, nucleolus organic dyes such as hemicyanine dyes (D) exhibit fluorescence between 600 to 850 nm with maximum emission in the near-infrared region, being good candidates as FBI in live cell.16 Recently, Jin et al. reported cationic pyrrole and indole salts as fluorescent dyes (E) for cytoplasm and nucleolus staining showing good photostability.17 In addition, two indole-based (F and G)18,19 and a short series of pyridinium (H) compounds have been investigated as RNA fluorescence turn-on probes.20 We have developed new fluorescent multifunctional materials derived from Boron Schiff Bases (BOSCHIBAs).21,22 However, the fluorescent BOSCHIBAs are sparse as fluorescent cellular probes. In previous works, we reported the first fluorescent probes derived from BOSHIBAs with application in cellular staining (Scheme 2).23–25 These probes, in contrast to those mentioned above, presented low cost, easy synthesis, and high quantum yields. Also, these materials can be prepared by multi-component synthesis through green synthesis and sustainable chemistry. However, these probes are not selective for a specific organelle as they stain the cells from the plasmatic membrane through the cytoplasm. Therefore, the development of biogenic binding systems based in α-amino acids could be the key to selective staining of the nucleolus in the cell. The α-amino acids are an interesting group of bioactive molecules as the incorporation of chirality in the ligating system enhances distribution, interaction with receptor, and cellular uptake of compounds.26,27 To the best of our knowledge, this is the first report of the use of biogenic BOSCHIBAs as nucleoli/cytoplasmatic markers in live cells.
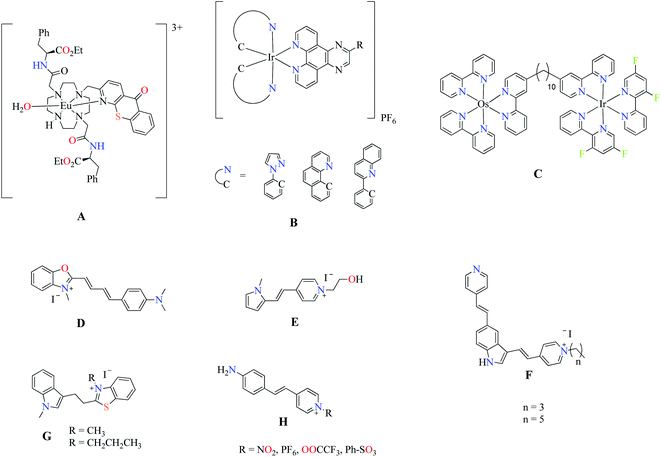 |
| | Scheme 1 Fluorescent dyes for in vitro nucleoli staining. | |
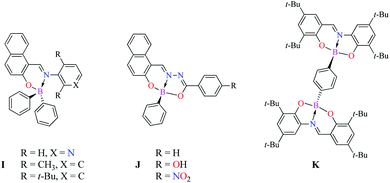 |
| | Scheme 2 Mono and binuclear Boron Schiff bases. | |
2. Experimental section
2.1 General remarks
All precursor materials were procured from Aldrich Chemical Company. Solvents were used without further purification. Melting points were confirmed by Electrothermal Mel-Temp apparatus. UV spectra were obtained with a Shimadzu 2401 PC UV/VIS spectrophotometer and emission measurements were performed on a Fluorolog-3 fluorescence spectrometer. 1H NMR (400.00 MHz), 13C (100.00 MHz) and 11B (96.29 MHz) spectra were recorded using equipment Bruker advance DPX 400. All NMR spectra were performed in dimethyl sulfoxide deuterated ((CD3)2SO) as solvent. The 11B NMR shifts are corresponding to external BF3·OEt2, while 1H and 13C NMR shifts are referenced with respect to (CH3)4Si. Chemical shifts are given parts per million (ppm) downfield from the reference, and all coupling constants (J) are reported in Hertz (Hz). High resolution mass spectra were acquired by LC/MSD TOF on an Agilent Technologies instrument with APCI as chemical ionization in positive mode. Mass spectra were recorded on an AB Sciex API 2000™ LC/MS/MS System.
2.2 Crystal structure analysis
The X-ray crystallography data for 3a (CCDC: 2002773) were measured at 100(2) K on a Bruker D8 Quest with a Photon 100 CMOS detector equipped with an Oxford Cryosystems 700 series cooler, a Triumph monochromator, and a Mo Kα fine-focus sealed tube (λ = 0.71073 Å). Intensity data were processed by using the Bruker Apex II program suite. All the calculations for the structure determination were carried out using the SHELXTL package (version 6.14). Initial atomic positions were located by direct methods using XS, and the structures of the compounds were refined by the least-squares method using SHELXL. Absorption corrections were applied by using SADABS. All the non-hydrogen atoms were refined anisotropically. Hydrogen atoms were placed in idealized positions and refined as riding atoms with relative isotropic displacement parameters.
2.3 Synthesis of Schiff bases ligands 1–3 and BOSCHIBAs 1a–4a
(E)-2-((2-Hydroxy-1-naphthyl)methyleneamino)acetic acid (Lig1). A homogeneous mixture of 2-hydroxynaphthaldehyde (0.344 g, 2 mmol) with glycine (0.150 g, 2 mmol) in methanol was collected in an ultrasound bath for 30 min at 50 °C. The reaction mixture was slowly cooled at room temperature and the resulting material was filtrated and concentrated under partial vacuum. After, a small volume of hexane was added to give 0.433 g (chemical yield: 91.03%) of Lig1 as orange solid. Mp: 210–214 °C. MS m/z: calcd for [(C13H11NO3 + H)+]: 230.2309; exp.: 230.1 amu.
(E)-2-(((2-Hydroxynaphthalen-1-yl)methylene)amino)-3-(1H-indol-3-yl)propanoic acid (Lig2). Preparation of Lig2 was accomplished like that of Lig1 from 2-hydroxynaphthaldehyde (0.344 g, 2 mmol) and L-tryptophan (0.408 g, 2 mmol). The product was obtained as light yellow solid with a yield of 89.5% (0.321 g); mp: 162–164 °C. 1H NMR (400.13 MHz, (CD3)2SO, 298 K): δ = 3.32 (dd, 1H, 3J = 14.8 Hz, 3J = 7.6 Hz, H14′), 3.45 (dd, 1H, 3J = 15.2 Hz, 3J = 4.8 Hz, H14), 4.77 [dd, 1H, 3J = 7.6 Hz, 3J = 4.8 Hz, H13], 6.71 (d, 1H, 3J = 9.2 Hz, H3), 6.98 (t, 1H, 3J = 7.2 Hz, H20), 7.07 (t, 1H, 3J = 6.8 Hz, H19), 7.16 (s, 1H, H16), 7.18 (t, 1H, 3J = 7.6 Hz, H6), 7.33 (d, 1H, 3J = 8.0 Hz, H18), 7.35 (t, 1H, 3J = 7.2 Hz, H7), 7.61 (m, 2H, H21–H5), 7.71 (d, 1H, 3J = 9.6 Hz, H2), 7.72 (d, 1H, 3J = 8.4 Hz, H8), 8.83 [s, 1H, H11], 10.93 (s, 1H, –NH), 14.17 (s, 1H, –OH) ppm. 13C NMR (100.61 MHz, CDCl3, 298 K): δ = 29.84 (C14), 64.36 (C13), 106.42 (C9), 109.04 (C15), 111.89 (C18), 118.83 (C21), 118.86 (C8), 119.03 (C20), 121.56 (C19), 122.83 (C6), 124.72 (C16), 125.47 (C3), 125.82 (C4), 127.52 (C22), 128.34 (C7), 129.34 (C5), 134.54 (C10), 136.59 (C17), 137.65 (C2), 159.09 (C11), 172.57 (C1), 176.86 (C12) ppm. COSY correlations (δH/δH): δ = 3.32/3.45 (H14′/H14), 3.32/4.77 (H14′/H13), 3.45/4.77 (H14/H13), 6.71/7.71 (H3/H2), 6.98/7.61 (H20/H21), 7.07/7.33 (H19/H18), 7.16/10.93 (H16/NH), 7.18/7.61 (H6/H5), 7.35/7.72 (H7/H8). HSQC correlations (δH/δC): δ = 3.32/29.84 (H14′/C14), 3.45/29.84 (H14/C14), 4.77/64.36 (H13/C13), 6.71/125.47 (H3/C3), 7.16/124.72 (H16/C16), 7.18/122.83 (H6/C6), 7.61/129.34 (H5/C5), 7.71/137.65 (H2/C2), 7.72/118.86 (H8/C8), 8.83/159.09 (H11/C11). HRMS (APCI/TOF-Q) m/z: calcd for [C22H18N2O3 + H]+ 359.1396; found 359.139019, error: 0.094347 ppm.
(E)-2-(((2-Hydroxynaphthalen-1-yl)methylene)amino)-3-phenylpropanoic acid (Lig3). Preparation of Lig3 was accomplished like that of Lig1 from 2-hydroxynaphthaldehyde (0.334 g, 2 mmol) and L-phenylalanine (0.330 g, 2 mmol). The product was obtained as light yellow solid with a yield of 92% (0.293 g); mp: 150–153 °C; 1H NMR (400.13 MHz, CDCl3, 298 K): δ = 3.17 (dd, 1H, J = 14.0 Hz, J = 8.4 Hz, H14′), 3.35 (dd, 1H, J = 14.0 Hz, J = 5.2 Hz, H14), 4.72 [dd, 1H, J = 8.4 Hz, J = 4.8 Hz, H13], 6.75 (d, 1H, J = 9.6 Hz, H3), 7.02 (d, 2H, J = 8.4 Hz, H17), 7.16–7.23 (m, 2H, H18–H6), 7.23–7.30 (m, 4H, H16–H17), 7.40 (t, 1H, J = 7.2 Hz, H7), 7.64 (d, 1H, J = 7.6 Hz, H5), 7.75 (d, 1H, J = 9.6 Hz, H2), 7.86 (d, 1H, J = 8.4 Hz, H8), 8.89 [s, 1H, H11], 14.22 (s, 1H, –OH) ppm. 13C NMR (100.61 MHz, CDCl3, 298 K): δ = 39.41 (C14), 65.76 (C13), 106.64 (C9), 119.01 (C8), 122.95 (C6), 124.99 (C3), 126.00 (C4), 127.19 (C18), 128.37 (C7), 128.83 (C17), 129.37 (C5), 129.93 (C16), 134.38 (C10), 137.03 (C15), 137.42 (C2), 159.76 (C11), 172.17 (C1), 175.63 (C12) ppm. COSY correlations (δH/δH): δ = 3.17/3.35 (H14′/H14), 3.17/4.72 (H14′/H13), 3.35/4.72 (H14/H13), 6.75/7.74 (H3/H2), 7.19/7.64 (H6/H5), 7.19/7.40 (H6/H7), 7.40/7.86 (H7/H8). HSQC correlations (δH/δC): δ = 3.17/39.41 (H14′/C14), 3.35/39.41 (H14/C14), 4.72/65.76 (H13/C13), 6.75/124.99 (H3/C3), 7.18/127.19 (H18/C18), 7.19/122.95 (H6/C6), 7.25/128.83 (H17/C17), 7.26/129.93 (H16/C16), 7.40/128.37 (H7/C7) 7.64/129.37 (H5/C5), 7.74/137.42 (H2/C2), 7.86/119.01 (H8/C8), 8.89/159.76 (H11/C11). HRMS (APCI/TOF-Q) m/z: calcd for [C20H17NO3 + H]+ 320.1288; found 320.128120, error: 1.018127 ppm.
(E)-2-(((2-((Diphenylboryl)oxy)naphthyl)methyleneamino)acetic acid 1a). Lig1 (0.229 g, 1 mmol) was collocate in a glass beaker with 20 mL of MeOH. After dispersion, diphenylboronic acid (0.218 g, 1.2 mmol) was added to the solution and stirring continued for 1 hour. A clear solution was obtained, and the excess solvent was evaporated under vacuum, followed by hexane washes. The product was obtained as light yellow solid with a yield of 91.6% (0.360 g); mp: 210–212 °C. 1H NMR (400.13 MHz, CDCl3, 298 K): δ = 4.40 (s, 1H, H13), 6.96–7.06 (m, 7H, H3, H16, H16′, H16′′, H16′′′, H17, H17′), 7.25 (t, 1H, J = 7.2 Hz, H6), 7.28 (m, 4H, H15, H15′, H15′′, H15′′′), 7.44 (t, 1H, J = 7.2 Hz, H7), 7.70 (d, 1H, J = 8.0 Hz, H5), 7.95 (d, 1H, J = 9.2 Hz, H2), 8.01 (d, 1H, J = 8.4 Hz, H8), 9.29 (s, 1H, H11). 13C NMR (100.61 MHz, CDCl3, 298 K): δ = 54.61 (C13), 110.29 (C9), 119.64 (C8), 121.13 (C3), 123.96 (C6), 126.17 (C17), 126.80 (C16), 127.59 (C4), 128.80 (C7), 129.24 (C5), 132.48 (C10), 133.10 (C15), 139.28 (C2), 163.03 (C11), 163.98 (C1), 168.34 (C12) ppm. 11B NMR (128 MHz, CDCl3, 298 K): δ = 4.80 ppm. MS m/z: calcd for [C25H20BNO3 + H]+ 394.2490; found 394.2.
(E)-2-(((2-((Diphenylboryl)oxy)naphthalen-1-yl)methylene)amino)-3-(1H-indol-3-yl)propanoic acid (2a). Preparation of 2a was accomplished like that of 1a from Lig2 (0.358 g, 1 mmol) and diphenylboronic acid (0.218 g, 1.2 mmol). The product was obtained as light yellow solid with a yield of 95.2% (0.496 g), mp: 108–112 °C. 1H NMR (400.13 MHz, CDCl3, 298 K): δ = 3.25 (dd, 1H, J = 7.6 Hz, J = 14.4 Hz, H13), 3.53 (dd, 1H, J = 4.4 Hz, J = 14.8 Hz, H13), 4.86 (dd, 1H, J = 4.8 Hz, J = 7.6 Hz, H13), 6.89 (t, 1H, J = 7.2 Hz, H20) 7.05–7.18 (m, 6H, H3, H6, H19, H29, H29′, H30), 7.21–7.41 (m, 8H, H7, H8, H16, H18, H21, H25, H25′, H26), 7.43 (m, 2H, H28, H28′), 7.54 (m, 2H, H24, H24′), 7.79 (d, 1H, J = 8.0 Hz, H5), 8.04 (d, 1H, J = 8.8 Hz, H2), 8.94 (s, 1H, H11). 13C NMR (100.61 MHz, CDCl3, 298 K): δ = 29.71 (C14), 63.01 (C13), 108.45 (C17), 109.67 (C9), 111.36 (C18), 118.50 (C21), 119.19 (C20), 119.24 (C8), 120.95 (C3), 121.71 (C19), 123.77 (C16), 124.65 (C6), 126.12 (C30), 126.47 (C26), 126.89 (C29), 127.08 (C25), 127.51 (C4), 128.55 (C7), 129.08 (C5), 132.38 (C10), 132.92 (C28), 133.67 (C24), 136.04 (C15), 139.04 (C2), 160.29 (C11), 163.40 (C1), 171.12 (C12) ppm. 11B NMR (128 MHz, CDCl3, 298 K): δ = 5.04 ppm. MS m/z: calcd for [C34H27BN2O3 + H]+ 523.4110; found 523.2.
(E)-2-(((2-((Diphenylboryl)oxy)naphthalen-1-yl)methylene)amino)-3-phenylpropanoic acid (3a). Preparation of 3a was accomplished like that of 1a from Lig3 (0.319 g, 1 mmol) and diphenylboronic acid (0.218 g, 1.2 mmol). The product was obtained as yellow solid with a yield of 93.2% (0.450 g); mp: 112–115 °C. 1H NMR (400.13 MHz, CDCl3, 298 K): δ = 2.95 (dd, 1H, J = 8.40 Hz, J = 13.6 Hz, H14′), 3.13 (dd, 1H, J = 4.80 Hz, J = 13.6 Hz, H14), 4.55 (dd, 1H, J = 5.20 Hz, J = 8.4 Hz, H13), 6.83 (m, 2H, H16, H16′), 6.94–7.04 (m, 5H, H3, H22, H25, H25′, H26), 7.08–7.16 (m, 5H, H17, H17′, H18, H21, H21′), 7.23 (t, 1H, J = 7.20 Hz, H6), 7.27 (m, 2H, H24, H24′), 7.35 (m, 2H, H20, H20′), 7.41 (t, 1H, J = 7.2 Hz, H7), 7.67 (m, 2H, H5, H8), 7.93 (d, 1H, J = 9.20 Hz, H2), 9.06 (s, 1H, H11). 13C NMR (100.61 MHz, CDCl3, 298 K): δ = 48.79 (C14), 63.86 (C13), 109.91 (C9), 119.49 (C8), 121.03 (C3), 124.00 (C6), 126.15 (C26), 126.54 (C22), 126.91 (C25), 127.11 (C21), 127.30 (C18), 127.61 (C4), 128.65 (C17), 128.80 (C7), 129.24 (C5), 129.55 (C16), 132.36 (C10), 132.79 (C24), 133.80 (C20), 1372 (C15), 139.36 (C2), 160.25 (C11), 163.65 (C1), 170.87 (C12) ppm. 11B NMR (128 MHz, CDCl3, 298 K): δ = 5.08 ppm. MS m/z: calcd for [C32H26BNO3 + H]+ 484.3740; found 484.3.
(E)-4-(((2-((Diphenylboryl)oxy)naphthalen-1-yl)methylene)amino)phenol (4a). A homogeneous mixture of 2-hydroxynaphthaldehyde (0.5 g, 2.9 mmol) with 4-aminophenol (0.317 g, 2.9 mmol) and diphenylboronic acid (1.307 g, 5.80 mmol) in acetonitrile were heated under reflux for 48 h. The reaction mixture was slowly cooled to room temperature, and the precipitated was filtrated and washed with hexane. The resulting product was obtained as a yellow solid with yield of 85% (2.47 mmol, 1.05 g); FTIR νmax cm−1: 1627 (C![[double bond, length as m-dash]](https://www.rsc.org/images/entities/char_e001.gif) N), 830 (C–HAr), 1345 (C
N), 830 (C–HAr), 1345 (C![[double bond, length as m-dash]](https://www.rsc.org/images/entities/char_e001.gif) CAr), 703 (O–B); 1H NMR (300.13 MHz, ((CD3)2CO)) δ: 6.68 (d, 2H, 3J = 9 Hz, H-14, H-13), 7.13 (m, 7H, H-3, 4H-m, 2H-p), 7.33 (d, 2H, 3J = 15 Hz, H-13, H-17), 7.39 (t, 1H, 3J = 15 Hz, H-7), 7.46 (d, 4H, 3J = 6 Hz, 4H-o), 7.58 (t, 1H, 3J = 15 Hz, H-8), 7.83 (d, 1H, 3J = 6.0 Hz, H-6), 8.05 (d, 1H, 3J = 9 Hz, H-4), 8.33 (d, 1H, 3J = 9.0 Hz, H-9), 8.66 (s, 1H, C15–OH), 9.37 (s, 1H, H-11) ppm; 13C NMR (75.47 MHz, ((CD3)2CO)) δ: 111.81 (C-1), 114.92 (C-14, C-16), 120.34 (C-9), 121.00 (C-13, C-17), 124.04 (C-3), 125.46 (C-7), 125.89 (C-5), 126.04 (C-m), 126.60 (C-p), 128.75 (C-8), 129.15 (C-6), 132.59 (C-10), 133.32 (C-4), 133.77 (C-o), 138.67 (C-12), 139.27 (C-i), 156.95 (C-11), 158.03 (C-15), 164.01 (C-2) ppm; 11B{1H} NMR (96.29 MHz, ((CD3)2CO)) δ: 8.89 ppm; HRMS (APCI/TOF-Q) m/z: calcd for [(C34H27N2O3B + H)+]: 428.1700; exp.: 428.1819 amu.
CAr), 703 (O–B); 1H NMR (300.13 MHz, ((CD3)2CO)) δ: 6.68 (d, 2H, 3J = 9 Hz, H-14, H-13), 7.13 (m, 7H, H-3, 4H-m, 2H-p), 7.33 (d, 2H, 3J = 15 Hz, H-13, H-17), 7.39 (t, 1H, 3J = 15 Hz, H-7), 7.46 (d, 4H, 3J = 6 Hz, 4H-o), 7.58 (t, 1H, 3J = 15 Hz, H-8), 7.83 (d, 1H, 3J = 6.0 Hz, H-6), 8.05 (d, 1H, 3J = 9 Hz, H-4), 8.33 (d, 1H, 3J = 9.0 Hz, H-9), 8.66 (s, 1H, C15–OH), 9.37 (s, 1H, H-11) ppm; 13C NMR (75.47 MHz, ((CD3)2CO)) δ: 111.81 (C-1), 114.92 (C-14, C-16), 120.34 (C-9), 121.00 (C-13, C-17), 124.04 (C-3), 125.46 (C-7), 125.89 (C-5), 126.04 (C-m), 126.60 (C-p), 128.75 (C-8), 129.15 (C-6), 132.59 (C-10), 133.32 (C-4), 133.77 (C-o), 138.67 (C-12), 139.27 (C-i), 156.95 (C-11), 158.03 (C-15), 164.01 (C-2) ppm; 11B{1H} NMR (96.29 MHz, ((CD3)2CO)) δ: 8.89 ppm; HRMS (APCI/TOF-Q) m/z: calcd for [(C34H27N2O3B + H)+]: 428.1700; exp.: 428.1819 amu.
2.4 Photophysical characterization of BOSCHIBAS 1a–4a and their Schiff bases
UV-Vis absorption spectra were measured on a Shimadzu 2401 PC spectrophotometer. The emission spectra were recorded with a PerkinElmer LS 50B spectrofluorometer, by exciting 10 nm below the longer wavelength absorption band. Fluorescence quantum yields in solution (ΦF) were determined according to the procedure reported in the literature28 and using quinine sulfate in H2SO4 0.1 M (ΦF = 0.54 at 310 nm) as the standard. Temperature was regulated at 25.0 ± 0.5 °C using water circulating bath. Three solutions with absorbance at the excitation wavelength lower than 0.1 were analyzed for each sample and the ΦF was averaged. ΦF measurements were measured by the relative method and the quantum yield of the unknown, Φx, is calculated according to the following equation:| |
 | (1) |
where ΦR is the quantum yield of the standard, A is the absorbance of the solution, E is the corrected emission intensity, I is the relative intensity of the exciting light and n is the average refractive index of the solution. Subscripts R and X refer to the reference and unknown compound, respectively.
2.5 Photostability testing and hydrolytic test
With the purpose to perform stability assay, BOSCHIBAs 1a–4a were adjusted to give absorption of 0.5 au at the short wavelength absorption band. The samples were illuminated with 1.2 mW cm−2 (365 nm) for 60 min with interval of 10 min at room temperature with air atmosphere. Each absorption spectrum was measured by using a PerkinElmer Lambda 365 UV/Vis spectrophotometer in the region of 190–700 nm. Likewise, the stability in aqueous solutions at 1% v/v of DMSO was evaluated under the same experimental condition without photoirradiation. Both analyses are critical to assess how stable the dye is during imaging applications discussed later.
2.6 In vitro biocompatibility reassuring assay
B16F10 murine melanoma cells (ATCC, CRL-6475, Manassas, VA) were used to determine the cytotoxic effects of BOSCHIBAs 1a–3a. Melanoma cells were maintained in GIBCO-DMEM/F12 culture media supplemented with 10% FBS and 1× antibiotic-antimitotic (all from ThermoFisher Scientific, Waltham, MA), at 37 °C in a 5% CO2 atmosphere. Cells assays were plated in 96-wells plates at a cell density of 2000 cells per well in 100 μL of media and let them undisturbed overnight before the treatments were added. Compounds were added at concentrations of 0.1, 1, 2.5, 5, and 10 mg mL−1. Forty-eight h later 10 μl of alamarBlue® (Biosource Invitrogen Life Technologies, Carlsbad, CA) were added to each well to determine cell viability following manufacturer's instructions.
2.7 In vitro bioimaging properties
To assess the BOSCHIBA's capabilities to label cells in vitro, B16F10 melanoma cells were plated at densities of 5 × 10⁴ cells per well in 500 μL of growth medium on coverslips in 12 wells plates. After overnight incubation, 10 μg mL−1 of each compound were added to each well and 2 h later coverslips were mounted with Vectashield (Vector Laboratories, Inc. Burlingame, CA) and analyzed by confocal laser scanning microscopy in a Leica TCS SP5 Confocal System at excitation wavelength of 405 nm and emission of 420–550 nm, or excitation of 488 nm and emission of 500–600 nm. DMSO treated cells were used as a control to determine endogenous fluorescence.
3. Results and discussion
3.1 Synthesis
The BOSCHIBAs 1a–3a were obtained by condensation of diphenylboronic acid (generated in situ) with the corresponding α-amino acid Schiff base ligands Lig1–3 (Scheme 3). In order to carry out a comparative study of the influence of α-amino acids to enhance fluorescent staining in cells by confocal fluorescence microscopy as well as their photophysical and biological properties, the BOSCHIBA 4a was also prepared by the multi-component condensation reaction (3-MCR) between the 2-hydroxy-naphthaldehyde, diphenylboronic acid and the corresponding amine. It is important to mention, into the procedure of diphenylboronic acid synthesis was avoid the diethyl ether as solvent and the reaction time has been reduced. As a general remark, the Schiff base condensation reactions demonstrated to be a low cost, simple, faster, and reproducible synthetic route with high economy and low E values (see ESI†).
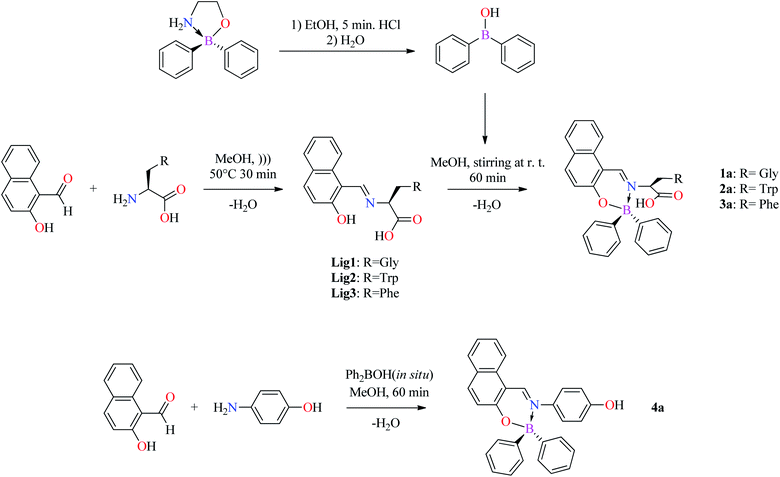 |
| | Scheme 3 Synthesis of Schiff bases by ultrasound Lig1–3 and BOSCHIBAs 1a–4a. | |
3.2 Spectroscopic and spectrometric characterization
A reliable evidence of the N → B coordination bond was 11B NMR spectra, with one broad signal in the range from 4.80 to 8.89 ppm for all compounds, indicative of a tetracoordinated boron atom.29 On the other hand, the mass spectrometry analysis in positive ion mode for BOSCHIBAs 1a–4a confirms the molecular structural integrity (1a: 394.2, 2a: 523.2, 3a: 484.3, and 4a: 428.181 amu), and showed in all cases that the base peak corresponds to first fragmentation of molecular ion, resulting from the loss of a phenyl ring (see ESI†). Selected spectroscopic and spectrometric data of 1a–4a and the α-amino acid Schiff bases 1–3 are given in the Table 1.
Table 1 Main spectral data of 1H, 13C, and 11B NMR (ppm), and HRMS (m/z) of BOSCHIBAs 1a–4a and the α-amino acid Schiff bases Lig1–3
| Comp. |
1H |
13C |
11B N → B |
MS m/z |
| H-11 |
H-13 |
H-14(H14′) |
C-12 |
C-11 |
C-13 |
C-14 |
| Lig1 |
— |
— |
— |
— |
— |
— |
— |
— |
230.1 |
| Lig2 |
8.83 |
4.77 |
3.45(3.32) |
176.86 |
159.09 |
64.36 |
29.84 |
— |
359.1390 |
| Lig3 |
8.89 |
4.72 |
3.35(3.17) |
175.63 |
159.76 |
65.76 |
39.41 |
— |
320.1281 |
| 1a |
9.29 |
4.40 |
— |
168.34 |
163.03 |
54.61 |
— |
4.80 |
394.2 |
| 2a |
8.94 |
4.86 |
3.53(3.25) |
171.12 |
160.29 |
63.01 |
29.71 |
5.04 |
523.2 |
| 3a |
9.06 |
4.55 |
3.13(2.95) |
170.87 |
160.25 |
63.86 |
48.79 |
5.08 |
484.3 |
| 4a |
9.37 |
— |
— |
— |
— |
— |
— |
8.89 |
428.1819 |
3.3 X-ray structure analysis
BOSCHIBA 3a was crystallized by slow evaporation in methanol giving diffraction-quality crystals like green blocks for solving by X-ray diffraction. The molecular structure obtained in an easy two-step synthesis is represented by using the thermal ellipsoid plot (Fig. 1) while data collection and refinement parameters are summarized in the Table 2. BOSCHIBA 3a belongs to the monoclinic space group P21/n (Table 2) and the crystal structure reveals that contain a four-coordinate boron atom and a fused heterocyclic six-membered ring with N → B coordination bond lengths of 1.495 (2), which is similar to those previously reported.30 Bond angles in the range from 1.495(2) to 1.631(2) indicate that boron adopts the normal tetrahedral molecular geometry typical for the B(III). In addition, the boron atom shows a strong dative bond with the nitrogen atom corroborated by a tetrahedral character equal to 94.35.31 Likewise, the bond length of B–O is 1.495(1) Å which is comparable to the organoboron compounds previously reported32,33 while imine bond length for 3a is 1.290(1), a value closer to that single bonds attributed to the formation of new N → B coordination bond. Crystal structure showed the formation of a six-member dimer joined by two hydrogen bonds between the uncoordinated carboxylic acid groups of two symmetry-related molecules, with a distance D–H⋯A of 1.82(3) Å (Fig. 2), dimer formation between carboxylic acids has been widely observed before.34 The boron atom is out of the plane (O1–C1–C10–C11–N1) with a distance 0.571 Å and the heterocycle show half chair conformation (Fig. 3), this behavior might affect the photophysical properties such as boron compounds previously reported.35
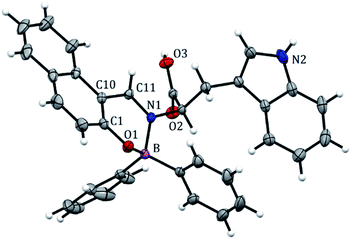 |
| | Fig. 1 Crystal structure of BOSCHIBA 3a. Anisotropic displacement parameters are depicted at the 30% probability level. Hydrogen atoms were omitted for clarity. Distances: B(1)–N(1) 1.631, B(1)–O(1) 1.495, B(1)–C(17) 1.614, B(1)–C(23) 1.618, C(11)–N(1) 1.299 Å. Bond angles: C(11)–B(1)–N(1) 118.64, O(1)–B(1)–N(1) 104.22, O(1)–B(1)–C(17) 110.89, N(1)–B(1)–C(23) 105.98, C(2)–C(11)–N(1) 122.85, C(11)–N(1)–C(12) 119.38°. | |
Table 2 Crystallography data collection for BOSCHIBA 3a
| Empirical formula |
C34H27BN2O3 |
| Formula weight |
522.38 |
| Wavelength |
0.71073 |
| Crystal size |
0.20 × 0.18 × 0.10 |
| Crystal system |
Monoclinic |
| Space group |
P21/n |
| a, [Å] |
16.587(9) |
| b, [Å] |
10.184(5) |
| c, [Å] |
17.383(9) |
| α, [°] |
90.00° |
| β, [°] |
108.815° (18) |
| γ, [°] |
90.00° |
| V, [Å3] |
2779.29 |
| Z |
4 |
| ρcalc, mg cm−3 |
1.248 |
| μ, mm−1 |
0.790 |
| 2θ range for data collection |
2.352–28.741° |
| No. of reflns collected |
91![[thin space (1/6-em)]](https://www.rsc.org/images/entities/char_2009.gif) 199 199 |
| No. of indep reflns |
7190 |
| [Rint] |
0.1172 |
| Goodness of fit |
1.540 |
| R1, wR2 (I > 2σ(I)) |
0.0587; 0.1194 |
| R1, wR2 (all data) |
0.1033; 0.1374 |
| Δρmin (e Å−3) |
−1.869 |
| Δρmax (e Å−3) |
1.967 |
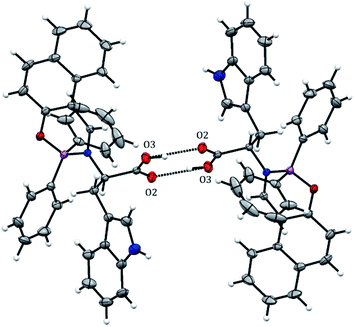 |
| | Fig. 2 Intermolecular hydrogen interactions in BOSCHIBA 3a. | |
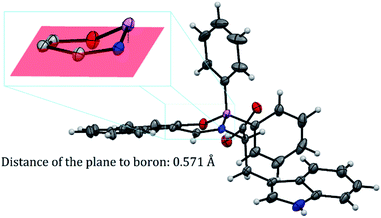 |
| | Fig. 3 Boron out of the plane in half chair conformation. | |
3.4 Photophysical properties
To evaluate the bioimaging properties of BOSCHIBAs 1a–4a and their corresponding α-amino acid Schiff bases 1–3, the photophysical properties were studied in methanol (Table 3). Fig. 4 shows the UV/Vis absorption spectra of BOSCHIBAs 1a–3a, and (inset) their α-amino acid Schiff base 1–3. In general, all the BOSCHIBAs exhibit a main absorption broad band in the visible region with a maximum wavelength ranging between 403 to 410 nm attributed to the π–π electronic transitions through the molecule. Additionally, an UV band in the 326–330 range which could be associated to electronic transitions from underlying molecular orbital to LUMO is also observed. For the α-amino acid Schiff base 1–3, this same absorption band shows an excitonic feature with a vibrionic replica which is 20 nm shifted with respect to the (0,0) electronic transition.34 This behavior is not observed in 1a–4a, where a broad band appears, suggesting a better molecular order when the BOSCHIBAs are formed.
Table 3 Photophysical parameters of BOSCHIBAs 1a–4a and their α-amino acid Schiff base Lig1–3 in MeOH
| Comp. |
λabs [nm] |
ε × 104 [M−1 cm−1] |
λemi [nm] |
Δν [cm−1] |
Φ [%] |
| Lig1 |
401 (421) |
0.39 |
442 |
1129 |
1.34 |
| Lig2 |
401 (419) |
0.46 |
465 |
2361 |
1.36 |
| Lig3 |
402 (422) |
0.90 |
457 |
1815 |
1.36 |
| 1a |
329 (410) |
0.84 |
480 |
4292 |
4.50 |
| 2a |
329 (403) |
0.47 |
475 |
3761 |
4.19 |
| 3a |
330 (407) |
0.68 |
471 |
3339 |
1.63 |
| 4a |
327 (404) |
0.60 |
525 |
5705 |
3.16 |
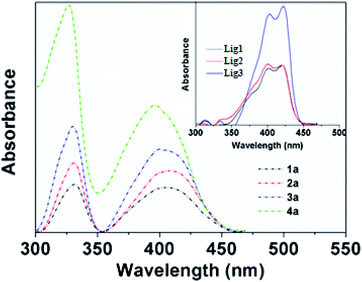 |
| | Fig. 4 Absorption spectra of BOSCHIBAS 1a–4a (short dash dot) and (inset) amino acid Schiff base Lig1–3 (solid lines) in methanol. | |
The fluorescence spectra of the BOSCHIBAs 1a–4a and the α-amino acid Schiff base 1–3 are shown in the Fig. 5. Compounds 1a–3a with aromatic α-amino acid segments show a broad blue emission bands in the 473–476 nm range without an apparent change in the fluorescence emission maximum with respect to the free α-amino acid Schiff bases 1–3 (inset). The systematic analysis of the photophysical parameters indicates that the incorporation of aromatic α-amino acid segments for the BOSCHIBAs 1a–3a increase the fluorescence quantum yield (ΦF) but restrict the fluorescence emission band in the blue visible region (see Table 1). On the contrary, 4a shows a broad band centered at 525 nm with a red shift of 52 nm with respect to BOSCHIBAs 1a–3a. This optical behavior can partly be explain considering that complexation with the boron atom affect the geometry in the excited state of the naphthylimine system when it is substituted with an electron donating group. A relevant aspect in the BOSCHIBAs series is that the emission can be tuned from the blue (1a–3a) to the green (4a) regions by changing from aromatic α-amino acid segments to electro donor groups. As a general remark, the ΦF is high for all BOSCHIBAs in comparison with the respective α-amino acid ligands, except 3a, that exhibits a moderate increase less than 0.3%.
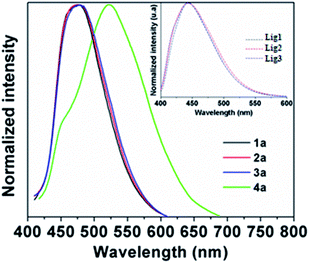 |
| | Fig. 5 Emission spectra of BOSCHIBAs 1a–4a and (inset) α-amino acid Schiff bases Lig1–3 in MeOH. | |
3.5 In vitro biocompatibility reassuring assay
Before applying compounds 1a–3a as staining dyes to produce imaging in live cells, we evaluated their cytotoxicity by using reassuring assay in a 0.1–10 μg mL−1 concentration range (Fig. 6). After the 24 h incubation with 0.1 and 1 μg mL−1 of BOSCHIBAs, the cellular viability is reduced approximately a 9%. A non-significant reduction of cell viability occurred when the concentration is increased to 2.5 μg mL−1 but when the concentration is increased to 5 mg mL−1, cell viabilities remains higher that 80%. Likewise, to the highest concentration of BOSCHIBAs, the cellular viabilities are conserved above 70%. These high viabilities could be partially attributed to structure design which includes three essential α-amino acids that our body cannot synthesize and therefore do not represent a threat to the cell.
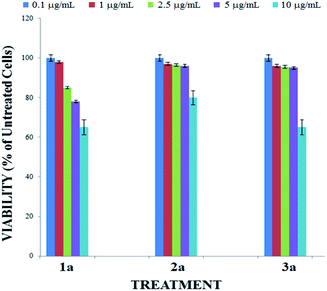 |
| | Fig. 6 Cytotoxicity effect of BOSCHIBAs 1a–3a. B16F10 melanoma cells were treated with 10 mg mL−1 (soft blue bars), 5 mg mL−1 (purple bars), 2.5 mg mL−1 (green bars), 1 mg mL−1 (red bars) or 0.1 mg mL−1 (sharp blue bars) for 24 hours. | |
Likewise, at the highest concentration of BOSCHIBAs, the cellular viabilities were conserved above 70%. These high viabilities could be partially attributed to structure design which includes three essential α-amino acids and therefore do not represent a threat to the cell.
3.6 Bioimaging by confocal microscopy
We sought to evaluate whether the new chiral BOSCHBAs derived from tryptophan and phenylalanine would produce different fluorescent stains on cells in vitro to those showed in our previous report.21,23 More specifically, if there is an effect of the amino acids addition on the staining in B16F10 melanoma cell.
For this purpose, B16F10 cells were treated with 10 μg mL−1 of the different boron compounds for 2 h and then analyzed by confocal laser microscopy. Fig. 7 shows images of cells treated with DMSO, boron compound derived from glycine (1a), tryptophan (2a), and phenylalanine (3a) in DMSO solution. Whereas cells treated only with DMSO were very weakly stained (Fig. 7B and C), those treated with compound 1a showed a selective cytoplasm staining (Fig. 7E). However, compounds 2a and 3a showed nucleoli and cytoplasmic fluorescent staining (Fig. 7H and K, respectively) when the treated cells are observed with single photon excitation at 405 nm. Interestingly, only compounds 2a and 3a showed cytoplasm and nucleoli staining in cells (Fig. 8B and C, respectively). These findings suggest the tryptophan and phenylalanine increased lipophilicity of both compounds facilitates their diffusion through the plasmatic and nuclear membranes. In contrast, compound 1a, only showed cytoplasmic staining (Fig. 8A).
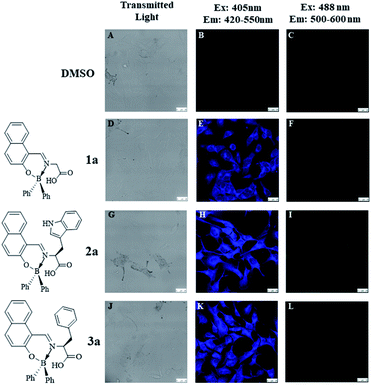 |
| | Fig. 7 Confocal fluorescence images of B16F10 melanoma cells stained with BOSCHIBAs 1a–3a (10 μg mL−1). (A–C) Untreated cells; (D–F) compound 1a; (G–I) compound 2a; (J–L) compound 3a (scale bar shown represents 20 mm). | |
 |
| | Fig. 8 Confocal fluorescence images of B16F10 melanoma cells stained with 10 μg mL−1 of BOSCHIBAs 1a (A), 2a, (B), and 3a (C). | |
3.7 Photostability
For the assays of cell fluorescent staining, it is necessary to demonstrate the chemical-optical response of BOSCHIBAs do not change when are exposed to light irradiation. The photostability curve for BOSCHIBAs 1a–4a are given in the ESI (Fig. S32–S35†). Fig. 9 shows the degradation plots of BOSCHIBAs at different exposure time under UV light irradiation. All of the BOSCHIBAs were irradiation at 365 nm under ambient temperature with air atmosphere by time intervals from 10 to 40 min, and the stability of the BOSCHIBAs were monitored by UV spectroscopy. BOSCHIBAs 1a and 2a with benzene and phenyl rings display less that 20 percent degradation after being irradiated for 40 min at the same wavelength while that 3a with the indol ring shows a degradation of 25%. This behavior revealed that there are not remarkable changes in the main absorption bands for 1a–3a which demonstrated that varying the aromatic side chains in the α-amino acid analogues increase the photostability. With the purpose to evaluate the effect of aromatic α-amino acids on the photostability of BOSCHIBAs 1a–3a, a BOSCHIBA label as 4a with a phenyl group was also synthesized (see Scheme 1). Light stability test, performed under the same experimental conditions, revealed that 4a shows a high resistance to degradation (∼5% at 40 min) in comparison with BOSCHIBA 3a (∼25% at 40 min). Therefore, according with the experimental data measured, the inclusion of benzene and phenyl rings increase the resistance to degradation compared with the indol ring which is less stable and more reactive that benzene. Likewise, stability in aqueous solutions at 1% v/v of DMSO for BOSCHIBAs was performed under the same experimental without photoirradiation. All the BOSCHIBAs show good structural stability against to water solution because after 60 min of UV irradiation the optical response does not change (See electronic ESI Fig. S36–S39†).
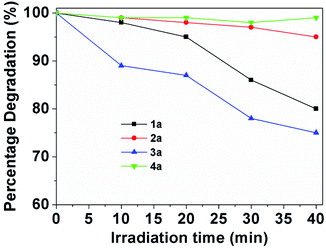 |
| | Fig. 9 Photostability of 1a–4a (1 mg/50 mL) in methanol at the absorption maximum wavelength with the irradiation time. | |
4. Conclusions
In summary, we have reported three new chiral BOSCHIBAs derivatives from glycine, tryptophan, and phenylalanine with good photophysical properties and low cytotoxicity that allow us to use them as fluorescent biomarkers in cells for confocal microscopy. Bioimaging analysis using BOSCHIBAs 2a and 3a revealed that both molecules are able to produce exceptional nucleoli and cytoplasm staining, while 1a shows only cytoplasmic staining. Nucleoli reveal by BOSCHIBAs 2a and 3a allows to quantify their number per cell as well as to identify potential aberrant morphologies that could be correlated to certain pathologies or cellular stress.36 Use of BOSCHIBAs would be advantageous as compared to the current methods using specific fluorescent antibodies that are more expensive and more time consuming that our technique. Due to the noticeable nucleoli and cytoplasm staining as well as the enhanced biocompatibility properties, these BOSCHIBAs are a very good new alternative for fluorescent in vitro cell labeling taking in account that we used green synthesis methods.
Conflicts of interest
There are no conflicts to declare.
Acknowledgements
Authors thank to UANL-FCQ and UANL-PAICYT 2019 (Grant: CE880-19) for financial support. This work is dedicated to Prof. Eusebio Juaristi Cosío as recognition of his scientific contributions on stereochemistry and green chemistry.
References
- F. Hu and B. Liu, Org. Biomol. Chem., 2016, 14, 9931–9944 RSC.
- H. Zhu, J. Fan, J. Du and X. Peng, Acc. Chem. Res., 2016, 49(10), 2115–2126 CrossRef CAS PubMed.
- M. Zheng, D. Librizzi, A. Kiliç, Y. Liu, H. Renz, O. M. Merkel and T. Kissel, Biomaterials, 2012, 33, 6551–6558 CrossRef CAS PubMed.
- Z. Yang, J. Cao, Y. He, J. H. Yang, T. Kim, X. Peng and J. S. Kim, Chem. Soc. Rev., 2014, 43, 4563–4601 RSC.
- H. W. Liu, L. Chen, C. Xu, Z. Li, H. Zhang, X. B. Zhang and W. Tan, Chem. Soc. Rev., 2018, 47, 7140–7180 RSC.
- Y. Fan, S. Wang and F. Zhang, Angew. Chem., Int. Ed., 2019, 58, 13208–13219 CrossRef CAS PubMed.
- P. Kaur and K. Singh, J. Mater. Chem. C, 2019, 7, 11361–11405 RSC.
- A. Pliss, A. N. Kuzmin, A. V. Kachynski, A. Baev, R. Berezney and P. N. Prasad, Integr. Biol., 2015, 7, 681–692 CrossRef CAS PubMed.
- K. Singh, S. Singh, P. Srivastava, S. Sivakumar and A. K. Patra, Chem. Commun., 2017, 53, 6144–6147 RSC.
- X. Wang, Y. Wang, H. He, X. Ma, Q. Chen, S. Zhang, B. Ge, S. Wang, W. M. Nau and F. Huang, ACS Appl. Mater. Interfaces, 2017, 9(21), 17799–17806 CrossRef CAS PubMed.
- H. Wang, Z. Feng, W. Tan and B. Xu, Bioconjugate Chem., 2019, 30(10), 2528–2532 CrossRef CAS PubMed.
- K. I. Farley, Y. Surovtseva, J. Merkel and S. J. Baserga, Chromosoma, 2015, 124, 323–331 CrossRef CAS PubMed.
- G. Y. Wiederschain, Biochem, 2011, 76, 1276 CAS.
- J. Yu, D. Parker, R. Pal, R. A. Poole and M. J. Cann, J. Am. Chem. Soc., 2006, 128(7), 2294–2299 CrossRef CAS PubMed.
- K. Y. Zhang, S. P. Y. Li, N. Zhu, L. W. S. Or, M. S. H. Cheung, Y. W. Lam and K. K. W. Lo, Inorg. Chem., 2010, 49(5), 2530–2540 CrossRef CAS PubMed.
- J. T. Miao, C. Fan, R. Sun, Y. J. Xu and J. F. Ge, J. Mater. Chem. B, 2014, 2, 7065–7072 RSC.
- G. Song, Y. Sun, Y. Liu, X. Wang, M. Chen, F. Miao, W. Zhang, X. Yu and J. Jin, Biomaterials, 2014, 35, 2103–2112 CrossRef CAS PubMed.
- Y. Liu, W. Zhang, Y. Sun, G. Song, F. Miao, F. Guo, M. Tian, X. Yu and J. Z. Sun, Dyes Pigm., 2014, 103, 191–201 CrossRef CAS.
- R. Feng, L. Li, B. Li, J. Li, D. Peng, Y. Yu, Q. Mu, N. Zhao, X. Yu and Z. Wang, RSC Adv., 2017, 7, 16730–16736 RSC.
- H. Li, Y. Li, H. Zhang, G. Xu, Y. Zhang, X. Liu, H. Zhou, X. Yang, X. Zhang and Y. Tian, Chem. Commun., 2017, 53, 13245–13248 RSC.
- M. Ibarra-Rodríguez, B. M. Muñoz-Flores, R. Chan-Navarro, N. Waksman, A. Saucedo-Yañez, M. Sánchez and V. M. Jiménez-Pérez, Opt. Mater., 2019, 89, 123–131 CrossRef.
- J. Berrones-Reyes, B. M. Muñoz-Flores, A. Gómez-Treviño, M. A. Treto-Suárez, D. Páez-Hernández, E. Schott, X. Zarate and V. M. Jiménez-Pérez, Mater. Chem. Phys., 2019, 233, 89–101 CrossRef CAS.
- M. M. Corona-López, V. M. Jiménez Pérez, R. Chan-Navarro, M. Ibarra-Rodríguez, H. V. Rasika Dias, A. Chávez-Reyes and B. M. Muñoz-Flores, J. Organomet. Chem., 2017, 852, 64–73 CrossRef.
- M. Ibarra-Rodríguez, B. M. Muñoz-Flores, A. Gómez-Treviño, R. Chan-Navarro, J. C. Berrones-Reyes, A. Chávez-Reyes, H. V. R. Dias, M. Sánchez Vázquez and V. M. Jiménez-Pérez, Appl. Organomet. Chem., 2019, 33, e4718 CrossRef.
- A. A. Molina-Paredes, V. M. Jiménez-Pérez, J. A. Lara-Cerón, I. Moggio, E. Arias, R. Santillán, M. Sánchez, A. Suacedo-Yañez and B. M. Muñoz-Flores, Appl. Organomet. Chem., 2019, 33, e4609 CrossRef.
- A. Gräslund, F. Madani, S. Lindberg, Ü. Langel and S. Futaki, J. Biophys., 2011, 2011, 414729 Search PubMed.
- S. Tabassum, A. Asim, R. A. Khan, Z. Hussain, S. Srivastav, S. Srikrishna and F. Arjmand, Dalton Trans., 2013, 42, 16749–16761 RSC.
- C. Würth, M. Grabolle, J. Pauli, M. Spieles and U. Resch-Genger, Nat. Protoc., 2013, 8, 1535–1550 CrossRef PubMed.
- B. Wrackmeyer, Annu. Rep. NMR Spectrosc., 1988, 20, 61–203 CrossRef CAS.
- D. Li, Z. Zhang, S. Zhao, Y. Wang and H. Zhang, Dalton Trans., 2011, 40, 1279–1285 RSC.
- H. Höpfl, J. Organomet. Chem., 1999, 581, 129–149 CrossRef.
- D. Li, H. Zhang, C. Wang, S. Huang, J. Guo and Y. Wang, J. Mater. Chem., 2012, 22, 4319 RSC.
- D. Li, Y. Yuan, H. Bi, D. Yao, X. Zhao, W. Tian, Y. Wang and H. Zhang, Inorg. Chem., 2011, 50, 4825–4831 CrossRef CAS PubMed.
- P. Sanphui, G. Bolla, U. Das, A. K. Mukherjee and A. Nangia, CrystEngComm, 2013, 15, 34–38 RSC.
- R. Chan-Navarro, V. M. Jiménez-Pérez, B. M. Muñoz-Flores, H. V. R. Dias, I. Moggio, E. Arias, G. Ramos-Ortíz, R. Santillan, C. García, M. E. Ochoa, M. Yousufuddin and N. Waksman, Dyes Pigm., 2013, 99, 1036–1043 CrossRef CAS.
- K. Yang, J. Yang and J. Yi, Cell Stress, 2018, 2, 125–140 CrossRef PubMed.
Footnote |
| † Electronic supplementary information (ESI) available. CCDC 2002773. For ESI and crystallographic data in CIF or other electronic format see DOI: 10.1039/d0ra05948j |
|
| This journal is © The Royal Society of Chemistry 2020 |
Click here to see how this site uses Cookies. View our privacy policy here.  Open Access Article
 *a,
Leonardo Xochicale-Santanaa,
María E. Ochoab,
Arturo Chávez-Reyescd and
Blanca M. Muñoz-Flores*a
![[double bond, length as m-dash]](https://www.rsc.org/images/entities/char_e001.gif) N), 830 (C–HAr), 1345 (C
N), 830 (C–HAr), 1345 (C![[double bond, length as m-dash]](https://www.rsc.org/images/entities/char_e001.gif) CAr), 703 (O–B); 1H NMR (300.13 MHz, ((CD3)2CO)) δ: 6.68 (d, 2H, 3J = 9 Hz, H-14, H-13), 7.13 (m, 7H, H-3, 4H-m, 2H-p), 7.33 (d, 2H, 3J = 15 Hz, H-13, H-17), 7.39 (t, 1H, 3J = 15 Hz, H-7), 7.46 (d, 4H, 3J = 6 Hz, 4H-o), 7.58 (t, 1H, 3J = 15 Hz, H-8), 7.83 (d, 1H, 3J = 6.0 Hz, H-6), 8.05 (d, 1H, 3J = 9 Hz, H-4), 8.33 (d, 1H, 3J = 9.0 Hz, H-9), 8.66 (s, 1H, C15–OH), 9.37 (s, 1H, H-11) ppm; 13C NMR (75.47 MHz, ((CD3)2CO)) δ: 111.81 (C-1), 114.92 (C-14, C-16), 120.34 (C-9), 121.00 (C-13, C-17), 124.04 (C-3), 125.46 (C-7), 125.89 (C-5), 126.04 (C-m), 126.60 (C-p), 128.75 (C-8), 129.15 (C-6), 132.59 (C-10), 133.32 (C-4), 133.77 (C-o), 138.67 (C-12), 139.27 (C-i), 156.95 (C-11), 158.03 (C-15), 164.01 (C-2) ppm; 11B{1H} NMR (96.29 MHz, ((CD3)2CO)) δ: 8.89 ppm; HRMS (APCI/TOF-Q) m/z: calcd for [(C34H27N2O3B + H)+]: 428.1700; exp.: 428.1819 amu.
CAr), 703 (O–B); 1H NMR (300.13 MHz, ((CD3)2CO)) δ: 6.68 (d, 2H, 3J = 9 Hz, H-14, H-13), 7.13 (m, 7H, H-3, 4H-m, 2H-p), 7.33 (d, 2H, 3J = 15 Hz, H-13, H-17), 7.39 (t, 1H, 3J = 15 Hz, H-7), 7.46 (d, 4H, 3J = 6 Hz, 4H-o), 7.58 (t, 1H, 3J = 15 Hz, H-8), 7.83 (d, 1H, 3J = 6.0 Hz, H-6), 8.05 (d, 1H, 3J = 9 Hz, H-4), 8.33 (d, 1H, 3J = 9.0 Hz, H-9), 8.66 (s, 1H, C15–OH), 9.37 (s, 1H, H-11) ppm; 13C NMR (75.47 MHz, ((CD3)2CO)) δ: 111.81 (C-1), 114.92 (C-14, C-16), 120.34 (C-9), 121.00 (C-13, C-17), 124.04 (C-3), 125.46 (C-7), 125.89 (C-5), 126.04 (C-m), 126.60 (C-p), 128.75 (C-8), 129.15 (C-6), 132.59 (C-10), 133.32 (C-4), 133.77 (C-o), 138.67 (C-12), 139.27 (C-i), 156.95 (C-11), 158.03 (C-15), 164.01 (C-2) ppm; 11B{1H} NMR (96.29 MHz, ((CD3)2CO)) δ: 8.89 ppm; HRMS (APCI/TOF-Q) m/z: calcd for [(C34H27N2O3B + H)+]: 428.1700; exp.: 428.1819 amu.
![[thin space (1/6-em)]](https://www.rsc.org/images/entities/char_2009.gif) 199
199


