 Open Access Article
Which is a better fluorescent sensor: aggregation-induced emission-based nanofibers or thin-coating films?†
Yexin
Ding
a,
Weili
Li
 *a,
Fangming
Wang
a,
Hongkun
Li
 b,
Shengyuan
Yang
 c,
Lijun
Wang
a,
Zhiming
Wang
 d,
Mike
Tebyetekerwa
 *e and
Ben Zhong
Tang
 *df
*df
aSchool of Material Science and Engineering & National Demonstration Center for Experimental Materials Science and Engineering Education, Jiangsu University of Science and Technology, Zhenjiang, 212003, China. E-mail: liweili@just.edu.cn
bState and Local Joint Engineering Laboratory for Novel Functional Polymeric Materials, Laboratory of Advanced Optoelectronic Materials, College of Chemistry, Chemical Engineering and Materials Science, Soochow University, Suzhou 215123, China
cState Key Laboratory for Modification of Chemical Fibers and Polymer Materials, Shanghai “Belt & Road” International Joint Laboratory for Advanced Fiber and Low-dimension Materials, College of Materials Science and Engineering, Donghua University, Shanghai 201620, P. R. China
dGuangdong Innovative Research Team, State Key Laboratory of Luminescent Materials and Devices, South China University of Technology, Guangzhou 510640, P. R. China
eResearch School of Electrical, Energy and Materials Engineering, College of Engineering and Computer Science, The Australian National University, Canberra, ACT 2601, Australia. E-mail: mike.tebyetekerwa@anu.edu.au
fDepartment of Chemistry, Hong Kong Branch of Chinese National Engineering Research Center for Tissue Restoration and Reconstruction, The Hong Kong University of Science & Technology, Clear Water Bay, Kowloon, Hong Kong, P. R. China. E-mail: tangbenz@ust.hk
First published on 6th July 2020
Abstract
In this work, aggregation-induced emission (AIE)-based fluorescent nanofibers and thin-film coatings are fabricated using electrospinning and spin coating techniques, respectively. The two material domains are utilized as visual fluorescent sensors whose mechanism of performance is governed by the intramolecular rotation phenomenon of the AIE molecular rotors. The samples’ response to humidity, temperature and organics is compared. Final results revealed that there is no all-ideal morphology. Each material works best as a visual fluorescent sensor in specific environments.
In recent years, due to the advance in technology, several material processing techniques have emerged.1 The various techniques are capable of fabricating materials with different and unique properties depending on their dimensions and sizes,2,3 morphologies and structures,4–6 and many other essential factors. Depending on the physical and chemical properties of the final materials (for example in polymers), after their processing, their functionality can, therefore, be modulated even with same material type. For example, the same polymer material existing in different morphologies can show very different performances.4,7 This explains why nanotechnology is at the forefront of realizing new and unique high-performance materials,8,9 as it is capable of producing novel materials with various features, sizes and functions as compared to the materials obtained by traditional techniques in bulk.
The application of materials in which microscopic molecular motions can ably control the behavior of the overall material under specific environments is intriguing yet versatile. As a result, various breakthroughs have been reported utilizing this principle as in the case of molecular motors/switches/shuttles, stimuli-responsive polymers, smart fluorescent materials and many others.10,11 Among them, fluorescent materials have garnered enormous attention due to their wide applications ranging from biology, security, materials science, membrane chemistry to forensic applications. It is worth noting that, fluorescent systems made up of molecular motors need the suppression of molecular motions to generate a strong fluorescence for any would-be applications.12,13 This exact phenomenon is what led to the development of aggregation-induced emission (AIE).
Fluorescent AIE molecular rotors have twisted intra molecular-charge-transfer properties with the configuration of their intramolecular motions able to determine their photophysical energy dissipation pathways (fluorescence). AIE luminogens (AIEgens) show extraordinary fluorescence at solid state due to the restriction of their rotor movements, but weak fluorescence in a solution.14 Such a phenomenon is opposite to the aggregation-caused quenching (ACQ) commonly observed in traditional fluorescent molecules and materials.15 These properties in AIE molecules have resulted in efforts to employ them in solid-state efficient molecular machines, sensors (probes), photodetectors, LEDs, solar concentrators and many others.16–19 The current work is focused on AIE fluorescent probes realized in different morphologies.
In this work, we determine and qualify the extent of performance between aggregation-induced emission (AIE)-based nanofibers and thin-coating films as fluorescent probes. Our main aim is to understand and give an account of which AIE-based material system is better in these two physical forms. Briefly, we selected one typical AIEgen called tetracarboxylic-tetraphenylethylene (TPE-4COOH) which was successfully knitted onto an acrylic polymer via a condensation reaction. The resultant polymer-AIEgen material was further processed into fluorescent thin-coating films (FTFs) and fluorescent nanofibers mats (FNFs). With reference to the popular restriction of intramolecular rotation effect in AIEgens’ intrinsic rotors, the fluorescence response properties of the obtained FTFs and FNFs were used as a guide to sensitively study the extent of performance of these materials under different environmental conditions as sensors.
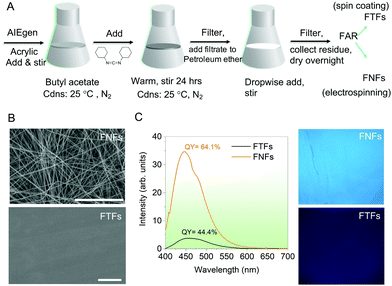
General synthesis route. The general process of realizing FTFs and FNFs is presented in Fig. 1A. From the different acrylic resins (for acrylic synthesis see Supplementary note 1, ESI†) having the same molecular weight (but different glass transition temperature, Tg, (Fig. S1, ESI†)), one acrylic resin was selected for use in our experiments. The flexibility in Tg could be realized by adjusting the soft and hard monomers in the resin according to the Fox formula. The acrylic resin with Tg = ∼30 °C was selected as the optimum ingredient to facilitate the knitting procedure with the TPE-4COOH AIEgen in different amounts (0.05–2 wt%) (for AIEgen synthesis see Supplementary note 2, ESI†) to realize the fluorescent acrylic resin (FAR) utilized in our study. The acrylic resins not selected had either very low Tg (soft) or very high Tg (hard) and thus could not easily be appropriately used in the further process of obtaining FAR. For the synthesis of polymer-AIEgen materials (the FAR) see Supplementary note 3 (ESI†). Overall, the synthesis of AIEgen and its knitting process to the acrylic resin (such as reaction time, quantity, and conditions) were all systematically studied with the help of the restriction of intramolecular rotation mechanism which dictates the emission properties of the AIEgens (Supplementary note 4, ESI†). High emission from both the AIEgen and the polymer-AIEgen (FAR) was the target. High fluorescence of the AIEgens is expected to provide reliable materials if made into thin-films or nanofibers for visual fluorescence sensors.
From the prepared FAR, the FNFs and the FTFs were processed. The FNFs were obtained by electrospinning (for details see Supplementary note 5, ESI†). However, since electrospinning is a very complicated process and various factors during spinning can affect the properties of the resultant fibers such as morphology, surface area, diameter, porosity, etc., thus care must be taken with systematic design of experiments. In this sense, before we obtained the optimum FNFs, the spinning conditions, the weight content of TPE-4COOH, Tg value of FAR and the molecular weight (Mn) of acrylic resin were all varied (for detailed experiments see Supplementary note 6, ESI†). Overall the optimum condition for the best-suited FNFs (Fig. 1B, top) included using FAR with Tg of 30 °C, acrylic resin with Mn of 51![[thin space (1/6-em)]](https://www.rsc.org/images/entities/char_2009.gif) 200 g mol−1 and the spinning viscosity of 332 mPa s at room temperature. For comparison, a flat coating based on the same FAR was prepared by spinning coating (Fig. 1B, bottom).
200 g mol−1 and the spinning viscosity of 332 mPa s at room temperature. For comparison, a flat coating based on the same FAR was prepared by spinning coating (Fig. 1B, bottom).
Physical and optical performances. First, the physical and optical properties of FNFs and FTFs were compared. The scanning electron microscope (SEM) images (Fig. 1B) of the representative samples detail the morphological differences between the FNFs and FTFs. As expected, the FNFs showed random nanofibers with an average diameter of 700 ± 30 nm, while the FTFs showed a smooth surface. Such morphology of the FNFs presented nanopores which can uniquely improve the surface area of the material, hence more contact and active area of interaction with the environment. Unlike FTFs, no pores are observed, and this signifies a less active area. The fluorescence emission of the samples was also captured using the UV-laser-equiped fluorescence spectroscopic tool and their respective spectra recorded together with their quantum yield (QY) values (Fig. 1C, left). A relatively broad spectral peak at ∼490 nm was observed from both samples. However, the spin-coated FTFs showed a lower QY of 44.4% as compared to electrospun FNFs’ 64.1%, signifying FNFs superior emission performance than FTFs. These results are also supported by the captured UV light (365 nm) images from the samples (Fig. 1C, right). Overall the excellent emission from the two materials after knitting the AIEgen is attributed to the presence of the long polymer units (51![[thin space (1/6-em)]](https://www.rsc.org/images/entities/char_2009.gif) 200 g mol−1) which consequently is capable of restricting intramolecular rotations of the rotors and hence facilitating emission.17,19,20 However, the difference in intensity of emission and QY between FNFs and FTFs is due to the nature of the processing techniques used to obtain each and to their physical morphologies. Electrospinning technique involves high voltages to obtain highly oriented nanofibers.21 Therefore, the polymer chains in the obtained nanofibers in the FNFs samples are under high stresses due to their traction tension involved during their flow through the high-voltage electric field.22–24 This consequently stretches the molecular rotors of AIEgens, which pumps the emission from the FNFs. More still, the FNFs have a high surface area and has more material being exposed to the UV excitation source as compared to FTFs.25
200 g mol−1) which consequently is capable of restricting intramolecular rotations of the rotors and hence facilitating emission.17,19,20 However, the difference in intensity of emission and QY between FNFs and FTFs is due to the nature of the processing techniques used to obtain each and to their physical morphologies. Electrospinning technique involves high voltages to obtain highly oriented nanofibers.21 Therefore, the polymer chains in the obtained nanofibers in the FNFs samples are under high stresses due to their traction tension involved during their flow through the high-voltage electric field.22–24 This consequently stretches the molecular rotors of AIEgens, which pumps the emission from the FNFs. More still, the FNFs have a high surface area and has more material being exposed to the UV excitation source as compared to FTFs.25
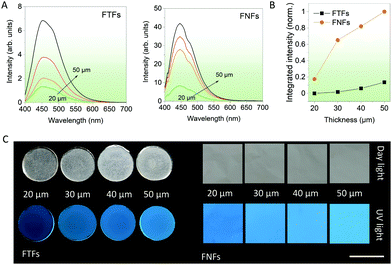
Thickness-dependent emission. In the next series of experiments, various thicknesses of FNFs and FTFs were studied, and their relative emission performances compared. This could help us to select the best thickness for fluorescent sensor performance comparisons in the next experiments. According to the spectral data from FTFs and FNFs (Fig. 2A), the general observed rule was “more is better”. The emission intensity of the samples generally increased with the thickness of the materials (Fig. 2B). Furthermore, the FNFs samples with 50 μm thickness showed an excellent emission increase of ∼455% as compared to 20 μm samples. In the same line, FTFs showed only ∼60%. The relative fluorescence images of the samples are also provided in Fig. 2C. The reason for the difference in trend between the two material samples lies in the material's AIEgen physical content properties. Samples with higher thickness have more AIEgen doped into their polymer system as compared to the thin samples. From these results, we selected the 50 μm samples for both FNFs and FTFs for our next set of experiments. And in comparison, FNFs gave higher emission than FTFs. This explanation is clearly corroborated with the results in Fig. 1C where we observe FNFs with superior emission with a higher quantum yield. This is ascribed to the presence of high oriented polymer chains in the nanofibers in the FNFs samples which are under high stress due to their traction tension involved during their flow through the high-voltage electric field. FNFs are able to maximumly restrict the different AIE molecules in the 1D confined nanofibers space. Also, the high surface area of the FNFs is capable of interacting with to the UV excitation source as compared to FTFs.
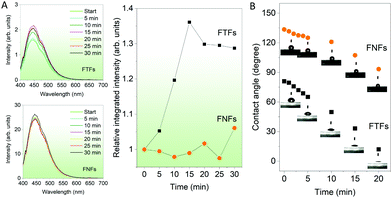
Response to humidity. Now we compare the fluorescence-based sensor properties of FNFs and FTFs towards water molecules in the air. The materials were introduced to a controlled humidity environment (flow rate −450 sccm and relative humidity −75%). After every interval, the fluorescence spectrum from the samples was captured (Fig. 3A). From the fluorescence spectra results, we observe that FNFs do not show any remarkable change in their fluorescence intensity. In contrast, FTFs show an increasing trend with the materials fluorescence intensity reaching maximum intensity after 15 min. After 15 min, the intensity starts to fall progressively. Nevertheless, first, in order to account for the increased emission in FTF with humidity, the following explanation is used. Water is known to be a poor solvent for AIEgen.14,18 Therefore, the intramolecular motions of TPE rotors in the AIEgen can efficiently be inhibited further with the presence of water molecules. Thus more absorbed energy can be released in the form of fluorescence radiation.26,27 To explain the observations in the fluorescence intensity of the FTFs, and FNFs, we employed the contact angle measurements (Fig. 3B). The FNFs present hydrophobic material surfaces with high water contact angles (above 100°). This is due to their nano-porous morphologies capable of effecting the lotus effect.28,29 With the prolonged exposure of the FNFs, we observe the hydrophobicity decreasing, but overall the contact angle remained high (above 60°). This means that the water molecules do not interact well with the surface and the materials, hence no change in the fluorescence. On the contrary, in the FTFs, we observe the water contact angle decreasing rapidly. Looking back at the nature of the change of the fluorescence intensity in the FTFs, we observed a rapid increase in the first 15 min, which then started to fall. In the contact angle measurements, after 15 min, we see that the contact angle was almost zero, and the FTFs surfaces acted super hydrophilic. Herein, we show observations up to 30 min because of the following reason; in FTFs the intensity remained steady with unparallel minute decreases and increases (overall, we can take it as steady) after 30 min. For FNFs the trend remained similar and steady in exact comparison to what was observed in the first 30 min. This means that the presence of water starts to deteriorate the material. Overall, it is logical to conclude that FTFs are better humidity sensors than FNFs. The FNFs cannot be used as humidity sensors. Moreover, when the FTFs are used as humidity sensors, they should be used within the active response time of 15 min or else their sensing properties start to deteriorate.
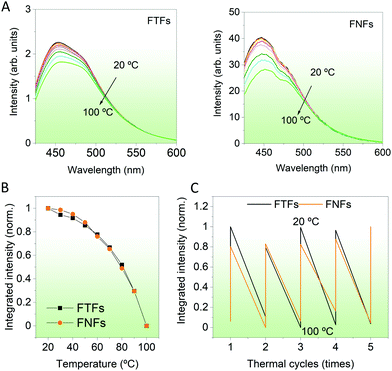
Temperature responsivity. Then, we compared the response of the materials to environment temperature. Temperatures between 20–100 °C were probed. During then, the FTFs and FNFs samples were exposed to different temperatures and then their fluorescence spectra were captured. From Fig. 4A, we observe the fluorescence intensity of both materials decreasing progressively. The normalized integrated fluorescence data summarizing the spectral data in Fig. 4A is provided in Fig. 4B. The response of both materials to the environment temperature was similar. The decreasing trend in fluorescence of both samples is explained as follows; at low temperature (20 °C), the acrylic polymer chains are still rigid, and these chains limit the intramolecular rotation of TPE molecules,25 which will then enhance the fluorescence intensity of FTFs and FNFs. However, with the increasing testing temperature, the polymer chains gradually become weak. Hence, the materials lose their originally knitted bonds between TPE and the polymer, thus promoting its intramolecular rotation. Such behavior is known to consume the absorbed energy from UV light, consequently reducing the samples’ fluorescence. This is also the mechanism on which temperature sensing of AIEgens-based FTFs and FNFs work. We also performed a temperature cycling test between 20 °C and 100 °C to determine if the samples can be reused (Fig. 4C). Both samples were very stable with their fluorescence-temperature dependence response spectra being repeatable. In summary, both the FTFs and FNFs showed similar and excellent thermos-sensitive sensor properties with repeatable usage.
Response to organic solvents. Finally, we compared the fluorescent sensing properties of the FTFs and FNFs on dichloromethane (DCM) in a controlled environment. FTFs and FNFs samples were exposed to DCM for different durations (5–30 min) and their respective fluorescence spectra captured (Fig. 5A). It was observed that the fluorescence intensity of the FNFs decreased significantly with the exposure time, as compared to that of FTFs. The fluorescence quenching rate in the FTFs was only ∼10% as compared to the unexposed material and kept almost stable, yet for FNFs reached to 80% (Fig. 5B). The mechanism of quenching can also be substantiated with the restriction of intramolecular phenomena of AIEgen rotors. DCM is an excellent solvent and therefore, can readily interact with both the acrylic and the AIEgens. This weakens the grip effect of polymer chains with TPE molecules, hence restoring the intramolecular motions of AIEgens, which consequently results in the massive consumption of the absorbed energy from UV light and thus reduced fluorescence. The different response between FNFs and FTFs to DCM is ascribed to the FNFs nanofibrous porous morphology and high specific surface area which benefit the rapid penetration of DCM. However, for the FTFs, the reduced surface area tends to restrict DCM interaction with material and hence the same trend across all the reaction times. This also explains why in FNFs after 20 min, the fluorescence becomes stable, signalling saturation point of the FNFs samples, where they start to act as thin films. Overall, FNFs are excellent organic liquid sensors than FTFs in this regard.
In summary, AIE-based polymers are excellent visual fluorescent sensors whose working principle is governed by the AIEgen rotors’ intramolecular rotation, which changes with the material environment. The change in material's morphology such as thin films, nanofibers (as in the case in this article) consequently changes the responsivity of the final material to a specific environment, rendering the same material species active or inactive (depending on the chemical and physical means the AIE rotors are affected). In this work, we have demonstrated that FTFs are better humidity sensors than FNFs, whereas FNFs are excellent organic liquid sensors than FTFs. Moreover, both the FTFs and FNFs show similar and excellent thermos-sensitive sensor properties with repeatable usage. It is therefore paramount to understand which response is needed and the tailor the existing AIEgen-polymer system chemically and physically using the different material and chemical processing techniques. There is no ideal morphology or approach, and performance lies in the art to play with the rotors.
Conflicts of interest
There are no conflicts to declare.Acknowledgements
This work was funded by the National Natural Science Foundation of China (Grant No. 51673088) and National Key Laboratory for Marine Coatings (Grant No. GZ-19-0001). MT acknowledges the scholarship support from the Australian Government Research Training Program (AGRTP).References
- S. Thomas and W. Yang, Advances in polymer processing: from macro-to nano-scales, Elsevier, 2009 Search PubMed.
- L. Montemayor, V. Chernow and J. R. Greer, MRS Bull., 2015, 40, 1122–1129 CrossRef.
- R. Chantiwas, S. Park, S. A. Soper, B. C. Kim, S. Takayama, V. Sunkara, H. Hwang and Y.-K. Cho, Chem. Soc. Rev., 2011, 40, 3677–3702 RSC.
- M. Tebyetekerwa, X. Wang, Y. Wu, S. Yang, M. Zhu and S. Ramakrishna, J. Mater. Chem. A, 2017, 5, 21114–21121 RSC.
- A. R. Hirst, D. K. Smith and J. P. Harrington, Chem. – Eur. J., 2005, 11, 6552–6559 CrossRef CAS PubMed.
- J.-M. Du and D.-J. Kang, Mater. Res. Bull., 2006, 41, 1785–1790 CrossRef CAS.
- M. A. Ruderer, S. Guo, R. Meier, H.-Y. Chiang, V. Körstgens, J. Wiedersich, J. Perlich, S. V. Roth and P. Müller-Buschbaum, Adv. Funct. Mater., 2011, 21, 3382–3391 CrossRef CAS.
- B. Bhushan, Springer handbook of nanotechnology, Springer, 2017 Search PubMed.
- C. P. Poole Jr and F. J. Owens, Introduction to nanotechnology, John Wiley & Sons, 2003 Search PubMed.
- S. Iamsaard, S. J. Aßhoff, B. Matt, T. Kudernac, J. J. Cornelissen, S. P. Fletcher and N. Katsonis, Nat. Chem., 2014, 6, 229–235 CrossRef CAS PubMed.
- J.-a. Lv, Y. Liu, J. Wei, E. Chen, L. Qin and Y. Yu, Nature, 2016, 537, 179–184 CrossRef CAS PubMed.
- Z. Zhao, X. Zheng, L. Du, Y. Xiong, W. He, X. Gao, C. Li, Y. Liu, B. Xu, J. Zhang, F. Song, Y. Yu, X. Zhao, Y. Cai, X. He, R. T. K. Kwok, J. W. Y. Lam, X. Huang, D. Lee Phillips, H. Wang and B. Z. Tang, Nat. Commun., 2019, 10, 2952 CrossRef PubMed.
- J. Qi, J. Li, R. H. Liu, Q. Li, H. K. Zhang, J. W. Y. Lam, R. T. K. Kwok, D. B. Liu, D. Ding and B. Z. Tang, Chem, 2019, 5, 2657–2677 CAS.
- J. Mei, N. L. Leung, R. T. Kwok, J. W. Lam and B. Z. Tang, Chem. Rev., 2015, 115, 11718–11940 CrossRef CAS PubMed.
- W. Li, J. Wang, Y. Xie, M. Tebyetekerwa, Z. Qiu, J. Tang, S. Yang, M. Zhu and Z. Xu, Prog. Org. Coat., 2018, 120, 1–9 CrossRef CAS.
- R. Hu, N. L. Leung and B. Z. Tang, Chem. Soc. Rev., 2014, 43, 4494–4562 RSC.
- Y. Hong, J. W. Lam and B. Z. Tang, Chem. Commun., 2009, 4332–4353 RSC.
- Y. Hong, J. W. Lam and B. Z. Tang, Chem. Soc. Rev., 2011, 40, 5361–5388 RSC.
- M. Tebyetekerwa, Y. Cheng, J. Zhang, W. Li, H. Li, G. P. Neupane, B. Wang, T. N. Truong, C. Xiao, M. M. Al-Jassim, Z. Yin, Y. Lu, D. Macdonald and H. T. Nguyen, ACS Nano, 2020, 14, 7444–7453 CrossRef CAS.
- W. Li, D. Huang, J. Wang, W. Shen, L. Chen, S. Yang, M. Zhu, B. Tang, G. Liang and Z. Xu, Polym. Chem., 2015, 6, 8194–8202 RSC.
- M. Tebyetekerwa and S. Ramakrishna, Matter, 2020, 2, 279–283 CrossRef.
- J. S. Stephens, D. B. Chase and J. F. Rabolt, Macromolecules, 2004, 37, 877–881 CrossRef CAS.
- Y. Fu, S. Gong, X. Liu, G. Xu, Z. Ren, X. Li and G. Han, J. Mater. Chem. C, 2015, 3, 382–389 RSC.
- P. Samanta, T. V. S. Singh, R. Srivastava, B. Nandan, C.-L. Liu and H.-L. Chen, Soft Matter, 2016, 12, 5110–5120 RSC.
- W. Li, Y. Ding, M. Tebyetekerwa, Y. Xie, L. Wang, H. Li, R. Hu, Z. Wang, A. Qin and B. Z. Tang, Mater. Chem. Front., 2019, 3, 2491–2498 RSC.
- J. Mei, Y. Hong, J. W. Lam, A. Qin, Y. Tang and B. Z. Tang, Adv. Mater., 2014, 26, 5429–5479 CrossRef CAS PubMed.
- A. Qin, J. W. Lam and B. Z. Tang, Prog. Polym. Sci., 2012, 37, 182–209 CrossRef CAS.
- Z. Z. Gu, H. Uetsuka, K. Takahashi, R. Nakajima, H. Onishi, A. Fujishima and O. Sato, Angew. Chem., Int. Ed., 2003, 42, 894–897 CrossRef CAS.
- L. Gao and T. J. McCarthy, Langmuir, 2006, 22, 2966–2967 CrossRef CAS PubMed.
Footnote |
| † Electronic supplementary information (ESI) available. See DOI: 10.1039/d0ma00409j |
| This journal is © The Royal Society of Chemistry 2020 |


