Facile synthesis of lanthanide doped yttria nanophosphors by a simple microplasma-assisted process†
Liangliang
Lin
 *a,
Sergey A.
Starostin
b,
Xintong
Ma
c,
Sirui
Li
c,
Saif A.
Khan
 d and
Volker
Hessel
c
aSchool of Chemical and Material Engineering, Jiangnan University, Wuxi 214122, China. E-mail: linliangliang@jiangnan.edu.cn
bFUJIFILM Manufacturing Europe B.V., Tilburg Research Labs, P.O. Box 90156, Tilburg, The Netherlands
cDepartment of Chemical Engineering and Chemistry, Eindhoven University of Technology, P.O. Box 513, 5600 MB Eindhoven, The Netherlands
dDepartment of Chemical and Biomolecular Engineering, National University of Singapore, Singapore 117576, Singapore
First published on 14th February 2019
Abstract
Increasing awareness of the potentially harmful impacts of nanomaterials on human health has led to a high demand for low-toxicity lanthanide (Ln)-doped nanophosphors in life science fields. The present study introduces a conceptually new approach based on a microplasma technique to produce high quality crystalline lanthanide doped nanophosphors. By selecting Eu3+ doped yttria as a model for study, systematic experiments are carried out to synthesize Y2O3:Eu3+ nanophosphors of controllable size and various Eu3+ doping concentrations. The plasma–liquid interaction and the obtained products are examined by complementary analytical methods. Results demonstrate that ultra-high purity crystalline Y2O3:Eu3+ nanophosphors can be successfully prepared from merely an aqueous solution of Y(NO3)3·6H2O and Eu(NO3)3·6H2O at an extremely low plasma power consumption (3–5.5 W), without involving any hazardous chemicals. Moreover, the Eu3+ ions prove to be efficiently and homogeneously doped into the yttria matrix, and their luminescence performance can be tuned to a large extent by adjusting the processing conditions. Due to the high degree of flexibility, this approach can be readily expanded to the green synthesis and engineering of various lanthanide doped/co-doped nanophosphors.
Introduction
Semiconductor nanocrystals have been widely used as luminescent materials for bio-imaging or bio-fluorescence labelling due to their quantum size effect, where the absorbance onset and emissions shift to higher energy with decreasing size.1,2 However, they are generally synthesized under expensive, complex and hazardous experimental conditions. Recent studies indicate they can affect cell-membrane penetrability and engender undesirable hazardous interactions with biological systems.3 Therefore, their long term use in bio-related areas has been limited. As a promising category of fluorescent materials, lanthanide-doped nanophosphors have attracted considerable interest for biological applications owing to their inherently low cytotoxicity (compared to Cd and Se-based nanocrystals), sharp emission/absorption bands and long fluorescence lifetimes.4–6 In addition, lanthanide ions (Ln3+) have fixed and particle size independent emission wavelengths. Tuneable emissions can be achieved by choosing appropriate colour-centre elements instead of varying the particle size, endowing a high degree of flexibility in designing nanophosphors with desirable luminescence properties.7Recently, a variety of novel or well-established methods have been developed to produce lanthanide doped phosphors. In general, they can be divided into two main categories: high temperature solid-state reactions and wet chemistry routes. However, solid-state reactions commonly generate highly aggregated particles (μm level) with inhomogeneous Ln3+ doping. Mechanical processes such as grinding or milling are needed to obtain fine particles, which may reduce the luminescence efficiency due to the inflicted damage on the surfaces. As to wet chemistry routes, they are mostly driven by the supersaturation of alkali precipitants. The vigorous hydrolysing reactions and the inhomogeneous precipitant concentration while dripping throughout the synthesis can rapidly generate large amounts of sediments, leading to products of wide size distributions (from nm to μm).8,9 Moreover, the involved chemicals (e.g. stabilizers, surfactants or solvents) can occupy active centres and create traps in the phosphors, which in turn, requires complex purification procedures to get rid of possible residues.10 It is worthwhile to mention that a non-thermal plasma-driven method was also reported to produce Eu3+ doped yttria nanophosphors from water solutions of lanthanide nitrates.11 However, the reported method was operated at a reduced pressure of 0.15 hPa. The involvement of expensive vacuum equipment is not favorable for industrial application. Furthermore, the reaction vessel containing a reagent solution is placed above the electrode, leading to the “remote” type of plasma–liquid interaction. In such a plasma configuration, reactions are induced by the diffusion of plasma formed species to the liquid surface or by UV irradiation, which are expected to be less efficient compared to reactions driven by the direct discharge current passing the interface. Therefore, by the current state of techniques, it is still a challenge to produce high purity nano-sized lanthanide phosphors with homogeneous Ln3+ doping in a simple, controllable and toxic chemical free manner.
With the development of plasma technology, microplasma activated synthesis can be an answer to this formidable challenge. Owing to the increased surface-to-volume ratio and the decreased electrode gap, microplasma possesses several distinct advantages for nanomaterial synthesis: high-pressure operation, non-equilibrium chemistry, microscale geometry and a self-organization phenomenon.12 By using the synergistic advantages of electrochemistry and microplasma, herein we present a demonstration of an atmospheric pressure microplasma-induced approach for the production of high-quality lanthanide doped nanophosphors at a relatively low plasma power consumption (3.5–5.0 W). In this method, instead of dripping extra precipitants, water is exploited as a “soft” hydrolysing agent to mildly release hydroxyl radicals under electron impacts. Therefore, the vigorous and inhomogeneous hydrolysing reactions as well as the associated purification procedures can be avoided. A series of high quality Ln3+ (Ln![[double bond, length as m-dash]](https://www.rsc.org/images/entities/char_e001.gif) Eu, Tb, Dy, Tm) doped yttria nanophosphors are prepared to show the versatility of the process. As a model study, Eu3+ doped yttria nanophosphor is chosen to investigate the effect of heat treatment and the dopant concentration on their photoluminescence properties. The demonstrated high quality products with the simple, versatile and environmentally-benign process by using water as a soft OH− source should bring interest in this emerging nanofabrication technique.
Eu, Tb, Dy, Tm) doped yttria nanophosphors are prepared to show the versatility of the process. As a model study, Eu3+ doped yttria nanophosphor is chosen to investigate the effect of heat treatment and the dopant concentration on their photoluminescence properties. The demonstrated high quality products with the simple, versatile and environmentally-benign process by using water as a soft OH− source should bring interest in this emerging nanofabrication technique.
Experimental
Chemicals
Y(NO3)3·6H2O (99.8%, Sigma-Aldrich), Eu(NO3)3·6H2O (99.9%, Sigma-Aldrich), Tb(NO3)3·6H2O (99.9%, Sigma-Aldrich), Tm(NO3)3·6H2O (99.9%, Sigma-Aldrich), Dy(NO3)3·6H2O (99.9%, Sigma-Aldrich).Synthesis of Ln3+ doped yttria nanoparticles
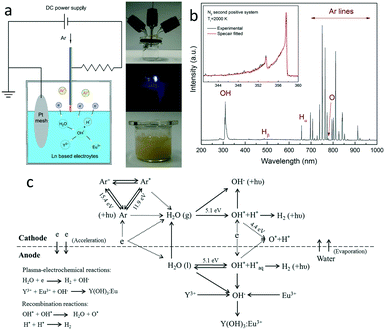
In this work, the Ln3+ (Ln![[double bond, length as m-dash]](https://www.rsc.org/images/entities/char_e001.gif) Eu, Tb, Tm, Dy) doped nanophosphors were obtained by plasma-electrodeposition of lanthanide hydroxides followed by heat treatment at various temperatures.13 Yttria was designed as the host matrices for Ln3+ doping due to its broad range of optical transparency, superior chemical stability, large band gaps (5.8 eV) and relatively low phonon energies (∼500 cm−1).14 Y(NO3)3·6H2O and Ln(NO3)3·6H2O salts were used as the starting raw materials. An electrolyte solution was prepared by mixing Y(NO3)3·6H2O and Ln(NO3)3·6H2O according to the formula (Y1−xLnx)2O3 and dissolving in deionized water. The plasma electrodeposition of lanthanide hydroxides was carried out in a specially designed microplasma reactor (Fig. 1). A negatively-biased stainless steel (SS) capillary (I.D. = 318 μm, O.D. = 1.6 mm) was used as the cathode and initially positioned 0.5 mm above the electrolyte surface, while a grounded Pt foil (diameter = 10 mm, thickness = 0.3 mm) functioned as the anode and being immersed inside the electrolyte solution. Both electrodes were connected to a negatively biased DC power supply (Matsusada Precision, Model AU-10R30) to form the plasma between the end of the capillary tube and the electrolyte surface. Such a plasma configuration ensures a direct current through the plasma–liquid interface, and is more efficient in activating chemical conversion than the remote type plasma. Besides, a ballast resistor (50 kΩ) was installed to stabilize the discharge current. For all experiments, an MFC-controlled argon flow with a 50 sccm gas flow rate was coupled to the capillary as the plasma gas. The reactor was well-sealed before igniting the plasma. Meanwhile, argon was continuously flowed into the reactor for several minutes to get rid of impurities like oxygen, nitrogen and carbon dioxide. In each operation, 10 ml (0.05 mol L−1) electrolyte solution was filled in the microplasma reactor for the plasma treatment, with a typical processing time of 3 hours. The output voltage was fixed at 3 kV. Experimental values of the plasma current, voltage and power were automatically logged using a LabVIEW based program. After the plasma treatment, lanthanide-doped hydroxide sediments were formed in the electrolyte solution. The colour of the bulk electrolyte solution changes from transparent to opaque yellowish (Fig. 1a). The solution was then transferred to centrifuge tubes and centrifuged for 10 minutes at 4000/s to obtain the sediments, without any purification process. These sediments were further dried at 50 °C to obtain solid powders. Afterwards, they were heat-treated at various temperatures (600–1200 °C) at a heating rate of 10 °C min−1 and maintained for 3 hours to obtain oxide derivatives. Then the products were scraped from the crucible for further characterization.
Eu, Tb, Tm, Dy) doped nanophosphors were obtained by plasma-electrodeposition of lanthanide hydroxides followed by heat treatment at various temperatures.13 Yttria was designed as the host matrices for Ln3+ doping due to its broad range of optical transparency, superior chemical stability, large band gaps (5.8 eV) and relatively low phonon energies (∼500 cm−1).14 Y(NO3)3·6H2O and Ln(NO3)3·6H2O salts were used as the starting raw materials. An electrolyte solution was prepared by mixing Y(NO3)3·6H2O and Ln(NO3)3·6H2O according to the formula (Y1−xLnx)2O3 and dissolving in deionized water. The plasma electrodeposition of lanthanide hydroxides was carried out in a specially designed microplasma reactor (Fig. 1). A negatively-biased stainless steel (SS) capillary (I.D. = 318 μm, O.D. = 1.6 mm) was used as the cathode and initially positioned 0.5 mm above the electrolyte surface, while a grounded Pt foil (diameter = 10 mm, thickness = 0.3 mm) functioned as the anode and being immersed inside the electrolyte solution. Both electrodes were connected to a negatively biased DC power supply (Matsusada Precision, Model AU-10R30) to form the plasma between the end of the capillary tube and the electrolyte surface. Such a plasma configuration ensures a direct current through the plasma–liquid interface, and is more efficient in activating chemical conversion than the remote type plasma. Besides, a ballast resistor (50 kΩ) was installed to stabilize the discharge current. For all experiments, an MFC-controlled argon flow with a 50 sccm gas flow rate was coupled to the capillary as the plasma gas. The reactor was well-sealed before igniting the plasma. Meanwhile, argon was continuously flowed into the reactor for several minutes to get rid of impurities like oxygen, nitrogen and carbon dioxide. In each operation, 10 ml (0.05 mol L−1) electrolyte solution was filled in the microplasma reactor for the plasma treatment, with a typical processing time of 3 hours. The output voltage was fixed at 3 kV. Experimental values of the plasma current, voltage and power were automatically logged using a LabVIEW based program. After the plasma treatment, lanthanide-doped hydroxide sediments were formed in the electrolyte solution. The colour of the bulk electrolyte solution changes from transparent to opaque yellowish (Fig. 1a). The solution was then transferred to centrifuge tubes and centrifuged for 10 minutes at 4000/s to obtain the sediments, without any purification process. These sediments were further dried at 50 °C to obtain solid powders. Afterwards, they were heat-treated at various temperatures (600–1200 °C) at a heating rate of 10 °C min−1 and maintained for 3 hours to obtain oxide derivatives. Then the products were scraped from the crucible for further characterization.
In situ characterization of the microplasma
To identify the existing short-live radicals in the plasma-assisted process, the plasma–liquid interaction was in situ monitored using an optical emission spectrometer (HR2000+ES, Ocean Optics, Inc.). The emitted light was collected by an optical fibre fixed at 20 mm from the microplasma. The spectrum was recorded in the wavelength range from 200 nm to 1000 nm. Moreover, in order to estimate the gas temperature, a higher resolution spectrometer (HR2000+, Ocean Optics, Inc.) with a spectral resolution of 0.21 nm and a wavelength range of 200–420 nm was also applied. In microplasma the rotational temperature is regarded as an approximation of the gas temperature. As suggested by P. Bruggeman, 0.5 sccm N2 was added in the discharge to determine the gas temperature of plasmas in contact with liquids using the N2 SPS system by Specair fitting.15 In brief, a typical optical emission spectrum recorded from plasma–liquid interactions was imported into the Specair program, which was developed for computing, manipulating and fitting optical emission spectra from plasma.16 By setting the input parameters (e.g. pressure, gas type and mole fractions, ambient absorbers, and radiative transitions) according to the experimental conditions and choosing the rotational temperature as the variable parameter, successive calculations were performed to fit the simulated spectrum as close as possible to the imported experimental spectrum, and the gas temperature of the plasma can be derived. It should be noted that this is an emission-averaged value derived from the light gathered over the entire microplasma volume, since microplasma has a nonuniform nature with strong radial gradients in temperature.Ex situ characterization of the lanthanide doped yttria nanophosphors
Complementary analytical methods have been applied to characterize the obtained lanthanide doped nanophosphors. Thermogravimetric analysis was carried out on a Mettler-Toledo TGA/DSC 1 instrument. Approximately 10 mg sample was placed in a crucible and heated to 750 °C at a rate of 10 °C min−1 in a flow mixture of O2/He. Infrared characterization was performed using a Perkin-Elmer Spectrum One Fourier transform spectrometer to provide a fingerprint of samples before and after calcination. Spectra were recorded in the region of 400 cm−1 to 4000 cm−1. TEM analysis was carried out using an FEI Tecnai 20 (Sphera) microscope operated with a 200 kV LaB6 filament for further investigation of the microstructures. TEM samples were prepared by dispersing a small quantity of the products into ethanol and sonicating for 30 min. Then one drop of the solution was cast on a carbon-coated Cu TEM grid (Quantifoil Micro Tools, GmbH). To get a better idea on nanoparticle size and distribution, size distribution histograms were constructed by randomly measuring 300 particles from TEM images. EDX characterization was performed on a Quanta 3D FEG (FEI) operated at 10 kV, with a silicon drift element detector (Sapphire DPP-2) to examine the chemical composition. The surface chemical composition and binding information were further assessed by X-ray photoelectron spectroscopy (Thermo Scientific Kα), with the spectra obtained using an aluminum anode (Al Kα = 1486.6 eV) operating at 72 W and a spot size of 400 μm. The crystalline structure was characterized by X-ray diffraction (XRD) using a Rigaku powder diffractometer (Cu-Kα1 radiation, λ = 1.54056 Å). The scans were recorded in a 2θ step of 0.02 and a dwell time of 20 s. Raman measurements were performed using a LabRAM HR evolution confocal Raman microscope (Horiba Jobin-Yvon) equipped with an 1800 lines per mm grating. The excitation wavelength was 632.8 nm, and the spectra were measured in the 0–2000 cm−1 range. The photoluminescence measurements were performed at room temperature on a luminescence spectrometer (Perkin Elmer, Model LS-50B) using a certain wavelength as the excitation source.Results and discussion
The plasma-electrochemical reactions were carried out in a specially designed microplasma reactor.17Fig. 1(a) shows the representative images of the reactor, direct plasma–liquid interaction process and the plasma-treated electrolyte solution to illustrate this concept. A typical optical emission spectrum is shown in Fig. 1(b), with detailed radiative transition information summarized in Table S1.† The most prominent spectral feature is the argon atomic transitions (Ar I) between highly excited electronic states (4p → 4s) in the wavelength region of 690–1000 nm.18 In addition, the emission band of OH radicals, with a strong peak starting at 305 nm and falling off towards 325 nm (the 3064 Å system), is also clearly observed.19 Less intense emission lines of atomic hydrogen (486 nm, 657 nm) and atomic oxygen (777 nm) species are also detected, suggesting the presence of high energy electrons and the dissociation of water molecules under the plasma treatment.20 Furthermore, by fitting the experimental spectrum with the simulated one using the N2 SPS system in the Specair program, the gas temperature during plasma–liquid interactions is estimated to be ∼2000 K, suggesting the non-equilibrium characteristic of the plasma. The result is consistent with the reported value of a DC glow discharge in contact with the aqueous solution (2000–3000 K).21 It should be noted that this is an emission-averaged value derived from the light gathered over the entire microplasma volume, since microplasma has a nonuniform nature with strong radial gradients in temperature.The plasma-electrode position process is also characterized by electrical measurements. Fig. S1† shows a typical V–I characteristic during a specific plasma–liquid interaction process to give a general idea on the evolution of plasma voltage, current and power. The plasma current decreases slightly as the reaction occurs, while the plasma voltage and power undergo an apparent increasing trend. This is attributed to the consumption/evacuation of water and the associated increasing distance between the electrode and the liquid surface. It is seen that only 3.5–5.0 W plasma power is needed to sustain the electrochemical reactions. In this plasma configuration, the above electrode is negatively-biased. Electrons are driven and accelerated towards the solution surface to collide with water molecules. Hydroxyl radicals can be released from water under electron impacts to form precipitant ions. Meanwhile, since Y3+ and Eu3+ are homogeneously mixed at the molecular level, luminescent ions can be uniformly embedded into the host matrix. Based on the OES result, Fig. 1(c) gives an overview of possible reaction pathways of the plasma-induced lanthanide doping process.
The dried sediments, obtained from the electrolyte solution containing Y(NO3)3·6H2O and Eu(NO3)3·6H2O salts after plasma treatment, were firstly characterized by XRD. As shown in Fig. S2,† all diffraction peaks except (001) and (002) are well matched with the monoclinic phase of Y(OH)3 (JCPDS card #21-1447). As for the (001) and (002) peaks, they are ascribed to the intercalation of nitrite ions in the as-prepared hydroxides, and their intensities are related to the amount of the intercalated ions.22 According to ref. 23, the (00X) peaks are typically observed in the XRD patterns of layered lanthanide hydroxides with the formula [Ln(OH)3−xAx]·nH2O, where A denotes the intercalated ions in the synthesized hydroxide, such as nitrate, chloride etc. The above findings are completely in agreement with the study of Aghazadeh et al., suggesting the formation of crystalline NO3−-intercalated yttrium hydroxides by the plasma-assisted deposition process.24 To further examine the morphology of the obtained lanthanide hydroxides, the SEM images at different magnifications are provided in Fig. S3.† The plasma-deposited yttrium hydroxide sediments were shown to have layered structures. Based on the above analysis, [Y(OH)3−x(NO3−)x]·nH2O is the expected formula for the deposited sediments.
Thermal analysis was performed to investigate the thermal decomposition process of the obtained lanthanide hydroxide compounds (Fig. 2). The first endothermic peak appears in the range of 50–150 °C, relating to the evaporation of physical-bounded water from the hydroxides. The second endothermic peak situated at ∼280 °C accompanied by a total mass loss of 11% (from 96% to 85%) indicates the removal of structural water from the hydroxides to form oxyhydroxides as intermediates. It should be mentioned that the associated residual nitrate ions in the dried powders were also dissociated during this temperature range. As reported by Malecka et al., the decomposition of nitrate ions starts at 75 °C and ends at 265 °C.25 The last endothermic peak is located at ∼490 °C, with a weight loss of 9% derived from the TG curve (from 79% to 70%), suggesting that the oxyhydroxides are further decomposed to form oxide derivatives. No sharp peaks are observed in the DTG/DSC curves beyond 600 °C, inferring that the sample doesn't undergo significant changes after this temperature. The thermal decomposition process of the dried hydroxide compounds can be expressed stoichiometrically as follows:
| [Y(OH)3−x(NO3)x:Eu]·nH2O → [Y(OH)3−x(NO3)x:Eu] + nH2O | (1) |
| [Y(OH)3−x(NO3)x:Eu] → [YO(OH)1−x(NO3)x:Eu] + H2O | (2) |
| [YO(OH)1−x(NO3)x:Eu] → [YO(OH)1−x:Eu] + xNO2 + x/2O2 | (3) |
| 2[YO(OH)1−x:Eu] + x/2O2 → Y2O3:Eu + (1 − x)H2O | (4) |
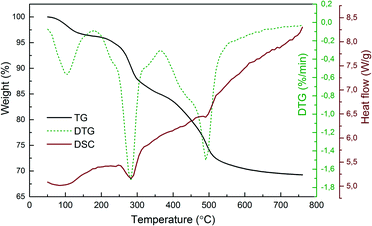 | ||
| Fig. 2 Typical TG/DTG–DSC curves for the thermal decomposition of the plasma-generated Y(OH)3:5%Eu3+ powders. | ||
The dehydration of hydroxides to oxides after heat treatment is confirmed by the infrared absorption spectra (Fig. 3). Both the un-doped and 5% Eu-doped yttrium hydroxides and oxides show similar spectral characteristics, suggesting that the doping of Eu3+ ions does not influence the absorption peaks. For the hydroxide samples, a broad band in the region of 3000–3700 cm−1 as well as a relatively narrow band at 1664 cm−1 are detected, which are assigned to the O–H vibration.26 The bands at 1510 cm−1, 1411 cm−1 and 1052 cm−1 can be attributed to the carbonyl groups, formed by the CO2 absorption from the ambient atmosphere.27 The prominent peak at 1354 cm−1 originates from the residual nitrate ions incorporated in the hydroxide powders,22 which is within our expectation, since no purification procedures were performed after plasma treatment. Meanwhile, the peaks at 819 cm−1 and 603 cm−1 are indexed to the Y–OH stretching mode.28 By contrast, for the spectra of the calcined samples, the intensities of OH and carbonyl bands decrease drastically. However, due to moisture and CO2 absorption during the test, they still exist in the annealed sample. It is also observed that the characteristic peak of nitrate ions completely disappears after calcination, suggesting the decomposition of nitrate ions as well as the fabrication of high purity oxide derivatives. On the other hand, two new absorption bands related to the Y(Eu)–O stretching mode appear at 555 cm−1 and 464 cm−1, indicating the formation of oxides.29 Detailed information of the IR absorption bands is listed in Table S2.†
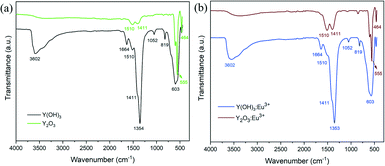 | ||
| Fig. 3 (a) FTIR spectra of the dried Y(OH)3 and Y2O3 nanoparticles annealed at 600 °C; (b) FTIR spectra of the dried Y(OH)3:5%Eu3+ and Y2O3:5%Eu3+ nanoparticles annealed at 600 °C. | ||
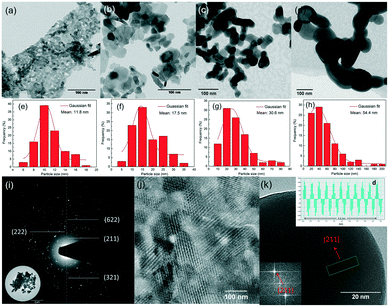
Fig. 4(a–d) show the representative TEM images of 5% Eu3+ doped yttria nanophosphors with heat treatment in the temperature range of 600–1200 °C. Meanwhile, the corresponding size distribution histograms were constructed from TEM images to get a better idea on particle size and distributions (Fig. 4(e–h)). It is seen that the products are on the nanoscale, with irregular shapes being aggregated together. Their size and size distributions show an apparent increasing trend with the temperature. This is due to the enhanced Ostwald ripening process at higher calcination temperature, where larger particles are more energetically stable than smaller ones. The result suggests that this technique is capable of producing nanosized phosphors without any stabilizers or surfactants. A reasonable explanation is the mild hydrolysing process induced by the plasma electron impacts. In contrast to conventional wet chemistry methods by adding supersaturated alkali precipitants, hydroxyl radicals are smoothly released from water to homogeneously form ultra-small sediments in a “bottom-up” manner, avoiding vigorous hydrolysing reactions. Furthermore, the crystalline structure of nanophosphors heat-treated at 1200 °C is examined by SAED and HRTEM. The regular arrangement of the diffraction spots forming concentric diffraction rings suggests their crystalline nature (Fig. 4(i)). Moreover, the particles exhibit clear lattice fringes, with different crystal planes being observed (Fig. 4(j)). An estimation of the interplanar distance (d-spacing) of a typical nanoparticle by measuring the distance across 10 atomic planes deduces ∼4.6 Å (Fig. 4(k)), slightly larger than the (211) plane of yttria nanoparticle ∼4.3 Å). This can be explained by the substitution of yttrium ions (r = 0.89 Å) for larger europium ions (r = 0.95 Å), which in turn, reveals that Eu3+ ions have been doped into the yttria lattice.30
The representative SEM images of Y2O3:5%Eu3+ nanoparticles are shown in Fig. S4† for a general overview of sample morphology. Well-dispersed clusters of irregular shapes are observed in the field of view, forming a coral-like appearance. High magnification images reveal that these are formed by the aggregates of spheres with clearly defined boundaries. Compared to the layer-structured yttrium hydroxides, the morphology difference is attributed to the heat treatment, in which NO3−-intercalated yttrium hydroxide compounds were dehydrated and decomposed to form oxide derivatives. EDX analysis is performed to examine the chemical composition of the nanophosphors, which shows the presence of Y, O, Eu and C (from carbon tape) elements. EDX mapping on a random area indicates Y and O as dominant elements. Meanwhile, the Eu element shows a relatively low signal homogeneously distributed over the sample area, suggesting that it is uniformly incorporated in the products.
The chemical compositions and binding information are further examined by XPS characterization. Fig. 5(a) shows the full range spectra of Y2O3 and Y2O3:5%Eu3+ nanoparticles annealed at 600 °C. It is clearly demonstrated that both samples mainly consist of Y (Y3d, 158 eV; Y3p, 300 eV; Y3s, 395 eV) and O (O1s, 532 eV), although a minor C signal exists, which is attributed to the absorption of CO2. However, in the spectrum of Y2O3:5%Eu3+ nanoparticles, new peaks appear at 135 eV and 1130 eV, corresponding to Eu4d and Eu3d5/2 photoelectron signals.31 The Y3d, Eu3d5/2 and O1s spectral features of Y2O3:5%Eu3+ nanoparticles are also illustrated in Fig. 5(b–d). The Y3d spectrum shows two distinctive spin–orbit splitting peaks. Further deconvolution of the peaks indicates the presence of Y2O3 (156.6 eV: Y3d5/2; 158.6 eV: Y3d3/2) as well as yttrium carbonates (158.2 eV: Y3d5/2; 160.3 eV: Y3d3/2).32,33 Spectral decomposition of Eu3d5/2 suggests the co-existence of Eu2O3 and Eu2+ components, reflected by the significant peak at 1134.0 eV and the shake down satellite peak at 1125.2 eV.34 The deconvolution of O1s bands further confirms the above results. The two prominent peaks at 529.1 eV and 531.7 eV are typical O–Y bonds that widely existed in Y2O3 nanoparticles,35 while the subpeak at 530.7 eV is due to O–Eu binding.31 Moreover, the minor peak at 533.2 eV probably originated from the impurities such as O–C compounds or O–H species.32
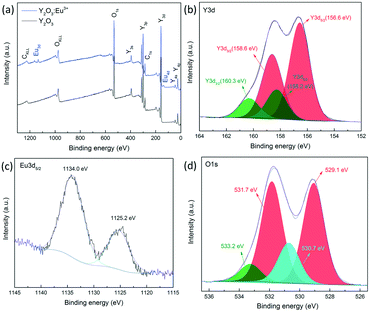 | ||
| Fig. 5 (a) Full XPS spectrum of Y2O3:5%Eu3+ nanoparticles annealed at 600 °C; (b) XPS spectrum of Y3d; (c) XPS spectrum of Eu3d5/2; (d) XPS spectrum of O1s. | ||
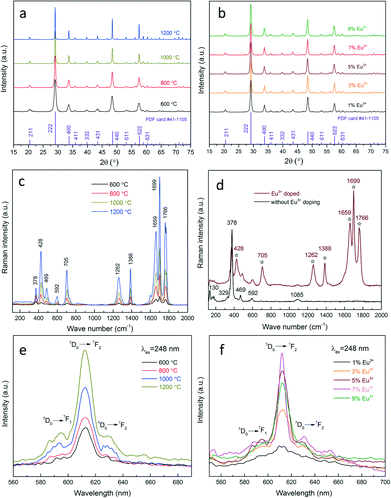
Afterwards, the influence of heat treatment and dopant concentration on the photoluminescence properties is investigated. The crystal structure of nanophosphors obtained under different conditions is investigated by XRD, as shown in Fig. 6(a and b). All diffractions peaks are well indexed to the cubic yttria (JCPDS card #41-1105), regardless of the temperature or the Eu3+ concentration, inferring that Eu3+ cations have been effectively doped into the yttria lattice, and the crystal structure has not been affected. Moreover, the apparent narrowing trend of the diffraction peaks with the temperature reflects an enhanced crystallinity at high temperatures. As a complementary characterization, Raman analysis is performed to provide a fingerprint of the samples with/without Eu3+ doping (Fig. 6(c and d)). In both cases one can observe peaks at 130 cm−1, 329 cm−1, 378 cm−1, 469 cm−1, 592 cm−1 and 1085 cm−1, which are characteristic peaks of cubic yttria nanoparticles.36 However, several new peaks appear at 428 cm−1, 705 cm−1, 1262 cm−1, 1388 cm−1, 1659 cm−1, 1699 cm−1 and 1766 cm−1 in the spectrum of Eu3+ doped nanophosphors (marked by asterisks), revealing that the chemical bonds and symmetry are changed due to Eu3+ incorporation. This in conjunction with the EDX, XPS and XRD results indicating that Eu3+ has been effectively and homogeneously doped into the yttria lattice. In addition, the intensities of the peaks are found to increase significantly with the temperature, while the peak width exhibits an inverse relationship. This is attributed to the improved crystallinity as well as the spatial-correlation effect. Particles annealed at higher temperatures have better crystallinity, leading to less surface defects and dislocations and eventually an increased Raman intensity. On the other hand, at lower temperatures particles have smaller crystalline size. The confinement of phonons in a smaller volume can cause an increased uncertainty in the wave vector of the phonons and phonon momentum distribution, which in turn, results in the peak broadening phenomenon.36
Fig. 6(e and f) show the photoluminescence emission spectra of Eu3+ doped yttria nanophosphors prepared under different conditions. All spectra exhibit a sharp peak at 612 nm, which originated from the 5D0 → 7F2 transition of Eu3+ in C2 symmetry.37 Less intense spectral features related to the 5D0 → 7F2 transition are also observed at 620–640 nm. There are several weak emission peaks in the range of 580–600 nm, which are assigned to the 5D0 → 7F1 transition of Eu3+ in S6 or C2 symmetry.38 The emission intensity of nanophosphors doped with the same Eu3+ concentration is shown to increase drastically with the temperature. This is attributed to the crystalline effects. Bulk and surface defects widely exist in poorly-crystalline particles, which can act as non-radiative centres (quenching centres) and lower the luminescence efficiency. However, heat treatment can improve particle crystallinity and reduce the crystalline defects, allowing a better activation for the Eu3+ ions. By analysing the highest peak (222) at 29.2° using the Scherrer formula, the crystallite size is estimated to increase drastically with the temperature, from 11.6 nm at 600 °C, 16.8 nm at 800 °C, 29.7 nm at 1000 °C and 53.5 nm at 1200 °C. The result verifies the XRD and Raman analysis relating to the improvement of the crystallinity at high temperatures. In addition to the heat treatment, the impact of the Eu3+ concentration on the luminescence efficiency was also explored. Initially, a steady rise in the photoluminescence intensity is observed with the increase of the Eu3+ concentration, which is due to the increase of the active centres in the yttria matrices. The optimum value is reached at the Eu3+ concentration of 7%. Afterwards, the nanophosphors exhibit luminescence quenching with further increase of the Eu3+ concentration. This effect is caused by the coulombic repulsion between the neighbouring Eu3+ in the yttria lattice.39,40 An over-saturated dopant concentration leads to a decrease in the average distance between Eu3+, and in some cases can form dopant pairs or clusters. This will promote the interactions between ions, energy migration, and cross-relaxation processes. As a consequence, the non-radiative transitions prevail, which in turn, suppress the luminescence efficiency.
The spectral downshift behaviour of both the solid Y2O3/Y2O3:5%Eu3+ sample and their aqueous solution is also examined under UV radiation (254 nm). Strong red-orange fluorescence emissions are clearly visible from the Y2O3:Eu3+ sample when excited by the UV source, in contrast to the non-emissive Y2O3 particles (Fig. S5†). The result reveals the downshifting nature of the obtained Y2O3:5%Eu3+ nanophosphors. This property will allow the lanthanide doped yttria nanocomposites to be used in many practical applications, such as solid/liquid illumination, security-printing area, bio-imaging and other related areas.
Above all, we have shown a proof-of-principle of Eu3+ doped yttria nanophosphor synthesis via a microplasma-assisted method. To demonstrate the versatility of this process, it is further expanded to the production of a series of Ln3+ (Ln![[double bond, length as m-dash]](https://www.rsc.org/images/entities/char_e001.gif) Tb, Dy, Tm) doped nanophosphors. Herein, we mainly focus on their luminescence properties, as shown in Fig. 7. In addition to the prominent emission peak of Eu3+ at 612 nm, characteristic peaks of Tm3+ (455 nm, 463 nm), Tb3+ (543 nm, 550 nm) and Dy3+ (572 nm, 579 nm) were also detected, suggesting the successful doping of Ln3+ into the yttria matrix by this technique. Since lanthanide ions have specific emission wavelengths, it is expected that this approach can be readily extended to the fabrication of various Ln3+ doped/co-doped nanophosphors with desirable photoluminescence properties by selecting appropriate colour-centre elements.
Tb, Dy, Tm) doped nanophosphors. Herein, we mainly focus on their luminescence properties, as shown in Fig. 7. In addition to the prominent emission peak of Eu3+ at 612 nm, characteristic peaks of Tm3+ (455 nm, 463 nm), Tb3+ (543 nm, 550 nm) and Dy3+ (572 nm, 579 nm) were also detected, suggesting the successful doping of Ln3+ into the yttria matrix by this technique. Since lanthanide ions have specific emission wavelengths, it is expected that this approach can be readily extended to the fabrication of various Ln3+ doped/co-doped nanophosphors with desirable photoluminescence properties by selecting appropriate colour-centre elements.
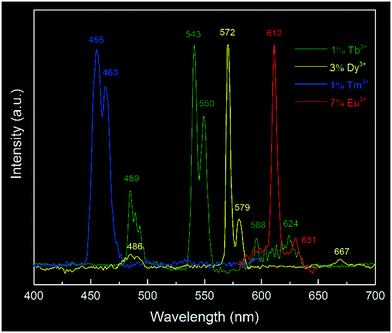 | ||
| Fig. 7 Typical photoluminescence emission spectra of Ln3+ doped yttria nanophosphors: 1% Tb3+ doping, excited at 307 nm; 3% Dy3+ doping, excited at 355 nm; 1% Tm3+ doping, excited at 355 nm and 7% Eu3+ doping, excited at 248 nm. All spectra were normalized at the same level. The measuring conditions were referenced to reported values in the literature.41 | ||
Conclusions
In summary, this work presents a demonstration of lanthanide (Ln![[double bond, length as m-dash]](https://www.rsc.org/images/entities/char_e001.gif) Eu, Tb, Dy, Tm) doped nanophosphor synthesis through a simple atmospheric pressure microplasma-assisted process. High quality crystalline nanophosphors of tuneable photoluminescence properties can be obtained from merely an electrolyte solution of Ln(NO3)3·6H2O salt. Instead of adding extra chemicals (solvents, stabilizers or surfactants) to suppress the vigorous and inhomogeneous hydrolysing reactions driven by supersaturated alkali precipitants, this method exploits water as a “soft” OH− source to maintain mild hydrolysing conditions. By designing Eu3+ doped yttria phosphors as a proof-of-concept model study, it is revealed that heat-treatment can improve the luminescence efficiency, while the Eu3+ concentration shows an initial positive but a final quenching effect. The developed microplasma-based technique overcomes formidable obstacles encountered in the current state of methods for preparing lanthanide doped nanophosphors, such as the vigorous hydrolysing reactions, the associated micro-sized particles, the inhomogeneous doping of luminescent ions within the host materials and the involvement of extra solvents, stabilizers or surfactants. As a result, it obviates the complex, time-consuming purification/post separation procedures and greatly simplifies the overall synthesis workflow.42–44 Based on the technological underpinning, this approach opens a new avenue for lanthanide doped nanophosphor synthesis, and is expected to have great potential in the green synthesis and engineering of nanophosphors with desirable photoluminescence properties.
Eu, Tb, Dy, Tm) doped nanophosphor synthesis through a simple atmospheric pressure microplasma-assisted process. High quality crystalline nanophosphors of tuneable photoluminescence properties can be obtained from merely an electrolyte solution of Ln(NO3)3·6H2O salt. Instead of adding extra chemicals (solvents, stabilizers or surfactants) to suppress the vigorous and inhomogeneous hydrolysing reactions driven by supersaturated alkali precipitants, this method exploits water as a “soft” OH− source to maintain mild hydrolysing conditions. By designing Eu3+ doped yttria phosphors as a proof-of-concept model study, it is revealed that heat-treatment can improve the luminescence efficiency, while the Eu3+ concentration shows an initial positive but a final quenching effect. The developed microplasma-based technique overcomes formidable obstacles encountered in the current state of methods for preparing lanthanide doped nanophosphors, such as the vigorous hydrolysing reactions, the associated micro-sized particles, the inhomogeneous doping of luminescent ions within the host materials and the involvement of extra solvents, stabilizers or surfactants. As a result, it obviates the complex, time-consuming purification/post separation procedures and greatly simplifies the overall synthesis workflow.42–44 Based on the technological underpinning, this approach opens a new avenue for lanthanide doped nanophosphor synthesis, and is expected to have great potential in the green synthesis and engineering of nanophosphors with desirable photoluminescence properties.
Conflicts of interest
There are no conflicts to declare.Acknowledgements
The authors greatly acknowledge the support from the Chinese Scholarship Council and the European LIFE12 ENV_NL_000718 “Green plasma process technology for manufacturing of flexible electronics” project.References
- M. Bruchez Jr., Science, 1998, 281, 2013–2016 CrossRef CAS.
- Q. Dai, Y. Wang, X. Li, Y. Zhang, D. J. Pellegrino, M. Zhao, B. Zou, J. Seo, Y. Wang and W. W. Yu, ACS Nano, 2009, 3, 1518–1524 CrossRef CAS PubMed.
- L. Wang, R. Yan, Z. Huo, L. Wang, J. Zeng, J. Bao, X. Wang, Q. Peng and Y. Li, Angew. Chem., Int. Ed., 2005, 44, 6054–6057 CrossRef CAS PubMed.
- X. Li, R. Wang, F. Zhang and D. Zhao, Nano Lett., 2014, 14, 3634–3639 CrossRef CAS PubMed.
- C. Sun, G. Pratx, C. M. Carpenter, H. Liu, Z. Cheng, S. S. Gambhir and L. Xing, Adv. Mater., 2011, 23, 195–199 CrossRef PubMed.
- Y. Sun, X. Zhu, J. Peng and F. Li, ACS Nano, 2013, 7, 11290–11300 CrossRef CAS PubMed.
- C. Bouzigues, T. Gacoin and A. Alexandrou, ACS Nano, 2011, 5, 8488–8505 CrossRef CAS PubMed.
- N. Venkatachalam, Y. Saito and K. Soga, J. Am. Ceram. Soc., 2009, 92, 1006–1010 CrossRef CAS.
- M. Rai, G. Kaur, S. K. Singh and S. B. Rai, Dalton Trans., 2015, 44, 6184–6192 RSC.
- Y. Liu, L. Zhu, X. Sun and J. Chen, AIChE J., 2010, 56, 2338–2346 CAS.
- P. Psuja, W. Strek and I. Yelkin, J. Nanopart. Res., 2014, 16, 2176 CrossRef PubMed.
- D. Mariotti and R. M. Sankaran, J. Phys. D: Appl. Phys., 2010, 43, 323001 CrossRef.
- L. Lin, S. A. Starostin, S. Li, S. A. Khan and V. Hessel, Chem. Eng. Sci., 2018, 178, 157–166 CrossRef CAS.
- A. L. Costa, M. Serantoni, M. Blosi, E. Mercadelli, L. Esposito, A. Piancastelli and A. Sanson, Adv. Eng. Mater., 2010, 12, 205–209 CrossRef CAS.
- P. Bruggeman, D. C. Schram, M. G. Kong and C. Leys, Plasma Processes Polym., 2009, 6, 751–762 CrossRef CAS.
- C. O. Laux, T. G. Spence, C. H. Kruger and R. N. Zare, Plasma Sources Sci. Technol., 2003, 12, 125 CrossRef CAS.
- L. Lin, S. Li, V. Hessel, S. A. Starostin, R. Lavrijsen and W. Zhang, AIChE J., 2018, 64, 1540–1549 CrossRef CAS.
- L. Mao, J. Chen, X. Zhang, M. Kwak, Y. Wu and R. Fan, Sci. Rep., 2017, 7, 46343 CrossRef CAS PubMed.
- T. Nakamura, Y. Yamada, H. Yamada and K. Yano, J. Mater. Chem., 2009, 19, 6699 RSC.
- S. Darwiche, M. Nikravech, S. Awamat, D. Morvan and J. Amouroux, J. Phys. D: Appl. Phys., 2007, 40, 1030–1036 CrossRef CAS.
- P. J. Bruggeman, M. J. Kushner, B. R. Locke, J. G. E. Gardeniers, W. G. Graham, D. B. Graves, R. C. H. M. Hofman-Caris, D. Maric, J. P. Reid, E. Ceriani, D. F. Rivas, J. E. Foster, S. C. Garrick, Y. Gorbanev, S. Hamaguchi, F. Iza, H. Jablonowski, E. Klimova, J. Kolb, F. Krcma, P. Lukes, Z. Machala, I. Marinov, D. Mariotti, S. M. Thagard, D. Minakata, E. C. Neyts, J. Pawlat, Z. L. Petrovic, R. Pflieger, S. Reuter, D. C. Schram, S. Schröter, M. Shiraiwa, B. Tarabová, P. A. Tsai, J. R. R. Verlet, T. von Woedtke, K. R. Wilson, K. Yasui and G. Zvereva, Plasma Sources Sci. Technol., 2016, 25, 053002 CrossRef.
- M. Aghazadeh and A. Ahmadi, Anal. Bioanal. Electrochem., 2017, 9, 469–479 CAS.
- R. Cheraghali and M. Aghazadeh, Anal. Bioanal. Electrochem., 2016, 8, 64–77 CAS.
- M. Aghazadeh, M. Hosseinifard, M. H. Peyrovi and B. Sabour, J. Rare Earths, 2013, 31, 281–288 CrossRef CAS.
- B. Malecka, A. Lacz, E. Drozdzd and A. Malecki, J. Therm. Anal. Calorim., 2015, 119, 1053–1061 CrossRef CAS.
- A. Kondo, H. Noguchi, S. Ohnishi, H. Kajiro, A. Tohdoh, Y. Hattori, W. C. Xu, H. Tanaka, H. Kanoh and K. Kaneko, Nano Lett., 2006, 6, 2581–2584 CrossRef CAS PubMed.
- M. Aghazadeh, T. Yousefi and M. Ghaemi, J. Rare Earths, 2012, 30, 236–240 CrossRef CAS.
- T. Sato, S. Imaeda and K. Sato, Thermochim. Acta, 1988, 133, 79–85 CrossRef CAS.
- Y. Xiao, D. Wu, Y. Jiang, N. Liu, J. Liu and K. Jiang, J. Alloys Compd., 2011, 509, 5755–5760 CrossRef CAS.
- D. Tu, Y. Liu, H. Zhu, R. Li, L. Liu and X. Chen, Angew. Chem., Int. Ed., 2013, 52, 1128–1133 CrossRef CAS PubMed.
- F. Mercier, C. Alliot, L. Bion, N. Thromat and P. Toulhoat, J. Electron Spectrosc. Relat. Phenom., 2006, 150, 21–26 CrossRef CAS.
- T. Gougousi and Z. Chen, Thin Solid Films, 2008, 516, 6197–6204 CrossRef CAS.
- C. Zhang and J. Y. Lee, ACS Nano, 2013, 7, 4393–4402 CrossRef CAS PubMed.
- A. P. Jadhav, A. U. Pawar, U. Pal and Y. S. Kang, J. Mater. Chem. C, 2014, 2, 496–500 RSC.
- Z. M. Chen, S. X. Jiang, R. H. Guo, B. J. Xin and D. G. Miao, Mater. Technol., 2014, 29, 198–203 CrossRef CAS.
- H. Guo and Y. M. Qiao, Opt. Mater., 2009, 31, 583–589 CrossRef CAS.
- T. Ninjbadgar, G. Garnweitner, A. Boärger, L. M. Goldenberg, O. V. Sakhno and J. Stumpe, Adv. Funct. Mater., 2009, 19, 1819–1825 CrossRef CAS.
- G. Pan, H. Song, X. Bai, L. Fan, H. Yu, Q. Dai, B. Dong, R. Qin, S. Li, S. Lu, X. Ren and H. Zhao, J. Phys. Chem. C, 2007, 111, 12472–12477 CrossRef CAS.
- B. K. Gupta, D. Haranath, S. Saini, V. N. Singh and V. Shanker, Nanotechnology, 2010, 21, 055607 CrossRef PubMed.
- D. S. Velasco, A. P. De Moura, A. N. Medina, M. L. Baesso, A. F. Rubira, M. Cremona and A. C. Bento, J. Phys. Chem. B, 2010, 114, 5657–5660 CrossRef CAS PubMed.
- J. Yang, C. Li, Z. Quan, C. Zhang, P. Yang, Y. Li, C. Yu and J. Lin, J. Phys. Chem. C, 2008, 112, 12777–12785 CrossRef CAS.
- B. T. Stone, V. C. Costa and K. L. Bray, AIChE J., 1997, 43, 2785–2792 CrossRef CAS.
- N. Reuge, B. Caussat, N. Joffin, J. Dexpert-ghys, M. Verelst and H. Dexpert, AIChE J., 2008, 54, 394–405 CrossRef CAS.
- W. D. Wu, R. Amelia, N. Hao, C. Selomulya, D. Zhao, Y.-L. Chiu and X. D. Chen, AIChE J., 2011, 57, 2726–2737 CrossRef CAS.
Footnote |
| † Electronic supplementary information (ESI) available: Electrical measurements, infrared absorption spectra, particle size distributions, SEM images, EDX result, element analysis and nanophosphor photographs. See DOI: 10.1039/c8re00357b |
| This journal is © The Royal Society of Chemistry 2019 |

