Dramatic impact of the lattice solvent on the dynamic magnetic relaxation of dinuclear dysprosium single-molecule magnets†
Wan-Ying
Zhang
 a,
Yi-Quan
Zhang
 b,
Shang-Da
Jiang
 c,
Wen-Bin
Sun
 *a,
Hong-Feng
Li
 a,
Bing-Wu
Wang
 *c,
Peng
Chen
 a,
Peng-Fei
Yan
 *a and
Song
Gao
 *c
*c
aKey Laboratory of Functional Inorganic Material Chemistry Ministry of Education, School of Chemistry and Material Science Heilongjiang University, 74 Xuefu Road, Harbin 150080, P. R. China. E-mail: wenbinsun@126.com; yanpf@vip.sina.com
bJiangsu Key Laboratory for NSLSCS, School of Physical Science and Technology, Nanjing Normal University, Nanjing 210023, P. R. China. E-mail: zhangyiquan@njnu.edu.cn
cBeijing National Laboratory of Molecular Science State Key Laboratory of Rare Earth Materials Chemistry and Applications, College of Chemistry and Molecular Engineering, Peking University, Beijing 100871, China. E-mail: wangbw@pku.edu.cn; gaosong@pku.edu.cn
First published on 2nd May 2018
Abstract
Two dinuclear dysprosium single-molecule magnets (SMMs) with a nearly identical core structure, namely [Dy2(DMOP)2(DBM)4(CHCl3)4] (1) and [Dy2(DMOP)2(DBM)4(C2H4Cl2)2] (2) (DMOP = 2,6-dimethoxyphenol, DBM = dibenzoylmethane), and their Y(III) (3) and Gd(III) (4) analogues were structurally and magnetically characterized. Despite the fact the phenoxyl of DMOP can only transfer weak exchange coupling and the local coordination environment around the individual Dy(III) ion is in a low geometrical symmetry, their joint contribution ultimately leads to significant zero-field slow magnetic relaxation behaviours. It is interesting to note that the effective energy barrier (Ueff) of the magnetization reversal was nearly doubly improved by only deliberately replacing or losing the lattice solvents while maintaining the Dy2 core structure. Ab initio calculations confirmed that changing the lattice solvents induced the intramolecular coupling change and impacted the dynamic magnetic relaxations. The significant enhancement of an SMM's performance depending on the lattice solvents indicated that it is possible to improve an SMM's properties by tuning the guest molecules.
Introduction
The large magnetic anisotropy of lanthanide(III) ions stem from strong spin–orbit coupling and a crystal field effect that makes 4f-based single-molecule magnets (SMMs) display significant slow magnetic relaxation behaviours with high energy barriers (Ueff) for the reversal of magnetization and the blocking temperature (TB).1 Their unique magnetic properties connecting the conventional and quantum world make SMMs good candidates for high-density information storage, quantum information processing, molecular spintronics and magnetic cooling applications.2 For lanthanide-based SMMs, the magnetic anisotropy mostly arises from the single-ion magnetic anisotropy due to the intrinsic shielded 4f electrons of lanthanide(III) ions.2e,f However, the slow magnetic relaxation is normally sensitive to the crystal field and/or ligand field as well as to the local symmetry surrounding the lanthanide(III) ion.3 This meanwhile provides an opportunity to fine-tune the slow magnetic relaxation through modulating the local symmetry and peripheral ligand field.4 A few reports have indicated that modulating the local symmetry and ligand field is effective to construct single-ion magnets (SIMs, mononuclear SMMs) with higher Ueff and TB;5 for instance an energy barrier beyond 1000 K in pentagonal bipyramidal Dy(III) SIM,6 and up to 60 K TB have been obtained in dysprosium metallocene [Dy(Cpttt)2][B(C6F5)4] (Cpttt = 1,2,4-tri(tert-butyl)cyclopentadienide).7 However, such a strategy has a finite ceiling of improvement due to the flexible coordination modes and high coordination numbers of lanthanide(III) ions, which usually result in a low axial coordination symmetry. In addition, the quantum tunnelling of magnetization (QTM), involving a fast relaxation through near-degenerate ground states, prevails in nearly all lanthanide SIMs and has become a serious factor impeding the development of lanthanide SMMs with a better performance. Clearly, considering both the local high axial symmetry and coupled spin is an effective strategy to improve the magnetic anisotropy.8 Appropriate intramolecular couplings have been proven to suppress QTM significantly9 and have exhibited predominant relaxation properties. High TB values of 14 K and 12 K were observed in a dinuclear Tb2 system bridged by an N3− radical10 and an Er2 complex sandwiched by multilayer COT (COT = cyclooctatetraenyl) and substituent COT.11 The bridging ligands play a crucial role in these systems. The radical approach is a successful way to obtain large laterally exchanged coupling interactions effectively between two lanthanide ions owing to the presence of an unpaired electron on the ligand. Alternatively, in the multilayer sandwich COT-Ln SMMs, the COT ligand could transfer the longitudinally coupling, offering a delocalized superexchange pathway. However, extending this methodology to larger molecules involving multiple metal centres/radicals and multilayer organometallic species is synthetically very difficult.12 In comparison, neutral organic bridges can transmit magnetic coupling, albeit a little weak, but sufficient to also influence the magnetic state of the ground and even excited state and consequently can change the magnetic relaxation of the whole molecule dramatically.13 The joint contribution of local symmetry and appropriate intramolecular coupling is highly promising to improve the performance of dinuclear lanthanide-based SMMs. Additionally, recently, a new chemical strategy for the construction of molecular nanomagnets by constraining the coordination symmetries around lanthanide centres within metal–organic frameworks (MOFs) was developed to tune the properties of SMMs.14 As a novel way to control and modulate the molecular magnetic anisotropy, the impact of guest molecules in MOFs and lattice solvents in crystals on the magnetic relaxation properties has attracted increasing attention,15 although such effects had already been pointed out before.16 We recently found that the ligand 2,6-dimethoxyphenol (DMOP) is a good candidate but has barely been used to construct dinuclear SMMs.17 Interestingly, a dramatic influence of the lattice solvents on the magnetic relaxation was observed, which is a potential factor to improve an SMM's performance. Herein, we report details on the preparations, structures and magnetic properties of two dinuclear dysprosium complexes with different lattice solvents, namely [Dy2(DMOP)2(DBM)4(CHCl3)4] (1) and [Dy2(DMOP)2(DBM)4(C2H4Cl2)2] (2).Results and discussion
Synthesis and characterization
Complexes 1 and 2 were synthesized as shown in Scheme 1. They were recrystallized from solvents CHCl3 and CH2ClCH2Cl as the guest molecule in lattices 1 and 2, respectively. Complexes 1 and 2 could transform to each other through losing their respective guest molecules and recrystallizing from the opponent solvent. Complex 1 crystallizes in the triclinic space group P![[1 with combining macron]](https://www.rsc.org/images/entities/char_0031_0304.gif) , with the molecular structure of 1 shown in Fig. 1. The asymmetric unit consists of one Dy(III) ion, one DMOP− ligand, two DBM− ligands and two lattice CHCl3 molecules. Each Dy(III) ion is surrounded by eight oxygen atoms belonging to two chelating DMOP− ligands and two DBM− ligands. The phenoxy oxygen of each ligand DMOP− adopts a μ-bridge mode between the two Dy(III) ions (Fig. 1, left). The local symmetry of Dy(III) ion was analyzed using the parameter S of the continuous-shape-measures (CShMs) method,18 which allowed us to quantify the degree of distortion of the coordination sphere (an S value equal to 0 corresponds to the perfect polyhedron, while a larger value indicates a greater deviation from the ideal geometry). The relatively large S values (Table S1, ESI†) indicate that the coordination environment of Dy(III) centres were in a low geometrical symmetry.
, with the molecular structure of 1 shown in Fig. 1. The asymmetric unit consists of one Dy(III) ion, one DMOP− ligand, two DBM− ligands and two lattice CHCl3 molecules. Each Dy(III) ion is surrounded by eight oxygen atoms belonging to two chelating DMOP− ligands and two DBM− ligands. The phenoxy oxygen of each ligand DMOP− adopts a μ-bridge mode between the two Dy(III) ions (Fig. 1, left). The local symmetry of Dy(III) ion was analyzed using the parameter S of the continuous-shape-measures (CShMs) method,18 which allowed us to quantify the degree of distortion of the coordination sphere (an S value equal to 0 corresponds to the perfect polyhedron, while a larger value indicates a greater deviation from the ideal geometry). The relatively large S values (Table S1, ESI†) indicate that the coordination environment of Dy(III) centres were in a low geometrical symmetry.
Complex 2 also crystallizes in the triclinic space group P![[1 with combining macron]](https://www.rsc.org/images/entities/char_0031_0304.gif) . The crystal structure and the local coordination geometry around Dy(III) ions were nearly identical to that of complex 1, except for the presence of two CH2ClCH2Cl instead of four CHCl3 molecules as the lattice solvent. Accordingly, the bond lengths of Dy–O and Dy–Dy in complex 2 were nearly the same as those in complex 1 (Table S2, ESI†). The intramolecular Dy1–Dy1′ distance and the average Dy–O distance were 3.8347(5) Å and 2.385(3) Å in 1, 3.8452(3) Å and 2.377(2) Å in 2, respectively. The atoms Dy1, Dy1′, O1 and O1′ were on a horizontal plane in both complexes 1 and 2, with only a slight difference in the angles (Table S2, ESI†) and the degree of distortion of the quadrilateral formed by two Dy and two phenoxy O atoms (Tables S2 and S3, ESI†). In complex 1, the O1–Dy1–O1′ angle was 67.34(12)° and the Dy1–O1–Dy1′ angle was 112.66(12)°, while the O1–Dy1–O1′ angle and Dy1–O1–Dy1′ angle were 66.68(7)° and 113.32(7)° respectively in 2. This means that complex 2 has a more inclined quadrilateral formed by Dy1, Dy1′, O1 and O1′ atoms. In addition, the S parameters of Dy(III) centres in 2 also displayed relatively large values (Table S1, ESI†) according to the ideal biaugmented trigonal prism. These values were nearly the same as those of 1 and also indicative of a low geometrical symmetry and obvious deviation from the ideal C2v symmetry.
. The crystal structure and the local coordination geometry around Dy(III) ions were nearly identical to that of complex 1, except for the presence of two CH2ClCH2Cl instead of four CHCl3 molecules as the lattice solvent. Accordingly, the bond lengths of Dy–O and Dy–Dy in complex 2 were nearly the same as those in complex 1 (Table S2, ESI†). The intramolecular Dy1–Dy1′ distance and the average Dy–O distance were 3.8347(5) Å and 2.385(3) Å in 1, 3.8452(3) Å and 2.377(2) Å in 2, respectively. The atoms Dy1, Dy1′, O1 and O1′ were on a horizontal plane in both complexes 1 and 2, with only a slight difference in the angles (Table S2, ESI†) and the degree of distortion of the quadrilateral formed by two Dy and two phenoxy O atoms (Tables S2 and S3, ESI†). In complex 1, the O1–Dy1–O1′ angle was 67.34(12)° and the Dy1–O1–Dy1′ angle was 112.66(12)°, while the O1–Dy1–O1′ angle and Dy1–O1–Dy1′ angle were 66.68(7)° and 113.32(7)° respectively in 2. This means that complex 2 has a more inclined quadrilateral formed by Dy1, Dy1′, O1 and O1′ atoms. In addition, the S parameters of Dy(III) centres in 2 also displayed relatively large values (Table S1, ESI†) according to the ideal biaugmented trigonal prism. These values were nearly the same as those of 1 and also indicative of a low geometrical symmetry and obvious deviation from the ideal C2v symmetry.
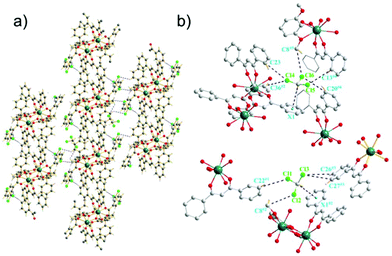
The Dy-DMOP units of complexes 1 and 2 were “stacked” along the crystallographic a-axis in a way depicted in Fig. 2 and Fig. S1 (ESI†), respectively. Hydrogen-bond interactions and π-bond interactions were found in both complexes and are marked in detail in Fig. 2, Fig. S2 and Table S4 (ESI†). The hydrogen bonds were mainly composed of a chlorine atom of CHCl3/CH2ClCH2Cl and a carbon atom of DBM and DMOP. The shortest intermolecular Dy⋯Dy distances between the neighbouring [DyDy] units for 1 and 2 were 10.6974(8) Å and 10.4264(4) Å, respectively, suggesting that the intermolecular dipole–dipole interaction could be negligible compared to the intramolecular interaction.
Despite complexes 1 and 2 possessing nearly the same core structures, a further close inspection of them showed their slightly different bond lengths and angles. These discrepancies were most likely due to the different lattice solvents, which influence the intermolecular stacking and consequently perturb the first coordination sphere, albeit they are remote from the spin centres.
In order to prepare the desolvated sample, complex 1 was placed in a vacuum oven maintained at 80 °C for drying for 24 h, with the corresponding TG analysis (Fig. S3 and S4, ESI†) confirming that the lattice solvent molecules had been completely removed, leading to [Dy2(DMOP)2(DBM)4] (de1). Unfortunately, the single-crystal X-ray diffraction data of de1 were not obtained for the crystal cracking upon drying. Alternatively, powder X-ray diffraction measurement was then performed on de1 and confirmed that the frame structure was maintained, albeit with the existence of a slightly different pattern compared with complex 1 (Fig. S5, ESI†), which was also found in other research studies and was mostly attributed to the release of the lattice solvents.19 Interestingly, the recrystallizing of complex de1 in CHCl3 solvent at room temperature could recover complex 1, as confirmed by X-ray diffraction measurements and TG analysis (Fig. S5 and S6, ESI†). These results show that the desolvation–resolvation process between 1 and de1 is reversible.
Magnetic behaviour and theoretical calculations
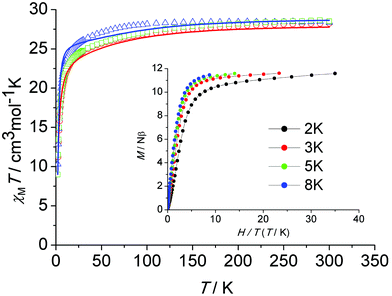
The thermal (T) dependence of the molar magnetic susceptibilities (χM) of all three samples were measured in an applied direct current (dc) field of H = 1000 Oe in the temperature range of 2–300 K. Fig. 3 shows the plots of χMT versus T for 1, 2 and de1. At room temperature, the χMT values were 28.24 (1), 28.38 (2) and 28.53 (de1) cm3 K mol−1, which were in good agreement with the theoretical value of 28.34 cm3 K mol−1 for two free Dy(III) ions (6H15/2, S = 5/2, L = 5, g = 4/3). Upon cooling, the χMT product decreased gradually, which was likely due to the thermal depopulation of the Dy(III) Stark sublevels and/or intermolecular antiferromagnetic behaviour. Below 30 K, the χMT product decreased significantly until 2 K, indicating a significant magnetic anisotropy of Dy(III)1c and/or weak intramolecular antiferromagnetic interactions through the phenoxy bridge. Plots of M versus H/T below 8 K for complex 1 (Fig. 3, inset) show a rapid increase in the magnetization at low fields. The magnetization reached a value of 11.6Nβ at 7 T at 2 K, which was much lower than the theoretical saturation value of 20Nβ for the Dy2 dimer. The field dependence of the magnetization for complexes 2 and de1 between 2 and 8 K are shown in Fig. S7–S9 (ESI†). The unsaturated magnetization together with the non-superposition of the M versus H/T curves suggest a large magnetic anisotropy and the presence of low lying excited states in this system.To explore the intramolecular magnetic interactions of these dinuclear complexes, magnetic measurements for the Gd(III) analogue (complex 4) were carried out. The magnetic properties were analyzed by spin Hamiltonian H = −JSGd1·SGd2, where J is the exchange coupling constant and SGd1 and SGd2 are the spin operators. The temperature dependence of the χMT product for complex 4 combined with a plot of χM−1vs. T is shown in Fig. S10 (ESI†). Least-squares fitting of the experimental data with eqn (S1)† leads to J = −0.035 cm−1 and g = 2.0 (R = 1.7 × 10⁻³, defined as ∑[(χMT)calc − (χMT)obs]2/∑[(χMT)obs]2). The temperature dependence of χM−1 obeys the Curie–Weiss law in the 50–300 K range (Fig. S11, ESI†) with the Curie constant C of 16.50 cm3 K mol−1 and Weiss constant θ of −2.2 K, indicating a weak antiferromagnetic interaction between the Gd(III) centres. This may be similar in Dy(III) complexes.
To gain further insights into the magnetic properties of our complexes, complete-active-space self-consistent field (CASSCF) based ab initio calculations were performed using MOLCAS 7.8.20 The total exchange coupling constants J (including dipolar Jdip and exchange Jex) and the pseudospin Ŝ = 1/2 of the Dy(III) ions were used in the calculations. The calculated and experimental magnetic susceptibilities of complexes 1 and 2 are shown in Fig. 3, where the fits are all close to the experimental data in the whole temperature range. The Dy(III)–Dy(III) interactions in the two complexes within Lines’ model21 were both antiferromagnetic. The best fit results gave Jex1 = −1.25 cm−1, Jdip1 = −2.77 cm−1 for complex 1 and Jex2 = −3.00 cm−1, Jdip2 = −2.51 cm−1 for complex 2. Accordingly, the overall antiferromagnetic exchange coupling J1 of −4.02 cm−1 for complex 1 was weaker than the J2 of −5.51 cm−1 for complex 2 (Table S5, ESI†).
To investigate the magnetization dynamics of the present systems, alternating current (ac) magnetic susceptibility measurements were performed on complex 1 in the temperature range 2–16 K under a zero dc field at frequencies between 1 and 1000 Hz (Fig. 4, upper figure and Fig. S1, ESI†). The out-of-phase (χ′′) component of the ac susceptibility (Fig. 4, upper figure) clearly exhibits temperature-dependent peaks with one maximum. Additionally, the frequency dependence of the maximum in association with a single relaxation process appears clearly on the plot of the χ′′ versus the frequency between 1 and 1000 Hz (Fig. 4, lower figure and Fig. S12, ESI†). The single relaxation mode in the frequency-dependent ac susceptibility is ascribed to there being only one crystallographically independent Dy(III) ion in the centrosymmetric complex.
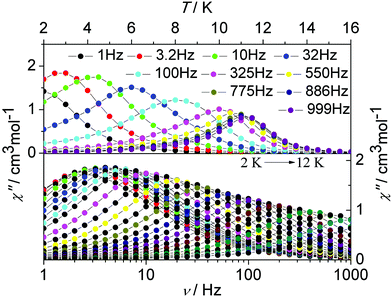 | ||
| Fig. 4 Temperature (up) and frequency v (down, logarithmic scale) dependence of out-of-phase (χ′′) ac susceptibility in the temperature range 2–16 K for 1 under a zero dc field. | ||
The graphical representation of χ′′ vs. χ′ (Cole–Cole plot)22 in the temperature range 2–12 K further confirmed the single thermally-activated relaxation process (Fig. 5, Table S6, ESI†). The data could be fitted using a generalized Debye model.23 For temperatures higher than 4 K, symmetric semicircles were obtained. The parameter α, indicating deviation from the pure Debye model, was lower than 0.2, which confirmed that the magnetization relaxed with a unique single characteristic time. In addition, as observed for the frequency-dependent ac susceptibility below 4 K, the antiferromagnetic interaction between the two Dy(III) ions resulted in a drop of the out-of-phase susceptibility,24,25χ′′, and a slight asymmetry in the Cole–Cole plot appears as well as an increased α value.
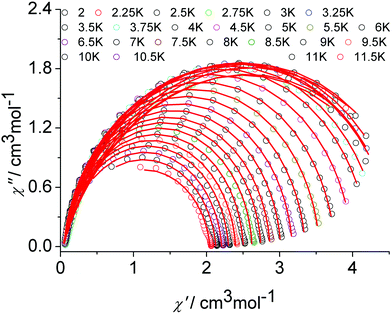 | ||
| Fig. 5 Cole–Cole (Argand) plot for 1 obtained using the ac susceptibility data. The solid lines correspond to the best fit obtained with a generalized Debye model under a zero dc field. | ||
The relaxation time was extracted and fitted to the Arrhenius law τ = τ0 exp(Ueff/kBT). The effective energy barrier (Ueff) and the pre-exponential factor (τ0) were obtained with Ueff/kB = 97.8 K (τ0 = 3.4 × 10⁻⁸ s) from the high-temperature regime (10–11 K) of the relaxation where it was thermally induced (Table 1 and Fig. 6).
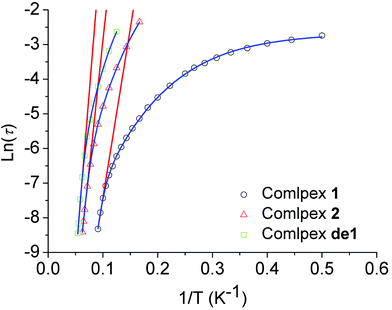 | ||
| Fig. 6 Plot of ln(τ) versus 1/T at a zero dc field for 1, 2 and de1. The red lines represent a pure Arrhenius fitting at the high-temperature linear region for 1, 2 and de1 at a zero dc field. The blue lines represent the fitting of the frequency-dependent data by eqn (1) for 1, 2 and de1 at a zero dc field. | ||
| Complex | U eff/kB [K] | τ 0 [s] |
|---|---|---|
| 1 | 97.8 | 3.4 × 10⁻⁸ |
| 2 | 147.2 | 2.3 × 10⁻⁸ |
| de1 | 194.0 | 6.0 × 10⁻⁹ |
In order to probe the impact of intramolecular interactions on the slow relaxation of the magnetization and the possible quantum tunnelling effects occurring in these SMMs, diluted samples of 1 were prepared in DyCl3·6H2O/YCl3·6H2O molar ratios of 1![[thin space (1/6-em)]](https://www.rsc.org/images/entities/char_2009.gif) :
:![[thin space (1/6-em)]](https://www.rsc.org/images/entities/char_2009.gif) 4, 1
4, 1![[thin space (1/6-em)]](https://www.rsc.org/images/entities/char_2009.gif) :
:![[thin space (1/6-em)]](https://www.rsc.org/images/entities/char_2009.gif) 9 and 1
9 and 1![[thin space (1/6-em)]](https://www.rsc.org/images/entities/char_2009.gif) :
:![[thin space (1/6-em)]](https://www.rsc.org/images/entities/char_2009.gif) 19 (1.0 mmol in total, instead of 1.0 mmol of DyCl3·6H2O) and labelled as 1a, 1b and 1c, respectively. The corresponding Y2 congener (complex 3) was isostructural with 1. As confirmed by single-crystal X-ray diffraction. Alternating current (ac) susceptibility measurements were performed on polycrystalline samples in the SQUID magnetometer. The temperature dependence of the ac susceptibility in the 2–16 K range was measured for all of the diluted samples at various frequencies and dc fields (Fig. 7, Fig. S13–S16, ESI†). The measurements on diluted Dy2 samples under a zero applied dc field exhibited clear temperature-dependent peaks below 16 K, indicating SMM behaviour. It is very interesting that they displayed different behaviours below 5 K; as can be seen in the data of the different diluted concentration sample under 100 Hz in Fig. 7 for comparison. A single maximum of peak was observed at ∼8 K for all samples, which was indicative of their same origin of slow magnetic relaxation; however, a tail of the temperature-dependent peak was observed for diluted samples below 5 K (Fig. 7, left). Such a tail of χ′′ is usually indicative of QTM via degenerate ±MJ energy levels.26–28 However, for most SMMs, the efficient suppression of QTM with the decreased χ′′ will be seen in the magnetic measurements of diluted samples, because the increased intermolecular distance leads to reduced magnetic dipole–dipole interactions that usually induce QTM.29 Whereas in this case, we observed the increase of χ′′ in diluted samples (Fig. S15, ESI†) and the intensity of the tail increased with the increasing percentage of Dy dilution in 1a, 1b and 1c, which is consistent with the increase in the major species YDy. This clearly demonstrates that the increasing tails of χ′′ seen in our system were related to the QTM process accompanying the single-ion relaxation behaviour of the [Dy–Y] component after decoupling the Dy–Dy interaction in diluted samples.27 Conversely, the QTM was negligible in the original undiluted sample with the intramolecular interaction, which revealed an effective suppression of the QTM of the intramolecular Dy–Dy coupling. A similar phenomenon has been observed in a few decoupling Dy2 SMM systems.9
19 (1.0 mmol in total, instead of 1.0 mmol of DyCl3·6H2O) and labelled as 1a, 1b and 1c, respectively. The corresponding Y2 congener (complex 3) was isostructural with 1. As confirmed by single-crystal X-ray diffraction. Alternating current (ac) susceptibility measurements were performed on polycrystalline samples in the SQUID magnetometer. The temperature dependence of the ac susceptibility in the 2–16 K range was measured for all of the diluted samples at various frequencies and dc fields (Fig. 7, Fig. S13–S16, ESI†). The measurements on diluted Dy2 samples under a zero applied dc field exhibited clear temperature-dependent peaks below 16 K, indicating SMM behaviour. It is very interesting that they displayed different behaviours below 5 K; as can be seen in the data of the different diluted concentration sample under 100 Hz in Fig. 7 for comparison. A single maximum of peak was observed at ∼8 K for all samples, which was indicative of their same origin of slow magnetic relaxation; however, a tail of the temperature-dependent peak was observed for diluted samples below 5 K (Fig. 7, left). Such a tail of χ′′ is usually indicative of QTM via degenerate ±MJ energy levels.26–28 However, for most SMMs, the efficient suppression of QTM with the decreased χ′′ will be seen in the magnetic measurements of diluted samples, because the increased intermolecular distance leads to reduced magnetic dipole–dipole interactions that usually induce QTM.29 Whereas in this case, we observed the increase of χ′′ in diluted samples (Fig. S15, ESI†) and the intensity of the tail increased with the increasing percentage of Dy dilution in 1a, 1b and 1c, which is consistent with the increase in the major species YDy. This clearly demonstrates that the increasing tails of χ′′ seen in our system were related to the QTM process accompanying the single-ion relaxation behaviour of the [Dy–Y] component after decoupling the Dy–Dy interaction in diluted samples.27 Conversely, the QTM was negligible in the original undiluted sample with the intramolecular interaction, which revealed an effective suppression of the QTM of the intramolecular Dy–Dy coupling. A similar phenomenon has been observed in a few decoupling Dy2 SMM systems.9
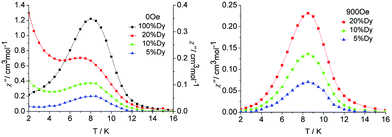 | ||
| Fig. 7 Temperature dependence of the out-of-phase susceptibility (χ′′) at 100 Hz and applied fields of (left) 0, and (right) the optimum field 900 Oe for the diluted samples 1a, 1b and 1c. | ||
In order to reduce the QTM usually found in mononuclear lanthanide SMMs, one efficient way is by applying a static dc field to remove the degeneracy of the ±MJ energy levels, consequently preventing the tunnelling of electrons from the +MJ state to the −MJ state. To fully suppress the tunnelling effects, optimum dc field measurements were carried out at 2 K and optimum fields of 900 Oe were found for 5%, 10% and 20% Dy(III) dilution (Fig. S16 and S17, ESI†). Subsequent ac measurements were carried out under the optimum field 900 Oe (Fig. 7, right). A clear single relaxation peak without the presence of a tail was observed in the out-of-phase susceptibility plots, which confirmed the effective suppression of QTM. The intensities of the peaks gave an indication that the major species present in the diluted samples was the YDy complex.
In order to probe the impact of the lattice solvents on their dynamic magnetic relaxations, we carried out magnetic measurements on the desolvated sample de1 (Fig. 8, Fig. S18, ESI†). It was interesting to find that they displayed significantly different magnetic relaxation behaviours. For de1, the ac magnetic susceptibility data collected under a zero applied dc field showed that the temperature-dependent χ′′ peaks appear at a higher temperature of 19 K (Fig. 8). The effective energy barrier was nearly doubly improved to Ueff/kB = 194.0 K compared to 97.8 K for 1. To understand this result, ac magnetic measurements were carried out under a zero applied dc field on the diluted de1 similar with 1, denoted as de1b (Fig. S19 and S20, ESI†). Indeed, a similar SMM behaviour was observed for de1b, which indicated their same origins of slow magnetic relaxation (Fig. 10). In other words, for both diluted and undiluted samples, the effective energy barrier could be enhanced by a factor of about two after desolvation. In addition, compared to de1, a pronounced QTM at low temperature was observed in the diluted samples, like aforementioned found in 1 and 1b. The different magnetization relaxation behaviours of 1 and de1 could most likely be attributed to the loss/gain of the crystallization solvent, which probably induces a subtle structural rearrangement around Dy(III) ions,30 albeit the lattice solvent did not link to the Dy(III) centres directly.
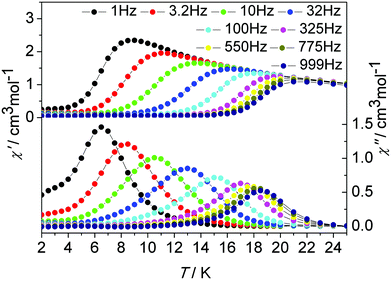 | ||
| Fig. 8 Temperature dependence of the in-phase χ′ and out-of-phase χ′′ ac susceptibility signals under a zero dc field for de1. | ||
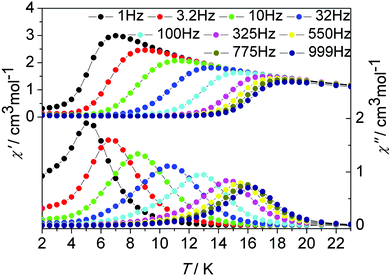 | ||
| Fig. 9 Temperature dependence of the in-phase (χ′) and out-of-phase (χ′′) ac susceptibility signals under zero dc field for 2. | ||
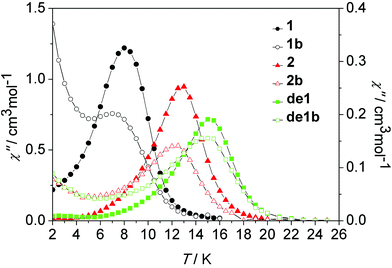 | ||
| Fig. 10 Temperature dependence of the out-of-phase susceptibility (χ′′) at 100 Hz under a zero dc field for 1, 1b, 2, 2b, de1 and de1b. | ||
Although our attempt to obtain the crystal structure of de1 ultimately failed, complex 2 with a replaced solvent CH2ClCH2Cl was prepared successfully. Its geometrical structures and magnetic properties were characterized and comparably studied. Complexes 1 and 2 are isostructural with very similar core structures of the dinuclear Dy2 moiety; however, the lattice solvents induce slightly structural differences, and indeed lead to a dramatically distinct dynamic magnetic relaxation. The ac magnetic susceptibilities of complex 2 were measured in the temperature range 2–23 K under a zero dc field at frequencies between 1 and 1000 Hz (Fig. 9 and Fig. S21, ESI†). The χ′′ peaks could be observed at a higher temperature of near 17 K, compared to 11 K for complex 1, and close to that found in complex de1 (Fig. 9, 10 and Fig. S21–S23, ESI†). The effective energy barrier of complex 2 extracted from Arrhenius law was Ueff/kB = 147.2 K (14–16 K, τ0 = 2.3 × 10⁻⁸ s; Table 1, Fig. 5 and Fig. S21, ESI†).
As shown in Fig. 10, nearly identical χ′′ peaks under the same frequency between the diluted and undiluted samples of 1 and 2 series were observed, respectively, which was indicative of their pure and same molecular origin of magnetic relaxations. The increasing tails at a low temperature regime for the diluted systems of 1 and 2 reveal a pronounced QTM occurring after intramolecular decoupling of the exchange interaction. The Dy–Dy coupling plays a critical role in suppressing QTM. The impact of lattice solvents on their dynamic magnetic relaxations was also very apparent. Under the same 100 Hz, the observed χ′′ peak at 8 K of 1 increased to 15 K for de1 and 13 K for 2, accompanying the increasing energy barriers (Table 1).
In addition, the plots of ln(τ) versus 1/T under a zero dc field exhibited an obvious curvature, which has been observed in few SIMs31 and indicates that perhaps other relaxation pathways are also operative, so the Ueff values of these samples 1, 2 and de1 were obtained by fitting the magnetic data with eqn (1). The fits with eqn (1) were in good agreement with the data over the whole temperature regime with Ueff/kB = 157.2 K, τ0 = 2.5 × 10⁻⁶ s for 1; Ueff/kB = 190.8 K, τ0 = 2.0 × 10⁻⁹ s for 2 and Ueff/kB = 258.4 K, τ0 = 2.4 × 10⁻¹⁰ s for de1 (Fig. 5 and Table S7, ESI†). These results once again prove that the Ueff of de1 is nearly twice as large as that of 1 and the Ueff value also increased from 1 to 2.
1/τ = 1/τQTM + CTn + τ0−1![[thin space (1/6-em)]](https://www.rsc.org/images/entities/char_2009.gif) exp(−Ueff/κT) exp(−Ueff/κT) | (1) |
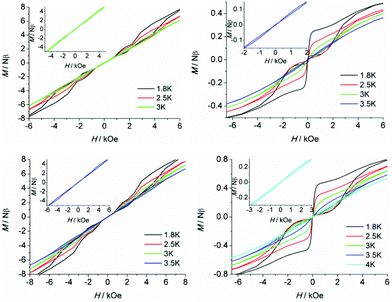
To further probe the dynamic magnetic properties, hysteresis loop measurements were carried out over the 1.8–4 K temperature range for samples 1, 1b, 2, 2b, de1 and de1b (Fig. 11 and 12). Complex 1 did not show a hysteresis loop (Fig. 11) at 1.8 K. However, the M versus H plot for the diluted sample of 1b with the Y![[thin space (1/6-em)]](https://www.rsc.org/images/entities/char_2009.gif) :
:![[thin space (1/6-em)]](https://www.rsc.org/images/entities/char_2009.gif) Dy molar ratio of 1
Dy molar ratio of 1![[thin space (1/6-em)]](https://www.rsc.org/images/entities/char_2009.gif) :
:![[thin space (1/6-em)]](https://www.rsc.org/images/entities/char_2009.gif) 9 displayed a butterfly-shaped hysteresis loop at 1.8 K under a sweep rate of 200 Oe s−1 (Fig. 11, right). Upon raising the temperature, the openings in the hysteresis of complex 1b become narrow and then nearly closed at 2.5 K. The opening of the hysteresis loop after the dilution of 1 indicated that the intermolecular magnetic dipole–dipole interactions play a significant role in the dynamic relaxation and suggests that the memory effect mainly comes from the magnetic relaxation of a single Dy(III) ion. A large thermal barrier and considerably slower tunnelling rate were observed with the de1 sample; therefore an expected “S-shaped” hysteresis was observed with a large opening, even when the temperature reached up to 3.5 K (Fig. 12, bottom left). The tunnel resonance step at H = ±0.3 T could be clearly observed, which corresponded to an exchange-bias field associated with a spin flip of the antiferromagnetically coupled Dy(III) spins. Conversely, in the case of the de1b sample (Fig. 12, bottom right), only one large step under a zero field was observed, which was responsible for the zero-field tunnelling. This is consistent with the phenomenon often observed in lanthanide systems.32 The decreased step at ∼0.3 T was the result of a decoupling system associated with the presence of YDy species in diluted samples. As expected, complex 2 with a relatively higher Ueff showed a significantly increased hysteresis temperature compared with 1, and the opening of hysteresis for 2 was retained until the temperature of 3 K (Fig. 12, top left). Similarly, there was only one large step under a zero field in the case of the diluted 2b sample (Fig. 12, top right), which stemmed from the decoupling system with the decreasing exchange-biased interaction. It is worth mentioning that the diluted samples of 1, 2 and de1 resulted in a higher (0.5 K increase) hysteresis temperature compared to the undiluted samples. This was attributed to the larger intermolecular separation in the diluted samples, which consequently reduced the dipole–dipole interactions usually favouring QTM.
9 displayed a butterfly-shaped hysteresis loop at 1.8 K under a sweep rate of 200 Oe s−1 (Fig. 11, right). Upon raising the temperature, the openings in the hysteresis of complex 1b become narrow and then nearly closed at 2.5 K. The opening of the hysteresis loop after the dilution of 1 indicated that the intermolecular magnetic dipole–dipole interactions play a significant role in the dynamic relaxation and suggests that the memory effect mainly comes from the magnetic relaxation of a single Dy(III) ion. A large thermal barrier and considerably slower tunnelling rate were observed with the de1 sample; therefore an expected “S-shaped” hysteresis was observed with a large opening, even when the temperature reached up to 3.5 K (Fig. 12, bottom left). The tunnel resonance step at H = ±0.3 T could be clearly observed, which corresponded to an exchange-bias field associated with a spin flip of the antiferromagnetically coupled Dy(III) spins. Conversely, in the case of the de1b sample (Fig. 12, bottom right), only one large step under a zero field was observed, which was responsible for the zero-field tunnelling. This is consistent with the phenomenon often observed in lanthanide systems.32 The decreased step at ∼0.3 T was the result of a decoupling system associated with the presence of YDy species in diluted samples. As expected, complex 2 with a relatively higher Ueff showed a significantly increased hysteresis temperature compared with 1, and the opening of hysteresis for 2 was retained until the temperature of 3 K (Fig. 12, top left). Similarly, there was only one large step under a zero field in the case of the diluted 2b sample (Fig. 12, top right), which stemmed from the decoupling system with the decreasing exchange-biased interaction. It is worth mentioning that the diluted samples of 1, 2 and de1 resulted in a higher (0.5 K increase) hysteresis temperature compared to the undiluted samples. This was attributed to the larger intermolecular separation in the diluted samples, which consequently reduced the dipole–dipole interactions usually favouring QTM.
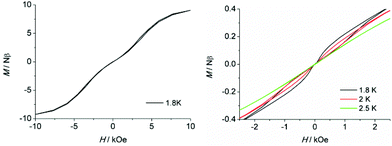 | ||
| Fig. 11 Field dependence of the normalized magnetization of samples 1 (left) and 1b (right) between 1.8 and 2.5 K at a sweep rate of 200 Oe s−1. | ||
The magnetic coupling interaction constant J could also be obtained by a method based on the Zeeman effect. Considering that the steps on the hysteresis curves are the consequence of a level-crossing between the ground state and the first excited state of the dimer, eqn (2) could be applied to calculate the J values.33
| Hcross = −J/2gβ | (2) |
The first derivative of magnetization revealed that the crossing field of 2 was 2.9 kOe (Fig. S24 and 25, ESI†). Thus, J2 was obtained as −5.3 cm−1 when g = gz = 19.778, which is well consistent with the above-mentioned results obtained via ab initio calculations (Table S8, ESI†).
The loss/gain and replacement of the crystallization solvents in samples 1, de1 and 2 could lead to significant different magnetic properties, albeit they did not ligate to Dy(III) directly. This was most likely due to the subtle structural changes induced by the different packing structures through hydrogen bonds or π–π interactions.34,35 The main difference between the crystal structures of 1 and 2 arises from the unbonded solvent molecules within the lattice. Recent studies have indicated that non-bonded co-crystallized solvent molecules could influence directly the structural environment of the spin centre, which may have a dramatic impact on the dynamic magnetic relaxations in a few transition metal- or lanthanide-based SMMs or MOF-type SMMs.15,36 For lanthanide-based SMMs, an extreme sensitivity of the dynamic relaxation to the coordination environmental, even remote from the first coordination sphere, was indeed observed.37,38
Although the lattice solvent did not coordinate to the Dy(III) centre directly, a slight difference in coordination surrounding the Dy(III) ions could be observed, as aforementioned in the structural analysis. As shown in Fig. S26 (ESI†), the first coordination spheres of 1 and 2 overlap well, but some peripheral fragments beyond the first coordination sphere indeed show a non-negligible difference, such as the methyl of the methoxyl on DMOP and the benzene rings of the peripheral β-diketonate ligands, which leads to different O–Dy–O angles with a range of 0.01°–3.38° in the first coordination sphere (Table S2, ESI†). These differences were most likely due to the different intermolecular stacking caused by the different lattice solvents with hydrogen bonds and might be responsible for their different magnetic relaxations.30
Further insights into the electronic structure and magnetic blocking in the present dysprosium complexes were obtained via ab initio calculations. Generally, the effective relaxation barrier of an Orbach process is comparable with the energy difference of the ground and first excited states. CASSCF calculations on two types of individual Dy(III) fragments for each of complexes 1 and 2 on the basis of X-ray determined geometries were carried out with MOLCAS 7.820 and SINGLE_ANISO39 programs (Fig. S28 and see computation details in the ESI†). The lowest spin–orbit energies and the effective g tensors of the ground Kramer's doublets on the dysprosium sites as strongly axial for complexes 1 and 2 are shown in Table S9 (ESI†). The calculated gz values of the Dy(III) fragments of 1 and 2 were close to 20 (gz = 19.769 for 1 and gz = 19.778 for 2), which show that the Dy(III)–Dy(III) exchange interactions for each of them can be approximately regarded as an Ising type. However, complex 1 has a larger transverse anisotropy component than 2 as indicated by the calculated gx, gy values of 0.008, 0.028 for 1 and 0.004, 0.016 for 2, respectively. In particular, the magnetic axiality (gZ/gX,Y) of the ground state for 2 is almost one order larger than that for 1, which might be the source of their different magnetic relaxation behaviours.13c In addition, the obtained energy gaps at 153.6 K (106.7 cm−1) and 193.4 K (134.3 cm−1) between the ground and the first excited states in 1 and 2 were close to the values fitted with eqn (1) over the whole temperature regime. The main magnetic axes on two Dy(III) of each complex are parallel and opposite, as indicated in Fig. S28 (ESI†), where the magnetic axes on Dy(III) for the two complexes had similar directions. We also give the exchange energies and the main values of gz for the lowest two exchange doublets of two complexes in Table S10 (ESI†). The gz values of the ground exchange states for all the complexes were equal to 0, which confirmed that the Dy(III)–Dy(III) couplings were antiferromagnetic. The simulated main magnetic axes of Dy ions in each complex are depicted in Fig. S29 (ESI†). The Dy–Dy magnetization axis formed an angle of 79.4° with the line of Dy–Dy direction for complex 1, which was larger than the angle of 76.8° for complex 2. Moreover, in complex 1, the magnetization axis formed an angle of 4.2° with the plane (O1–Dy1–O1′) and an angle of 16.7° with the equatorial plane (O1–O1′–O2′–O3–O5), which, respectively, were 3.6° and 14.3° in complex 2. The angles between the equatorial plane (O1–O1′–O2′–O3–O5) and the vertical plane (O4–O6–O7) were 84.4° and 87.0° for 1 and 2, respectively (Fig. S29, ESI†). These results indicate that the orientation of the magnetization axis is closer to the orientation of Dy–Dy in complex 2 than that in complex 1. Consequently, complex 2 has a stronger intramolecular antiferromagnetic interaction as aforementioned and displays a more remarkable SMM behaviour.
Conclusions
We have shown that the magnetic anisotropy of a dinuclear dysprosium complex [Dy2(DMOP)2(DBM)4(CHCl3)4] (1) can be significantly improved by removing the lattice CHCl3 molecule or by replacing it with CH2ClCH2Cl providing [Dy2(DMOP)2(DBM)4(C2H4Cl2)2] (2). Further studies on the dynamic magnetic relaxation processes of these complexes and their diluted samples indicated that the slow magnetic relaxations were mostly derived from the single-ion anisotropy. Interestingly, a dramatic increase in Ueff and the hysteresis temperature could be realized by only releasing or replacing the unbonded solvent molecules. This experimental observation provides new insight for designing lanthanide-based SMMs, which could be obtained by manipulating the guest molecules either in low dimensional systems or MOF materials. Meanwhile, it should be noted that the SMMs with solvent molecules should be treated with caution in magnetic measurements owing to the possible influence on their dynamic relaxation.Experimental section
General information
All the solvents were used as received without further purification. Other chemicals were commercially available and generally used as supplied. Elemental (C and H) analyses were performed with a PerkinElmer 2400 analyzer.Single-crystal X-ray diffraction
Crystal data for complexes 1–4 were collected on a Xcalibur, Eos, Gemini diffractometer with Mo Kα radiation (λ = 0.71073 Å). Complexes 1, 3 and 4 were collected at 293(2) K, while 2 was collected at 180(2) K. The structures of complexes 1–4 were solved by direct methods and refined on F2 by full-matrix least-squares using the SHELXTL-2014 program and Olex2.40 All non-hydrogen atoms were refined with isomorphous displacement parameters. All crystallographic data for complexes 1–4 are summarized in Table 2, and selected bond lengths and angles for complexes 1 and 2 are tabulated in Table S2 (ESI†).| Complex | 1 | 2 | 3 | 4 |
|---|---|---|---|---|
| a R 1 = ∑||Fo| − |Fc||/∑|Fo|. b wR2 = ∑[w(Fo2 − Fc2)2]/∑[w(Fo2)2]1/2. | ||||
| Empirical formula | C80H66Cl12Dy2O14 | C80H70Cl4Dy2O14 | C80H66Cl12Y2O14 | C80H66Cl12Gd2O14 |
| FW (g mol−1) | 2001.73 | 1722.16 | 1854.55 | 1991.23 |
| Crystal system | Triclinic | Triclinic | Triclinic | Triclinic |
| Space group |
P![[1 with combining macron]](https://www.rsc.org/images/entities/char_0031_0304.gif) |
P![[1 with combining macron]](https://www.rsc.org/images/entities/char_0031_0304.gif) |
P![[1 with combining macron]](https://www.rsc.org/images/entities/char_0031_0304.gif) |
P![[1 with combining macron]](https://www.rsc.org/images/entities/char_0031_0304.gif) |
| Temperature (K) | 293(2) | 180(2) | 293(2) | 293 |
| a (Å) | 11.7531(9) | 11.4039(3) | 11.7403(7) | 11.765 |
| b (Å) | 13.8438(10) | 13.0199(5) | 13.8267(8) | 13.856 |
| c (Å) | 13.9872(7) | 13.9897(5) | 13.9874(9) | 14.010 |
| α (°) | 102.801(6) | 70.393(3) | 103.008(5) | 102.87 |
| β (°) | 91.679(5) | 71.631(3) | 92.037(5) | 91.29 |
| γ (°) | 108.946(7) | 75.913(3) | 108.773(5) | 108.64 |
| V (Å3) | 2086.3(2) | 1834.87(12) | 2080.2(2) | 2098.7 |
| ρ cacd (Mg m−3) | 1.593 | 1.559 | 1.480 | 1.575 |
| μ (mm−1) | 2.222 | 2.231 | 1.834 | 2.008 |
| F(000) | 994 | 862 | 940 | 990.0 |
| Independent relections | 10![[thin space (1/6-em)]](https://www.rsc.org/images/entities/char_2009.gif) 517 517 |
9451 | 9412 | 9287 |
| R int | 0.0384 | 0.0350 | 0.0330 | 0.0328 |
| R 1 [I > 2σ(I)] | 0.0498 | 0.0348 | 0.0630 | 0.0431 |
| wR2b (all data) | 0.1236 | 0.0694 | 0.1707 | 0.1166 |
| Goodness of fit on F2 | 1.030 | 1.092 | 1.025 | 1.082 |
| CCDC numbers | 1411817 | 1411818 | 1413255 | 1413256 |
Powder X-ray crystallography
Powder X-ray data were recorded at room temperature on a Bruker D8 diffractometer using Cu Kα (λ = 1.5406 Å) radiation. The accelerating voltage and the applied current were 40 kV and 20 mA, respectively.Magnetic measurements
The magnetic susceptibilities of the complexes were measured using a Quantum Design VSM superconducting quantum interference device (SQUID) magnetometer. Data were corrected for the diamagnetism of the samples using Pascal constants and the sample holder by measurement.Synthesis of [Dy2(DMOP)2(DBM)4(CHCl3)4] (1) and [Dy2(DMOP)2(DBM)4(C2H4Cl2)2] (2)
To a stirred solution of 1,3-diphenylpropane-1,3-dione (DBM) (0.449 g, 2.0 mmol) and 2,6-dimethoxyphenol (DMOP) (0.154 g, 1.0 mmol) in 22 mL of EtOH, an alcoholic solution (10 mL) of sodium hydroxide (0.120 g, 3.0 mmol) was added dropwise, resulting in a black solution. After that an alcoholic solution (7.5 mL) of DyCl3·6H2O (0.377 g, 1.0 mmol) was added dropwise to the above solution, resulting in a brown precipitate. The reaction mixture was refluxed and stirred for a further period of 4 h and was then cooled and filtered. The residue obtained was washed with water and ethyl alcohol. And then, after drying at 50 °C under vacuum conditions, we obtained a grey powder. Yield: 0.568 g. The powder was dissolved in CHCl3 and 1,2-dichloroethane (C2H4Cl2), respectively, and kept for crystallization under slow evaporation conditions. After 3–4 days, pure yellowish crystals of 1 and 2 were obtained and collected. For 1, yield: 0.382 g (51.2%). Elemental analysis (wt%) calcd for C80H66Cl12Dy2O14: C 47.98, H 3.30; found: C 48.01, H 3.26. For 2, yield: 0.297 g (46.3%). Elemental analysis (wt%) calcd for C80H70Cl4Dy2O14: C 55.78, H 4.07; found: C 55.80, H 4.16.Synthesis of [Y2(DMOP)2(DBM)4(CHCl3)4] (3)
The preparation of this complex followed the same procedure as for 1 except that YCl3·6H2O (0.303 g, 1.0 mmol) was used as the starting material instead of DyCl3·6H2O. We obtained a grey powder. Yield: 0.503 g. The powder was dissolved in CHCl3, and kept for crystallization under slow evaporation conditions. After 3–4 days, pure yellowish crystals of 3 were obtained and collected. Yield: 0.343 g (50.6%). Elemental analysis (wt%) calcd for C80H66Cl12Y2O14: C 51.78, H 3.56; found: C 51.81, H 3.65.Synthesis of [Gd2(DMOP)2(DBM)4(CHCl3)4] (4)
The preparation of this complex followed the same procedure as for 1 except that GdCl3·6H2O (0.372 g, 1.0 mmol) was used as the starting material instead of DyCl3·6H2O. We obtained a grey powder. Yield: 0.551 g. The powder was dissolved in CHCl3, and kept for crystallization under slow evaporation conditions. After 3–4 days, pure yellowish crystals of 4 were obtained and collected. Yield: 0.390 g (52.6%). Elemental analysis (wt%) calcd for C80H66Cl12Gd2O14: C 48.21, H 3.31; found: C 48.18, H 3.25.Procedure for the synthesis of the diluted samples of complex 1, which are labelled as 1a, 1b and 1c
These diluted complexes were prepared by following the same method as that for 1 but here we used DyCl3·6H2O/YCl3·6H2O (0.1 mmol in total, in a 1![[thin space (1/6-em)]](https://www.rsc.org/images/entities/char_2009.gif) :
:![[thin space (1/6-em)]](https://www.rsc.org/images/entities/char_2009.gif) 4, 1
4, 1![[thin space (1/6-em)]](https://www.rsc.org/images/entities/char_2009.gif) :
:![[thin space (1/6-em)]](https://www.rsc.org/images/entities/char_2009.gif) 9, 1
9, 1![[thin space (1/6-em)]](https://www.rsc.org/images/entities/char_2009.gif) :
:![[thin space (1/6-em)]](https://www.rsc.org/images/entities/char_2009.gif) 19 moral ratio respectively) instead of 1.0 mmol of DyCl3·6H2O. Specific details of each reaction and the characterization data of the products obtained are given below.
19 moral ratio respectively) instead of 1.0 mmol of DyCl3·6H2O. Specific details of each reaction and the characterization data of the products obtained are given below.
Synthesis of [Y1.6Dy0.4(DMOP)2(DBM)4(CHCl3)4] (1a)
Quantities: DBM (0.449 g, 2.0 mmol), DMOP (0.154 g, 1.0 mmol), NaOH (0.120 g, 3.0 mmol) DyCl3·6H2O (0.075 g, 0.2 mmol) and YCl3·6H2O (0.243 g, 0.8 mmol). The grey powder yield: 0.508 g and yellowish crystals yield 0.344 g (50.5%). Elemental analysis (wt%) calcd for C80H66Cl12Y1.6Dy0.4O14: C 50.98, H 3.50; found: C 51.21, H 3.45.Synthesis of [Y1.8Dy0.2(DMOP)2(DBM)4(CHCl3)4] (1b)
Quantities: DBM (0.449 g, 2.0 mmol), DMOP (0.154 g, 1.0 mmol), NaOH (0.120 g, 3.0 mmol) DyCl3·6H2O (0.038 g, 0.1 mmol) and YCl3·6H2O (0.273 g, 0.9 mmol). The grey powder yield: 0.500 g and yellowish crystals yield 0.337 g (50.2%). Elemental analysis (wt%) calcd for C80H66Cl12Y1.8Dy0.2O14: C 51.38, H 3.53; found: C 51.61, H 3.37.Synthesis of [Y1.9Dy0.1(DMOP)2(DBM)4(CHCl3)4] (1c)
Quantities: DBM (0.449 g, 2.0 mmol), DMOP (0.154 g, 1.0 mmol), NaOH (0.120 g, 3.0 mmol) DyCl3·6H2O (0.019 g, 0.05 mmol) and YCl3·6H2O (0.289 g, 0.95 mmol). The grey powder yield: 0.498 g and yellowish crystals yield 0.332 g (49.5%). Elemental analysis (wt%) calcd for C80H66Cl12Y1.9Dy0.1O14: C 51.58, H 3.55; found: C 51.11, H 3.49.Synthesis of the diluted sample [Y1.8Dy0.2(DMOP)2(DBM)4(C2H4Cl2)2] of complex 2, which is labelled as 2b
This diluted complex was prepared by following the same method as that for 2 but here we used DyCl3·6H2O (0.038 g, 0.1 mmol)/YCl3·6H2O (0.273 g, 0.9 mmol) (1.0 mmol in total, in a 1![[thin space (1/6-em)]](https://www.rsc.org/images/entities/char_2009.gif) :
:![[thin space (1/6-em)]](https://www.rsc.org/images/entities/char_2009.gif) 9 moral ratio) instead of 1.0 mmol of DyCl3·6H2O. We obtained a grey powder. Yield: 0.500 g. The powder was dissolved in 1,2-dichloroethane, and kept for crystallization under slow evaporation conditions. After 3–4 days, pure yellowish crystals of 2b were obtained and collected. Yield: 0.283 g (49.2%). Elemental analysis (wt%) calcd for C80H70Cl4Y1.8Dy0.2O14: C 60.43, H 4.41; found: C 60.39, H 4.34.
9 moral ratio) instead of 1.0 mmol of DyCl3·6H2O. We obtained a grey powder. Yield: 0.500 g. The powder was dissolved in 1,2-dichloroethane, and kept for crystallization under slow evaporation conditions. After 3–4 days, pure yellowish crystals of 2b were obtained and collected. Yield: 0.283 g (49.2%). Elemental analysis (wt%) calcd for C80H70Cl4Y1.8Dy0.2O14: C 60.43, H 4.41; found: C 60.39, H 4.34.
Synthesis of solvent-free sample [Dy2(DMOP)2(DBM)4] of complex 1, which is labelled as de1
To maintain complex 1 at 80 °C for 24 h under vacuum conditions, the lattice solvent molecule was almost completely removed leading to complex [Dy2(DMOP)2(DBM)4] (de1). Elemental analysis (wt%) calcd for C76H62Dy2O14: C 59.88, H 4.07; found: C 59.91, H 4.15.Synthesis of the diluted and solvent-free sample [Y1.8Dy0.2(DMOP)2(DBM)4] of complex de1, which is labelled as de1b
To maintain complex 1b at 80 °C for 24 h under vacuum conditions, the lattice solvent molecule was almost completely removed leading to complex [Y1.8Dy0.2(DMOP)2(DBM)4] (de1b). Elemental analysis (wt%) calcd for C76H62Y1.8Dy0.2O14: C 65.59, H 4.46; found: C 65.60, H 4.52.Conflicts of interest
There are no conflicts to declare.Acknowledgements
This work was supported by the NSFC (21621061, 21290171, 21571008 and 21572048), BJSFC (2122023) and National Key R&D Program of China (2017YFA0206301, 2017YFA0204903), the BNLMS (20140108), and the Heilongjiang Province (1254G045, 12541639), Heilongjiang University (JCL201605, 2017230101001473) and Natural Science Foundation of Jiangsu Province of China (BK20151542).Notes and references
- (a) N. Ishikawa, M. Sugita, T. Ishikawa, S. Koshihara and Y. Kaizu, J. Am. Chem. Soc., 2003, 125, 8694 CrossRef PubMed; (b) S. Takamatsu, T. Ishikawa, S. Koshihara and N. Ishikawa, Inorg. Chem., 2007, 46, 7250 CrossRef PubMed; (c) J. Long, F. Habib, P. H. Lin, I. Korobkov, G. Entight, L. Ungur, W. Wernsdorfer, L. F. Chibotaru and M. Murugesu, J. Am. Chem. Soc., 2011, 133, 5319 CrossRef PubMed; (d) J.-L. Liu, Y.-C. Chen, Y.-Z. Zheng, W.-Q. Lin, L. Ungur, W. Wernsdorfer, L. F. Chibotaru and M.-L. Tong, Chem. Sci., 2013, 4, 3310 RSC; (e) P. Zhang, L. Zhang, C. Wang, S. Xue, S.-Y. Lin and J. Tang, J. Am. Chem. Soc., 2014, 136, 4484 CrossRef PubMed; (f) D.-D. Yin, Q. Chen, Y.-S. Meng, H.-L. Sun, Y.-Q. Zhang and S. Gao, Chem. Sci., 2015, 6, 3095 RSC; (g) W.-B. Sun, P.-F. Yan, S.-D. Jiang, B.-W. Wang, Y.-Q. Zhang, H.-F. Li, P. Chen, Z.-M. Wang and S. Gao, Chem. Sci., 2016, 7, 684 RSC; (h) S. G. McAdams, A.-M. Ariciu, A. K. Kostopoulos, J. P. S. Walsh and F. Tuna, Coord. Chem. Rev., 2017, 346, 216 CrossRef; (i) J. F. Soria, J. Vallejo, M. Castellano, J. M. Lillo, E. Pardo, J. Cano, I. Castro, F. Lloret, R. R. García and M. Julve, Coord. Chem. Rev., 2017, 339, 17 CrossRef; (j) Z. Zhu, M. Guo, X.-L. Li and J. Tang, Coord. Chem. Rev., 2017 DOI:10.1016/j.ccr.2017.10.030.
- (a) R. Sessoli, D. Gatteschi, A. Caneschi and M. A. Novak, Nature, 1993, 365, 141 CrossRef; (b) R. Sessoli and A. K. Powell, Coord. Chem. Rev., 2009, 253, 2328 CrossRef; (c) P. Zhang, Y.-N. Guo and J. Tang, Coord. Chem. Rev., 2013, 257, 1728 CrossRef; (d) D. N. Woodruff, R. E. P. Winpenny and R. A. Layfield, Chem. Rev., 2013, 113, 5110 CrossRef PubMed; (e) H. L. C. Feltham and S. Brooker, Coord. Chem. Rev., 2014, 276, 1 CrossRef; (f) S. Demir, I. R. Jeon, J. R. Long and T. D. Harris, Coord. Chem. Rev., 2015, 289–290, 149 CrossRef; (g) L. Ungur, S.-Y. Lin, J. Tang and L. F. Chibotaru, Chem. Soc. Rev., 2014, 43, 6894 RSC; (h) Y.-S. Meng, S.-D. Jiang, B.-W. Wang and S. Gao, Acc. Chem. Res., 2016, 49, 2381 CrossRef PubMed; (i) J.-H. Jia, Q.-W. Li, Y.-C. Chen, J.-L. Liu and M.-L. Tong, Coord. Chem. Rev., 2017 DOI:10.1016/j.ccr.2017.11.012; (j) M. Feng and M.-L. Tong, Chem. – Eur. J., 2018, 24, 1 CrossRef PubMed; (k) J.-L. Liu, Y.-C. Chen and M.-L. Tong, Chem. Soc. Rev., 2018, 47, 2431 RSC; (l) W.-P. Chen, P.-Q. Liao, Y. Yu, Z. Zheng, X.-M. Chen and Y.-Z. Zheng, Angew. Chem., Int. Ed., 2016, 55, 9375 CrossRef PubMed.
- (a) J. D. Rinehart and J. R. Long, Chem. Sci., 2011, 2, 2078 RSC; (b) T. Pugh, V. Vieru, L. F. Chibotaru and R. A. Layfield, Chem. Sci., 2016, 7, 2128 RSC; (c) S. Lee and T. Ogawa, Chem. Lett., 2017, 46, 10 CrossRef; (d) M. Gysler, F. E. Hallak, L. Ungur, R. Marx, M. Hakl, P. Neugebauer, Y. Rechkemmer, Y. Lan, I. Sheikin, M. Orlita, C. E. Anson, A. K. Powell, R. Sessoli, L. F. Chibotaru and J. van Slageren, Chem. Sci., 2016, 7, 4347 RSC; (e) Y.-C. Chen, J.-L. Liu, W. Wernsdorfer, D. Liu, L. F. Chibotaru, X.-M. Chen and M.-L. Tong, Angew. Chem., Int. Ed., 2017, 56, 4996 CrossRef PubMed; (f) L. Norel, L. E. Darago, B. Le Guennic, K. Chakarawet, M. I. Gonzalez, J. H. Olshansky, S. Rigaut and J. R. Long, Angew. Chem., 2018, 130, 1951 CrossRef; (g) Y.-S. Ding, T. Han, Y.-Q. Hu, M. Xu, S. Yang and Y.-Z. Zheng, Inorg. Chem. Front., 2016, 3, 798 RSC; (h) G.-J. Zhou, Y.-S. Ding and Y.-Z. Zheng, Dalton Trans., 2017, 46, 3100 RSC; (i) K.-X. Yu, Y.-S. Ding, T. Han, J.-D. Leng and Y.-Z. Zheng, Inorg. Chem. Front., 2016, 3, 1028 RSC; (j) G.-J. Zhou, T. Han, Y.-S. Ding, N. F. Chiton and Y.-Z. Zheng, Chem. – Eur. J., 2017, 23, 15617 CrossRef PubMed.
- (a) E. Lucaccini, J. J. Baldoví, L. Chelazzi, A.-L. Barra, F. Grepioni, J.-P. Costes and L. Sorace, Inorg. Chem., 2017, 56, 4728 CrossRef PubMed; (b) G. Cucinotta, M. Perfetti, J. Luzon, M. Etienne, P.-E. Car, A. Caneschi, G. Calvez, K. Bernot and R. Sessoli, Angew. Chem., 2012, 124, 1638 CrossRef; (c) K. S. Pedersen, L. Ungur, M. Sigrist, A. Sundt, M. S. Magnussen, V. Vieru, H. Mutka, S. Rols, H. Weihe, O. Waldmann, L. F. Chibotaru, J. Bendix and J. Dreiser, Chem. Sci., 2014, 5, 1650 RSC; (d) T. Han, Y.-S. Ding, J.-D. Leng, Z. Zheng and Y.-Z. Zheng, Inorg. Chem., 2015, 54, 4588 CrossRef PubMed.
- (a) C. R. Ganivet, B. Ballesteros, G. de la Rorre, J. M. Clemente-Juan, E. Coronado and T. Torres, Chem. – Eur. J., 2013, 19, 1457 CrossRef PubMed; (b) Y.-S. Ding, N. F. Chilton, R. E. P. Winpenny and Y.-Z. Zheng, Angew. Chem., Int. Ed., 2016, 55, 16071 CrossRef PubMed; (c) Y.-C. Chen, J.-L. Liu, L. Ungur, J. Liu, Q.-W. Li, L.-F. Wang, Z.-P. Ni, L.-F. Chibotaru, X.-M. Chen and M.-L. Tong, J. Am. Chem. Soc., 2016, 138, 2829 CrossRef PubMed; (d) S. K. Gupta, T. Rajeshkumar, G. Rajaraman and R. Murugavel, Chem. Sci., 2016, 7, 5181 RSC; (e) L. Ungur, J. J. Le Roy, I. Korobkov, M. Murugesu and L. F. Chibotaru, Angew. Chem., Int. Ed., 2014, 53, 4413 CrossRef PubMed; (f) J. J. Le Roy, I. Korobkov and M. Murugesu, Chem. Commun., 2014, 50, 1602 RSC.
- J. Liu, Y.-C. Chen, J.-L. Liu, V. Vieru, L. Ungur, J.-H. Jia, L.-F. Chibotaru, Y.-H. Lan, W. Wernsdorfer, S. Gao, X.-M. Chen and M.-L. Tong, J. Am. Chem. Soc., 2016, 138, 5441 CrossRef PubMed.
- (a) C. A. P. Goodwin, F. Ortu, D. Reta, N. F. Chilton and D. P. Mills, Nature, 2017, 548, 439 CrossRef PubMed; (b) F.-S. Guo, M. D. Benjamin, Y.-C. Chen, M.-L. Tong, A. Mansikkamäki and A. L. Richard, Angew. Chem., Int. Ed., 2017, 56, 11445 CrossRef PubMed.
- (a) G.-F. Xu, Q.-L. Wang, P. Gamez, Y. Ma, R. Clérac, J. Tang, S.-P. Yan, P. Cheng and D.-Z. Liao, Chem. Commun., 2010, 46, 1506 RSC; (b) Y.-N. Guo, G.-F. Xu, W. Wernsdorfer, L. Ungur, Y. Guo, J. Tang, H.-J. Zhang, L. F. Chibotaru and A. K. Powell, J. Am. Chem. Soc., 2011, 133, 11948 CrossRef PubMed; (c) P. Zhang, L. Zhang, S.-Y. Lin, S. Xue and J. Tang, Inorg. Chem., 2013, 52, 4587 CrossRef PubMed; (d) C. Wang, S.-Y. Lin, J. Wu, S.-W. Yuan and J. Tang, Dalton Trans., 2015, 44, 4648 RSC; (e) L. Zhang, J.-L. Jung, P. Zhang, M. Guo, L. Zhao, J. Tang and B. Le Guennic, Chem. – Eur. J., 2016, 22, 1392 CrossRef PubMed.
- (a) C. Y. Chow, H. Bolvin, V. E. Campbell, R. Guillot, J. W. Kampf, W. Wernsdorfer, F. Gendron, J. Autschbach, V. L. Pecoraro and T. Mallah, Chem. Sci., 2015, 6, 4148 RSC; (b) F. Habib, P.-H. Lin, J. Long, I. Korobkov, W. Wernsdorfer and M. Murugesu, J. Am. Chem. Soc., 2011, 133, 8830 CrossRef PubMed; (c) S. Demir, M. I. Gonzalez, L. E. Darago, W. J. Evans and J. R. Long, Nat. Commun., 2017, 8, 2144 CrossRef PubMed; (d) B. S. Dolinar, D. I. Alezandropoulos, K. R. Vignesh, T. James and K. R. Dunbar, J. Am. Chem. Soc., 2018, 140, 908 CrossRef PubMed.
- J. D. Rinehart, M. Fang, W. J. Evans and J. R. Long, J. Am. Chem. Soc., 2011, 133, 14236 CrossRef PubMed.
- J. J. Le Roy, L. Ungur, I. Korobkov, L. F. Chibotaru and M. Murugesu, J. Am. Chem. Soc., 2014, 136, 8003 CrossRef PubMed.
- (a) S. Demir, M. Nippe, M. I. Gonzalez and J. R. Long, Chem. Sci., 2014, 5, 4701 RSC; (b) S. Demir, J. M. Zadrozny, M. Nippe and J. R. Long, J. Am. Chem. Soc., 2012, 134, 18546 CrossRef PubMed.
- (a) W.-B. Sun, B. Yan, L.-H. Jia, B.-W. Wang, Q. Yang, X. Cheng, H.-F. Li, P. Chen, Z.-M. Wang and S. Gao, Dalton Trans., 2016, 45, 8790 RSC; (b) S. Mukherjee, J. Lu, G. Velmurugan, S. Singh, G. Rajaraman, J. Tang and S. K. Ghosh, Inorg. Chem., 2016, 55, 11283 CrossRef PubMed; (c) S. Xue, Y.-N. Guo, L. Ungur, J. Tang and L. F. Chibotaru, Chem. – Eur. J., 2015, 21, 14099 CrossRef PubMed; (d) B. Joarder, S. Mukherjee, S. Xue, J. Tang and S. K. Ghosh, Inorg. Chem., 2014, 53, 7554 CrossRef PubMed; (e) M. Iwan, A. Kula, Z. Rzaczyńska, S. Pikus, D. Flisiuk and M. Gomola, Chem. Pap., 2007, 61, 376 Search PubMed.
- (a) J. J. Baldoví, E. Coronado, A. G. Ariño, C. Gamer, M. G. Marqués and G. M. Espallargas, Chem. – Eur. J., 2014, 20, 10695 CrossRef PubMed; (b) K. Liu, H. Li, X. Zhang, W. Shi and P. Cheng, Inorg. Chem., 2015, 54, 10224 CrossRef PubMed; (c) S. Zhang, H. Li, E. Duan, Z. Han, L. Li, J. Tang, W. Shi and P. Cheng, Inorg. Chem., 2016, 55, 1202 CrossRef PubMed; (d) K. Liu, X. Zhang, X. Meng, W. Shi, P. Cheng and A. K. Powell, Chem. Soc. Rev., 2016, 45, 2423 RSC; (e) X. Zhang, N. Xu, W. Shi, B.-W. Wang and P. Cheng, Inorg. Chem. Front., 2018, 5, 432 RSC; (f) L. Qin, Y.-Z. Yu, P.-Q. Liao, W. Xue, Z. Zheng, X.-M. Chen and Y.-Z. Zheng, Adv. Mater., 2016, 28, 10772 CrossRef PubMed; (g) L. Qin, G.-J. Zhou, Y.-Z. Yu, H. Nojiri, C. Schröder, R. E. P. Winpenny and Y.-Z. Zheng, J. Am. Chem. Soc., 2017, 139, 16405 CrossRef PubMed; (h) L. Qin, J. Singleton, W.-P. Chen, H. Nojiri, L. Engelhardt, R. E. P. Winpenny and Y.-Z. Zheng, Angew. Chem., Int. Ed., 2017, 56, 16571 CrossRef PubMed; (i) T. Han, Y.-S. Ding and Y.-Z. Zheng, Struct. Bonding, Springer, Berlin, 2016, vol. 173, p. 209 Search PubMed.
- (a) X. Zhang, V. Vieru, X. Feng, J.-L. Liu, Z. Zhang, B. Na, W. Shi, B.-W. Wang, A. K. Powell, L. F. Chibotaru, S. Gao, P. Cheng and J. R. Long, Angew. Chem., Int. Ed., 2015, 54, 9861 CrossRef PubMed; (b) J.-L. Liu, J.-Y. Wu, G.-Z. Huang, Y.-C. Chen, J.-H. Jia, L. Ungur, L. F. Chibotaru, X.-M. Chen and M.-L. Tong, Sci. Rep., 2015, 5, 16621 CrossRef PubMed; (c) M. Ren, D. Pinkowicz, M. Yoon, K. Kim, L.-M. Zheng, B. K. Breedlove and M. Yamashita, Inorg. Chem., 2013, 52, 8342 CrossRef PubMed; (d) J. Liu, X.-P. Zhang, T. Wu, B.-B. Ma, T.-W. Wang, C.-H. Li, Y.-Z. Li and X.-Z. You, Inorg. Chem., 2012, 51, 8649 CrossRef PubMed; (e) Y. Zhu, F. Luo, M. Luo, X. Feng, S. R. Batten, G. Sun, S. Liu and W. Xu, Dalton Trans., 2013, 42, 8545 RSC; (f) G. Redler, C. Lampropoulos, S. Datta, C. Koo, T. C. Stamatatos, N. E. Chakov, G. Christou and S. Hill, Phys. Rev. B: Condens. Matter Mater. Phys., 2009, 80, 094408 CrossRef.
- (a) J.-L. Du, G. R. Eaton and S. S. Eaton, J. Magn. Reson., Ser. A, 1995, 2, 213 CrossRef; (b) J. M. Zadrozny, J. Niklas, O. G. Poluektov and D. E. Freedman, ACS Cent. Sci., 2015, 1, 488 CrossRef PubMed.
- H.-R. Tu, W.-B. Sun, H.-F. Li, P. Chen, Y.-M. Tian, W.-Y. Zhang, Y.-Q. Zhang and P.-F. Yan, Inorg. Chem. Front., 2017, 4, 499 RSC.
- (a) S. Alvarez, P. Alemany, D. Casanova, J. Cirera, M. Llunell and D. Avnir, Coord. Chem. Rev., 2005, 249, 1693 CrossRef; (b) M. Llunell, D. Casanova, J. Cirera, P. Alemany and S. Alvarez, SHAPE, v2.1, University of Barcelona and The Hebrew University of Jerusalem, Barcelona and Jerusalem, 2013 Search PubMed.
- (a) M. Ren, S.-S. Bao, N. Hoshino, T. Akutagawa, B.-W. Wang, Y.-C. Ding, S.-Q. Wei and L.-M. Zheng, Chem. – Eur. J., 2013, 19, 9619 CrossRef PubMed; (b) J. Wu, J. Jung, P. Zhang, H. Zhang, J. Tang and B. L. Guennic, Chem. Sci., 2016, 7, 3632 RSC.
- G. Karlström, R. Lindh, P.-Å. Malmqvist, B. O. Roos, U. Ryde, V. Veryazov, P.-O. Widmark, M. Cossi, B. Schimmelpfennig, P. Neogrady and L. Seijo, Comput. Mater. Sci., 2003, 28, 222 CrossRef.
- M. E. Lines, J. Chem. Phys., 1971, 55, 2977 CrossRef.
- (a) K. S. Cole and R. H. J. Cole, J. Chem. Phys., 1941, 9, 341 CrossRef; (b) S. M. J. Aubin, Z. Sun, L. Pardi, J. Krzystek, K. Folting, L.-C. Brunel, A. L. Rheingold, G. Christou and D. N. Hendrickson, Inorg. Chem., 1999, 38, 5329 CrossRef.
- D. Gatteschi, R. Sessoli and J. Villain, Molecular Nanomagnets, Oxford University Press, New York, 2006 and references therein Search PubMed.
- (a) P.-H. Lin, T. J. Burchell, L. Ungur, L. F. Chibotaru, W. Wernsdorfer and M. Murugesu, Angew. Chem., Int. Ed., 2009, 48, 9489 CrossRef PubMed; (b) I. J. Hewitt, Y. Lan, C. E. Anson, J. Luzon, R. Sessoli and A. K. Powell, Chem. Commun., 2009, 6765 RSC.
- J. Tang, I. Hewitt, N. T. Madhu, G. Chastanet, W. Wernsdorfer, C. E. Anson, C. Benelli, R. Sessoli and A. K. Powell, Angew. Chem., Int. Ed., 2006, 45, 1729 CrossRef PubMed.
- P.-H. Lin, T. J. Burchell, R. Clérac and M. Murugesu, Angew. Chem., Int. Ed., 2008, 47, 8848 CrossRef PubMed.
- S.-D. Jiang, B.-W. Wang, G. Su, Z.-M. Wang and S. Gao, Angew. Chem., 2010, 122, 7610 CrossRef.
- W. Wernsdorfer, Supercond. Sci. Technol., 2009, 22, 064013 CrossRef.
- (a) T. Han, J.-D. Leng, Y.-S. Ding, Y. Wang, Z. Zheng and Y.-Z. Zheng, Dalton Trans., 2015, 44, 13480 RSC; (b) Y. Wang, T. Han, Y.-S. Ding, Z. Zheng and Y.-Z. Zheng, Dalton Trans., 2016, 45, 1130 Search PubMed.
- D. Pinkowicz, H. I. Southerland, C. Avendaño, A. Prosvirin, C. Sanders, W. Wernsdorfer, K. S. Pedersen, J. Dreiser, R. Clérac, J. Nehrkorn, G. G. Simeoni, A. Schnegg, K. Holldack and K. R. Dunbar, J. Am. Chem. Soc., 2015, 137, 14406 CrossRef PubMed.
- (a) J.-L. Liu, K. Yuan, J. D. Leng, L. Ungur, W. Wernsdorfer, F. S. Guo, L. F. Chibotaru and M.-L. Tong, Inorg. Chem., 2012, 51, 8538 CrossRef PubMed; (b) E. Colacio, J. Ruiz, E. Ruiz, E. Cremades, J. Krzystek, S. Carretta, J. Cano, T. Guidi, W. Wernsdorfer, S. Crretta and E. K. Brechin, Angew. Chem., Int. Ed., 2013, 52, 9130 CrossRef PubMed; (c) W.-B. Sun, B. Yan, Y.-Q. Zhang, B.-W. Wang, Z.-M. Wang, J.-H. Jia and S. Gao, Inorg. Chem. Front., 2014, 1, 503 RSC.
- (a) J. Luzon, K. Bernot, I. J. Hewitt, C. E. Anson, A. K. Powell and R. Sessoli, Phys. Rev. Lett., 2008, 100, 247205 CrossRef PubMed; (b) R. A. Layfield, J. J. W. McDouall, S. A. Sulway, F. Tuna, D. Collison and R. E. P. Winpenny, Chem. – Eng. J., 2010, 16, 4442 Search PubMed.
- X. Yi, K. Bernt, F. Pointillart, G. Poneti, G. Calvez, C. Daiguebonne, O. Guillou and R. Sessoli, Chem. – Eur. J., 2012, 18, 11379 CrossRef PubMed.
- R. Bagai, W. Wernsdorfer, K. A. Abboud and G. Christou, J. Am. Chem. Soc., 2007, 129, 12918 CrossRef PubMed.
- J. S. Costa, N. A. Bandeira, B. Le Guennic, V. Robert, P. Gamez, G. Chastanet, L. Ortiz-Frade and L. Gasque, Inorg. Chem., 2011, 50, 5696 CrossRef PubMed.
- (a) G. Cosquer, F. Pointillart, S. Golhen, O. Cador and L. Ouahab, Chem. – Eur. J., 2013, 19, 7895 CrossRef PubMed; (b) E. Bartolomé, J. Bartolomé, S. Melnic, D. Prodius, S. Shova, A. Arauzo, J. Luzón, F. Luis and C. Turta, Dalton Trans., 2013, 42, 10153 RSC; (c) S. Zhang, H. Ke, L. Sun, X. Li, Q. Shi, G. Xie, Q. Wei, D. Yang, W. Wang and S. Chen, Inorg. Chem., 2016, 55, 3865 CrossRef PubMed.
- F. Moro, D. P. Mills, S. T. Liddle and J. van Slageren, Angew. Chem., 2013, 125, 3514 CrossRef.
- M. Murugesu, Nat. Chem., 2012, 4, 347 CrossRef PubMed.
- (a) L. F. Chibotaru, L. Ungur and A. Soncini, Angew. Chem., Int. Ed., 2008, 120, 4194 CrossRef; (b) L. Ungur, W. Van den Heuvel and L. F. Chibotaru, New J. Chem., 2009, 33, 1224 RSC; (c) L. F. Chibotaru, L. Ungur, C. Aronica, H. Elmoll, G. Pilet and D. Luneau, J. Am. Chem. Soc., 2008, 130, 12445 CrossRef PubMed.
- (a) G. M. Sheldrick, Acta Crystallogr., Sect. C: Struct. Chem., 2015, 71, 3 CrossRef PubMed; (b) O. V. Dolomanov, L. J. Bourhis, R. J. Gildea, J. A. K. Howard and H. Puschmann, J. Appl. Crystallogr., 2009, 42, 339 CrossRef; (c) L. Farrugia, J. Appl. Crystallogr., 2012, 45, 849 CrossRef.
Footnote |
| † Electronic supplementary information (ESI) available: Additional structural, magnetic data and the methods/results for ab initio calculation for the complexes. CCDC 1411817, 1411818, 1413255 and 1413256. For ESI and crystallographic data in CIF or other electronic format see DOI: 10.1039/c8qi00266e |
| This journal is © the Partner Organisations 2018 |


