Optical sensor: a promising strategy for environmental and biomedical monitoring of ionic species
Muhammad Saleem
and
Ki Hwan Lee
*
Department of Chemistry, Kongju National University, Gongju, Chungnam 314-701, Republic of Korea. E-mail: khlee@kongju.ac.kr; Fax: +82-41-856-8613
First published on 3rd August 2015
Abstract
Considerable amount of research has been carried out on designing and improving metal-recognition methodologies in environmental and biological media. The development of fluorescent-based techniques has proven to be an important milestone for non-invasive metal detection and quantification in a multichannel environment. Metals as natural components of the Earth's crust are generally present in trace concentrations in environmental samples, wherein humic substances have a complexation affinity toward them. Iron, zinc and copper are the 1st, 2nd and 3rd most abundant elements that are indispensable to the human body in trace amounts as they play crucial roles in many biological processes. However, unregulated amounts either an excess or deficiency may exacerbate deterioration of the vital organs and trigger the progression of complications. In addition to these three essential elements, mercury is widely considered to be one of the most hazardous pollutants and highly dangerous elements due to its recognized accumulative and toxic effects in the environment and in biological media. In the present study, we attempted to summarize all the recently developed fluorescent signaling materials for the detection of Cu2+, Fe2+/Fe3+, Zn2+ and Hg2+. The spectral shifts in the molecules on metal chelation, the mode of complexation and the stoichiometries of the resulting adducts have been discussed in detail. Furthermore, we highlight molecules that have been reported as an intracellular metal detector via bioimaging, which can be useful for the future design and development of cell-viable and membrane-permeable molecular probes.
1. Introduction
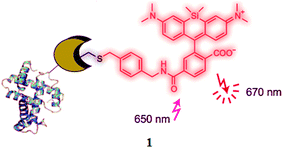
Sensors and actuators are among the most exciting tools in cell biology, developmental biology and medicine because they allow researchers to spy on events occurring in living cells and organisms with high spatial resolution and minimal perturbation to the living systems.1,2 Developments in imaging processing technologies have led to integrated systems for the quantification of low-light-level emission signals from biological systems, providing dynamic information concerning the localization and quantification of molecules of interest because the sensor bears a fluorescent dye module, which can facilitate the investigation of the entire cell environment using light signals.3–5 A fluorescence signaling material with a low energy emission spectrum is most suitable for in vivo imaging. Lukinavicius et al.6 and Lang et al.7 introduced one such type of biocompatible near-infrared silicon-rhodamine probe 1 (Fig. 1), which was ideally suited for implementation in live cells' imaging. The probe exhibited excellent spectroscopic properties, low toxicity and high membrane permeability.The cells of multicellular eukaryotes can respond to the metal status of the whole organism as well as to their own status. In this regard, the trace metal signaling probe is a tool that facilitates the symbiotic relationship between synthetic chemistry and biological imaging to promote a synergistic advancement in both probe design and instrumentation.8,9 Therefore, the design and synthesis of fluorescent probes for the sensing and monitoring of biologically and environmentally related transition metal ions is an attractive and fast-growing field of research in chemistry, biology and environmental science due to their potential application of high sensitivity and operational simplicity.10–13 Therefore, much effort has been devoted to the development of a fluorogenic signaling probe that can selectively detect analytes of interest in organic or mixed aqueous–organic media.14–16 The use of optical sensors allows remote measurements to be performed and is therefore promising for environments wherein direct accessibility is difficult and samples could be damaged when removed from their natural medium.17 Under these circumstances, the development of selective chemosensors for the quantification of environmentally and biologically important ionic species in solutions and in body fluids, especially for transition metal ions, has attracted tremendous attention.18–43
Several methods for the detection of transition metal ions in various samples have been proposed and used, including atomic absorption spectrometry,44–46 inductively coupled plasma mass spectroscopy (ICPMS),47 inductively coupled plasma-atomic emission spectrometry (ICP-AES),48,49 voltammetry,50 CE (capillary electrophoresis),51 FAAS (flame atomic absorption spectroscopy),52 flow injection,53,54 carbon dots,55 graphene quantum dots,56 fiber-optic redox methods,57 thin chitosan films,58 functionalized metal nanoparticles,59,60 and cyclodextrin supramolecular complex.61 In addition to these methods, UV-visible and fluorescence spectroscopy are the most frequently used modes as well as the most favorable methods for the recognition of physiologically and environmentally important analytes, due to their low level detection nature and imaging of analytes in biological media. Fluorescence-based techniques are important tools in chemical and biochemical research because of their appropriate beneficial features of a non-invasive nature, high intrinsic sensitivity, appreciable detection selectivity, operational simplicity, cost-effectiveness, quick response, high temporal resolution and easy signal detection.
2. Copper ion sensor
Copper(II) ion, the third most abundant element after iron and zinc,62,63 is an essential trace element and plays a crucial role in many biological systems.64,65 It has been found in numerous proteins and as a catalytic cofactor for a variety of metalloenzymes such as superoxide dismutase, lysyl oxidase, cytochrome c oxidase, dopamine-hydroxylase, and tyrosinase.66,67 It plays a role in many major functions inside organisms, including electron transfer and O2 metabolism and transit and is directly involved in Fe metabolism via ceruloplasmin, which has the capability to oxidize Fe before being transported in the blood to all the tissues.68 In addition, copper is essential in enzymes that act as free radical scavengers, in hormone biosynthesis, and in biosynthesis of collagen and elastin, i.e., an essential structural components of skin, tendons, and the extracellular matrix.69 Although copper can be tolerated by humans at a relatively large concentration, both its deficiency and excess can lead to complications in the human body.70 Cu overload and long-term exposure may cause irritation of the nose, mouth and eyes and can cause headaches, stomach aches, dizziness, vomiting, diarrhea, gastrointestinal catarrh, dyslexia, and liver damage in infants, as well as induce Wilson's disease that leads to oxidative stress and progressive neurodegeneration and the development of Parkinsonism. High levels of Cu2+ will also damage the biological retreatment systems in water and depress the self-purification ability of natural waters. Similarly, copper deficiency can result in mental retardation, anemia, hypothermia, impaired immune/organ function and Menkes disease.71–78 In this context, accurate and precise determination methods for the quantitative analysis of copper in environmental and biological samples are of tremendous importance, in view of copper's utility as well as toxicity.79–812.1. Fluorescein-based Cu2+ sensors
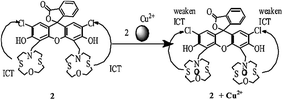
Jiang et al.82 reported a new fluorescent sensor 2 (Fig. 2) functionalized with one dichlorofluorescein moiety as a fluorogenic signaling subunit and two azathiacrown ether macrocyclics as a binding site toward Cu2+. Sensor 2 showed excitation maxima at 500 nm and fluorescence emission maxima at 546 nm. However, upon Cu2+ addition, there was a significant quenching in the fluorescence intensity at 546 nm without any shift in the emission signal. Ratiometric fluorescence quenching was observed on the successive addition of Cu2+ into the receptor 2 solution. These characteristic changes in the ligand emission signal were used as a tool to detect trace Cu2+ levels. The ligand operating response toward Cu2+ was determined to be reversible with EDTA, as assessed by the recovery of the original emission signal at 546 nm on the addition of excess EDTA, which could revert back to the quenched form on the introduction of 25 equivalents Cu2+, thus explaining the intramolecular charge transfer mechanism. The 1![[thin space (1/6-em)]](https://www.rsc.org/images/entities/char_2009.gif) :
:![[thin space (1/6-em)]](https://www.rsc.org/images/entities/char_2009.gif) 2 ligand–metal stoichiometries were estimated by continuous variation methods, and the detection limit of sensor 2 was calculated to be 8.7 × 10⁻⁸ mol L−1.
2 ligand–metal stoichiometries were estimated by continuous variation methods, and the detection limit of sensor 2 was calculated to be 8.7 × 10⁻⁸ mol L−1.
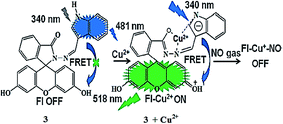
Muthuraj et al.83 reported the rapid and highly sensitive detection of the extremely short-lived nitric oxide (NO) gas generated in vivo by a water-soluble fluorescein derivative, i.e., indole-3-carboxaldehyde-functionalized fluorescein hydrazone 3 (Fig. 3). The receptor exhibited the absorption signal with the maximum intensity at 340 nm, whereas copper titration triggered the appearance of new absorption bands at 492 and 620 nm, representing the spirolactam ring-open conformation triggered by the copper ions. Similarly, the receptor solution did not show any emission signal in the range from 500 to 600 nm when it was excited at 465 nm. Copper addition induced a significant turn-on fluorescence response at 518 nm due to conformational changes in the receptor upon copper complexation, whereas an increasing copper concentration significantly decreased the indole emission signal at 481 nm along with causing a colorimetric change in the reaction solution. The titration experiment suggested a binding constant value of 1.19 × 10⁴ M−1, whereas there was no such response for the competing metallic species. The ligand was further employed in the bioimaging experiment, wherein the selective turn-on green fluorescence from RAW 264.7 cells upon the addition of copper to the ligand-incubated cells suggested a potential practical applicability of the sensor for the intracellular monitoring of copper levels. The dramatic color change of the ligand–copper complex from green to colorless on NO addition could be further employed to detect this reactive species in biological media.
Royzen et al.84 described a ratiometric fluorescence sensing system for copper ions by employing the fluorescence indicators 4 and 5 (Fig. 4). Receptor 4 binds with cadmium ions and triggers the fluorescence intensity to the maximum values, which cause it to reside in the “On” state, whereas receptor 5 remains in the “Off” state due to its uncomplexed form. Interestingly, copper addition significantly quenched the fluorescence of receptor 4 by forming 4–copper complex and thus turning sensor 4 to the “Off” state. At the same time, the liberated cadmium ions form a complex with receptor 5 and turn on the fluorescence of receptor 5. The fluorescence properties of both receptors can easily be identified due to the different position of their emission maxima. The water solubility and ratiometric copper detection of the sensors meet the necessary criteria for a suitable sensor for the environmental and biomedical monitoring of copper ions.
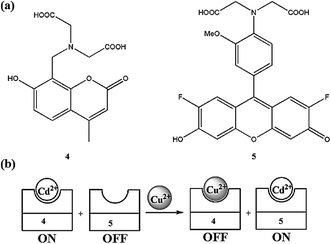 | ||
| Fig. 4 Chemical structure of receptors 4 and 5 (a); schematic of a ratiometric Cu2+ sensing system (b). | ||
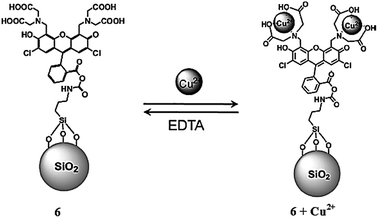
Seo et al.85 reported fluorescein-functionalized silica nanoparticles 6 (Fig. 5) for selective copper detection. The probe alone exhibited a fluorescence emission signal at 526 nm when it was excited at 505 nm, whereas the addition of copper caused a significant quenching in the fluorescence emission signal intensity. The detection limit of the sensor was calculated to be 5 μM. The probe behaved reversibly on treatment with EDTA solution, as assessed by the emergence of a strong green fluorescence from the non-emissive probe–copper complex. Job's plot indicates the 1![[thin space (1/6-em)]](https://www.rsc.org/images/entities/char_2009.gif) :
:![[thin space (1/6-em)]](https://www.rsc.org/images/entities/char_2009.gif) 2 probe–metal binding stoichiometry, and the association constant was calculated to be 1.05 × 10⁵ M−1. The probe was further applied in the bioimaging experiment utilizing HeLa cells under a confocal fluorescence microscope, wherein the appearance of a strong fluorescence signal from the live cells demonstrated the efficient cell viability of the receptor toward live cells.
2 probe–metal binding stoichiometry, and the association constant was calculated to be 1.05 × 10⁵ M−1. The probe was further applied in the bioimaging experiment utilizing HeLa cells under a confocal fluorescence microscope, wherein the appearance of a strong fluorescence signal from the live cells demonstrated the efficient cell viability of the receptor toward live cells.
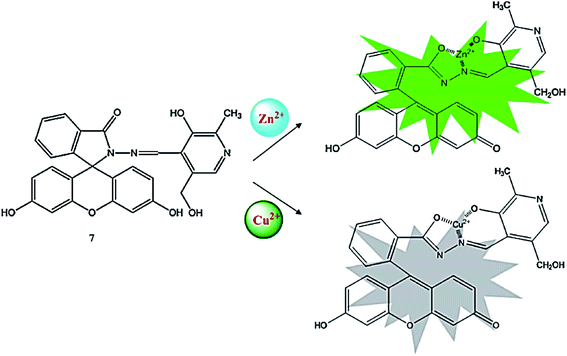
Qu et al.86 reported a pyridoxal-based fluorescein derivative 7 (Fig. 6) for selective copper and zinc detection. The probe alone did not show any absorption signal in the range from 400 to 800 nm, whereas after the addition of copper, a new absorption band emerged at 498 nm along with a colorimetric change in the reaction solution from colorless to yellow. The successive addition of copper ions caused a gradual increase in the absorption signal at 498 nm along with the appearance of two isosbestic points at 344 and 371 nm. The titration graph suggested a 1![[thin space (1/6-em)]](https://www.rsc.org/images/entities/char_2009.gif) :
:![[thin space (1/6-em)]](https://www.rsc.org/images/entities/char_2009.gif) 1 ligand–copper binding stoichiometry with a high association constant value of 1.17 × 10⁵ M−1. The detection limit of the probe toward the copper ions was calculated to be 0.14 μmol L−1. Similarly, the probe exhibited a very weak emission band on excitation at 400 nm, whereas the zinc addition caused the emergence of a new emission band at 510 nm, which underwent a 16 nm bathochromic shift on successive zinc additions and turned the solution from colorless to green under a UV lamp; whereas copper addition caused fluorescence quenching. The ligand was further employed for the bioimaging experiment, which showed the successful intracellular copper detection efficacy of the receptor, as assessed by utilizing HepG2 cells under a confocal fluorescence microscope.
1 ligand–copper binding stoichiometry with a high association constant value of 1.17 × 10⁵ M−1. The detection limit of the probe toward the copper ions was calculated to be 0.14 μmol L−1. Similarly, the probe exhibited a very weak emission band on excitation at 400 nm, whereas the zinc addition caused the emergence of a new emission band at 510 nm, which underwent a 16 nm bathochromic shift on successive zinc additions and turned the solution from colorless to green under a UV lamp; whereas copper addition caused fluorescence quenching. The ligand was further employed for the bioimaging experiment, which showed the successful intracellular copper detection efficacy of the receptor, as assessed by utilizing HepG2 cells under a confocal fluorescence microscope.
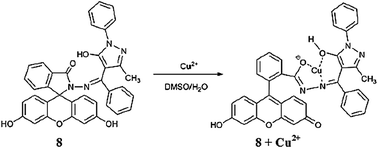
Li et al.87 reported a novel fluorescein derivative 8 (Fig. 7) for copper recognition. The copper addition in the probe solution caused a decrease in the absorption band at 307 nm with a concomitant appearance of new absorption bands at 363, 460 and 495 nm along with a colorimetric change in the reaction solution from colorless to yellow. Moreover, two clear isosbestic points at 284 and 324 nm indicate the presence of a new metal complex in equilibrium with the free ligand 8. The UV-visible titration graph and its linear relationship were utilized to determine the 1![[thin space (1/6-em)]](https://www.rsc.org/images/entities/char_2009.gif) :
:![[thin space (1/6-em)]](https://www.rsc.org/images/entities/char_2009.gif) 1 ligand–copper binding stoichiometry, and the association constant was calculated to be 3.3 × 10⁴ M−1 by utilizing the 1
1 ligand–copper binding stoichiometry, and the association constant was calculated to be 3.3 × 10⁴ M−1 by utilizing the 1![[thin space (1/6-em)]](https://www.rsc.org/images/entities/char_2009.gif) :
:![[thin space (1/6-em)]](https://www.rsc.org/images/entities/char_2009.gif) 1 stoichiometric mode. The ligand–copper complex solution became colorless upon EDTA addition, suggesting the potential of ligand 8 as a chemosensor for copper detection. Similarly, the ligand exhibited a very weak fluorescence emission signal at 337 nm when it was excited at 287 nm, whereas the copper addition caused fluorescence quenching. In contrast, there was no quenching behavior for the competing species.
1 stoichiometric mode. The ligand–copper complex solution became colorless upon EDTA addition, suggesting the potential of ligand 8 as a chemosensor for copper detection. Similarly, the ligand exhibited a very weak fluorescence emission signal at 337 nm when it was excited at 287 nm, whereas the copper addition caused fluorescence quenching. In contrast, there was no quenching behavior for the competing species.
2.2. Naphthalimide-based Cu2+ sensors
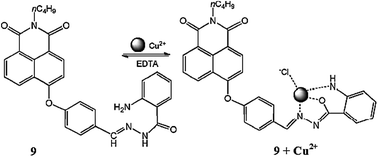
Yu et al.88 reported an easily accessible fluorescent chemosensor 9 (Fig. 8) bearing a naphthalimide group for selective Cu2+ detection in mixed aqueous organic media. Sensor 9 exhibited a very weak fluorescence emission signal with a maximum intensity at 433 nm when it was excited at 340 nm. Cu2+ addition into the ligand 9 solution caused a significant increase in the emission signal at 433 nm, whereas no such effect was observed with the various competing species, suggesting the selective tendency of ligand 9 toward Cu2+ capture. The optimum operating pH for the sensor was selected to be 7.4. A ratiometric enhancement in the emission signal intensity was determined by the progressive addition of Cu2+ into the ligand 9 solution with the high value of the linearly dependent coefficient R = 0.999. The sensor exhibited precise and low values of Cu2+ detection with the calculated limit of detection equal to 0.025 μΜ. From the titration curve, the association constant was calculated to be 3.0 × 10⁴ M−1, and this large association constant indicated a strong interaction between ligand 9 and Cu2+ ions. The ligand behaved reversibly on EDTA addition, reverting back the high intense signal of the ligand–metal complex solution to the very weak signal of the ligand alone, thus successful describing an “Off–On” motif for selective and sensitive Cu2+ detection.The fluorescein-based receptors had a slight limitation of basic sensitivity, which limits their applications over a broad pH span; however, these drawbacks can be overcomed by other receptors such as naphthalimide, naphthalene, and coumarine. Despite their plus points, some of these receptor suffer other limitations, such as a high energy emission signal, which could damage cells during the bioimaging experiment.
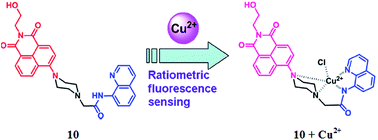
Liu et al.89 reported a new ratiometric fluorescent sensor 10 (Fig. 9) for Cu2+ detection via integrating 1,8-naphthalimide fluorophore with 8-aminoquinoline. Probe 10 exhibited the excitation maxima at 395 nm and two characteristic fluorescence emission bands with their maximum intensities at 435 and 526 nm. Copper introduction into the reaction solution of the probe significantly quenched the fluorescence emission intensity at 526 nm, whereas the emission band at 435 nm remained intact on successive copper additions. A 1![[thin space (1/6-em)]](https://www.rsc.org/images/entities/char_2009.gif) :
:![[thin space (1/6-em)]](https://www.rsc.org/images/entities/char_2009.gif) 1 ligand binding stoichiometry was determined by the method of continuous variation by utilizing the fluorescence titration results, and the association constant was calculated by the Benesi–Hildebrand equation as 2.9 × 10⁴ M−1, according to the fluorescence titration profile. Ligand 10 behaved selectively toward copper ions, as seen by the fact that a number of the competing ionic species did not distinctly alter the emission ratio except for the copper ion. To test for practical applicability, the ligand was further employed in a bioimaging experiment utilizing the MCF-7 cells through a confocal fluorescence microscope. The appearance of a distinct color from the live cells incubated with the probe 10 and copper ions revealed the considerable membrane permeability and the appreciable viability of the sensor toward live cells.
1 ligand binding stoichiometry was determined by the method of continuous variation by utilizing the fluorescence titration results, and the association constant was calculated by the Benesi–Hildebrand equation as 2.9 × 10⁴ M−1, according to the fluorescence titration profile. Ligand 10 behaved selectively toward copper ions, as seen by the fact that a number of the competing ionic species did not distinctly alter the emission ratio except for the copper ion. To test for practical applicability, the ligand was further employed in a bioimaging experiment utilizing the MCF-7 cells through a confocal fluorescence microscope. The appearance of a distinct color from the live cells incubated with the probe 10 and copper ions revealed the considerable membrane permeability and the appreciable viability of the sensor toward live cells.
Lee et al.90 reported two novel Cu2+ sensors 11 and 12 (Fig. 10) bearing naphthalimide and a DPA moiety and evaluated their applicability to trace copper accumulation in organelles. Receptor 11 exhibited the absorption maxima at 462 nm and the fluorescence emission maxima at 547 nm in the absence of copper ions, whereas on copper addition, the absorption maxima underwent a 42 nm bathochromic shift along with a colorimetric change in the reaction solution from pale yellow to pink. Moreover, successive copper additions caused a significant decline in the emission signal intensity at 547 nm. The same results were determined for receptor 12 due to its similar structure, but with a slight exception. The 1![[thin space (1/6-em)]](https://www.rsc.org/images/entities/char_2009.gif) :
:![[thin space (1/6-em)]](https://www.rsc.org/images/entities/char_2009.gif) 1 binding stoichiometry of the ligand–metal complex was obtained from the titration experiment. The binding constant for receptors 11 and 12 were calculated using the Benesi–Hildebrand equation as 3.1 × 10⁻⁷ and 9.3 × 10⁻⁷, respectively. The probes 11 and 12 were further applied to evaluate copper overload in subcellular samples following delivery into HepG2 cells, wherein both the probes were selectively localized to the ER and lysosome. Herein, copper overload in the HepG2 cells was quenched by 11 only, whereas 12 remain unaffected.
1 binding stoichiometry of the ligand–metal complex was obtained from the titration experiment. The binding constant for receptors 11 and 12 were calculated using the Benesi–Hildebrand equation as 3.1 × 10⁻⁷ and 9.3 × 10⁻⁷, respectively. The probes 11 and 12 were further applied to evaluate copper overload in subcellular samples following delivery into HepG2 cells, wherein both the probes were selectively localized to the ER and lysosome. Herein, copper overload in the HepG2 cells was quenched by 11 only, whereas 12 remain unaffected.
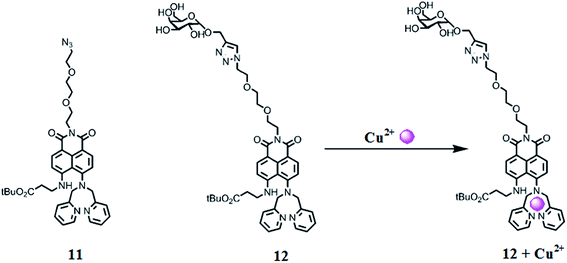 | ||
| Fig. 10 Chemical structure of receptors 11 and 12 along with the proposed ligand–metal complexation mechanism. | ||
The receptor unit in conjugation with the targeting unit proved useful for probing metal contamination and trafficking inside the organelles and suborganelles.
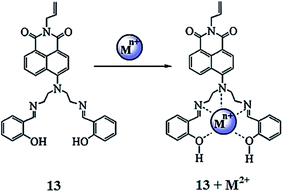
Wang et al.91 reported a novel naphthalimide-based fluorescent sensor bearing the N,N′ bis(salicylidene) diethylenetriamine receptor 13 (Fig. 11) for the dual channel detection of Cd2+ and Cu2+. The ligand exhibited a negligible fluorescence emission signal when it was excited at 445 nm in the absence of metallic species, whereas cadmium addition caused a significant increase in the emission signal intensity centered at 525 nm; moreover, the emission response was found to increase linearly upon the increasing concentration of cadmium ions. Furthermore, cadmium insertion caused significant changes in the UV-visible absorption spectra along with a colorimetric change in the reaction solution. These characteristics changes in the UV-visible absorption spectra and fluorescence emission spectra and the colorimetric change in the reaction solution suggested a complexation process between the receptor and cadmium ions, which could be easily assessed by the use of spectroscopy techniques as well as by the naked eye. The 1![[thin space (1/6-em)]](https://www.rsc.org/images/entities/char_2009.gif) :
:![[thin space (1/6-em)]](https://www.rsc.org/images/entities/char_2009.gif) 1 ligand–cadmium stoichiometry was assessed from the Job's curve utilizing the titration graph, and the association constant was calculated to be 2.4 × 10⁷ M−1, whereas the ligand exhibited a cadmium detection sensitivity of 5.2 × 10⁻⁷ mol L−1. This highly emissive ligand–cadmium complex on treatment with the copper ion caused a drastic quenching in the fluorescence emission signal at 525 nm, and this fluorescence quenching was found to be specific on copper addition. No such effect was observed on the addition of various competitive ions. The fluorescence quenching by the copper ion was due to the complexation of copper toward the ligand, which was further confirmed by NMR spectroscopy and mass spectrometry analysis. The appearance of green fluorescence from the live cells on incubation of the probe-mixed cells with the cadmium ions suggested the cell permeability of the receptor, which would be useful for intracellular metal detection.
1 ligand–cadmium stoichiometry was assessed from the Job's curve utilizing the titration graph, and the association constant was calculated to be 2.4 × 10⁷ M−1, whereas the ligand exhibited a cadmium detection sensitivity of 5.2 × 10⁻⁷ mol L−1. This highly emissive ligand–cadmium complex on treatment with the copper ion caused a drastic quenching in the fluorescence emission signal at 525 nm, and this fluorescence quenching was found to be specific on copper addition. No such effect was observed on the addition of various competitive ions. The fluorescence quenching by the copper ion was due to the complexation of copper toward the ligand, which was further confirmed by NMR spectroscopy and mass spectrometry analysis. The appearance of green fluorescence from the live cells on incubation of the probe-mixed cells with the cadmium ions suggested the cell permeability of the receptor, which would be useful for intracellular metal detection.
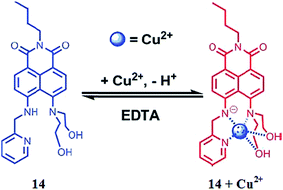
Huang et al.92 reported the 4,5-diamino-1,8-naphthalimide (DNP)-based chemosensor 14 (Fig. 12) for selective copper addition over a broad pH span. The free ligand 14 exhibited an absorption band at 464 nm, which is a characteristic signal for pyridine absorption. The sequential addition of copper ions caused a ratiometric increment in the absorption signal at 464 nm and a constant decrease in the absorption signal centered at 514 nm with a clear isosbestic point at 485 nm along with a colorimetric change in the reaction solution from yellow to pink. The 1![[thin space (1/6-em)]](https://www.rsc.org/images/entities/char_2009.gif) :
:![[thin space (1/6-em)]](https://www.rsc.org/images/entities/char_2009.gif) 1 ligand–copper stoichiometry was calculated by utilizing the titration graph and was further supported by the mass spectrometry analysis. Similarly, the probe showed the fluorescence emission signal with a maximum intensity at 543 nm when it was excited at 464 nm, and the copper addition caused drastic fluorescence quenching. The fluorescence signal at 543 nm declined linearly with copper concentration. The fluorescence titration experiment revealed the 1
1 ligand–copper stoichiometry was calculated by utilizing the titration graph and was further supported by the mass spectrometry analysis. Similarly, the probe showed the fluorescence emission signal with a maximum intensity at 543 nm when it was excited at 464 nm, and the copper addition caused drastic fluorescence quenching. The fluorescence signal at 543 nm declined linearly with copper concentration. The fluorescence titration experiment revealed the 1![[thin space (1/6-em)]](https://www.rsc.org/images/entities/char_2009.gif) :
:![[thin space (1/6-em)]](https://www.rsc.org/images/entities/char_2009.gif) 1 ligand–copper complexation stoichiometry with the associate constant value of 3.9 ± 0.28 × 10⁶ M−1. The sensor worked well in the broad pH span and responded selectively toward the copper ion, along with a colorimetric change in the reaction solution, which is an advantageous feature of the proposed sensor for metallic detection using the naked eye. The ligand behaved reversibly on the excess addition of EDTA solution as assessed by the recovery of the color and signal of the receptor, indicating the engagement of the released copper ion with the EDTA.
1 ligand–copper complexation stoichiometry with the associate constant value of 3.9 ± 0.28 × 10⁶ M−1. The sensor worked well in the broad pH span and responded selectively toward the copper ion, along with a colorimetric change in the reaction solution, which is an advantageous feature of the proposed sensor for metallic detection using the naked eye. The ligand behaved reversibly on the excess addition of EDTA solution as assessed by the recovery of the color and signal of the receptor, indicating the engagement of the released copper ion with the EDTA.
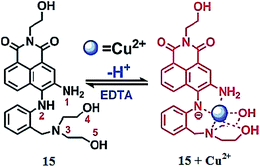
Huang et al.93 reported a Cu2+-specific colorimetric sensor 15 (Fig. 13) based on 1,8-naphthalimide chromophore integrated with 2-aminodiphenylamine. The ligand 15 alone exhibited an absorption band at 462 nm in the buffer solution, whereas copper addition caused a significant decrease in the absorption signal intensity at 462 nm and the emergence of a new absorption signal at 540 nm along with the two clear isosbestic points at 485 and 361 nm. Furthermore, copper addition caused a visual colorimetric change in the reaction solution from light yellow to pink, whereas the competitive ions did not exhibit such changes in the receptor solution. The absorption intensity at 540 nm was utilized to determine the 1![[thin space (1/6-em)]](https://www.rsc.org/images/entities/char_2009.gif) :
:![[thin space (1/6-em)]](https://www.rsc.org/images/entities/char_2009.gif) 1 ligand–copper complexation stoichiometry with a binding constant value of 7.3 ± 0.15 × 10⁶ mol−1 L−1 and a detection limit of 3.0 × 10⁻⁷ M.
1 ligand–copper complexation stoichiometry with a binding constant value of 7.3 ± 0.15 × 10⁶ mol−1 L−1 and a detection limit of 3.0 × 10⁻⁷ M.
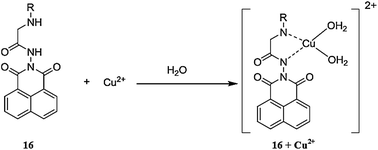
Reddy et al.94 reported bidentate 2-hexylaminoethylamidonaphthalimide 16 (Fig. 14) as a fluorescent chemosensor for copper/nickel detection. The receptor exhibited fluorescent emission signals at 364 and 382 nm, along with shoulder signals at 401 and 430 nm, whereas copper/nickel addition significantly quenched the probe emission signals when the excitation wavelength was fixed at 344 nm without any shift in the spectral position. The copper and nickel addition caused a linear decrease in the fluorescence emission signal intensity with Stern–Volmer quenching constants values of 9.47 × 10⁵ and 2.18 × 10⁵, respectively. The detection limit of the sensor toward copper ions was calculated to be 0.12 μM. These characteristic changes in the fluorescence spectra of the receptor upon Cu2+/Ni2+ addition revealed the applicability of 16 as a fluorescent “On–Off” sensor for these metals ions.
Lan et al.95 reported a naphthalimide-based turn-on chemosensor 17 (Fig. 15) for copper detection. Copper addition caused a gradual decrease in the absorption signals at 325 and 405 nm when the copper concentration was lower than 1 equivalent, whereas a significant increase in the absorption signals intensity at 325 along with a monotonic decrease in the signal at 405 nm was observed when the copper concentration was above 1 equivalent. Similarly, copper addition caused the “turn-on” fluorescence response toward the ligand up to 1 equivalent, whereas a concentration above 1 equivalent copper addition caused a decrease in the emission signal intensity at 522 nm along with the appearance of a new emission band at 425 nm, whose intensity increased upon an increasing copper ion concentration. The different response of the copper binding was observed from titration of the ligand with copper ions, suggesting 1![[thin space (1/6-em)]](https://www.rsc.org/images/entities/char_2009.gif) :
:![[thin space (1/6-em)]](https://www.rsc.org/images/entities/char_2009.gif) 1 and 1
1 and 1![[thin space (1/6-em)]](https://www.rsc.org/images/entities/char_2009.gif) :
:![[thin space (1/6-em)]](https://www.rsc.org/images/entities/char_2009.gif) 2 ligand–copper complexation stoichiometries. The stability constants of the ligand toward copper ions were calculated to be K1 = 4.35 × 10⁵ and K2 = 8.13 × 10⁴. The two-step binding process of the ligand with that of copper ions was further confirmed by the mass spectrometry analysis. The sensor was found to exhibit very low value of detection limits, i.e., 4.8 × 10⁻⁸ M. The sensing response of the sensor could be retrieved upon the addition of EDTA solution, suggesting the reversible nature of the sensor.
2 ligand–copper complexation stoichiometries. The stability constants of the ligand toward copper ions were calculated to be K1 = 4.35 × 10⁵ and K2 = 8.13 × 10⁴. The two-step binding process of the ligand with that of copper ions was further confirmed by the mass spectrometry analysis. The sensor was found to exhibit very low value of detection limits, i.e., 4.8 × 10⁻⁸ M. The sensing response of the sensor could be retrieved upon the addition of EDTA solution, suggesting the reversible nature of the sensor.
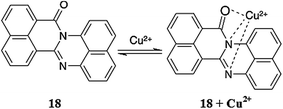
Goswami et al.96 reported the 1,8-naphthalimide-based colorimetric fluorescence sensor 18 (Fig. 16) for copper detection. The probe exhibited absorption signals at 343, 359 and 470 nm. The gradual addition of copper ions caused a successive decrease in these absorption signals along with a slight blue-shift in the spectral position, whereas the band at 470 nm disappeared with the concomitant appearance of a new absorption signal at 557 nm with the progressive increase in the signal intensity upon the increasing copper ion concentration. The UV-visible titration of the receptor with the copper ions yielded two clear isosbestic points at 404 and 514 nm along with a colorimetric change in the reaction solution from orange to purple, indicating the successful formation of the receptor–copper complex. The 1![[thin space (1/6-em)]](https://www.rsc.org/images/entities/char_2009.gif) :
:![[thin space (1/6-em)]](https://www.rsc.org/images/entities/char_2009.gif) 1 ligand–copper binding stoichiometry was determined by the method of continuous variation, and the association constant was calculated to be 2.16 × 10⁴ M−1. The copper binding behavior was further confirmed by FT-IR and mass spectrometry analysis. Similarly, the receptor exhibited a fluorescence emission signal at 650 nm when it was excited at 470 nm. The copper addition caused a 25-fold enhancement in the fluorescence emission signal at 675 nm along with a slight red-shift in the spectral position, suggesting the fluorescence “off–on” sensing of the copper ions by the proposed receptor.
1 ligand–copper binding stoichiometry was determined by the method of continuous variation, and the association constant was calculated to be 2.16 × 10⁴ M−1. The copper binding behavior was further confirmed by FT-IR and mass spectrometry analysis. Similarly, the receptor exhibited a fluorescence emission signal at 650 nm when it was excited at 470 nm. The copper addition caused a 25-fold enhancement in the fluorescence emission signal at 675 nm along with a slight red-shift in the spectral position, suggesting the fluorescence “off–on” sensing of the copper ions by the proposed receptor.
2.3. Naphthalene-based Cu2+ sensors
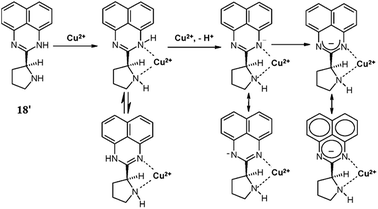
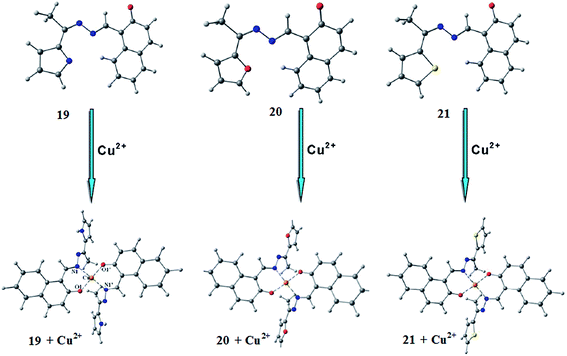
Goswami et al.97 reported a new 1,8-diaminonaphthalene-based ratiometric and highly selective colorimetric “off–on” type of fluorescent probe 18′ (Fig. 17) for copper sensing. The sensor 18′ exhibited a weak absorption band with the maximum intensity at 328 nm, whereas a significant enhancement in the absorption intensity was observed on the introduction of copper ions into the probe solution alongside a colorimetric change in the reaction solution for metal detection by the naked eye. In the case of the UV-visible titration experiment, there was a continuous decrease in the absorption signal intensity at 328 nm along with the emergence of a new absorption signal at around 540 nm with the isosbestic point at 352 nm, confirming the metal-induced conformational changes in the ligand molecule and the presence of a singlet species in the reaction mixture. However, with the further increase of the copper concentration up to 15 μM, a momentous bathochromic shift in the absorption signal was observed due to the shift of the absorption maxima from 540 to 650 nm, confirming the intermediate complex formation. Similarly in the case of fluorescence emission spectral recording, there was a sharp decrease in the emission signal at 496 nm up to a 5 μM Cu2+ addition when it was excited at 328 nm. This emission signal quenching was estimated to be due to metal to ligand charge transfer. With a further increase in the copper ion concentration up to 10 μM, a large red-shift was observed from 496 to 616 nm with the isoemissive point at 550 nm attributed to the host–guest complex formation via coordination of the free pyrrolidinium nitrogen with Cu2+. For the competing alkali, alkaline earth metals as well as other varieties of transition metal ions, a negligible fluorescence quenching was observed, suggesting the low affinity of these ionic species toward the reported ligand. The significant “Off–On” fluorescence as well as the colorimetric response of the ligand toward the copper ions revealed its selective complexation affinity toward copper ions through fluorescence spectroscopy measurements and naked eye copper detection.Dessingiou et al.98 reported the 2-hydroxynaphthylidene derivatives of hydrazine 19–21 (Fig. 18) as selective sensors for copper ions. All the receptors exhibited the fluorescence emission signal with the maximum emission intensity in the range of 500–507 nm when it was excited at 400 nm. Copper addition into the ligands solution caused significant quenching in the fluorescence emission signal intensity, which was due to the complexation of the receptors with the copper ions. The 2![[thin space (1/6-em)]](https://www.rsc.org/images/entities/char_2009.gif) :
:![[thin space (1/6-em)]](https://www.rsc.org/images/entities/char_2009.gif) 1 ligand–metal binding stoichiometry was calculated by the method of continuous variation and the association constants for the ligands 19–21 toward copper ions were calculated by the Benesi–Hildebrand equation as 33
1 ligand–metal binding stoichiometry was calculated by the method of continuous variation and the association constants for the ligands 19–21 toward copper ions were calculated by the Benesi–Hildebrand equation as 33![[thin space (1/6-em)]](https://www.rsc.org/images/entities/char_2009.gif) 557 ± 988, 29
557 ± 988, 29![[thin space (1/6-em)]](https://www.rsc.org/images/entities/char_2009.gif) 832 ± 600 and 27
832 ± 600 and 27![[thin space (1/6-em)]](https://www.rsc.org/images/entities/char_2009.gif) 853 ± 780 M−1 and the detection limits were calculated to be 0.6, 1.9 and 0.9 ppm, respectively. Similarly, there was a significant variation of the ligands absorption signal along with clear isosbestic points and a colorimetric change in the reaction solution on copper addition, suggesting the strong tendency of the ligands toward the copper bindings.
853 ± 780 M−1 and the detection limits were calculated to be 0.6, 1.9 and 0.9 ppm, respectively. Similarly, there was a significant variation of the ligands absorption signal along with clear isosbestic points and a colorimetric change in the reaction solution on copper addition, suggesting the strong tendency of the ligands toward the copper bindings.
Wang et al.99 reported a multifunctional water-soluble fluorescent sensor based on a cyclen-appended BINOL derivative 22 (Fig. 19) for the dual channel detection of copper and sulfide ions. The receptor exhibited three absorption bands in the UV-visible absorption spectra with the maximum intensity at 228, 280, 293, and 331 nm with a fluorescence emission band at 449 nm when it was excited at 291 nm. The receptor solution showed drastic quenching in the fluorescence emission signal on 5 equivalents copper addition, whereas there was no such quenching effect in the receptor solution upon the addition of a number of competing ionic species, including K+, Na+, Li+, Mg2+, Ca2+, Cr3+, Co2+, Zn2+, Cd2+, Hg2+, Pb2+, Mn2+, Ba2+, Fe2+, Fe3+, Ag+, Al3+, and Ni2+, indicating the selective tendency of receptor 22 toward copper ions. On fluorescence titration of the receptor with an increasing concentration of copper ions, a linear relationship was observed for the fluorescence quenching of the receptor. The 2![[thin space (1/6-em)]](https://www.rsc.org/images/entities/char_2009.gif) :
:![[thin space (1/6-em)]](https://www.rsc.org/images/entities/char_2009.gif) 1 binding stoichiometry of the ligand toward the copper ions was evaluated by the Job's curve with a binding constant value of 3 × 10². The minimum copper detection by receptor 22 was determined to be 4 × 10⁻⁶ M in the pure water media along with the “On–Off” fluorescence response. Furthermore, the ligand behaved reversibly on the successive addition of sulfide ions as assessed by the regeneration of the original fluorescence for the receptor after treatment of the ligand–copper complex with sulfide ions. This “Off–On” response of the receptor–copper complex was found to be selective for sulfide ions compared to the competing species, and thus could be utilized for the micro-molar detection of sulfide ions in pure aqueous solution in environmental as well as in biomedical samples.
1 binding stoichiometry of the ligand toward the copper ions was evaluated by the Job's curve with a binding constant value of 3 × 10². The minimum copper detection by receptor 22 was determined to be 4 × 10⁻⁶ M in the pure water media along with the “On–Off” fluorescence response. Furthermore, the ligand behaved reversibly on the successive addition of sulfide ions as assessed by the regeneration of the original fluorescence for the receptor after treatment of the ligand–copper complex with sulfide ions. This “Off–On” response of the receptor–copper complex was found to be selective for sulfide ions compared to the competing species, and thus could be utilized for the micro-molar detection of sulfide ions in pure aqueous solution in environmental as well as in biomedical samples.
Singhal et al.100 described the synthesis and copper binding affinity of ligand 23 (Fig. 20), and for comparison of the binding mode, the synthetic control molecular systems 24 were utilized. The titration of ligand 23 with copper ions caused a substantial increase in the fluorescence emission intensity at 354 nm up to the mole ratio of 0.5 and then caused a decrease in the emission signal intensity. Similarly, there was an increase in the fluorescence emission signal of ligand 23 in a methanolic solution upon the introduction of Zn2+ to the mole ratio of 1.0, which then became saturated thereafter. This behavior of ligand 23 was found to be selective toward copper and zinc ions in comparison to the other varieties of competing ionic species. The association constants for ligand 23 toward zinc and copper ions were calculated using the Benesi–Hildebrand equation and found to be 50![[thin space (1/6-em)]](https://www.rsc.org/images/entities/char_2009.gif) 000 ± 1000 and 50
000 ± 1000 and 50![[thin space (1/6-em)]](https://www.rsc.org/images/entities/char_2009.gif) 500 ± 1000 M−1, respectively. Similarly, the 1
500 ± 1000 M−1, respectively. Similarly, the 1![[thin space (1/6-em)]](https://www.rsc.org/images/entities/char_2009.gif) :
:![[thin space (1/6-em)]](https://www.rsc.org/images/entities/char_2009.gif) 1 complex in the case of Zn2+ and 1
1 complex in the case of Zn2+ and 1![[thin space (1/6-em)]](https://www.rsc.org/images/entities/char_2009.gif) :
:![[thin space (1/6-em)]](https://www.rsc.org/images/entities/char_2009.gif) 2 complexes in the case of Cu2+ were observed from the UV-visible absorption spectra with association constant values of 44
2 complexes in the case of Cu2+ were observed from the UV-visible absorption spectra with association constant values of 44![[thin space (1/6-em)]](https://www.rsc.org/images/entities/char_2009.gif) 500 ± 1500 and 50
500 ± 1500 and 50![[thin space (1/6-em)]](https://www.rsc.org/images/entities/char_2009.gif) 500 ± 3500 M−1 for the Cu2+ and Zn2+ ions, respectively, whereas there were no interpretable changes in the absorption spectra of ligand 23 in the case of the competing ionic species. A mechanistic insight was obtained through recording the mass spectrometry data on the titration of the ligand with copper ions. The proposed galactosyl-based ligand 23 may offer a capability to diagnose copper levels even in in biological samples associated with other metal ions as well as Cu1+.
500 ± 3500 M−1 for the Cu2+ and Zn2+ ions, respectively, whereas there were no interpretable changes in the absorption spectra of ligand 23 in the case of the competing ionic species. A mechanistic insight was obtained through recording the mass spectrometry data on the titration of the ligand with copper ions. The proposed galactosyl-based ligand 23 may offer a capability to diagnose copper levels even in in biological samples associated with other metal ions as well as Cu1+.
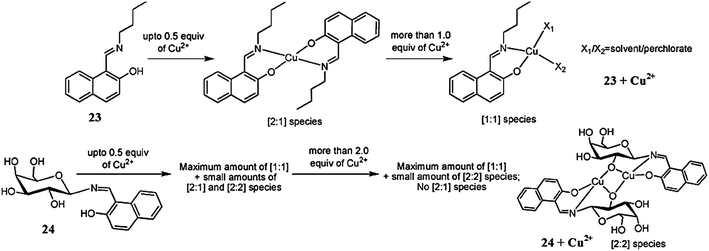 | ||
| Fig. 20 Chemical structure of ligand 23 and the synthetic control molecular system 24, and the proposed copper complexation mechanism. | ||
Goswami et al.101 reported the Schiff base derivative of naphthalene 25 (Fig. 21) for copper and acetate ion detection. The probe exhibited absorption signals with the maximum absorption at 326 and 392 nm, which diminished upon copper addition alongside the appearance of a new absorption signal at 432 nm. The UV-visible titration experiment of the receptor with copper ions triggered a clear isosbestic point at 422 nm along with a colorimetric change in the reaction solution from yellow to dark yellow, indicating the complex formation reaction. The Job's plot indicated the 1![[thin space (1/6-em)]](https://www.rsc.org/images/entities/char_2009.gif) :
:![[thin space (1/6-em)]](https://www.rsc.org/images/entities/char_2009.gif) 1 ligand–copper complexation stoichiometry, and the association constant for the receptor toward copper ions was calculated to be 1.5 × 10⁴ M−1 with a detection limit of 5 μM. Similarly, copper addition caused a drastic quenching in the fluorescence emission signal at 575 nm when it was excited at 392 nm. The ligand was further found to possess a colorimetric and selective optical response toward acetate ion detection with a high magnitude of sensitivity.
1 ligand–copper complexation stoichiometry, and the association constant for the receptor toward copper ions was calculated to be 1.5 × 10⁴ M−1 with a detection limit of 5 μM. Similarly, copper addition caused a drastic quenching in the fluorescence emission signal at 575 nm when it was excited at 392 nm. The ligand was further found to possess a colorimetric and selective optical response toward acetate ion detection with a high magnitude of sensitivity.
Tang et al.102 reported a new bis(8-carboxamidoquinoline) dangled binaphthol derivatized 26 (Fig. 22) as a dual sensor for copper and zinc. The ligand exhibited a weak fluorescence emission signal at 403 nm when it was excited at 324 nm. Zinc addition caused a decrease in the fluorescence emission signal intensity at 403 nm with the concomitant appearance of a new emission band at 507 nm and a remarkable red-shift of 104 nm. Copper addition caused fluorescence quenching, whereas the competing ionic species did not show such a behavior, suggesting the selective tendency of the ligand toward copper and zinc. The fluorescence titration experiment of the receptor with zinc ions triggered a clear isoemissive point at 432, demonstrating the existence of an equilibrium between the ligand and ligand–zinc complex. The titration graph yielded the 1![[thin space (1/6-em)]](https://www.rsc.org/images/entities/char_2009.gif) :
:![[thin space (1/6-em)]](https://www.rsc.org/images/entities/char_2009.gif) 1 receptor–zinc binding stoichiometry and the Benesi–Hildebrand equation gave the association constant value of 1.2 × 10⁴ M−1, whereas the detection limit of the receptor was evaluated to be 1.51 × 10⁻⁶ M. However, the enhanced fluorescence of the ligand–zinc complex was greatly quenched with the competitive addition of copper ions leading to the replacement of the zinc ions in the ligand–zinc complex by copper ions. A gradual decrease in the fluorescence emission signal intensity was observed on successive copper additions into the ligand–zinc complex. Based on the titration graph, the binding constant of the copper with the ligand was found to be 5.4 × 10⁴ M−1, and the detection limit of the ligand–zinc complex toward the copper ions was estimated to be 4.57 × 10⁻⁶ M.
1 receptor–zinc binding stoichiometry and the Benesi–Hildebrand equation gave the association constant value of 1.2 × 10⁴ M−1, whereas the detection limit of the receptor was evaluated to be 1.51 × 10⁻⁶ M. However, the enhanced fluorescence of the ligand–zinc complex was greatly quenched with the competitive addition of copper ions leading to the replacement of the zinc ions in the ligand–zinc complex by copper ions. A gradual decrease in the fluorescence emission signal intensity was observed on successive copper additions into the ligand–zinc complex. Based on the titration graph, the binding constant of the copper with the ligand was found to be 5.4 × 10⁴ M−1, and the detection limit of the ligand–zinc complex toward the copper ions was estimated to be 4.57 × 10⁻⁶ M.
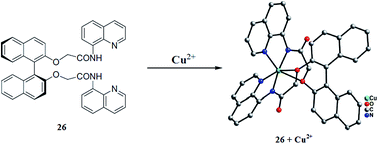 | ||
| Fig. 22 Chemical structure of receptor 26 and the single crystal structure of the ligand–copper complex. | ||
The receptor unit reported herein provides a very good understanding of the complexation mode of the ligand with that of metal ions. Although the limit of detection by this receptor is moderate, it reflects a very good understanding of the metal–ligand complexation mode. This property of the ligand might list it into appreciable sensing methodologies.
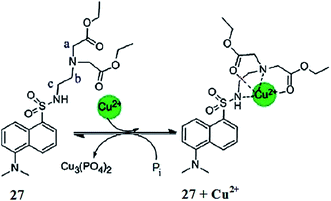
Hatai et al.103 reported the dansyl-based fluorescent copper sensor 27 (Fig. 23). The ligand alone exhibited a fluorescence emission signal at 525 nm when it was excited at 335 nm, whereas copper addition caused a drastic fluorescence quenching along with a colorimetric change in the reaction solution for naked eye detection. The 1![[thin space (1/6-em)]](https://www.rsc.org/images/entities/char_2009.gif) :
:![[thin space (1/6-em)]](https://www.rsc.org/images/entities/char_2009.gif) 1 ligand–copper binding stoichiometry was found from the Job's curve, and the association constant value was found to be 1.37 (±0.2) × 105 M−1. Further mechanistic insights were obtained through the NMR titration experiment. The addition of phosphate ions caused a revival of the original fluorescence and permitted the reversible nature of the sensor. The ligand was further applied for phosphate quantification in real samples using human saliva, urine and chicken serum.
1 ligand–copper binding stoichiometry was found from the Job's curve, and the association constant value was found to be 1.37 (±0.2) × 105 M−1. Further mechanistic insights were obtained through the NMR titration experiment. The addition of phosphate ions caused a revival of the original fluorescence and permitted the reversible nature of the sensor. The ligand was further applied for phosphate quantification in real samples using human saliva, urine and chicken serum.
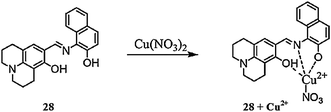
Park et al.104 reported a simple naphthalene-based receptor 28 (Fig. 24) for selective copper detection. Copper addition into the receptor solution caused a decrease in the intensity of the absorption signal at 425 with the concomitant appearance of a new absorption band at 550 nm along with a colorimetric change in the reaction solution from yellow to purple. The 1![[thin space (1/6-em)]](https://www.rsc.org/images/entities/char_2009.gif) :
:![[thin space (1/6-em)]](https://www.rsc.org/images/entities/char_2009.gif) 1 ligand–copper binding stoichiometry was calculated by the method of continuous variation, which was further supported by mass spectrometry analysis. The receptor exhibited an association constant of 3.3 × 10³ M−1 and a detection limit of 1.4 × 10⁻⁵ M. The competitive ions exhibited a negligible effect upon introduction to the ligand solution. Furthermore, the receptor was successfully applied for cyanide ion detection utilizing the fluorimetric change triggered by cyanide ion addition into the complex solution.
1 ligand–copper binding stoichiometry was calculated by the method of continuous variation, which was further supported by mass spectrometry analysis. The receptor exhibited an association constant of 3.3 × 10³ M−1 and a detection limit of 1.4 × 10⁻⁵ M. The competitive ions exhibited a negligible effect upon introduction to the ligand solution. Furthermore, the receptor was successfully applied for cyanide ion detection utilizing the fluorimetric change triggered by cyanide ion addition into the complex solution.
Li et al.105 reported the chiral salan compound 29 (Fig. 25) for the selective detection of copper. The salan derivative exhibited an absorption band at 230 nm and did not show any shift in the absorption signal on metal addition, including for copper ions. In the case of fluorescence emission spectral measurements, sensor 29 exhibited a strong fluorescence emission signal at 359 nm, whereas the metallic addition caused a significant increase in the signal intensity. The maximum fluorescence enhancement was observed by copper addition, which revealed the applicability of sensor 29 for copper detection. The addition of amino acid into the receptor–copper complex caused fluorescence quenching, suggesting the utility of the receptor–copper complex for trace amino acid detection.
2.4. Anthracene-based Cu2+ sensor
Lee et al.106 reported the anthracene-containing dipyridylamine-based receptor 30 (Fig. 26) for the dual channel detection of copper and zinc ions. Receptor 30 caused a fluorescence turn-on response on zinc addition, which was determined by the increase in the fluorescence emission signal intensity at 420 nm when it was excited at 369 nm. Similarly, the receptor alone exhibited broad-band UV-visible absorption signals at 300 nm and three sharp signals at 348, 367, and 387 nm. Zinc addition caused an increase in the absorption signal at 300 nm and red-shifted the sharp signal with the new values at 351, 368, and 388 nm. Zinc titration of the receptor triggered clear isosbestic points at 361, 369, 380, and 389 nm, implying the occurrence of the complexation reaction between the receptor and zinc ion. The 1![[thin space (1/6-em)]](https://www.rsc.org/images/entities/char_2009.gif) :
:![[thin space (1/6-em)]](https://www.rsc.org/images/entities/char_2009.gif) 1 ligand–zinc stoichiometry was calculated by the method of continuous variation, and the association constant was calculated to be 1 × 10⁵ M−1. The 1
1 ligand–zinc stoichiometry was calculated by the method of continuous variation, and the association constant was calculated to be 1 × 10⁵ M−1. The 1![[thin space (1/6-em)]](https://www.rsc.org/images/entities/char_2009.gif) :
:![[thin space (1/6-em)]](https://www.rsc.org/images/entities/char_2009.gif) 1 complexation geometry was further supported by the NMR titration and mass spectrometry analysis. However, copper addition into the receptor–zinc complex significantly quenched the fluorescence at 420 nm, indicating the “On–Off” response, which was further confirmed by the UV-visible spectral analysis. Upon copper addition, the absorption peak at 300 gradually increased in intensity along with a red-shift of the rest of the peaks centered at 353, 372, and 392 nm, respectively. The well-defined isosbestic points at 350, 370, and 390 nm reflect the receptor–copper complex formation. The Job's plot and mass spectrometry analysis indicate the 1
1 complexation geometry was further supported by the NMR titration and mass spectrometry analysis. However, copper addition into the receptor–zinc complex significantly quenched the fluorescence at 420 nm, indicating the “On–Off” response, which was further confirmed by the UV-visible spectral analysis. Upon copper addition, the absorption peak at 300 gradually increased in intensity along with a red-shift of the rest of the peaks centered at 353, 372, and 392 nm, respectively. The well-defined isosbestic points at 350, 370, and 390 nm reflect the receptor–copper complex formation. The Job's plot and mass spectrometry analysis indicate the 1![[thin space (1/6-em)]](https://www.rsc.org/images/entities/char_2009.gif) :
:![[thin space (1/6-em)]](https://www.rsc.org/images/entities/char_2009.gif) 1 receptor–copper complex stoichiometry, displaying the association constant and detection limits value of 3.3 × 10⁵ M−1 and 9.37 × 10⁻⁶ M, respectively.
1 receptor–copper complex stoichiometry, displaying the association constant and detection limits value of 3.3 × 10⁵ M−1 and 9.37 × 10⁻⁶ M, respectively.
2.5. Anthraquinone-based Cu2+ sensor
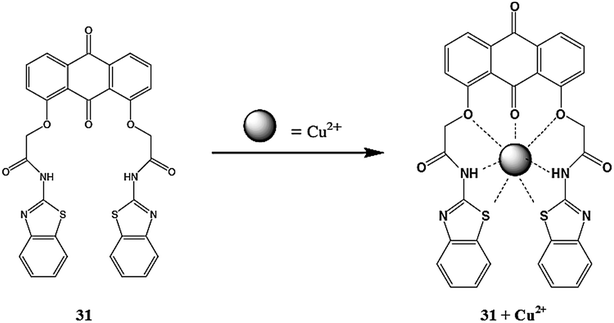
Ghosh et al.107 reported a new and an easy-to-make simple anthraquinone-based molecular receptor 31 (Fig. 27) for selective copper detection. The ligand 31 exhibited a fluorescence emission signal at 457 nm when it was excited at 380 nm, whereas copper addition caused significant quenching of the emission band at 457 with a slight blue-shift of 25 nm along with a colorimetric change in the reaction solution, indicating the “On–Off” type fluorogenic and chromogenic response toward copper binding. The ligand exhibited a ratiometric decrease in the emission signal intensity depending on the concentration of the copper ions, whereas the competitive metal ions did not exert pronounced changes in the probe solution. A fluorescence titration graph was utilized to determine the 1![[thin space (1/6-em)]](https://www.rsc.org/images/entities/char_2009.gif) :
:![[thin space (1/6-em)]](https://www.rsc.org/images/entities/char_2009.gif) 1 ligand–copper complexation stoichiometry along with the association constant value of (1.77 ± 0.34) × 104 M−1.
1 ligand–copper complexation stoichiometry along with the association constant value of (1.77 ± 0.34) × 104 M−1.
2.6. Quinoline-based Cu2+ sensors
Zhou et al.108 reported a novel fluorescent sensor 32 (Fig. 28) based on a quinoline derivative for detecting copper ions in a near-aqueous medium. The probe 32 alone exhibited the absorption maxima at 319 nm with a very low intensity, whereas upon copper addition into the probe solution, a drastic jump in the absorption signal at 319 was observed. The linear increase in the absorption signal intensity was found at 319 nm with a good agreement of the linearly dependent coefficient values (R = 0.99407). The Benesi–Hildebrand equation was used to determine the association constant by employing the UV-visible titration experiment, which was found to be 5.716 × 10⁴ mol−1, and this high association constant showed the strong affinity of the ligand toward copper binding. Similarly, ligand 32 exhibited negligible fluorescence in the absence of metallic species, whereas a significant enhancement in the fluorescence signal centered at 384 nm was observed upon copper addition when it was excited at 319 nm. The ligand solution showed a ratiometric increase in the fluorescence emission signal intensity on successive additions of copper ions. This linear increase in the absorption as well in the fluorescence signal intensity of the ligand solution upon copper binding suggests the 1![[thin space (1/6-em)]](https://www.rsc.org/images/entities/char_2009.gif) :
:![[thin space (1/6-em)]](https://www.rsc.org/images/entities/char_2009.gif) 1 binding stoichiometry of the ligand–metal complex. The binding behavior of the ligand toward copper ions was further observed by the method of continuous variation through a Job's curve, which confirmed the 1
1 binding stoichiometry of the ligand–metal complex. The binding behavior of the ligand toward copper ions was further observed by the method of continuous variation through a Job's curve, which confirmed the 1![[thin space (1/6-em)]](https://www.rsc.org/images/entities/char_2009.gif) :
:![[thin space (1/6-em)]](https://www.rsc.org/images/entities/char_2009.gif) 1 binding stoichiometry of the ligand toward copper ions. A further mechanistic insight was obtained through an NMR titration experiment as well as by DFT analysis. The sensor behaved specifically toward copper ions in comparison to the various competitive ions, as assessed through the optical analysis of the ligand solution upon miscellaneous ionic additions. Moreover, the ligand possessed a satisfactory limit of detection value of 4.23 × 10⁻⁶ mol L−1, which is sufficient for environmental sample analysis. For practical applicability, ligand 32 was further employed to detect the copper level inside live cells utilizing the SGC-7901 (human gastric cancer cell) cell lines through confocal fluorescence microscopy experiments. The bioimaging assay revealed the efficient cell permeability and low toxicity of the ligand toward live cells, as seen by the appearance of a bright green fluorescence from the cells without any deformation when the ligand mixed cells were incubated with copper ions.
1 binding stoichiometry of the ligand toward copper ions. A further mechanistic insight was obtained through an NMR titration experiment as well as by DFT analysis. The sensor behaved specifically toward copper ions in comparison to the various competitive ions, as assessed through the optical analysis of the ligand solution upon miscellaneous ionic additions. Moreover, the ligand possessed a satisfactory limit of detection value of 4.23 × 10⁻⁶ mol L−1, which is sufficient for environmental sample analysis. For practical applicability, ligand 32 was further employed to detect the copper level inside live cells utilizing the SGC-7901 (human gastric cancer cell) cell lines through confocal fluorescence microscopy experiments. The bioimaging assay revealed the efficient cell permeability and low toxicity of the ligand toward live cells, as seen by the appearance of a bright green fluorescence from the cells without any deformation when the ligand mixed cells were incubated with copper ions.
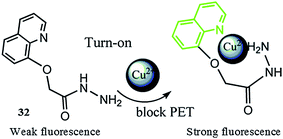 | ||
| Fig. 28 Chemical structure of ligand 32, proposed ligand–metal complexation mechanism and colorimetric change in the solution upon copper complexation. | ||
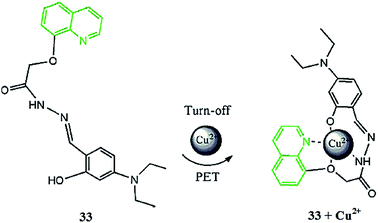
Zhou et al.109 reported a novel quinoline-based derivative 33 (Fig. 29), which exhibited signaling behaviors for Cu2+. The ligand exhibited an absorption signal at 351 nm in the absence of metallic species addition, whereas copper addition caused a significant decrease and red-shift in the absorption spectrum from 351 to 399 nm. Similarly, the ligand showed a strong emission band at 514 nm when it was excited at 399 nm, and copper addition caused quenching in the emission band at 514 nm along with a colorimetric change in the reaction solution. A 1![[thin space (1/6-em)]](https://www.rsc.org/images/entities/char_2009.gif) :
:![[thin space (1/6-em)]](https://www.rsc.org/images/entities/char_2009.gif) 1 ligand–metal complexation stoichiometry and 4.7735 × 10⁸ mol−1 association constant was found for the sensor utilizing the titration graph, and the sensitivity of the receptor toward the copper ions was calculated to be 6.6623 × 10⁻⁸ mol L−1. Furthermore, the sensor was utilized in a bioimaging experiment, in order to check its applicability to detect the copper level inside living cells, employing HeLa cells. The appearance of a bright fluorescence from the ligand-incubated cells revealed the efficient membrane permeability of the receptor.
1 ligand–metal complexation stoichiometry and 4.7735 × 10⁸ mol−1 association constant was found for the sensor utilizing the titration graph, and the sensitivity of the receptor toward the copper ions was calculated to be 6.6623 × 10⁻⁸ mol L−1. Furthermore, the sensor was utilized in a bioimaging experiment, in order to check its applicability to detect the copper level inside living cells, employing HeLa cells. The appearance of a bright fluorescence from the ligand-incubated cells revealed the efficient membrane permeability of the receptor.
Tang et al.110 described the fluorescent and colorimetric copper recognition properties of 2-(4-N-phenyl-3-thiosemicarbazone)-8-hydroxyquinoline 34 (Fig. 30) in mixed aqueous–organic media. The ligand 34 exhibited a strong fluorescence emission signal at 512 nm, which was drastically quenched on copper addition. Similarly, the ligand showed absorption signals with the maximum absorption intensity at 300 and 339 nm, whereas the addition of copper ions caused a significant decrease in the absorption signal intensity of both the signals along with the emergence of a new absorption band at 375 nm. Moreover, copper introduction into the ligand solution brought about a colorimetric change, which is useful for naked eye copper detection in the mixed aqueous–organic media. These characteristic changes in the ligand solution were found to be selective in comparison to various competitive ions. A linear decrease in the fluorescence emission intensity of the ligand was observed on the successive addition of copper ions and this titration graph was employed to determine the association constant, which was found to be 1.8 × 10⁸ M−1. The 1![[thin space (1/6-em)]](https://www.rsc.org/images/entities/char_2009.gif) :
:![[thin space (1/6-em)]](https://www.rsc.org/images/entities/char_2009.gif) 1 ligand–copper binding stoichiometry was calculated by the method of continuous variation. The ligand exhibited a 0.29 μM level detection sensitivity toward copper ions and behaves reversibly on sulfide ion addition as assessed by the significant increase in the fluorescence emission intensity and recovery of the original spectral response.
1 ligand–copper binding stoichiometry was calculated by the method of continuous variation. The ligand exhibited a 0.29 μM level detection sensitivity toward copper ions and behaves reversibly on sulfide ion addition as assessed by the significant increase in the fluorescence emission intensity and recovery of the original spectral response.
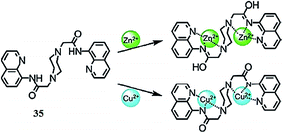
Jiang et al.111 reported an efficient sensor 35 (Fig. 31) for Zn2+ and Cu2+. The addition of zinc ions into the probe solution caused a significant enhancement in the emission signal along with a 90 nm red-shift, whereas copper addition caused a drastic quenching in the emission signal intensity when it was excited at 329 nm. Such changes were not observed with the competitive metal ions. Similarly, copper addition caused a red-shift in the absorption signal from 311 nm to 351 nm along with emergence of two isosbestic points at 280 and 330 nm, respectively. Mechanistic insights were obtained from the single crystal X-ray diffraction analysis, NMR titration, DFT calculation and mass spectrometry studies. The proposed ligand–metal complexation mechanism is given in Fig. 31. The probe exhibited a 0.45 μM detection limit toward copper ions, as determined using the fluorescence titration graph of the probe on successive copper additions, which caused a progressive decrease in the emission signal centered at 402 and 492 nm. These characteristic changes in the probe solution on metal addition suggest that the probe could serve as an “Off–On” sensor for both zinc ions and copper ions.
Tang et al.112 reported a new quinoline derivatized thiosemicarbazone 36 (Fig. 32) for the selective detection of copper ions. Receptor 36 exhibited a strong emission signal at 512 nm when it was excited at 340 nm, whereas copper addition significantly quenched this emission signal. Similarly, copper addition caused an enhancement in the absorption signal intensity at 300 and 340 nm with the concomitant emergence of a new signal at 374 nm along with a colorimetric change in the reaction solution from colorless to yellow. The 1![[thin space (1/6-em)]](https://www.rsc.org/images/entities/char_2009.gif) :
:![[thin space (1/6-em)]](https://www.rsc.org/images/entities/char_2009.gif) 1 receptor–copper complexation stoichiometry was calculated using a Job's plot, and was further confirmed by the mass spectrometry analysis and DFT calculation. The association constant of the receptor toward the copper ions was calculated to be 4.41 × 10⁸ M−1, which reflects the strong binding affinity of the receptor toward copper ions. Sulfide ion addition caused a fluorescence enhancement of the receptor–copper complex along with a colorimetric change in the reaction solution, leading to confirm that the initial features of the receptor permit the reversibility of the ligand with sulfide ion addition, whereas other anionic species did not induce such a change in the complex solution. The probe 36 exhibited detection limit values of 1.4 × 10⁻⁶ M toward copper detection.
1 receptor–copper complexation stoichiometry was calculated using a Job's plot, and was further confirmed by the mass spectrometry analysis and DFT calculation. The association constant of the receptor toward the copper ions was calculated to be 4.41 × 10⁸ M−1, which reflects the strong binding affinity of the receptor toward copper ions. Sulfide ion addition caused a fluorescence enhancement of the receptor–copper complex along with a colorimetric change in the reaction solution, leading to confirm that the initial features of the receptor permit the reversibility of the ligand with sulfide ion addition, whereas other anionic species did not induce such a change in the complex solution. The probe 36 exhibited detection limit values of 1.4 × 10⁻⁶ M toward copper detection.
 | ||
| Fig. 32 ORTEP diagram of receptor 36 and the energy-minimized structure of the ligand–metal complex. | ||
Gao et al.113 reported a new Schiff base derivative 37 (Fig. 33) for selective copper detection. The ligand 37 exhibited a fluorescence emission signal at 468 nm when it was excited at 410 nm, whereas copper addition caused a drastic fluorescence quenching, reflecting the “On–Off” copper sensing behavior. The stability constant value of the ligand toward copper was calculated to be 1.11 × 10⁵ M−1 and this high value suggests the efficient tendency of the receptor toward copper binding. The ligand exhibited a detection limit of 8.68 × 10⁻⁶ M toward copper monitoring. Similarly, copper ions triggered a significant decline in the absorption signal at 334 nm with a concomitant increase in the absorption signal at 406 nm along with a colorimetric change in the reaction solution from colorless to yellow and a clear isosbestic point at 356 nm, suggesting copper complex formation, whereas other competitive ions did not obviously exhibit such changes in the spectrum. The UV-visible and fluorescence titration graphs were employed to find the 1![[thin space (1/6-em)]](https://www.rsc.org/images/entities/char_2009.gif) :
:![[thin space (1/6-em)]](https://www.rsc.org/images/entities/char_2009.gif) 1 ligand–metal binding stoichiometry further assisted by the mass spectrometry analysis. The ligand–copper complex solution underwent colorimetric change from the yellow to colorless along with the recovery of the original spectral response upon sulfide ion addition, which might open up the sensing ability of the receptor for sulfide ions. Such phenomena were not observed for a number of competing anionic species.
1 ligand–metal binding stoichiometry further assisted by the mass spectrometry analysis. The ligand–copper complex solution underwent colorimetric change from the yellow to colorless along with the recovery of the original spectral response upon sulfide ion addition, which might open up the sensing ability of the receptor for sulfide ions. Such phenomena were not observed for a number of competing anionic species.
2.7. Macrocyclic copper sensors
Yang et al.114 reported a novel chiral perazamacrocyclic fluorescent sensor 38 (Fig. 34) for the fluorescence sensing of copper ions. The probe 38 exhibited an emission signal at 380 nm when it was excited at 331 nm, and this emission signal was significantly quenched upon copper addition into the probe solution. These characteristics changes in the emission spectra revealed the applicability of the resulting probe 38 as an “On–Off” sensor for the selective detection of copper ions, compared to other competitive ions. The 1![[thin space (1/6-em)]](https://www.rsc.org/images/entities/char_2009.gif) :
:![[thin space (1/6-em)]](https://www.rsc.org/images/entities/char_2009.gif) 1 ligand–metal binding stoichiometry was assessed by the Job's method and further mechanistic insight was obtained through mass spectrometry analysis, and the mass spectrometry results were consistent with those obtained by the optical analysis. Furthermore, after copper addition, the in situ generated Cu(II)-containing complex of 38 exhibited remarkable fluorescence enhancement responses and considerable enantioselectivities toward unmodified R-amino acids in protic solutions via a ligand displacement mechanism.
1 ligand–metal binding stoichiometry was assessed by the Job's method and further mechanistic insight was obtained through mass spectrometry analysis, and the mass spectrometry results were consistent with those obtained by the optical analysis. Furthermore, after copper addition, the in situ generated Cu(II)-containing complex of 38 exhibited remarkable fluorescence enhancement responses and considerable enantioselectivities toward unmodified R-amino acids in protic solutions via a ligand displacement mechanism.
Basa et al.115 described the synthesis and dual sensing properties of the anthracen-9-ol derivative 39 (Fig. 35) for copper and zinc ions. The receptor 39 exhibited an absorption signal with the maximum intensity at 325 and 386 nm. The successive additions of Zn2+ into the receptor solution caused a red-shift in the absorption signal due to zinc-mediated imine–enamine tautomerization. The introduction of Zn2+ also revealed manifold concomitant anthracene absorbance under the broad absorption band of the starting material along with a colorimetric change in the reaction solution, which permits the naked eye detection of Zn2+ in the reaction media. Compound 39 showed a nice selectivity and 42-fold fluorescence enhancement with a bright blue emission on 5 equivalents Zn2+ addition. The 1![[thin space (1/6-em)]](https://www.rsc.org/images/entities/char_2009.gif) :
:![[thin space (1/6-em)]](https://www.rsc.org/images/entities/char_2009.gif) 1 ligand–metal binding stoichiometry was observed using the method of continuous variation with the association constant value of 8.0 × 10⁶ M−1, and this strong association constant suggest the tenacious binding affinity of the ligand toward the zinc ion in the solution. The ligand showed a ratiometric enhancement in the fluorescence emission intensity on increasing the zinc ion concentration, and this emission signal intensity remained stable during the competitive addition of other alkali and alkaline earth metals, except for Pb2+, Fe3+/Fe2+, and Hg2+, which caused fluorescence quenching due to their paramagnetic and heavy atom effect. Moreover, interesting results were obtained from copper addition into the receptor 39 solution, which caused a momentous fluorescence quenching along with a strong colorimetric change in the reaction solution from pale yellow to orange-brown. The UV-visible absorption results further revealed the binding efficacy of receptor 39 with copper ions by the characteristic enhancement in the absorption intensity at 473 nm and a decrease in the absorption signal at 324 nm upon increasing the copper ion concentration. The 1
1 ligand–metal binding stoichiometry was observed using the method of continuous variation with the association constant value of 8.0 × 10⁶ M−1, and this strong association constant suggest the tenacious binding affinity of the ligand toward the zinc ion in the solution. The ligand showed a ratiometric enhancement in the fluorescence emission intensity on increasing the zinc ion concentration, and this emission signal intensity remained stable during the competitive addition of other alkali and alkaline earth metals, except for Pb2+, Fe3+/Fe2+, and Hg2+, which caused fluorescence quenching due to their paramagnetic and heavy atom effect. Moreover, interesting results were obtained from copper addition into the receptor 39 solution, which caused a momentous fluorescence quenching along with a strong colorimetric change in the reaction solution from pale yellow to orange-brown. The UV-visible absorption results further revealed the binding efficacy of receptor 39 with copper ions by the characteristic enhancement in the absorption intensity at 473 nm and a decrease in the absorption signal at 324 nm upon increasing the copper ion concentration. The 1![[thin space (1/6-em)]](https://www.rsc.org/images/entities/char_2009.gif) :
:![[thin space (1/6-em)]](https://www.rsc.org/images/entities/char_2009.gif) 1 receptor–copper binding affinity was determined by the method of continuous variation and further assisted by a mass spectrometry analysis. The resulting complex could be further hydrolyzed in the presence of water, as confirmed by the mass spectrometry as well as single crystal X-ray diffraction analyses. Hence, the interesting features of the single molecular system 39 with an “Off–On” fluorescence response toward Zn2+ and an “Off–On” colorimetric response on copper binding may have potential application in trace ionic detection.
1 receptor–copper binding affinity was determined by the method of continuous variation and further assisted by a mass spectrometry analysis. The resulting complex could be further hydrolyzed in the presence of water, as confirmed by the mass spectrometry as well as single crystal X-ray diffraction analyses. Hence, the interesting features of the single molecular system 39 with an “Off–On” fluorescence response toward Zn2+ and an “Off–On” colorimetric response on copper binding may have potential application in trace ionic detection.
 | ||
| Fig. 35 Chemical structure of receptor 39, proposed receptor–copper complexation mechanism and water-promoted hydrolysis of the receptor–copper complex. | ||
Singh et al.116 described the sensor 40 (Fig. 36) for selective copper and cyanide ion detection. The receptor exhibited an absorption signal in the range of 541–546 nm and a fluorescence emission band at 574–579 nm when the excitation slit was fixed at 500 nm. Copper addition caused a gradual decrease in the absorption signal at 546 nm with the concomitant emergence of a new band at 526 nm, which increased ratiometrically depending on the copper ion concentration. The absorption spectra of the probe exhibited a clear isosbestic point at 535 nm on titration with copper ions. Similarly, copper addition caused quenching in the fluorescence emission signal at 559 nm along with the emergence of a new blue-shifted signal at 553 nm, which increased in intensity with an increasing copper ion concentration, thus suggesting complex formation; moreover, the linear changes in the emission and absorption signal enable the receptor to be applied as a ratiometric copper analyzing probe. A titration graph was used to determine the ligand–metal binding stoichiometry, and the proposed complexation mechanism is given in Fig. 36. The association constant of the receptor toward copper binding was found to be 0.8 × 10⁵ M−1, and the calculated value for the detection limit was 5 × 10⁻⁷ M. Moreover, the quenched fluorescence of the ligand–copper complex was significantly recovered upon cyanide addition, suggesting the “Off–On” sensing of cyanide ions via fluorimetric measurements as well as by naked eye detection with an detection limit of 8 × 10⁻⁶ M. The low intensity emission signal from this type of sensor material provides a very good basis for its utilization in bioimaging studies.
Liu et al.117 reported a two-photon excited fluorescent chemosensor 41 (Fig. 37) for Cu2+ detection. The probe 41 exhibited the absorption band with the maximum absorption intensity at 368 nm, whereas copper addition caused a significant decline in the absorption signal at 368 nm along with the appearance of a new high energy absorption band at 343 nm, which describes the internal charge transfer inside the ligand by integrating the copper chelation domain into the fluorescence motif. The 1![[thin space (1/6-em)]](https://www.rsc.org/images/entities/char_2009.gif) :
:![[thin space (1/6-em)]](https://www.rsc.org/images/entities/char_2009.gif) 1 ligand–metal binding stoichiometry was evaluated by the method of continuous variation, and the Benesi–Hildebrand equation was utilized to determine the association constant, i.e., 1.04 × 10⁵ M−1. The probe behaved specifically toward copper ions, compared to a number of competing ionic species. The designed sensor was successfully applied to the homogeneous quantitative determination of Cu2+ in a serum medium in a linear range from 0.04 to 2.0 μM.
1 ligand–metal binding stoichiometry was evaluated by the method of continuous variation, and the Benesi–Hildebrand equation was utilized to determine the association constant, i.e., 1.04 × 10⁵ M−1. The probe behaved specifically toward copper ions, compared to a number of competing ionic species. The designed sensor was successfully applied to the homogeneous quantitative determination of Cu2+ in a serum medium in a linear range from 0.04 to 2.0 μM.
Jang et al.118 reported a new cavitand derivative 42 (Fig. 38) bearing four coumarin groups for selective copper recognition. The receptor exhibited a strong fluorescence emission signal when it was excited at 357 nm, whereas copper addition caused a significant quenching in the fluorescence emission signal intensity along with a 30 nm red-shift in the spectral position. A similar red-shift was shown in case of the UV-visible absorption spectral measurement. The Job's plot indicated the 1![[thin space (1/6-em)]](https://www.rsc.org/images/entities/char_2009.gif) :
:![[thin space (1/6-em)]](https://www.rsc.org/images/entities/char_2009.gif) 4 ligand–copper binding stoichiometry and the dissociation constant values of 3 μM. Further mechanistic insight was obtained through the FT-IR and mass spectrometry analyses, and the results are consistent with those obtained using the Job's curve.
4 ligand–copper binding stoichiometry and the dissociation constant values of 3 μM. Further mechanistic insight was obtained through the FT-IR and mass spectrometry analyses, and the results are consistent with those obtained using the Job's curve.
2.8. Triazole-based Cu2+ sensors
Zhang et al.119 described molecular pockets (43 and 44, Fig. 39) in the form of a tripod made of cholic acid that had the capability to solubilize pyrene in polar media as a result of the facial amphiphilicity of bile acids.1,2,3-Triazole containing trimers were found to possess the potential for metal complexation, as assessed by electron paramagnetic resonance spectroscopy. The introduction of copper and zinc ions into a solution of pyrene caused significant fluorescence quenching and the copper exhibited more quenching in comparison to zinc ions, resulting in the formation of 1,2,3-triazole groups via a click reaction. This heterocyclic skeleton can coordinate with metal ions. The decrease in the fluorescence intensity can be utilized as the criteria for metal ion detection. From the fluorescence titration experiment, the 1![[thin space (1/6-em)]](https://www.rsc.org/images/entities/char_2009.gif) :
:![[thin space (1/6-em)]](https://www.rsc.org/images/entities/char_2009.gif) 1 trimer–metal binding stoichiometry was estimated, and the proposed binding mechanism is given in Fig. 40. The fluorescence spectral analysis suggests the entrance of the pyrene moiety into the hydrophobic cavity of the trimer, and then the metal coordination with the 1,2,3-triazole nucleus brings the metal ions closer to the pyrene nucleus inside the cavity formed by the trimer. This phenomenon is responsible for the larger degree of fluorescence quenching of the pyrene moiety. The ppm level detection of the trimer makes it an interesting candidate to detect metal contamination inside pure water media as well as inside biological samples and offers advantages over organic chemosensors, in which the majority of them are water insoluble and need toxic organic solvents for their operation. The fluorescence quenching by trimer 43 was greater, compared to trimer 44, wherein the major reason for the lower efficiency of trimer 44 is the lack of a chelating unit. Fluorescence spectral studies revealed that quenching of fluorescence in the case of trimer 43 on copper addition was due to the micro-molar detection efficiency, which was much greater compared to that of trimer 44. These results revealed that trimer 44 can separate the copper ions from the pyrene unit located inside the cavity. The efficient fluorescence sensitivity and fair water solubility of the trimers make them useful chemosensors for heavy metal ions in environmental and biomedical analysis. Moreover, the coordination capacity of such pockets toward the metal ions might be useful to be used a catalyst or to mimic the active site of a metal-containing enzyme.
1 trimer–metal binding stoichiometry was estimated, and the proposed binding mechanism is given in Fig. 40. The fluorescence spectral analysis suggests the entrance of the pyrene moiety into the hydrophobic cavity of the trimer, and then the metal coordination with the 1,2,3-triazole nucleus brings the metal ions closer to the pyrene nucleus inside the cavity formed by the trimer. This phenomenon is responsible for the larger degree of fluorescence quenching of the pyrene moiety. The ppm level detection of the trimer makes it an interesting candidate to detect metal contamination inside pure water media as well as inside biological samples and offers advantages over organic chemosensors, in which the majority of them are water insoluble and need toxic organic solvents for their operation. The fluorescence quenching by trimer 43 was greater, compared to trimer 44, wherein the major reason for the lower efficiency of trimer 44 is the lack of a chelating unit. Fluorescence spectral studies revealed that quenching of fluorescence in the case of trimer 43 on copper addition was due to the micro-molar detection efficiency, which was much greater compared to that of trimer 44. These results revealed that trimer 44 can separate the copper ions from the pyrene unit located inside the cavity. The efficient fluorescence sensitivity and fair water solubility of the trimers make them useful chemosensors for heavy metal ions in environmental and biomedical analysis. Moreover, the coordination capacity of such pockets toward the metal ions might be useful to be used a catalyst or to mimic the active site of a metal-containing enzyme.
Hrishikesan et al.120 reported the Cu2+-specific colorimetric sensing properties of bis-triazole-appended azobenzene receptors 45 (Fig. 41) in mixed aqueous–organic media. Receptor 45 exhibited absorption maxima at 459 nm in the absence of any ionic species. The introduction of copper ions into the reaction solution of 45 triggered a new absorption band at 342 nm with a gradual decrease in the signal at 459 nm and the emergence of a clear isosbestic point at 383 nm. 3 equivalents copper addition caused a significant variation in the probe absorption spectra along with a colorimetric change in the solution, which could be employed for naked eye copper detection. However, this behavior of ligand 45 was found to be selective in comparison to other competitive ionic species. The 1![[thin space (1/6-em)]](https://www.rsc.org/images/entities/char_2009.gif) :
:![[thin space (1/6-em)]](https://www.rsc.org/images/entities/char_2009.gif) 1 ligand–metal binding stoichiometry was evaluated using the Job's curve and the binding constant was calculated by the Benesi–Hildebrand equation utilizing the UV-visible titration graph to obtain a value (Ka) of 0.7 × 10⁴ M−1. Further mechanistic insight was obtained through the FT-IR spectral analysis, which clearly suggested the involvement of the triazole nucleus in the binding with the copper ions.
1 ligand–metal binding stoichiometry was evaluated using the Job's curve and the binding constant was calculated by the Benesi–Hildebrand equation utilizing the UV-visible titration graph to obtain a value (Ka) of 0.7 × 10⁴ M−1. Further mechanistic insight was obtained through the FT-IR spectral analysis, which clearly suggested the involvement of the triazole nucleus in the binding with the copper ions.
Midya et al.121 reported a novel fluorescent molecular probe 46 (Fig. 42) using the Cu(I)-catalyzed Huisgen cycloaddition of 1,3-diethynyl-6-fluoroisoquinoline to 1-(2-azidoethyl)pyrrolidine. The probe was completely water soluble and exhibited very good sensitivity toward the environmentally and biological relevant metallic ion in the aqueous solution under neutral pH conditions. Probe 46 exhibited the fluorescence emission signal with the maximum intensity at 390 nm when it was excited at 325 nm. However, the introduction of Zn2+ and Cd2+ caused a gradual increase in the probe emission signal at 390 nm, whereas the addition of Cu2+ and Fe2+ caused a significant quenching of the emission signal. Fe3+ addition also led to a negligible fluorescence change in the probe emission spectrum. Moreover, there was very little fluorescence interruption with the other competitive ions, including Li+, Na+, Mg2+, Sr2+, Al3+, Mn2+, Pb2+ and Sn2+. These results revealed the applicability of the probe toward the divalent transition metal ions with a greater sensitivity toward Zn2+ ions. The applicability of the probe was further explored for the fabrication of a logic gate and for intracellular metal detection. A bioimaging experiment was conducted by utilizing A375 cells, wherein the appearance of bright fluorescence from the cells incubated with the probe and metals suggested a successful applicability of the sensor toward live cells.
Kaur et al.122 reported the hetarylazo derivative 47 (Fig. 43) for selective copper detection. The probe solution was yellow and exhibited absorption signals at 270 and 416 nm. The gradual addition of copper ions caused a bathochromic shift in the absorption signals at 270 and 416 nm to 288 and 535 nm, along with a colorimetric change in the reaction solution from yellow to purple. The UV-visible titration of the probe with copper ions triggered three well-defined isosbestic points at 277, 343 and 472 nm, respectively, indicating the equilibrium between the receptor and the newly formed receptor–copper complex. The titration graph gives the 1![[thin space (1/6-em)]](https://www.rsc.org/images/entities/char_2009.gif) :
:![[thin space (1/6-em)]](https://www.rsc.org/images/entities/char_2009.gif) 1 ligand–copper binding stoichiometry with a detection limit of 1.36 × 10⁻⁵ M. Cyanide ion addition reverted the original spectrum of the probe when added to the probe–copper complex, thus revealing the reversible nature of the sensor.
1 ligand–copper binding stoichiometry with a detection limit of 1.36 × 10⁻⁵ M. Cyanide ion addition reverted the original spectrum of the probe when added to the probe–copper complex, thus revealing the reversible nature of the sensor.
2.9. Thiazole-based Cu2+ sensors
Wu et al.123 reported the donor–acceptor system of indoline–benzothiadiazole (48 and 49, Fig. 44) for selective copper detection via radical generation. The sensors 48 and 49 exhibited broad absorption bands at 512 nm and 490 nm, respectively. The copper addition triggered new absorption bands in the near-infrared regions centered at 400, 532, 633, 872 and 959 nm for 48 and 396, 646, and 1042 nm for 49 with a concomitant decrease in the ICT bands at 512 and 490 nm. The receptor solution exhibited well-defined isosbestic points at 375, 445, and 529 nm for sensor 48 and 437 and 529 for the sensor 49, reflecting the generation of the secondary species in the reaction solution. The absorption titration caused a linear increase in the absorption intensity upon successive copper addition, which suggested the 1![[thin space (1/6-em)]](https://www.rsc.org/images/entities/char_2009.gif) :
:![[thin space (1/6-em)]](https://www.rsc.org/images/entities/char_2009.gif) 1 host–guest stoichiometry. Similarly, the sensor showed fluorescence emission signals at 750 and 720 nm that were completely quenched upon copper addition along with a colorimetric change in the reaction solution attributed to the copper-induced radical cation formation. The sensor 48 exhibited a detection limit of 1.03 × 10⁻⁶ M, which is a precisely low value for environmental detection. The reported near-infrared probe might have potential application as a low energy probe for biomedical analysis.
1 host–guest stoichiometry. Similarly, the sensor showed fluorescence emission signals at 750 and 720 nm that were completely quenched upon copper addition along with a colorimetric change in the reaction solution attributed to the copper-induced radical cation formation. The sensor 48 exhibited a detection limit of 1.03 × 10⁻⁶ M, which is a precisely low value for environmental detection. The reported near-infrared probe might have potential application as a low energy probe for biomedical analysis.
2.10. Ferrocene-based Cu2+ sensors
Basurto et al.124 reported new ferrocene derivatives bearing two donor–acceptor systems 50–52 (Fig. 45) capable of the selective sensing of cations and anions. The receptors 50–52 were completely soluble in acetonitrile, and this solvent was the best choice for the cation complexation test. In the case of UV-visible absorption spectroscopy measurements, receptors 50–52 exhibited absorption signals with the maximum absorption at 443, 448 and 448 due to the intermolecular charge transfer between the amine group and the thiobarbituric moiety; furthermore, this process was responsible for the strong yellow color of their solutions. However, 2 equivalents copper addition into the receptor solution caused a discoloration of the reaction solution. This discoloration phenomenon was found only for copper ions, irrespective of the structural variation of different compounds, whereas other common alkali metals or alkaline earth metal cations exerted no such effects on the receptor solution. These characteristic changes in the color of the receptor solution on copper addition permit the naked eye selective detection of copper ions in a solution. The receptor exhibited a copper concentration-dependent variation in the UV-visible absorption signals with the clear isosbestic points revealing the selective complexation tendency of these receptors toward copper ions. A mechanistic insight was obtained through the absorption titration experiments as well by NMR titration with an increasing concentration of copper ions; the proposed ligand–metal binding models are shown in Fig. 45. Furthermore, the discoloration can be triggered by the 5 equivalents addition of F−1, CN−1, BzO−1, AcO−1, and H2PO4−1 ion into the receptor solution, irrespective of the variation in their structures; however, the extent of discoloration was much lower than that observed in the case of copper ions. Similarly, there were certain changes in the UV-visible absorption spectra on the 5 equivalents addition of these ionic species. There was no such effect for a number of other competing analytes, suggesting the naked eye selective colorimetric detection of acetate, benzoate, or cyanide anions as well, which are ions of toxicological and biological relevance.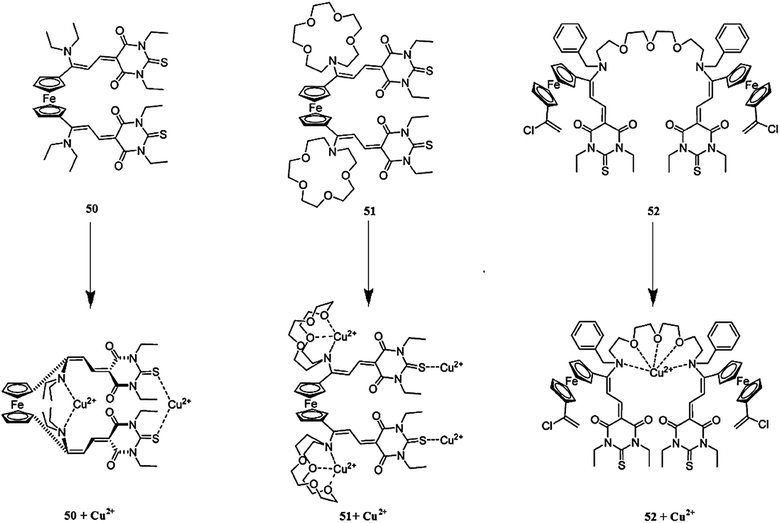 | ||
| Fig. 45 Chemical structure of receptors 50, 51 and 52 along with the proposed complexation mechanism toward copper ions. | ||
2.11. Pyrene-based Cu2+ sensors
Xie et al.125 reported two N-pyrenylacetamide-substituted sugar-aza-crown ethers 53 and 54 (Fig. 46) as fluorescent chemosensors for selective copper detection. Receptor 53 exhibited fluorescence emission signals with the maximum intensity at 385 and 480 nm, which are a characteristic signals for the pyrene monomer and corresponding excimer, respectively, whereas receptor 54 exhibited emission signals at 405 and 485 nm, respectively. The metal-binding properties of the receptors were assessed by the addition of the alkali and alkaline earth metal ions as well as transition metals. The total fluorescence intensity was significantly quenched in the presence of copper ions, which had a higher magnitude, and to a relatively lesser extent with Cd2+. Only a slight quenching was observed in case of Pb2+ and Zn2+. However, in the competition experiment with 100 equivalents copper addition into the competing metal–ligand solution, copper was the only metal that caused fluorescence quenching. The fluorescence intensity of the receptor was found to be quenched linearly on progressive copper additions, and this titration experiment was utilized to determine the 1![[thin space (1/6-em)]](https://www.rsc.org/images/entities/char_2009.gif) :
:![[thin space (1/6-em)]](https://www.rsc.org/images/entities/char_2009.gif) 1 receptor–copper complexation stoichiometry with the high stability constant values of K(Cu2+: 53) = 6.7 ± 0.2 and log
1 receptor–copper complexation stoichiometry with the high stability constant values of K(Cu2+: 53) = 6.7 ± 0.2 and log![[thin space (1/6-em)]](https://www.rsc.org/images/entities/char_2009.gif) K(Cu2+: 54) = 7.8 ± 0.3. The lowest detection capacity of both receptors toward copper ions was found to be 40 nM, which was calculated as three times the standard deviation of the background noise from the calibration curve.
K(Cu2+: 54) = 7.8 ± 0.3. The lowest detection capacity of both receptors toward copper ions was found to be 40 nM, which was calculated as three times the standard deviation of the background noise from the calibration curve.
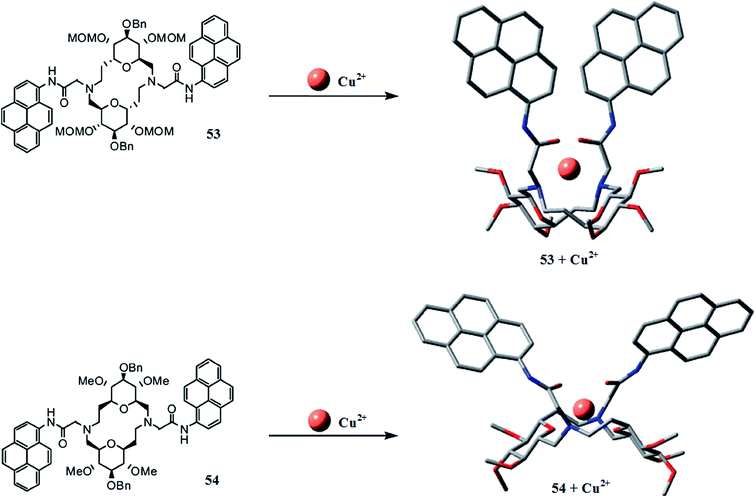 | ||
| Fig. 46 Chemical structure of receptor 53 and 54 along with the DFT-calculated receptor–metal complexation mechanism. | ||
Wu et al.126 reported a new pyrene derivative containing a picolinohydrazide moiety 55 (Fig. 47) for selective copper detection. The receptor was colorless and exhibited an absorption band centered at 360 nm, whereas it had a very weak fluorescence emission band due to the pyrene moiety. Copper addition caused the appearance of a new emission band at 455 nm, which increased in intensity on successive copper additions, whereas other competing species did not exhibit such a response. The 1![[thin space (1/6-em)]](https://www.rsc.org/images/entities/char_2009.gif) :
:![[thin space (1/6-em)]](https://www.rsc.org/images/entities/char_2009.gif) 1 ligand–copper stoichiometry was calculated by utilizing the fluorescence titration graph, and the association constant was calculated to be 2.75 × 10³ M−1. Further mechanistic insight was obtained from the mass spectrometry and NMR titration experiment. The ligand was further employed in the bioimaging experiment to determine its applicability for intracellular copper detection. The appearance of blue fluorescence from the live cells upon incubation of the cells with the copper ions and probe revealed the potential applicability of the receptor toward copper detection inside live cells as assessed by utilizing HeLa cells under a confocal fluorescence microscope.
1 ligand–copper stoichiometry was calculated by utilizing the fluorescence titration graph, and the association constant was calculated to be 2.75 × 10³ M−1. Further mechanistic insight was obtained from the mass spectrometry and NMR titration experiment. The ligand was further employed in the bioimaging experiment to determine its applicability for intracellular copper detection. The appearance of blue fluorescence from the live cells upon incubation of the cells with the copper ions and probe revealed the potential applicability of the receptor toward copper detection inside live cells as assessed by utilizing HeLa cells under a confocal fluorescence microscope.
Goswami et al.127 reported a new pyrene-based fluorescence probe 56 (Fig. 48) for the fluorogenic detection of Cu2+ in mixed aqueous–organic media. The receptor 56 exhibited an enhancement in the fluorescence emission signal intensity with the maximum emission at 414 nm when it was excited at 330 nm on copper addition, whereas competitive metal ions did not show this behavior. A ratiometric increment in the fluorescence emission signal with a good linear relationship was observed on successive copper additions, and this titration graph was used for the determination of the ligand–metal binding stoichiometry, i.e., 1![[thin space (1/6-em)]](https://www.rsc.org/images/entities/char_2009.gif) :
:![[thin space (1/6-em)]](https://www.rsc.org/images/entities/char_2009.gif) 1, which was further assisted by the mass spectrometry analysis. The detection limit of ligand 56 toward copper ions was calculated to be 1.21 μM. In addition to this cationic detection, ligand 56 was further tested for anionic detection. Interestingly, there was an appearance of a new emission band at 448 nm with a 29 nm red-shift from the parent emission signal of the receptor in the presence of fluoride ions when it was excited at 330 nm along with a colorimetric change in the reaction solution under a UV lamp. The Job's plot based on the fluorescence emission change at 448 nm suggested the 1
1, which was further assisted by the mass spectrometry analysis. The detection limit of ligand 56 toward copper ions was calculated to be 1.21 μM. In addition to this cationic detection, ligand 56 was further tested for anionic detection. Interestingly, there was an appearance of a new emission band at 448 nm with a 29 nm red-shift from the parent emission signal of the receptor in the presence of fluoride ions when it was excited at 330 nm along with a colorimetric change in the reaction solution under a UV lamp. The Job's plot based on the fluorescence emission change at 448 nm suggested the 1![[thin space (1/6-em)]](https://www.rsc.org/images/entities/char_2009.gif) :
:![[thin space (1/6-em)]](https://www.rsc.org/images/entities/char_2009.gif) 1 receptor–fluoride ion binding stoichiometry, along with the detection limit of 2.91 μM. There were no significant changes observed in the presence of a number of other competing species. The NMR titration experiment provided further confirmation of the 1
1 receptor–fluoride ion binding stoichiometry, along with the detection limit of 2.91 μM. There were no significant changes observed in the presence of a number of other competing species. The NMR titration experiment provided further confirmation of the 1![[thin space (1/6-em)]](https://www.rsc.org/images/entities/char_2009.gif) :
:![[thin space (1/6-em)]](https://www.rsc.org/images/entities/char_2009.gif) 1 binding mode of the receptor toward fluoride ions. The appearance of bright fluorescence from both prokaryotic (Candida albicans cells) and eukaryotic (Tecoma stans pollen cells) living cells revealed the appreciable cell permeability and viability of the receptor for the detection of the ionic species in the intracellular media. This type of selective displacement behavior of the receptor can be further integrated to mimic the “OR” logic gate by combining two different wavelengths, i.e., λmax = 448 nm or λmax = 414 nm.
1 binding mode of the receptor toward fluoride ions. The appearance of bright fluorescence from both prokaryotic (Candida albicans cells) and eukaryotic (Tecoma stans pollen cells) living cells revealed the appreciable cell permeability and viability of the receptor for the detection of the ionic species in the intracellular media. This type of selective displacement behavior of the receptor can be further integrated to mimic the “OR” logic gate by combining two different wavelengths, i.e., λmax = 448 nm or λmax = 414 nm.
Sarkar et al.128 reported a pyrene-based simple fluorosensor 57 (Fig. 49) for selective copper detection. Probe 57 exhibited two weak broad band emission signals at 385 and 452 nm when it was excited at 350 nm. Copper introduction into the receptor solution caused a significant enhancement in the excimer peak at 452 nm along with the emergence of two prominent monomer peaks at 378 and 396 nm, and the fluorescence intensity was enhanced up to 10-fold, which was attributed to the hindrance of the photoinduced electron transfer process upon ligand–metal complexation, involving the amino lone pair of electrons. Similarly, the ligand showed a UV-visible absorption signal in the range of 340–380 nm, which was significantly reduced upon copper addition along with the generation of a new peak at 395 nm and a clear isosbestic point centered at 385 nm, indicating receptor–copper complexation. These characteristic changes in UV-visible absorption as well as in the fluorescence emission signal along with the colorimetric change in the solution were found to be selective only upon copper addition. Other competitive ions did not shown an obvious variation, thus reflecting the specific affinity of the receptor toward copper ions. The sensor exhibited a detection limit of 4 × 10⁻⁸ M and mechanistic insight was obtained using a Job's plot and NMR analysis as well as mass spectrometry measurement. The proposed ligand–copper complexation mechanism is given in Fig. 49. The receptor behaved reversibly upon the addition of the KI, as assessed by the recovery of the initial values of the free probe.
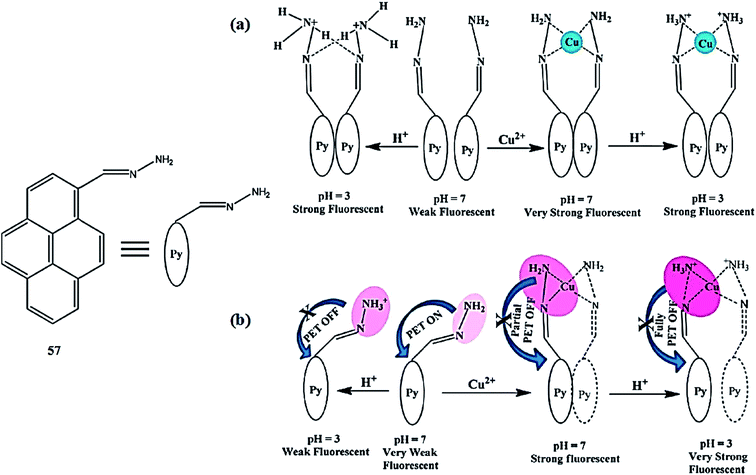 | ||
| Fig. 49 Chemical structure of receptor 57 and the proposed mechanism for the effect of pH variation on the excimer (a) and monomer (b) emission of 57 in the absence and presence of Cu2+ ions. | ||
Bhorge et al.129 reported a new receptor 58 (Fig. 50) for the detection of Cu2+ and Fe3+ in solution phase and inside the biological media. The receptor exhibited UV-visible absorption signals at 355 and 452 nm. Copper addition declined both the absorption signals. The titration experiment of the receptor with copper ions caused a blue-shift in both signals with clear isosbestic points at 349 and 414 nm along with a colorimetric change in the reaction solution from yellow to pale lemon. The 1![[thin space (1/6-em)]](https://www.rsc.org/images/entities/char_2009.gif) :
:![[thin space (1/6-em)]](https://www.rsc.org/images/entities/char_2009.gif) 1 ligand–copper binding stoichiometry was calculated by the method of continuous variation, and the detection limit was calculated to be (2.17 ± 0.02) × 10−6 M. Further mechanistic insight was obtained through NMR titration and mass spectrometry analysis. Ferric ion addition caused the fluorescence enhancement at 438 nm, suggesting the applicability of the receptor for Fe3+ detection, as well a sensitivity of (3.19 ± 0.02) × 10−6 M. The receptor was further employed for live cell imaging, wherein the appearance of a bright blue fluorescence from the cells on metallic ion incubation indicated the potential practical utility of the probe for intracellular metal detection.
1 ligand–copper binding stoichiometry was calculated by the method of continuous variation, and the detection limit was calculated to be (2.17 ± 0.02) × 10−6 M. Further mechanistic insight was obtained through NMR titration and mass spectrometry analysis. Ferric ion addition caused the fluorescence enhancement at 438 nm, suggesting the applicability of the receptor for Fe3+ detection, as well a sensitivity of (3.19 ± 0.02) × 10−6 M. The receptor was further employed for live cell imaging, wherein the appearance of a bright blue fluorescence from the cells on metallic ion incubation indicated the potential practical utility of the probe for intracellular metal detection.
Bag et al.130 reported triazolylpyrene receptor 59 (Fig. 51) for selective copper detection. The receptor exhibited a dual emission behavior due to the emergence of emission signals at 383 and 466–544 nm when it was excited at 343 nm. Copper addition caused a 1800-fold enhancement of the monomer emission signal intensity. An increasing copper ion concentration caused a continuous increment in the monomer emission with the concomitant appearance of an excimer emission at around 466 nm. Furthermore, the intensity of both signals kept on increasing up to 2.5 equivalents copper addition, beyond which the quenching in the fluorescence emission signal was observed. The 2![[thin space (1/6-em)]](https://www.rsc.org/images/entities/char_2009.gif) :
:![[thin space (1/6-em)]](https://www.rsc.org/images/entities/char_2009.gif) 1 ligand–copper binding stoichiometry was calculated by the method of continuous variation, and the association constant value was calculated by the Benesi–Hildebrand equation to be 2.23 × 10⁵ M−1. The detection limit of the probe toward copper ions was calculated to be 1.77 × 10⁻⁸ mol L−1. The 2
1 ligand–copper binding stoichiometry was calculated by the method of continuous variation, and the association constant value was calculated by the Benesi–Hildebrand equation to be 2.23 × 10⁵ M−1. The detection limit of the probe toward copper ions was calculated to be 1.77 × 10⁻⁸ mol L−1. The 2![[thin space (1/6-em)]](https://www.rsc.org/images/entities/char_2009.gif) :
:![[thin space (1/6-em)]](https://www.rsc.org/images/entities/char_2009.gif) 1 binding mode was further confirmed by the mass spectrometry analysis.
1 binding mode was further confirmed by the mass spectrometry analysis.
Wu et al.131 reported pyrene-based fluorescence copper sensor 60 (Fig. 52). The receptor solution was yellow and exhibited an absorption signal at 421 nm. Copper addition caused a decrease in the intensity of the absorption signal at 420 nm with the concomitant appearance of a new absorption band at 355 along with a colorimetric change in the reaction solution from yellow to colorless. Similarly, copper addition caused the emergence of a new emission signal at 417 nm when it was excited at 350 nm, and the intensity of this signal continued to increase on increasing the copper ion concentration. The 1![[thin space (1/6-em)]](https://www.rsc.org/images/entities/char_2009.gif) :
:![[thin space (1/6-em)]](https://www.rsc.org/images/entities/char_2009.gif) 1 ligand–copper binding stoichiometry was calculated by the method of continuous variation utilizing a fluorescence titration graph, and the association constant was calculated to be 5.55 × 10³ M−1. Further mechanistic insight was obtained through the FT-IR, NMR and mass spectrometry analysis, and the results were consistent with the Job's analysis. The competitive experiment indicated the selective tendency of the receptor toward copper ions in comparison to the competitive ions.
1 ligand–copper binding stoichiometry was calculated by the method of continuous variation utilizing a fluorescence titration graph, and the association constant was calculated to be 5.55 × 10³ M−1. Further mechanistic insight was obtained through the FT-IR, NMR and mass spectrometry analysis, and the results were consistent with the Job's analysis. The competitive experiment indicated the selective tendency of the receptor toward copper ions in comparison to the competitive ions.
Kim et al.132 reported N-(pyrenylmethyl)naphtho-azacrown-5 61 (Fig. 53) for copper detection. The probe possessed combined pyrene and naphthalene units and the spectrum of both units overlapped to achieve a favorable condition for the FRET-ON. The probe exhibited a pyrene emission band upon excitation at 240 nm, whereas copper addition caused the complete quenching of the pyrene emission with the concomitant appearance of a naphthalene emission signal at 330 nm; whereas the addition of other metal ions did not exert such changes in the fluorescence emission signal of the receptor. The 1![[thin space (1/6-em)]](https://www.rsc.org/images/entities/char_2009.gif) :
:![[thin space (1/6-em)]](https://www.rsc.org/images/entities/char_2009.gif) 1 binding stoichiometry was calculated by the method of continuous variation, and the association constant of the receptor toward copper ions was found to be 1.04 × 10⁴ M−1. Further mechanistic insight was obtained through the FT-IR measurement, DFT calculation and mass spectrometry analysis.
1 binding stoichiometry was calculated by the method of continuous variation, and the association constant of the receptor toward copper ions was found to be 1.04 × 10⁴ M−1. Further mechanistic insight was obtained through the FT-IR measurement, DFT calculation and mass spectrometry analysis.
Lin et al.133 reported pyrene-based receptor 62 (Fig. 54) for selective copper recognition. The probe solution was yellow and exhibited an absorption signal in the range of 235–350 nm. The addition of Hg2+ caused a decrease in the absorption signals at 278 and 334 nm with the concomitant appearance of new peaks at 284 and 361 nm. The UV-visible titration of receptor 62 with an increasing concentration of mercury ions triggered clear isosbestic points at 281 and 336 nm along with a colorimetric change in the reaction solution from yellow to brown. Moreover, copper addition caused a gradual increase in the absorption signals at 278 and 334 with the additional emergence of a shoulder peak at 388 nm, whereas the peak at 348 nm gradually decreased. The titration of the ligand with the copper ions displays clear isosbestic points at 344 and 354 nm along with a color variation in the reaction solution from pale yellow to green-yellow. The 1![[thin space (1/6-em)]](https://www.rsc.org/images/entities/char_2009.gif) :
:![[thin space (1/6-em)]](https://www.rsc.org/images/entities/char_2009.gif) 1 ligand–metal binding stoichiometry was calculated by the method of continuous variation, which was further assisted by the NMR titration analysis. Similarly, mercury addition caused the appearance of two new emission signals at 401 and 424 nm with a colorimetric change from weak blue to orchid. The increasing concentration of copper ions triggered emission signals at 396 and 439 nm and a color change from weak blue to strong blue. The competing ionic species did not exert such an effect on addition to the probe solution.
1 ligand–metal binding stoichiometry was calculated by the method of continuous variation, which was further assisted by the NMR titration analysis. Similarly, mercury addition caused the appearance of two new emission signals at 401 and 424 nm with a colorimetric change from weak blue to orchid. The increasing concentration of copper ions triggered emission signals at 396 and 439 nm and a color change from weak blue to strong blue. The competing ionic species did not exert such an effect on addition to the probe solution.
 | ||
| Fig. 54 Chemical (a) and energy-minimized structure (b) of receptor 62 along with the copper complex (c). | ||
2.12. BODIPY-based Cu2+ sensors
Qi et al.134 reported new 4,4-difluoro-4-bora-3a,4a-diaza-s-indacene (BODIPY) derivatives (63 and 64, Fig. 55) as “off–on” fluorescent chemosensors and fluorescent chemodosimeters for Cu2+ and Pb2+. Compound 63 displayed a negligible fluorescence emission signal when it was excited at 504 nm. However, 5 equivalents copper addition into a solution of receptor 63 triggered the maximum fluorescence intensity, whereas further increases in the copper concentration beyond 5 equivalents caused a sudden decrease in the fluorescence emission signal along with a 9 nm red-shift in the spectrum. A similar red-shift and absorbance decrease can be found in the UV-visible absorption spectra of receptor 63. The recognition mechanism of receptor 63 was assessed by fluorescence emission spectroscopy, UV-visible absorption spectroscopy and an NMR spectroscopy titration experiment as well as by mass spectrometry analysis, and the results suggest an irreversible copper detection by compound 63 via a selective hydrolysis of the acetyl group. Compound 64 exhibited the maximum increase in the fluorescence emission signal intensity upon the addition of Pb2+, whereas a low intensity emission signal was observed in the cases of copper and zinc addition, suggesting the complexation tendency of receptor 64 toward Pb2+, Cu2+ and Zn2+. From the fluorescence titration experiments, the association constants of receptor 64 toward Pb2+, Zn2+ and Cu2+ were calculated to be 8800, 510, and 55![[thin space (1/6-em)]](https://www.rsc.org/images/entities/char_2009.gif) 000 M−1, respectively, revealing the higher tendency of receptor 64 toward copper ions compared Pb2+ and Zn2+ due to higher association constant value. The 1
000 M−1, respectively, revealing the higher tendency of receptor 64 toward copper ions compared Pb2+ and Zn2+ due to higher association constant value. The 1![[thin space (1/6-em)]](https://www.rsc.org/images/entities/char_2009.gif) :
:![[thin space (1/6-em)]](https://www.rsc.org/images/entities/char_2009.gif) 1 binding stoichiometry for the ligand–metal complex was calculated by the method of continuous variation drawing on the Job's curve; the proposed sensing mechanisms are shown in Fig. 55.
1 binding stoichiometry for the ligand–metal complex was calculated by the method of continuous variation drawing on the Job's curve; the proposed sensing mechanisms are shown in Fig. 55.
Chou et al.135 reported a boron-dipyrromethene (BODIPY)-based fluorescent chemosensor 65 (Fig. 56) for selective copper detection. The probe 65 solution exhibited very weak fluorescence with a relative fluorescence quantum yield of 0.006. Copper addition into the probe solution caused the emergence of a new emission band at 516 nm with a significant increase in the fluorescence quantum yield of up to 18-fold upon the new values of 0.11. This behavior of ligand 65 was selective only upon copper addition compared to with other competing species. The mechanistic insight was obtained by plotting the emission intensity at 516 nm against the mole fraction of probe 65, and the maximum emission intensity was observed with the 0.5 mole fraction, suggesting the 1![[thin space (1/6-em)]](https://www.rsc.org/images/entities/char_2009.gif) :
:![[thin space (1/6-em)]](https://www.rsc.org/images/entities/char_2009.gif) 1 binding stoichiometry of the probe–copper complex, which was further assisted by the NMR titration experiment. The probe–copper binding constant was calculated to be 7.28 × 10³ M−1, and this high value of binding constant permits strong binding of the receptor toward copper ion. For the practical applicability of the probe toward copper detection inside biological media, an MTT assay was carried out to assess the ligand toxicity toward live cells. The appearance of bright green fluorescence without any deformation of the cells in the bioimaging experiment suggests the potential applicability of the probe to trace copper levels inside living cells. In the preliminary experiment, RAW264.7 cells were utilized for the confocal fluorescence microscopy investigations.
1 binding stoichiometry of the probe–copper complex, which was further assisted by the NMR titration experiment. The probe–copper binding constant was calculated to be 7.28 × 10³ M−1, and this high value of binding constant permits strong binding of the receptor toward copper ion. For the practical applicability of the probe toward copper detection inside biological media, an MTT assay was carried out to assess the ligand toxicity toward live cells. The appearance of bright green fluorescence without any deformation of the cells in the bioimaging experiment suggests the potential applicability of the probe to trace copper levels inside living cells. In the preliminary experiment, RAW264.7 cells were utilized for the confocal fluorescence microscopy investigations.
Wang et al.136 reported a molecular probe 66 (Fig. 57) for selective copper detection. Receptor 66 exhibited a UV-visible absorption band at 525 nm and fluorescence emission band at 539 nm when it was excited at 500 nm. The UV-visible titration of the receptor with copper ions caused a significant decrease in the main absorption band at 525 nm with the concomitant appearance of a new absorption signal at 554 nm along with the emergence of a clear isosbestic point at 533 nm. Copper addition caused a colorimetric change in the reaction solution from light yellow to purple, which could be assessable by the naked eye. The 1![[thin space (1/6-em)]](https://www.rsc.org/images/entities/char_2009.gif) :
:![[thin space (1/6-em)]](https://www.rsc.org/images/entities/char_2009.gif) 1 ligand–copper binding stoichiometry was calculated from the Job's curve, which was consistent with the mass spectrometry analysis, and the stability constant was calculated by a nonlinear curve-fitting analysis as 2.1 × 10⁶ M−1 (R2 = 0.9984). The ligand was found to detect copper ions in the range of 0–4 μM, as calculated utilizing the titration graph. Similarly, copper addition caused a significant quenching in the fluorescence emission signal intensity, and a linear decline in the emission intensity on increasing the copper ion concentration.
1 ligand–copper binding stoichiometry was calculated from the Job's curve, which was consistent with the mass spectrometry analysis, and the stability constant was calculated by a nonlinear curve-fitting analysis as 2.1 × 10⁶ M−1 (R2 = 0.9984). The ligand was found to detect copper ions in the range of 0–4 μM, as calculated utilizing the titration graph. Similarly, copper addition caused a significant quenching in the fluorescence emission signal intensity, and a linear decline in the emission intensity on increasing the copper ion concentration.
 | ||
| Fig. 57 Chemical structure of receptor 66 (a) and energy-minimized conformation of the receptor and its copper complex (b). | ||
2.13. Coumarin-based Cu2+ sensors
Jung et al.137 reported a novel coumarin-based fluorogenic probe bearing 2-picolyl unit 67 (Fig. 58) as a fluorescent chemosensor for copper sensing with high selectivity and a suitable affinity for biological systems over other tested cations. Copper addition into the receptor 67 solution produced a 15 nm bathochromic shift in the absorption signal along with a colorimetric change in the reaction solution from yellow to dark yellow. Similarly, copper addition drastically quenched the fluorescence emission signal of receptor 67 when it was excited at 430 nm. Ratiometric fluorescence quenching was observed in the receptor 67 solution on successive copper additions, whereas there was no such response for other competitive ions. These characteristic changes in the absorption and fluorescence emission spectra along with colorimetric change in the reaction solution suggest the selective tendency of receptor 67 toward copper ions. Receptor 67 was shown to be applicable for operation in a wide pH range of 4–10 and can form complexes with the copper ions following a 1![[thin space (1/6-em)]](https://www.rsc.org/images/entities/char_2009.gif) :
:![[thin space (1/6-em)]](https://www.rsc.org/images/entities/char_2009.gif) 1 binding stoichiometry. A detailed mechanistic insight was obtained through femtosecond spectroscopy, single crystal X-ray diffraction analysis, and DFT calculations. Furthermore, the sensor was applied for intracellular copper detection in a confocal fluorescence microscopy experiment employing LLC-MK2 cells. The toxicity of the sensor was assessed by the MTT assay, which suggested the appreciable cell viability of 67 toward live cells, wherein the appearance of a bright fluorescence from the live cells indicated the precise cell permeability of the reported sensor.
1 binding stoichiometry. A detailed mechanistic insight was obtained through femtosecond spectroscopy, single crystal X-ray diffraction analysis, and DFT calculations. Furthermore, the sensor was applied for intracellular copper detection in a confocal fluorescence microscopy experiment employing LLC-MK2 cells. The toxicity of the sensor was assessed by the MTT assay, which suggested the appreciable cell viability of 67 toward live cells, wherein the appearance of a bright fluorescence from the live cells indicated the precise cell permeability of the reported sensor.
Yeh et al.138 reported a new coumarin-derived fluorescent probe 68 (Fig. 59) for selective copper detection. Sensor 68 exhibited an absorption signal with the maximum absorption intensity at 487 nm, whereas copper addition caused a significant decrease in the absorption signal at 487 nm and the emergence of a new band at 440 nm along with the turning of the reaction solution from yellow to red. Similarly, probe 68 exhibited a fluorescence emission signal at 537 nm, which was drastically quenched on copper addition. This quenching phenomenon was found to be selective only in the presence of copper ions and there was no such fluorescence quenching in the presence of a number of competing species. These characteristic changes in the UV-visible absorption as well as in the fluorescence emission signals along with the colorimetric change in the reaction solution enable the selective tendency of probe 68 toward copper ions. The 2![[thin space (1/6-em)]](https://www.rsc.org/images/entities/char_2009.gif) :
:![[thin space (1/6-em)]](https://www.rsc.org/images/entities/char_2009.gif) 1 ligand–metal binding stoichiometry was determined by the continuous variation method by plotting the emission intensity at 537 nm against the mole fraction of sensor 68 while keeping constant the total concentration. The Benesi–Hildebrand equation was employed to obtain the association constant of 9.56 × 10⁹ M−2. This large binding constant of the receptor toward copper binding suggests the strong affinity of the ligand for copper. The 2
1 ligand–metal binding stoichiometry was determined by the continuous variation method by plotting the emission intensity at 537 nm against the mole fraction of sensor 68 while keeping constant the total concentration. The Benesi–Hildebrand equation was employed to obtain the association constant of 9.56 × 10⁹ M−2. This large binding constant of the receptor toward copper binding suggests the strong affinity of the ligand for copper. The 2![[thin space (1/6-em)]](https://www.rsc.org/images/entities/char_2009.gif) :
:![[thin space (1/6-em)]](https://www.rsc.org/images/entities/char_2009.gif) 1 ligand–metal binding stoichiometry was further confirmed by the mass spectrometry analysis as well as by the NMR titration experiment. A 0.27 μM limit of detection was found for chemosensor 68, which is considerably low for environmental and biomedical analyses. Chemosensor 68 behaved reversibly on the addition of cyanide ions, which caused an increase in the emission signal at 537 nm. Copper addition reverts back the spectrum to the quenched state. This “Off–On–Off” behavior of the ligand–metal complex solution on the introduction of cyanide and copper ions reveals the reversible nature of the reported sensor. Furthermore, the ligand was employed in the bioimaging experiment utilizing HeLa cells through a confocal fluorescence microscopy experiment. The appearance of green fluorescence from the live cells incubated with the ligand and the significant disappearance of the green signal from the cells indicated the successful operational tendency of receptor 68 inside biological media.
1 ligand–metal binding stoichiometry was further confirmed by the mass spectrometry analysis as well as by the NMR titration experiment. A 0.27 μM limit of detection was found for chemosensor 68, which is considerably low for environmental and biomedical analyses. Chemosensor 68 behaved reversibly on the addition of cyanide ions, which caused an increase in the emission signal at 537 nm. Copper addition reverts back the spectrum to the quenched state. This “Off–On–Off” behavior of the ligand–metal complex solution on the introduction of cyanide and copper ions reveals the reversible nature of the reported sensor. Furthermore, the ligand was employed in the bioimaging experiment utilizing HeLa cells through a confocal fluorescence microscopy experiment. The appearance of green fluorescence from the live cells incubated with the ligand and the significant disappearance of the green signal from the cells indicated the successful operational tendency of receptor 68 inside biological media.
Huang et al.139 reported a new fluorescent sensor 69 (Fig. 60) based on coumarin for selective copper detection. Ligand 69 exhibited a strong absorption band at 451 nm in the absence of any metallic addition, whereas copper addition caused a gradual decrease in the absorption signal at 451 nm with the emergence of a new absorption band at 490. Continuous increase in the absorption intensity upon successive copper additions was observed. Similarly, the receptor exhibited a fluorescence emission signal at 523 nm, which was drastically quenched upon copper addition. The linear decrease in the fluorescence emission intensity at 523 nm was utilized to determine the association constant value, which was 6.4 × 10⁵ M−1; the 1![[thin space (1/6-em)]](https://www.rsc.org/images/entities/char_2009.gif) :
:![[thin space (1/6-em)]](https://www.rsc.org/images/entities/char_2009.gif) 1 ligand–metal binding stoichiometry was calculated by the continuous variation method. The ligand was further applied in the bioimaging experiment to test the intracellular copper detection ability of the ligand utilizing Hep G2 cells under a confocal fluorescence microscope. The appearance of green fluorescence from the probe-incubated cells indicated the promising cell permeability of ligand 69 toward living cells.
1 ligand–metal binding stoichiometry was calculated by the continuous variation method. The ligand was further applied in the bioimaging experiment to test the intracellular copper detection ability of the ligand utilizing Hep G2 cells under a confocal fluorescence microscope. The appearance of green fluorescence from the probe-incubated cells indicated the promising cell permeability of ligand 69 toward living cells.
Ko et al.140 described a coumarin-based fluorescent sensor iminocoumarin 70 (Fig. 61) for selective copper detection. Probe 70 exhibited an absorption signal at 450 nm, which was significantly decreased on copper addition along with the emergence of some irregular bands at longer wavelengths. Similarly, the ligand showed a very weak emission signal at 515 nm, which drastically increased upon successive copper additions. These characteristic changes in the UV-visible and fluorescence emission of the ligand were found to be selective in comparison to the competitive ions, suggesting the specific affinity of receptor 70 toward copper ions. The 1![[thin space (1/6-em)]](https://www.rsc.org/images/entities/char_2009.gif) :
:![[thin space (1/6-em)]](https://www.rsc.org/images/entities/char_2009.gif) 1 ligand–metal stoichiometry was found from a Job's plot, which was further assisted by the mass spectrometry analysis, and the association constant was calculated to be 3.34 × 10⁴ M−1 by the Benesi–Hildebrand equation. The optimal pH range for sensing the ligand toward copper was estimated to be pH 5–8, which is compatible with the efficient sensor for biomedical analysis. The appearance of green fluorescence from the live cells without any deformation suggests the cell permeability and appreciable viability of the reported receptor toward live cells as assessed by utilizing LLC-MK2 cells under a confocal fluorescence microscope. The ligand was further employed to determine copper accumulation inside the specific organs after 3 days feeding of copper solution to a test mouse. The appearance of the efficient bright fluorescence from the liver and kidney of the copper-fed mouse revealed the copper accumulation in these two organs, whereas there was no such luminescence from the rest of organs, including lung, heart, muscle and spleen.
1 ligand–metal stoichiometry was found from a Job's plot, which was further assisted by the mass spectrometry analysis, and the association constant was calculated to be 3.34 × 10⁴ M−1 by the Benesi–Hildebrand equation. The optimal pH range for sensing the ligand toward copper was estimated to be pH 5–8, which is compatible with the efficient sensor for biomedical analysis. The appearance of green fluorescence from the live cells without any deformation suggests the cell permeability and appreciable viability of the reported receptor toward live cells as assessed by utilizing LLC-MK2 cells under a confocal fluorescence microscope. The ligand was further employed to determine copper accumulation inside the specific organs after 3 days feeding of copper solution to a test mouse. The appearance of the efficient bright fluorescence from the liver and kidney of the copper-fed mouse revealed the copper accumulation in these two organs, whereas there was no such luminescence from the rest of organs, including lung, heart, muscle and spleen.
Ciesienski et al.141 reported the copper–caging ligand 71 (Fig. 62) based on a coumarin fluorescence reporter, which behaved selectively toward copper ions. Ligand 71 exhibited a fluorescence emission signal with the maximum emission intensity at 479 nm when it was excited at 430 nm. The ligand fluorescence signal was significantly quenched upon copper addition, whereas the UV-visible absorption signal intensity at 432 nm continued to increase with the successive additions of copper ions into the ligand solution. The 1![[thin space (1/6-em)]](https://www.rsc.org/images/entities/char_2009.gif) :
:![[thin space (1/6-em)]](https://www.rsc.org/images/entities/char_2009.gif) 1 coucage–Cu2+ complex stoichiometry was confirmed by the continuous variation method, and the dissociation constant was calculated by the Benesi–Hildebrand equation as 7.3 ± 0.9 μM. In contrast, there was no fluorescence change in the coucage system in the presence of other competing species, suggesting the selective tendency of the reported ligand toward copper ions. Moreover, the ligand underwent photolysis on exposure to ultraviolet radiation. Furthermore, ligand 71 exhibited its practical applicability to trace copper ions inside biological media, as assessed through a bioimaging experiment utilizing MCF-7 cells. The appearance of bright green fluorescence from the live cells incubated with the ligand and copper ions without any deformation in the cells suggests the precise cell permeability of the required ligand with a maximum viability toward live cells. The decrease in the intracellular emission intensity from the probe-incubated cells upon copper addition indicated the successful operational capability of the ligand in intracellular media.
1 coucage–Cu2+ complex stoichiometry was confirmed by the continuous variation method, and the dissociation constant was calculated by the Benesi–Hildebrand equation as 7.3 ± 0.9 μM. In contrast, there was no fluorescence change in the coucage system in the presence of other competing species, suggesting the selective tendency of the reported ligand toward copper ions. Moreover, the ligand underwent photolysis on exposure to ultraviolet radiation. Furthermore, ligand 71 exhibited its practical applicability to trace copper ions inside biological media, as assessed through a bioimaging experiment utilizing MCF-7 cells. The appearance of bright green fluorescence from the live cells incubated with the ligand and copper ions without any deformation in the cells suggests the precise cell permeability of the required ligand with a maximum viability toward live cells. The decrease in the intracellular emission intensity from the probe-incubated cells upon copper addition indicated the successful operational capability of the ligand in intracellular media.
He et al.142 reported the coumarin-based fluorophore 72 (Fig. 63) for the selective detection of copper ions in an aqueous solution. The ligand exhibited an absorption signal with the maximum absorption intensity at 468 nm. This absorption signal can be attributed to the coumarin chromophore. Similarly, the probe exhibited a fluorescence emission signal at 534 nm when it was excited at 468 nm in an aqueous solution. Copper addition caused a 70-fold enhancement in the fluorescence emission signal at 534 nm; however, it caused no change in the UV-visible absorption spectra. This response of the probe was selective upon copper addition, exhibiting high values of association constant, i.e., 3.67 × 10⁶ M−1; the 1![[thin space (1/6-em)]](https://www.rsc.org/images/entities/char_2009.gif) :
:![[thin space (1/6-em)]](https://www.rsc.org/images/entities/char_2009.gif) 1 ligand–copper binding stoichiometry was calculated from the Job's curve using the titration graph. The 1
1 ligand–copper binding stoichiometry was calculated from the Job's curve using the titration graph. The 1![[thin space (1/6-em)]](https://www.rsc.org/images/entities/char_2009.gif) :
:![[thin space (1/6-em)]](https://www.rsc.org/images/entities/char_2009.gif) 1 complex stoichiometry was further assisted by the mass spectrometry analysis. The appearance of green fluorescence from the live cells under a confocal fluorescence microscope on incubation of the probe-mixed cells with copper ions revealed the practical applicability of sensor 72 for intracellular copper detection.
1 complex stoichiometry was further assisted by the mass spectrometry analysis. The appearance of green fluorescence from the live cells under a confocal fluorescence microscope on incubation of the probe-mixed cells with copper ions revealed the practical applicability of sensor 72 for intracellular copper detection.
Kim et al.143 reported a new coumarin derivative 73 (Fig. 64) for selective copper detection. Copper addition into the probe 73 solution triggered the fluorescence emission signal at 502 nm with the intensity of the signal being proportional to the copper concentration when the excitation wavelength was fixed at 450 nm. From the titration experiment, the detection limit of the sensor toward the copper ions was found to be 8.7 × 10⁻⁸ M, which is quite low, indicating the applicability of the reported material as a fluorescent chemodosimeter for trace copper detection. The “turn-on” response of the sensor toward copper ions with the considerable high sensitivity and precise selectivity over the number of ionic species revealed 73 to be an efficient chemodosimeter for copper sensing in environmental and biological samples.
García-Beltrán et al.144 reported a new probe (E)-7-(diethylamino)-2-oxo-2H-chromene-3-carbaldehyde oxime 74 (Fig. 65) for selective copper recognition. The probe alone exhibited an absorption band at 430 nm and a fluorescence emission band at 510 nm when the excitation slit was fixed at 460 nm. Copper addition caused significant quenching in the fluorescence emission signal at 510 nm. The fluorescence titration of the receptor with the copper ions caused a linear decrease in the emission signal intensity. The Job's plot reflected the 2![[thin space (1/6-em)]](https://www.rsc.org/images/entities/char_2009.gif) :
:![[thin space (1/6-em)]](https://www.rsc.org/images/entities/char_2009.gif) 1 ligand–copper binding stoichiometry, which was further confirmed by mass spectrometry analysis. The appearance of green fluorescence from the cells incubated with the probe without any deformation indicate the potential applicability and membrane permeability of the reported sensor toward intracellular copper monitoring, as assessed via the bioimaging experiment utilizing SH-SY5Y cells under a confocal fluorescence microscope.
1 ligand–copper binding stoichiometry, which was further confirmed by mass spectrometry analysis. The appearance of green fluorescence from the cells incubated with the probe without any deformation indicate the potential applicability and membrane permeability of the reported sensor toward intracellular copper monitoring, as assessed via the bioimaging experiment utilizing SH-SY5Y cells under a confocal fluorescence microscope.
Yu et al.145 reported a coumarin-based reactive probe 75 (Fig. 66) for selective copper recognition. The probe exhibited a fluorescence emission signal at 410 nm when it was excited at 360 nm. Copper addition caused a 62 nm bathochromic shift in the emission signal from 410 to 472 nm along with a colorimetric change in the reaction solution from violet to blue-green under UV lamp by illuminating at a higher wavelength of 365 nm. There was no such response for the various competitive metallic ions. The titration of the probe with an increasing concentration of copper ions caused a gradual decrease in the emission signal at 410 nm with the concomitant appearance of new emission band at 472 nm, whose intensity increased linearly depending on the copper ion concentration. The probe operating mechanism on copper addition was studied in detail by mass spectrometry analysis and the proposed copper complexation mechanisms are shown in the Fig. 66.
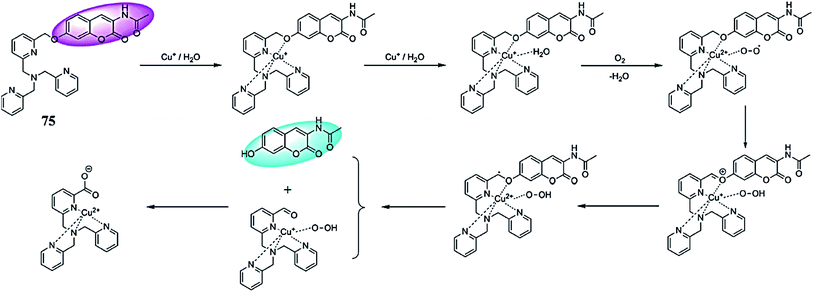 | ||
| Fig. 66 Chemical structure of receptor 75 and the copper-induced conformational changes in the ligand structure. | ||
Helal et al.146 reported the thiazole-coumarin-based receptor 76 (Fig. 67) for copper detection. Receptor 76 exhibited a UV-visible absorption signal at 412 nm in the absence of metallic species. Copper addition caused a synchronous decrease in the absorption signal intensity at 412 nm with the concomitant appearance of a new absorption band at 460 nm. The UV-visible titration of the receptor with copper ions induced a clear isosbestic point at 435 nm, indicating the equilibrium between the receptor and the newly formed copper complex. Moreover, the ligand behaved as a chromogenic sensor for copper detection as assessed by the induction of a colorimetric change in the reaction solution from light-green to yellow on the introduction of copper ions into the probe solution. The 1![[thin space (1/6-em)]](https://www.rsc.org/images/entities/char_2009.gif) :
:![[thin space (1/6-em)]](https://www.rsc.org/images/entities/char_2009.gif) 1 ligand–copper binding stoichiometry was estimated by the continuous variation method using a UV-visible titration graph. Similarly, the increasing concentration of copper ions caused a drastic quenching in the fluorescence emission signal at 495 nm when it was excited at 435 nm. The 1
1 ligand–copper binding stoichiometry was estimated by the continuous variation method using a UV-visible titration graph. Similarly, the increasing concentration of copper ions caused a drastic quenching in the fluorescence emission signal at 495 nm when it was excited at 435 nm. The 1![[thin space (1/6-em)]](https://www.rsc.org/images/entities/char_2009.gif) :
:![[thin space (1/6-em)]](https://www.rsc.org/images/entities/char_2009.gif) 1 binding stoichiometry was further confirmed by the fluorescence titration graph with the binding constant value of 2.2 × 10⁶ M−1. Further mechanistic insight was obtained through EPR and mass spectrometry analysis. Moreover, the ligand behaved reversibly on the addition of an EDTA solution, suggesting the chemosensing ability of the probe for copper detection.
1 binding stoichiometry was further confirmed by the fluorescence titration graph with the binding constant value of 2.2 × 10⁶ M−1. Further mechanistic insight was obtained through EPR and mass spectrometry analysis. Moreover, the ligand behaved reversibly on the addition of an EDTA solution, suggesting the chemosensing ability of the probe for copper detection.
Chen et al.147 reported a novel coumarin-based fluorescent probe 77 (Fig. 68) for selective copper detection. Copper addition caused the emergence of a new absorption band at 416 nm with a concurrent increase in the absorption intensity of the signal at 338 nm and a successive decrease in the intensity of the absorption signal at 243–341 nm and 379 nm. The UV-visible titration graph yielded four clear isosbestic points at 243, 321, 357 and 389 nm, respectively, suggesting complexation between the receptor and copper ions. The 1![[thin space (1/6-em)]](https://www.rsc.org/images/entities/char_2009.gif) :
:![[thin space (1/6-em)]](https://www.rsc.org/images/entities/char_2009.gif) 1 binding stoichiometry was calculated from the Job's curve utilizing the absorption signal at 416 nm, and the detection limit of the receptor toward copper ions was estimated to be 0.2 μM. Similarly, copper addition caused a drastic quenching in the fluorescence emission signal intensity at 520 nm when it was excited at 342 nm. The linear decrease in the fluorescence emission signal intensity at 520 nm on the increasing copper concentration suggested the 1
1 binding stoichiometry was calculated from the Job's curve utilizing the absorption signal at 416 nm, and the detection limit of the receptor toward copper ions was estimated to be 0.2 μM. Similarly, copper addition caused a drastic quenching in the fluorescence emission signal intensity at 520 nm when it was excited at 342 nm. The linear decrease in the fluorescence emission signal intensity at 520 nm on the increasing copper concentration suggested the 1![[thin space (1/6-em)]](https://www.rsc.org/images/entities/char_2009.gif) :
:![[thin space (1/6-em)]](https://www.rsc.org/images/entities/char_2009.gif) 1 ligand–copper binding stoichiometry with an association constant value of 6.57 × 10³ M−1. The ligand was further applied in the bioimaging experiment in order to determine its practical applicability for intracellular copper detection by utilizing Hep G2 cells under a confocal fluorescence microscope. The appearance of bright fluorescence from the live cells on incubation with the receptor revealed the efficient cell viability and membrane permeability of the sensor toward live cells.
1 ligand–copper binding stoichiometry with an association constant value of 6.57 × 10³ M−1. The ligand was further applied in the bioimaging experiment in order to determine its practical applicability for intracellular copper detection by utilizing Hep G2 cells under a confocal fluorescence microscope. The appearance of bright fluorescence from the live cells on incubation with the receptor revealed the efficient cell viability and membrane permeability of the sensor toward live cells.
 | ||
| Fig. 68 ORTEP diagram of receptor 77 and the energy-minimized structure of the receptor–copper complex. | ||
2.14. Styrylcyanine-based Cu2+ sensor
Yang et al.148 reported a highly sensitive fluorescent probe 78 (Fig. 69) based on styrylcyanine dye for the detection of Cu2+ and Pb2+. The free probe 78 exhibited a fluorescence emission signal with the maximum emission intensity at 475 nm, which was significantly quenched upon copper addition. The fluorescence emission intensity of the probe was reduced on copper addition in a fine linear relationship, and this ratiometric fluorescence quenching of the probe by the copper ions was utilized to find the Stern–Volmer quenching constant, which was kSV = 8.05 × 10⁶ M−1; this high value of quenching constant permits a strong affinity of the sensor toward copper ions with an appreciable sensitivity of 1.24 μM. The mechanistic insight was further evaluated by the NMR titration experiment. Furthermore, probe 78 behaved as a dual sensor as assessed by the decrease in the probe emission signal intensity at 475 nm along with appearance of new red-shifted emission band at 595 with the isoemissive point at 550 nm upon Pb2+ addition. A fluorescence titration experiment was carried out to obtain the binding constant values of the probe toward Pb2+, which was found to be 5.82 × 10⁴ M−1. The probe sensitivity toward Pb2+ was found to be 3.41 μM. The ligand coordination with Pb2+ was further confirmed by the NMR titration experiment. The probe behaved specifically toward the copper and lead ions as assessed by the competitive ion experiment, wherein the other ionic species did not obviously display any characteristic change in the probe solution. These characteristic changes in the probe solution upon Cu2+ and Pb2+ addition along with the colorimetric change in the reaction solution can be used as efficient tools to detect the micro-molar metallic ions in environmental and biological samples.2.15. Schiff base Cu2+ sensors
Udhayakumari et al.149 reported thiophene-based diimine 79 and monoimine 80 (Fig. 70) as colorimetric and fluorescence recognition scaffolds for the transition metal ions. The receptor 79 exhibited a colorimetric turn-on response toward Pb2+ and Hg2+, and a colorimetric turn-off response toward Sn2+. Similarly, receptor 80 can be utilized for the naked eye detection of Cu2+ and Hg2+, compared to a number of competing species. Receptor 79 exhibited fluorescence emission signals at 510 and 545 nm when it was excited at 460 nm, whereas the introduction of Pb2+, Hg2+, and Sn2+ into the reaction solution caused fluorescence quenching. The 1![[thin space (1/6-em)]](https://www.rsc.org/images/entities/char_2009.gif) :
:![[thin space (1/6-em)]](https://www.rsc.org/images/entities/char_2009.gif) 1 ligand–metal binding stoichiometry for ligand 79 was found by the method of continuous variation by the utilization of the titration curves. Furthermore, the binding constants for Pb2+, Hg2+, and Sn2+ were calculated to be 1.11 × 10⁴, 5.01 × 10³ and 3.61 × 10⁴, respectively, by the Benesi–Hildebrand equation. Receptor 80 showed a fluorescence emission signal at 440 nm when it was excited at 360 nm. Copper addition into the receptor 80 solution caused significant increase in the fluorescence emission signal intensity with a red-shift in the signal from 440 to 500 nm. The linear increase in the fluorescence emission signal was observed with ratiometric increase of the copper ion concentration. Moreover, mercury addition caused an increase in the emission signal intensity at 430 nm. A 10 nm bathochromic shift and increased emission signal intensity on Hg2+ addition might be due to the inhibition of the photoinduced electron transfer mechanism. The 2
1 ligand–metal binding stoichiometry for ligand 79 was found by the method of continuous variation by the utilization of the titration curves. Furthermore, the binding constants for Pb2+, Hg2+, and Sn2+ were calculated to be 1.11 × 10⁴, 5.01 × 10³ and 3.61 × 10⁴, respectively, by the Benesi–Hildebrand equation. Receptor 80 showed a fluorescence emission signal at 440 nm when it was excited at 360 nm. Copper addition into the receptor 80 solution caused significant increase in the fluorescence emission signal intensity with a red-shift in the signal from 440 to 500 nm. The linear increase in the fluorescence emission signal was observed with ratiometric increase of the copper ion concentration. Moreover, mercury addition caused an increase in the emission signal intensity at 430 nm. A 10 nm bathochromic shift and increased emission signal intensity on Hg2+ addition might be due to the inhibition of the photoinduced electron transfer mechanism. The 2![[thin space (1/6-em)]](https://www.rsc.org/images/entities/char_2009.gif) :
:![[thin space (1/6-em)]](https://www.rsc.org/images/entities/char_2009.gif) 1 ligand–metal binding stoichiometry was calculated for receptor 80 from the Job's curve by utilizing the titration graph, and the binding constants of receptor 80 toward copper and mercury were calculated to be 3.67 × 10⁴ and 3.54 × 10³, respectively by the Benesi–Hildebrand equation. To assess the practical applicability of the receptor, a bioimaging experiment was conducted utilizing E. coli MTCC40 and Staphylococcus aureus MTCC96 cell lines through a confocal fluorescence microscope. The appearance of a bright blue signal from the live cells without any deformation in the cells suggests the promising cell permeability and momentous viability of the reported receptor toward live cells.
1 ligand–metal binding stoichiometry was calculated for receptor 80 from the Job's curve by utilizing the titration graph, and the binding constants of receptor 80 toward copper and mercury were calculated to be 3.67 × 10⁴ and 3.54 × 10³, respectively by the Benesi–Hildebrand equation. To assess the practical applicability of the receptor, a bioimaging experiment was conducted utilizing E. coli MTCC40 and Staphylococcus aureus MTCC96 cell lines through a confocal fluorescence microscope. The appearance of a bright blue signal from the live cells without any deformation in the cells suggests the promising cell permeability and momentous viability of the reported receptor toward live cells.
Mariappan et al.150 reported the selective fluorescence sensing of copper(II) and water via competing imine hydrolysis and alcohol oxidation pathways sensitive to the water content in aqueous–acetonitrile mixtures (Fig. 71). The addition of copper ions into the receptor 81 solution caused an immediate appearance of an intense yellow emission, which was found to be selective in comparison to the various competitive ions. The addition of CuCl2 into the receptor 81 solution in a 1![[thin space (1/6-em)]](https://www.rsc.org/images/entities/char_2009.gif) :
:![[thin space (1/6-em)]](https://www.rsc.org/images/entities/char_2009.gif) 1 stoichiometric ratio yielded the yellow crystal of compound 81 upon evaporation of the solvents as characterized by NMR and single crystal X-ray diffraction analysis. However, the presence of a small water content replaced the yellow emission by an intense emission at 490 nm, and these results revealed the dual applicability of sensor 81 toward copper as well as water content by means of fluorescence spectroscopy. The resulting green emission diminished within a few second along with the production of a non-emissive solution referred to the formation of the oxidized product 84. The two possible pathways for the transformation of sensor 81 to the final non-emissive products 84 and 85 are given in Fig. 71. The evidence of this reaction pathway was obtained from the UV-visible spectral changes and NMR titration as well as from the mass spectrometry analysis.
1 stoichiometric ratio yielded the yellow crystal of compound 81 upon evaporation of the solvents as characterized by NMR and single crystal X-ray diffraction analysis. However, the presence of a small water content replaced the yellow emission by an intense emission at 490 nm, and these results revealed the dual applicability of sensor 81 toward copper as well as water content by means of fluorescence spectroscopy. The resulting green emission diminished within a few second along with the production of a non-emissive solution referred to the formation of the oxidized product 84. The two possible pathways for the transformation of sensor 81 to the final non-emissive products 84 and 85 are given in Fig. 71. The evidence of this reaction pathway was obtained from the UV-visible spectral changes and NMR titration as well as from the mass spectrometry analysis.
Yadav et al.151 reported a novel and easily synthesizable chemosensor 86 (Fig. 72) for the selective sensing of Cu2+ ions in a mixed aqueous–organic medium. Ligand 86 exhibited an absorption maxima at 425 nm in the absence of copper ions, whereas upon copper addition the broad absorption bands of the ligand at 425 nm completely disappeared with the emergence of two new signals centered at 365 and 504 nm, which were attributed to the ligand–copper complex formation along with a colorimetric change in the reaction solution from light yellow to orange-brown. These characteristic changes in the absorption spectra as well as the colorimetric change in the reaction solution can be used as a tool for copper ion detection via spectroscopy techniques and by the naked eye. Probe 86 behaved selectively toward copper ion in comparison to the competing ions. The UV-visible titration experiment of the probe with the successive additions of copper ions caused a ratiometric increase in the intensity of the absorption signal at 504 nm and the emergence of a clear isosbestic point, suggesting the formation of a new species as a result of the copper addition. The 1![[thin space (1/6-em)]](https://www.rsc.org/images/entities/char_2009.gif) :
:![[thin space (1/6-em)]](https://www.rsc.org/images/entities/char_2009.gif) 1 ligand–metal binding stoichiometry was calculated by the continuous variation method, and the association constant of the ligand toward the copper ions was found to be 1.56 × 10⁴ M−1 by the Benesi–Hildebrand expression. Further mechanistic insight was obtained from the NMR titration experiment as well as from the mass spectrometry analysis. In the case of the fluorescence spectroscopy analysis, the copper addition caused significant quenching in the ligand emission signal at 494 nm when it was excited at 425 nm and this quenching behavior was found to be specific for only copper ions, whereas a number of other metallic species did not interfere with the copper sensing behavior of the ligand.
1 ligand–metal binding stoichiometry was calculated by the continuous variation method, and the association constant of the ligand toward the copper ions was found to be 1.56 × 10⁴ M−1 by the Benesi–Hildebrand expression. Further mechanistic insight was obtained from the NMR titration experiment as well as from the mass spectrometry analysis. In the case of the fluorescence spectroscopy analysis, the copper addition caused significant quenching in the ligand emission signal at 494 nm when it was excited at 425 nm and this quenching behavior was found to be specific for only copper ions, whereas a number of other metallic species did not interfere with the copper sensing behavior of the ligand.
Subhasri et al.152 reported fluorescent chemosensors 88 (Fig. 73) for selective copper detection. The receptor 88 can be successfully applied as a chemosensor for copper detection as assessed by the fluorescence emission and UV-visible absorption spectral measurements. Copper addition into the receptor 88 solution caused a significant enhancement in the emission signal intensity, and this phenomenon was found to be selective for copper ions compared to various competitive ions. The 1![[thin space (1/6-em)]](https://www.rsc.org/images/entities/char_2009.gif) :
:![[thin space (1/6-em)]](https://www.rsc.org/images/entities/char_2009.gif) 1 ligand–copper binding stoichiometry was calculated by the continuous variation method, and the Benesi–Hildebrand equation was used to determine the dissociation constant values. Mechanistic insight was obtained through molecular docking studies and DFT calculations. The ligand cytotoxicity was assessed by the MTT assay with the results revealing the efficient compatibility of the reported receptor toward live cells. These characteristic changes in the UV-visible absorption spectrum and the fluorescence emission spectrum as well as low toxicity of the receptor make it a suitable candidate for copper detection in environmental and biological samples.
1 ligand–copper binding stoichiometry was calculated by the continuous variation method, and the Benesi–Hildebrand equation was used to determine the dissociation constant values. Mechanistic insight was obtained through molecular docking studies and DFT calculations. The ligand cytotoxicity was assessed by the MTT assay with the results revealing the efficient compatibility of the reported receptor toward live cells. These characteristic changes in the UV-visible absorption spectrum and the fluorescence emission spectrum as well as low toxicity of the receptor make it a suitable candidate for copper detection in environmental and biological samples.
Kim et al.153 reported a simple and low-cost chemosensor 89 (Fig. 74) for transition metal ion detection. The ligand alone exhibited a negligible fluorescence emission signal when it was excited at 362 nm, whereas Zn2+ addition caused a significant enhancement in the fluorescence emission intensity, indicating an “Off–On” type of fluorescence response for Zn2+. Furthermore, Zn2+ sensing could be assessed using the UV-visible absorption spectrum due to the decrease in the absorption bands at 272 and 400 nm and the continuous increase in the new absorption signals at 260 and 341 nm along with the distinct isosbestic points at 267, 301, and 364 nm. The 1![[thin space (1/6-em)]](https://www.rsc.org/images/entities/char_2009.gif) :
:![[thin space (1/6-em)]](https://www.rsc.org/images/entities/char_2009.gif) 1 ligand–Zn2+ binding stoichiometry was found by the continuous variation method utilizing the titration graphs, which was consistent with the mass spectrometry analysis results. In the case of the competitive ion experiment, the fluorescence emission intensity for the ligand–Zn2+ complex was drastically quenched by Cu2+ and Co2+, while no such effect was observed by the other competing ionic species. The ligand exhibited a significant colorimetric change in the presence of Fe2+ from light yellow to reddish pink, whereas Cu2+ and Zn2+ caused a discoloration of the ligand solution and this colorimetric change would be useful for naked eye ionic detection in the solution phase as well as for the construction of sensor strips. Moreover, the ligand was further successfully applied in the bioimaging experiment by utilizing the fibroblasts cultured and harvested, and the results revealed the efficient cell viability and membrane permeability of ligand 89 toward live cells.
1 ligand–Zn2+ binding stoichiometry was found by the continuous variation method utilizing the titration graphs, which was consistent with the mass spectrometry analysis results. In the case of the competitive ion experiment, the fluorescence emission intensity for the ligand–Zn2+ complex was drastically quenched by Cu2+ and Co2+, while no such effect was observed by the other competing ionic species. The ligand exhibited a significant colorimetric change in the presence of Fe2+ from light yellow to reddish pink, whereas Cu2+ and Zn2+ caused a discoloration of the ligand solution and this colorimetric change would be useful for naked eye ionic detection in the solution phase as well as for the construction of sensor strips. Moreover, the ligand was further successfully applied in the bioimaging experiment by utilizing the fibroblasts cultured and harvested, and the results revealed the efficient cell viability and membrane permeability of ligand 89 toward live cells.
Jo et al.154 reported a new asymmetric chemosensor 90 (Fig. 75) for selective copper detection. Copper addition caused a significant increase in the absorption signals at 310 and 406 nm, while the signal at 270 nm underwent a constant decline and reached a minimum value on 4 equivalents copper addition. The clear isosbestic points at 260 and 280 nm indicate the complex formation upon copper addition. The titration experiment of the ligand upon copper addition caused a colorimetric change in the reaction solution from colorless to yellow, and this colorimetric change has intense application potential for colorimetric metal sensing. The 1![[thin space (1/6-em)]](https://www.rsc.org/images/entities/char_2009.gif) :
:![[thin space (1/6-em)]](https://www.rsc.org/images/entities/char_2009.gif) 1 ligand–copper complexation stoichiometry was calculated by the continuous variation method, and the association constant was calculated to be 6.0 × 10³ M−1. The ligand exhibited a 18 μM detection limit toward copper monitoring. The ligand behaved reversibly on EDTA addition, which was assessed by the turning of the yellow color solution to colorless along with the disappearance of the absorption signal at 406 nm, indicating an EDTA-induced demetallation reaction in the ligand–copper complex solution.
1 ligand–copper complexation stoichiometry was calculated by the continuous variation method, and the association constant was calculated to be 6.0 × 10³ M−1. The ligand exhibited a 18 μM detection limit toward copper monitoring. The ligand behaved reversibly on EDTA addition, which was assessed by the turning of the yellow color solution to colorless along with the disappearance of the absorption signal at 406 nm, indicating an EDTA-induced demetallation reaction in the ligand–copper complex solution.
Ghaedi et al.155 reported a copper (Cu2+) ion-selective bulk optode 91 (Fig. 76). The appearance of two absorption signals at 416 and 356 nm strongly supports the occurrence of a chemical reaction between the copper ion and ionophore 91 impregnated in the membrane. The increase in copper concentration caused a significant decrease in the absorption signal centered at 356 nm and an increase in the absorption bands at 416 nm. These characteristic changes were attributed to copper extraction from the membrane. The high stability, reproducibility and longer lifetime are the characteristic features of the reported optode material, which can detect copper ions with a sensitivity of 8.1 × 10⁻⁷ mol L−1.
Na et al.156 reported a simple and easily synthesized colorimetric and fluorescent receptor 92 (Fig. 77) for selective copper ion detection. Copper addition into the receptor solution caused a significant decrease in the absorption signal intensity at 380 nm with a concomitant increase in the signal at 428 nm and turns the colorless solution to yellow. A clear isosbestic point at 401 nm was observed in the UV-visible titration experiment of the receptor with the copper ion, indicating the formation of a single species between the receptor and copper ion. The Job's plot indicated the 1![[thin space (1/6-em)]](https://www.rsc.org/images/entities/char_2009.gif) :
:![[thin space (1/6-em)]](https://www.rsc.org/images/entities/char_2009.gif) 1 ligand–copper binding stoichiometry. The association constant and detection limit of the receptor toward copper ions were calculated to be 5 × 10³ M−1 and 12 μM, respectively. Further mechanistic insight was obtained through the mass spectrometry analysis by the appearance of a clear peak for the receptor–copper complex. The ligand behaved reversibly on EDTA addition, which reverses the optical as well as colorimetric response of the ligand–copper complex solution. Furthermore, fluoride ion addition exerted a distinct colorimetric as well as spectral change in the ligand solution, suggesting the dual channel applicability of the receptor for copper and fluoride ion detection.
1 ligand–copper binding stoichiometry. The association constant and detection limit of the receptor toward copper ions were calculated to be 5 × 10³ M−1 and 12 μM, respectively. Further mechanistic insight was obtained through the mass spectrometry analysis by the appearance of a clear peak for the receptor–copper complex. The ligand behaved reversibly on EDTA addition, which reverses the optical as well as colorimetric response of the ligand–copper complex solution. Furthermore, fluoride ion addition exerted a distinct colorimetric as well as spectral change in the ligand solution, suggesting the dual channel applicability of the receptor for copper and fluoride ion detection.
Huo et al.157 reported a simple chromogenic sensor 93 (Fig. 78) for selective copper detection. Receptor 93 exhibited absorption signals at 300 and 360 nm in the absence of metal ions, whereas copper addition caused the disappearance of the absorption signal at 360 nm with the concomitant appearance of a new red-shifted absorption band at 442 nm along with a colorimetric change in the reaction solution from colorless to yellow, which was attributed to the copper-induced intramolecular charge transfer. The ligand exhibited a ratiometric response upon copper addition, and the appearance of a clear isobestic point strongly indicated the copper complex formation. The titration graph revealed the 6.5 × 10⁻⁶ M detection limit of the ligand toward copper recognition. The reverse color change in the ligand–copper complex upon EDTA addition indicates the reversibility of the receptor. The 1![[thin space (1/6-em)]](https://www.rsc.org/images/entities/char_2009.gif) :
:![[thin space (1/6-em)]](https://www.rsc.org/images/entities/char_2009.gif) 1 ligand–copper binding stoichiometry was calculated by the continuous variation method, and the binding constant was found to be 1.3 × 10⁶ mol−1 dm3 by the Benesi–Hildebrand equation.
1 ligand–copper binding stoichiometry was calculated by the continuous variation method, and the binding constant was found to be 1.3 × 10⁶ mol−1 dm3 by the Benesi–Hildebrand equation.
Yang et al.158 reported a new carbazole-based Schiff base 94 (Fig. 79) as a dual sensor for Fe3+ and Cu2+. Receptor 94 exhibited well-defined absorption signals at 286 and 370 nm. The addition of Fe3+ and Cu2+ caused an increase in the first absorption band at 286 nm along with a concomitant decrease in the second absorption band centered at 370 nm and a blue-shift from 370 nm to 364 nm in the former case and from 370 nm to 341 nm in the latter case. The appearance of a clear isosbestic point at 296 nm on ligand titration with Fe3+/Cu2+ and a significant shift in the absorption signal suggest copper binding with the receptor. The Job's plot indicated the 1![[thin space (1/6-em)]](https://www.rsc.org/images/entities/char_2009.gif) :
:![[thin space (1/6-em)]](https://www.rsc.org/images/entities/char_2009.gif) 2 and 1
2 and 1![[thin space (1/6-em)]](https://www.rsc.org/images/entities/char_2009.gif) :
:![[thin space (1/6-em)]](https://www.rsc.org/images/entities/char_2009.gif) 1 ligand–Fe3+/Cu2+ binding stoichiometry along with the association constant values of 8.33 × 10⁴ M−1 and 2.57 × 10⁴ M−1, respectively. The detection limit of the ligand toward Fe3+/Cu2+ was found to be 3.02 × 10⁻⁶ mol L−1 and 3.62 × 10⁻⁶ mol L−1, respectively, which are low enough to fulfill the criteria for a reliable chemosensor.
1 ligand–Fe3+/Cu2+ binding stoichiometry along with the association constant values of 8.33 × 10⁴ M−1 and 2.57 × 10⁴ M−1, respectively. The detection limit of the ligand toward Fe3+/Cu2+ was found to be 3.02 × 10⁻⁶ mol L−1 and 3.62 × 10⁻⁶ mol L−1, respectively, which are low enough to fulfill the criteria for a reliable chemosensor.
Awual et al.159 reported a highly selective mesoporous adsorbent fabricated by direct immobilization of a synthesized 3-(3-(methoxycarbonyl)benzylidene)hydrazinylbenzoic acid 95 (Fig. 80) onto mesoporous silica monoliths for selective copper recognition in drinking water. The incubation of the mesoporous adsorbent with copper ions triggered a colorimetric change as well as a significant optical response with maximum absorption intensity at 450 nm, whereas these changes were found to be selective only for copper addition, compared to the competing ionic species. The successful applicability of the sensor in pure aqueous media and recyclability were the prominent features that make the material a suitable candidate for the assessment of copper levels in drinking water.
Jo et al.160 reported a new chemosensor 96 (Fig. 81) based on the combination of 2-hydroxy-1-naphthaldehyde and the precursor 4-((2-aminophenyl)amino)-3-nitro-2H-chromen-2-one for selective copper detection. The UV-visible titration of the receptor with copper ions caused a significant reduction in the absorption signal at 480 nm with the concomitant appearance of new absorption bands at 430 and 550 nm. The increasing copper concentration harvested two clear isosbestic points at 460 and 510 nm along with a colorimetric change in the reaction solution from yellow to orange. The 1![[thin space (1/6-em)]](https://www.rsc.org/images/entities/char_2009.gif) :
:![[thin space (1/6-em)]](https://www.rsc.org/images/entities/char_2009.gif) 1 ligand–copper binding stoichiometry was calculated from the Job's curve, which was further supported by mass spectrometry analysis. The binding constant and the detection limit for the sensor toward copper ions were found to be 5.0 × 10³ M−1 and 2.95 × 10⁻⁵ M, respectively. The optical and colorimetric responses of the receptor could be reversed on EDTA addition, suggesting the reversible nature of the reported sensor 96. Moreover, the optical response and color of the ligand varied to a higher extent on cyanide ion addition, thus indicating the applicability of the sensor for selective cyanide ion monitoring.
1 ligand–copper binding stoichiometry was calculated from the Job's curve, which was further supported by mass spectrometry analysis. The binding constant and the detection limit for the sensor toward copper ions were found to be 5.0 × 10³ M−1 and 2.95 × 10⁻⁵ M, respectively. The optical and colorimetric responses of the receptor could be reversed on EDTA addition, suggesting the reversible nature of the reported sensor 96. Moreover, the optical response and color of the ligand varied to a higher extent on cyanide ion addition, thus indicating the applicability of the sensor for selective cyanide ion monitoring.
Aksuner et al.161 reported a novel Schiff base ligand 97 (Fig. 82) immobilized on polyvinlyl chloride. The sensor exhibited a linear range toward copper ions in the concentration range of 1.0 × 10⁻⁸–5.7 × 10⁻⁴ mol L−1. The ligand behaved reversibly and possessed a precisely low detection limit of 8.8 × 10⁻⁹ mol L−1. The high selectivity of the optode toward copper detection and the quick response time of less than 2.5 min were the attractive features of the reported material. The practical applicability of the sensor was assessed by utilizing tap water and tea sample, which gave satisfactory results for copper monitoring in the utilized samples.
Fang et al.162 reported the Schiff base 98 (Fig. 83) for selective copper detection. The receptor exhibited the absorption signals with the maximum absorption intensity at 256 and 324 nm. Copper addition caused an increase in the absorption band centered at 324 nm with the concomitance appearance of a new absorption band in the range from 350 to 450 nm with a continuous increase in the intensity depending on the copper concentration. Similarly, copper addition caused a drastic quenching of the probe emission signal at 430 nm when it was excited at 324 nm. This behavior of the probe could be reversed on EDTA addition, which revived the high intensity emission signal and reflected the decomplexation of the receptor–copper complex. The 1![[thin space (1/6-em)]](https://www.rsc.org/images/entities/char_2009.gif) :
:![[thin space (1/6-em)]](https://www.rsc.org/images/entities/char_2009.gif) 1 ligand–copper binding stoichiometry was calculated by the continuous variation method with the binding constant value of 3.94 L mol−1. The detection limit of the probe toward copper detection was found to be 2.0 × 10⁻⁸ mol L−1.
1 ligand–copper binding stoichiometry was calculated by the continuous variation method with the binding constant value of 3.94 L mol−1. The detection limit of the probe toward copper detection was found to be 2.0 × 10⁻⁸ mol L−1.
2.16. Terphenyl-based Cu2+ sensors
Wenfeng et al.163 reported a novel triphenylamine-based fluorescent sensor Tris[(4-amino)phenylduryl]amine 99 (Fig. 84) for the dual channel detection of ferric/copper ions in pure aqueous media. The receptor 99 was colorless but changed to a brown color upon copper addition. The other metal ions did not cause such a change in the aqueous solution of the receptor. This colorimetric change in the receptor solution upon copper addition can be used to sense copper ions via naked eye. Moreover, the change in the fluorescence of the receptor solution on ferric ion addition can be visualized under a UV lamp on illuminating at higher wavelengths. Ferric ions did not cause any change in the receptor solution under ambient light. The receptor exhibited two absorption bands at 275 and 350 nm in the absence of metallic species. Fe3+/Cu2+ addition caused an increase in the absorption intensity with a blue-shift of the first signal at 275 nm. The signal at 350 nm underwent a red-shift with the decrease in the absorption signal intensity along with the emergence of a new absorption band at 400 nm with a gradual increase in the absorption intensity in the UV-visible titration experiment, thus permitting the different coordination patterns of these metallic species with that of ligand to be detected. Similarly, the addition of Fe3+/Cu2+ caused fluorescence emission signal quenching at 425 nm, whereas the gradual addition of Fe3+/Cu2+ into the ligand solution shifted the emission band to lower energy with new values of 462 and 431 nm. Interestingly, on increasing the concentration of Fe3+/Cu2+, a new emission band with a gradual increase in intensity was observed, reflecting the binding tendency of the ligand toward these metallic species. The relatively high value of the Stern–Volmer quenching constant for Fe3+ and Cu2+ (4.08 × 10⁴ M−1 and 1.76 × 10⁴ M−1, respectively) suggest the strong binding affinity of these metals toward receptor 168. The probe showed a considerable low limit of detection for Fe3+ and Cu2+ with the experimental values of 230 nM and 620 nM, respectively, which meet the selective requirements for environmental application.Mahapatra et al.164 reported a new triphenylamine-based fluorogenic probe 100 (Fig. 85) bearing an indolylmethane unit for selective copper detection. The ligand 100 exhibited strong absorption signals at 274 and 283 nm along with a shoulder peak at 356 nm. Copper addition caused the appearance of two new strong absorption bands at 487 and 541 nm. An increasing copper ion concentration caused a significant increase in these two signals with a concomitant decrease in the absorption band at 291 nm. Moreover, it caused a copper-induced colorimetric change in the reaction solution from colorless to purple, and thus could be employed for colorimetric copper detection. Furthermore, the red-shift in the absorption band at 250 nm and the appearance of two clear isosbestic points at 287 and 332 nm indicated the inter-conversion between the complex and the un-complexed species. The 1![[thin space (1/6-em)]](https://www.rsc.org/images/entities/char_2009.gif) :
:![[thin space (1/6-em)]](https://www.rsc.org/images/entities/char_2009.gif) 2 host-to-cation complexation stoichiometry and the association constant value of (3.35 ± 0.21) × 104 M−1 were obtained from the fluorescence titration graph. Similarly, the copper addition caused drastic fluorescence quenching at 378 nm when it was excited at 291 nm. This response was selective in comparison to the various competing ionic species, suggesting the receptor as an “On–Off” fluorescence copper sensor.
2 host-to-cation complexation stoichiometry and the association constant value of (3.35 ± 0.21) × 104 M−1 were obtained from the fluorescence titration graph. Similarly, the copper addition caused drastic fluorescence quenching at 378 nm when it was excited at 291 nm. This response was selective in comparison to the various competing ionic species, suggesting the receptor as an “On–Off” fluorescence copper sensor.
 | ||
| Fig. 85 Chemical structure of receptor 100 and the proposed copper complexation mechanism at variable pH. | ||
Bhalla et al.165 reported a terphenyl-based bifunctional fluorescent chemosensor 101 (Fig. 86) for the dual channel detection of copper and fluoride ions. The receptor exhibited absorption signals at 265 and 342 nm. Copper addition caused a 9 nm red-shift in the signal at 342 to its new position at 351 nm, whereas there was no such response for the other metal ions. Similarly, the receptor showed a fluorescence emission signal at 517 nm when it was excited at 360 nm. However, copper addition caused a drastic fluorescence quenching, which was due to the receptor–copper complex formation. The fluorescence titration graph was utilized to determine the 1![[thin space (1/6-em)]](https://www.rsc.org/images/entities/char_2009.gif) :
:![[thin space (1/6-em)]](https://www.rsc.org/images/entities/char_2009.gif) 1 ligand–copper binding stoichiometry with the binding constant value of 5.40. The reversibility of the receptor was assessed by the addition of EDTA solution, which revived the receptor fluorescence emission signal, thus indicating decomplexation of the receptor–Cu2+ complex. Moreover, fluoride ion addition into the probe solution caused considerable changes in the UV-visible absorption and in the fluorescence emission signal along with a colorimetric change in the reaction solution, and this behavior of the ligand toward fluoride ions was successfully applied to trace its capability to sense fluoride ion selectively in comparison to a number of the other competitive anionic species.
1 ligand–copper binding stoichiometry with the binding constant value of 5.40. The reversibility of the receptor was assessed by the addition of EDTA solution, which revived the receptor fluorescence emission signal, thus indicating decomplexation of the receptor–Cu2+ complex. Moreover, fluoride ion addition into the probe solution caused considerable changes in the UV-visible absorption and in the fluorescence emission signal along with a colorimetric change in the reaction solution, and this behavior of the ligand toward fluoride ions was successfully applied to trace its capability to sense fluoride ion selectively in comparison to a number of the other competitive anionic species.
2.17. Benzimidazole-based Cu2+ sensors
Fu et al.166 described an “On–Off–On” type fluorescent sensor 102 (Fig. 87) for selective copper detection. Ligand 102 exhibited a strong absorption band at 329 nm, which gradually decreased in intensity upon the successive addition of copper ions along with the emergence of a new absorption band at 265 nm with a slight bathochromic shift and a continuous increase in intensity, suggesting the occurrence of complexation between the ligand and copper ions. In the case of fluorescence, the probe exhibited a strong emission band at 436 nm when it was excited at 243 nm, and 1 equivalent copper addition caused complete fluorescence quenching of the signal at 436 nm. The fluorescence and UV-visible titration curve reflect the 2![[thin space (1/6-em)]](https://www.rsc.org/images/entities/char_2009.gif) :
:![[thin space (1/6-em)]](https://www.rsc.org/images/entities/char_2009.gif) 1 ligand–copper complexation stoichiometry, and the binding constant of the ligand toward copper ions was calculated to be 3.22 × 10⁵ M−1. The ligand behaved specifically over a number of competing ionic species; furthermore, the response of the ligand toward copper ions could revert back on addition of an excess of sulfide ions, as could be assessed by the regeneration of the quenched emission signal. The switching response of the ligand was further applied for the integration of logic gates. Moreover, for practical applicability, the ligand was tested in the bioimaging experiment utilizing Ec-9706 cells, and the appearance of fluorescence from the cells incubated with the ligands revealed the appreciable cell viability and permeability of the sensor toward the live cells.
1 ligand–copper complexation stoichiometry, and the binding constant of the ligand toward copper ions was calculated to be 3.22 × 10⁵ M−1. The ligand behaved specifically over a number of competing ionic species; furthermore, the response of the ligand toward copper ions could revert back on addition of an excess of sulfide ions, as could be assessed by the regeneration of the quenched emission signal. The switching response of the ligand was further applied for the integration of logic gates. Moreover, for practical applicability, the ligand was tested in the bioimaging experiment utilizing Ec-9706 cells, and the appearance of fluorescence from the cells incubated with the ligands revealed the appreciable cell viability and permeability of the sensor toward the live cells.
Saluja et al.167 reported a benzimidazole-based imine-linked receptor 103 (Fig. 88) for copper detection. Copper addition caused a successive decrease in the emission signal of the probe when it was excited at 350 nm. The linear decrease in the fluorescence emission signal intensity was utilized to determine the 1![[thin space (1/6-em)]](https://www.rsc.org/images/entities/char_2009.gif) :
:![[thin space (1/6-em)]](https://www.rsc.org/images/entities/char_2009.gif) 1 ligand–copper binding stoichiometry, which was further supported by the mass spectrometry analysis. The association constant and the detection limit of the receptor toward copper ions were found to be 5.34 × 10³ M−1 and 0.98 μM, respectively. The addition of phosphate ions triggered the fluorescence emission signal intensity of the receptor–copper complex, suggesting decomplexation of the existing complex, and the departed copper ion forms the new complex with the phosphate ion to revive the ligand. This property of the ligand–copper complex may open up new sensing approaches for phosphate ion detection.
1 ligand–copper binding stoichiometry, which was further supported by the mass spectrometry analysis. The association constant and the detection limit of the receptor toward copper ions were found to be 5.34 × 10³ M−1 and 0.98 μM, respectively. The addition of phosphate ions triggered the fluorescence emission signal intensity of the receptor–copper complex, suggesting decomplexation of the existing complex, and the departed copper ion forms the new complex with the phosphate ion to revive the ligand. This property of the ligand–copper complex may open up new sensing approaches for phosphate ion detection.
Tang et al.168 reported a simple benzimidazole-based fluorescent chemosensor 104 (Fig. 89) for selective copper detection. Ligand 104 exhibited a strong fluorescence emission signal at 475 nm when it was excited at 338 nm, whereas copper addition caused a significant fluorescence quenching, suggesting the “On–Off” fluorescence behavior on copper addition. Ratiometric fluorescence quenching was observed in the ligand solution with a linear relationship with successive copper additions, and this fluorescence titration graph was utilized to determine 1![[thin space (1/6-em)]](https://www.rsc.org/images/entities/char_2009.gif) :
:![[thin space (1/6-em)]](https://www.rsc.org/images/entities/char_2009.gif) 1 ligand–copper complexation stoichiometry, which was consistent with the results of the FT-IR and mass spectrometry analyses. The ligand exhibited an association constant and detection limit of 4.3 × 10⁴ M−1 and 3.5 × 10⁻⁷ M, respectively. Moreover, the ligand–copper complex solution underwent a reversible transformation upon sulfide ion addition, and this reversibility process was selective upon only sulfide ion addition compared to various competitive anionic species.
1 ligand–copper complexation stoichiometry, which was consistent with the results of the FT-IR and mass spectrometry analyses. The ligand exhibited an association constant and detection limit of 4.3 × 10⁴ M−1 and 3.5 × 10⁻⁷ M, respectively. Moreover, the ligand–copper complex solution underwent a reversible transformation upon sulfide ion addition, and this reversibility process was selective upon only sulfide ion addition compared to various competitive anionic species.
Tang et al.169 reported a new benzimidazole-based imine-linked sensor 105 (Fig. 90) for selective copper detection. The ligand exhibited a remarkable fluorescence emission signal with the maximum intensity at 429 nm, whereas copper addition caused a drastic quenching in the emission signal at 429 nm when it was excited at 357 nm. The linear decrease in the fluorescence emission signal intensity was utilized to determine the 1![[thin space (1/6-em)]](https://www.rsc.org/images/entities/char_2009.gif) :
:![[thin space (1/6-em)]](https://www.rsc.org/images/entities/char_2009.gif) 1 ligand–copper complexation stoichiometry, and the association constant was calculated to be 6.59 × 10⁵ M−1. Further mechanistic insight was obtained through FT-IR spectroscopy analysis. Similarly, copper addition showed a decrease in the absorption signal at 356 nm with the concomitant appearance of a new absorption signal at 426 nm. The copper titration displayed two clear isosbestic points at 341 and 378 nm, representing the formation of a stable copper complex. The fluorescence titration data were utilized to determine the detection limit, which was evaluated to be 1.82 × 10⁻⁸ M, toward copper detection. The ligand behaved reversibly on cyanide ion addition, which turned-on the quenched fluorescence of the receptor–copper complex, thus confirming the recovery of the original moiety.
1 ligand–copper complexation stoichiometry, and the association constant was calculated to be 6.59 × 10⁵ M−1. Further mechanistic insight was obtained through FT-IR spectroscopy analysis. Similarly, copper addition showed a decrease in the absorption signal at 356 nm with the concomitant appearance of a new absorption signal at 426 nm. The copper titration displayed two clear isosbestic points at 341 and 378 nm, representing the formation of a stable copper complex. The fluorescence titration data were utilized to determine the detection limit, which was evaluated to be 1.82 × 10⁻⁸ M, toward copper detection. The ligand behaved reversibly on cyanide ion addition, which turned-on the quenched fluorescence of the receptor–copper complex, thus confirming the recovery of the original moiety.
Tang et al.170 reported a new 2-(20-aminophenyl)benzimidazole-based fluorescent copper sensor 106 (Fig. 91). Copper addition caused a gradual quenching in the fluorescence emission signal intensity at 373 and 495 nm with the quenching process becoming saturated up to 1 equivalent copper addition. The linear decrease in the fluorescence emission signal intensity indicates the 1![[thin space (1/6-em)]](https://www.rsc.org/images/entities/char_2009.gif) :
:![[thin space (1/6-em)]](https://www.rsc.org/images/entities/char_2009.gif) 1 ligand–copper binding stoichiometry, which was further supported by the Job's curve, FT-IR, NMR and mass spectrometry analysis. From the fluorescence titration graph, the association constant of the probe toward copper ions was calculated to be 1.31 × 10⁵ M−1. The spectral response of the probe–copper complex could be reversed on sulfide ion addition, which suggested a reversible nature of the reported sensor.
1 ligand–copper binding stoichiometry, which was further supported by the Job's curve, FT-IR, NMR and mass spectrometry analysis. From the fluorescence titration graph, the association constant of the probe toward copper ions was calculated to be 1.31 × 10⁵ M−1. The spectral response of the probe–copper complex could be reversed on sulfide ion addition, which suggested a reversible nature of the reported sensor.
2.18. Pyridine-based Cu2+ sensors
Liu et al.171 reported a new N,N-bis(2-pyridylmethyl)amine-based fluorescent sensor 107 (Fig. 92) for trace Zn2+ and Cu2+ detection. The addition of Zn2+ into the probe solution caused the appearance of a new absorption signal at 353 nm along with a red-shift of the probe absorption band, whereas copper addition induced a further bathochromic shift in the absorption signal at 363 nm. In the case of fluorescence, the introduction of Zn2+ induced an increase in the fluorescence emission band at 443 nm, which was drastically quenched on copper addition when it was excited at 353 nm. These characteristic changes in the probe absorption and emission spectra were due to the complexation of the receptor with these ionic species. The 1![[thin space (1/6-em)]](https://www.rsc.org/images/entities/char_2009.gif) :
:![[thin space (1/6-em)]](https://www.rsc.org/images/entities/char_2009.gif) 1 ligand–metal binding stoichiometry was calculated by the continuous variation method employing the titration graphs. The ligand behaved selectively toward the zinc and copper ions compared to a number of the competing ionic species, and a fine linear relationship was observed on titration of the receptor with these metallic species. Mechanistic insight was obtained from the NMR analysis and mass spectrometry measurements; the proposed sensing mechanism is given in Fig. 92. The ligand showed a precisely low limit of detection toward zinc and copper ions with the experimental values of 7.89 × 10⁻⁷ M and 1.27 × 10⁻⁷ M, respectively. Furthermore, the ligand was efficiently applied to real samples using tap water, lake water and soil solution with the good operating ability of the ligands toward the tested samples.
1 ligand–metal binding stoichiometry was calculated by the continuous variation method employing the titration graphs. The ligand behaved selectively toward the zinc and copper ions compared to a number of the competing ionic species, and a fine linear relationship was observed on titration of the receptor with these metallic species. Mechanistic insight was obtained from the NMR analysis and mass spectrometry measurements; the proposed sensing mechanism is given in Fig. 92. The ligand showed a precisely low limit of detection toward zinc and copper ions with the experimental values of 7.89 × 10⁻⁷ M and 1.27 × 10⁻⁷ M, respectively. Furthermore, the ligand was efficiently applied to real samples using tap water, lake water and soil solution with the good operating ability of the ligands toward the tested samples.
Liu et al.172 reported a new 7-nitrobenz-2-oxa-1,3-diazole (NBD)-derived fluorescent probe 108 (Fig. 93) for selective copper detection. The ligand exhibited a fluorescence emission signal at 544 nm, which was drastically quenched on copper addition. A ratiometric decrease in the fluorescence emission signal intensity was observed on increasing the copper ion concentration, and the fluorescence titration graph revealed the 1![[thin space (1/6-em)]](https://www.rsc.org/images/entities/char_2009.gif) :
:![[thin space (1/6-em)]](https://www.rsc.org/images/entities/char_2009.gif) 1 ligand–copper binding stoichiometry of the resulting complex. The association constant of the ligand toward copper binding was found to be 1.22 × 10³ M−1.
1 ligand–copper binding stoichiometry of the resulting complex. The association constant of the ligand toward copper binding was found to be 1.22 × 10³ M−1.
Schwarze et al.173 reported N-2-pyridinylmethyl-N′-arylmethyldiaminomaleonitriles (109–111, Fig. 94), which undergo copper-promoted air oxidation and deprotonation to form maleonitriles via a complexation reaction. The copper complexation reaction was fast and selective and could be employed for chromogenic copper quantification in different media. The receptor exhibited a UV-visible absorption signal in the range of 280–350 nm, whereas copper introduction led to a decrease in the CT absorption band around 333 nm along with the appearance of an unsymmetrical CT band centered at 511 nm with a shoulder at 480 nm. The titration curve at 511 nm reached its maximum intensity on 0.5 equivalent copper addition, indicating the 2![[thin space (1/6-em)]](https://www.rsc.org/images/entities/char_2009.gif) :
:![[thin space (1/6-em)]](https://www.rsc.org/images/entities/char_2009.gif) 1 ligand–metal complexation stoichiometry; furthermore, the detection limit of the sensor toward the copper ions was calculated to be 1.56 × 10⁻⁶ M. The colorimetric change in the receptor solution from yellow to deep red upon copper addition could be employed for naked eye metal detection in waste water and biological media.
1 ligand–metal complexation stoichiometry; furthermore, the detection limit of the sensor toward the copper ions was calculated to be 1.56 × 10⁻⁶ M. The colorimetric change in the receptor solution from yellow to deep red upon copper addition could be employed for naked eye metal detection in waste water and biological media.
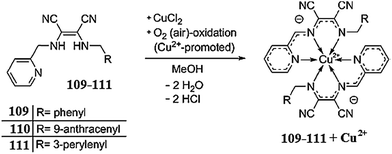 | ||
| Fig. 94 Chemical structure of receptor 109–111 and selective Cu2+-promoted air oxidation and deprotonation in the receptors to form copper complexes. | ||
Reynal et al.174 reported a series of six 2,2′-bipyridine-3,3′-diols 112–117 (Fig. 95) with different substituents as potential chemosensors for copper ions.
The ligands 112–117 exhibited absorption signals at 342 for 115, 349 for 112, 351 for 116, 342 for 113, 376 for 114 and 398 for 117. There was an emergence of new bands along with a colorimetric change in receptors 115 and 112, which were attributed to the metal to ligand charge transfer. Similarly, the receptors showed fluorescence emission bands at 469 for 115, 484 for 116, 475 for 113, 466 for 112, 537 for 114 and 600 nm for 117. Copper addition caused a drastic fluorescence quenching in the less hindered derivatives, i.e., 115 and 112, along with a colorimetric change in the reaction solution. The 1![[thin space (1/6-em)]](https://www.rsc.org/images/entities/char_2009.gif) :
:![[thin space (1/6-em)]](https://www.rsc.org/images/entities/char_2009.gif) 1 receptor–copper binding stoichiometry was calculated by employing the continuous variation method, furthermore, the binding constants were found to be (1.44 × 10⁷) ± 1.4 and (3.09 × 10⁵) ± 1.2 for 115 and 112, respectively. The sensitivity of receptors 115 and 112 was found to be 0.04 and 0.1 ppm, respectively, and the proposed complexing mechanism for 115 with the copper ions is shown in Fig. 96.
1 receptor–copper binding stoichiometry was calculated by employing the continuous variation method, furthermore, the binding constants were found to be (1.44 × 10⁷) ± 1.4 and (3.09 × 10⁵) ± 1.2 for 115 and 112, respectively. The sensitivity of receptors 115 and 112 was found to be 0.04 and 0.1 ppm, respectively, and the proposed complexing mechanism for 115 with the copper ions is shown in Fig. 96.
Li et al.175 reported an ‘‘off–on’’ Zn2+ and ‘‘On–Off’’ Cu2+ fluorescent chemosensor 118 (Fig. 97). The receptor exhibited three absorption bands at 205, 244, and 263 nm, respectively, in the absence of metallic species. The addition of zinc ions caused a slight increase in the absorption signal without any shift in the spectral position, whereas a significant increase in the absorption signal was observed by copper addition. The involvement of this metallic ion in the complexation process together with that of the probe was further studied by NMR analysis. Similarly, the receptor showed a weak emission band at 375 nm when it was excited at 246 nm, whereas a zinc addition caused a significant enhancement in the emission signal intensity centered at 375 nm, indicating an ‘‘off–on’’ sensing response of the probe toward the zinc ions. Interestingly, copper addition caused a drastic quenching in the fluorescence emission band at 375 nm due to its paramagnetic behavior, suggesting an ‘‘On–Off’’ sensing response. The Job's plot indicated the 1![[thin space (1/6-em)]](https://www.rsc.org/images/entities/char_2009.gif) :
:![[thin space (1/6-em)]](https://www.rsc.org/images/entities/char_2009.gif) 1 ligand–metal binding stoichiometry, and the detection limits for zinc and copper were calculated to be 1.7 × 10⁻⁵ M and 8.0 × 10⁻⁶ M, respectively. The probe behaved reversibly on the addition of EDTA solution as confirmed by the recovery of the original signal in the UV-visible absorption and by the fluorescence emission spectral measurement. This reversible nature of the sensor might be useful in the integration of the reported probe toward use with the logic gate.
1 ligand–metal binding stoichiometry, and the detection limits for zinc and copper were calculated to be 1.7 × 10⁻⁵ M and 8.0 × 10⁻⁶ M, respectively. The probe behaved reversibly on the addition of EDTA solution as confirmed by the recovery of the original signal in the UV-visible absorption and by the fluorescence emission spectral measurement. This reversible nature of the sensor might be useful in the integration of the reported probe toward use with the logic gate.
Tongkate et al.176 reported the oligo-phenylene vinylene-based sensor 119 (Fig. 98) for copper detection. The receptor exhibited a fluorescence emission signal at 440 nm. The addition of copper and nickel ions caused fluorescence quenching, whereas no other metallic additions showed such an effect. The crucial role of receptor 119 on copper recognition was confirmed using the well-known synthetic molecules as well as by theoretical analysis, which suggested the role of oxygen and nitrogen in the receptor in the complexation reaction with copper ions.
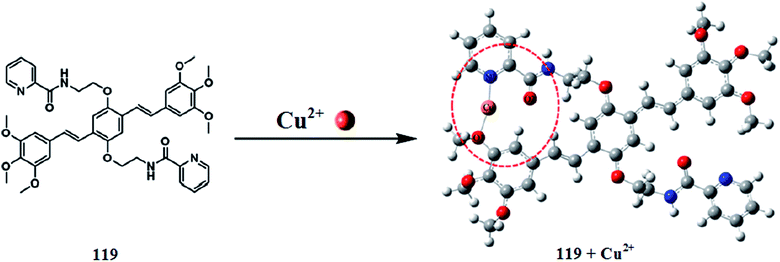 | ||
| Fig. 98 Chemical structure of receptor 119 and energy-minimized conformation of the receptor–copper complex. | ||
2.19. Copper sensor based on a click reaction
Wang et al.177 reported the fluorescent sensor 120 (Fig. 99) for copper determination in serum samples via a click reaction. The addition of Cu(II) and sodium ascorbate to the weak fluorescence compound 120 triggered a strong fluorescence signal with the maximum emission intensity at 471 nm through transformation of the 1,2,3-triazole nucleus; furthermore, the newly formed compound exhibited high luminescence properties. The fluorescence intensity at 471 nm was found to increase ratiometrically depending on the copper concentration, thus harvesting the good linear relationship with the calculated linearly dependent coefficient values of 0.9989. From the titration experiment, the limit of detection of the sensor toward copper was calculated to be 0.08 μM. The sensor worked well for copper detection even in the presence of a number of ionic species and demonstrated successful applicability for copper sensing in biological samples, i.e., human serum in the present investigation.2.20. Copper sensor based on a caging ligand
Mbatia et al.178 reported a copper–caging ligand 121 (Fig. 100), which can stabilize Cu+ complexes in an aqueous solution and release the guest metal ion upon photolysis of the nitrobenzyl group. The apparent dissociation constant value for the photocage was found to be 54 pM for the copper ion. The metal ion release was demonstrated by utilizing the fluorescence sensor material.2.21. Aza derivative as a copper sensor
Pallavicini et al.179 reported new ligands containing the 1,4,8,11-tetraaza-5,7-dione framework 122 (Fig. 101) for selective copper detection. The ligand was capable of detecting copper ions in the “On–Off” manner in fluorimetric and pH-metric titration experiments. The copper detecting efficiency of the reported signaling process could be tuned, thus changing the number and position of the lipophilic functionalities.2.22. Phenothiazine-based Cu2+ sensor
Liang et al.180 reported a highly sensitive and selective photoinduced electron transfer (PET) fluorescence chemodosimeter 123 (Fig. 102) for Cu2+ detection. The ligand exhibited a UV-visible absorption signal with the maximum absorption intensity at 498 nm, which smoothly decreased in intensity on successive copper additions along with a colorimetric change in the reaction solution from pink-red to light-green, which is an advantageous feature of the reported sensor for naked eye copper detection. Similarly, the ligand exhibited a weak fluorescence emission signal at 528 nm, which significantly increased in intensity upon copper addition due to the conformational changes in the ligand structure upon copper binding. The 1![[thin space (1/6-em)]](https://www.rsc.org/images/entities/char_2009.gif) :
:![[thin space (1/6-em)]](https://www.rsc.org/images/entities/char_2009.gif) 1 ligand–metal complexation stoichiometry was found from the Job's curve employing the fluorescence titration graph, which was further confirmed by the mass spectrometry analysis. The addition of reducing agent L-cysteine diminished the emission signal at 528 nm, indicating that the reduction in the oxidized probe and the declined fluorescence can be regained by a further addition of copper ions.
1 ligand–metal complexation stoichiometry was found from the Job's curve employing the fluorescence titration graph, which was further confirmed by the mass spectrometry analysis. The addition of reducing agent L-cysteine diminished the emission signal at 528 nm, indicating that the reduction in the oxidized probe and the declined fluorescence can be regained by a further addition of copper ions.
2.23. Calixarene-based Cu2+ sensors
Ho et al.181 reported the synthesis of a fluorescence turn-on chemosensor 124 (Fig. 103) for selective copper detection. The sensor 124 exhibited a UV-visible absorption signal at 308 nm and a very weak emission band in the range of 300–600 nm when it was excited at 308 nm. Copper addition caused a dramatic enhancement in the emission signal intensity centered at 341 and 452 nm, whereas negligible signal shifting was observed with a number of the competing ionic species. Titration of the ligand solution with copper ions gradually decreased the absorption signal at 308 nm with a concurrent formation of a new absorption band at 438 nm along with two clear isosbestic points at 263 and 345 nm, indicating the formation of a well-defined ligand–copper complex. Similarly, copper addition below 4 equivalents caused an increase in the fluorescence emission band at 452 nm, and beyond 4 equivalents copper addition, the emission signal centered at 452 nm declined, which was considered due to the “inner filter effect” of the absorption at 438 nm. The 1![[thin space (1/6-em)]](https://www.rsc.org/images/entities/char_2009.gif) :
:![[thin space (1/6-em)]](https://www.rsc.org/images/entities/char_2009.gif) 2 ligand–copper complexation stoichiometries were calculated using Job's methods utilizing the titration results. Furthermore, the association constant was calculated to be 2.02 × 10⁹ M−2 by utilizing the Benesi–Hildebrand equation. Further mechanistic insight was obtained through the NMR titration experiment and mass spectrometry analysis as well as by EPR analysis.
2 ligand–copper complexation stoichiometries were calculated using Job's methods utilizing the titration results. Furthermore, the association constant was calculated to be 2.02 × 10⁹ M−2 by utilizing the Benesi–Hildebrand equation. Further mechanistic insight was obtained through the NMR titration experiment and mass spectrometry analysis as well as by EPR analysis.
Chawla et al.182 reported a novel calix[4]arene-based molecular probe 125 (Fig. 104) for copper detection. Sensor 125 exhibited an absorption signal at 339 nm, which was red-shifted to 346 nm upon 5.5 equivalents copper addition along with a colorimetric change in the reaction solution from colorless to light yellow. The titration graph indicated the 1![[thin space (1/6-em)]](https://www.rsc.org/images/entities/char_2009.gif) :
:![[thin space (1/6-em)]](https://www.rsc.org/images/entities/char_2009.gif) 1 binding stoichiometry, which was further confirmed by the straight line obtained from the Benesi–Hildebrand equation. Similarly, the sensor showed a very weak fluorescence emission signal at 420 nm when it was excited at 340 nm, whereas copper addition caused a significant increase in the fluorescence emission signal along with a 90 nm red-shift, suggesting the formation of a receptor–copper complex. The binding constant and detection limit of the receptor for the copper ions were calculated to be 1.15 × 10⁴ M−1 and 0.6 μM, respectively.
1 binding stoichiometry, which was further confirmed by the straight line obtained from the Benesi–Hildebrand equation. Similarly, the sensor showed a very weak fluorescence emission signal at 420 nm when it was excited at 340 nm, whereas copper addition caused a significant increase in the fluorescence emission signal along with a 90 nm red-shift, suggesting the formation of a receptor–copper complex. The binding constant and detection limit of the receptor for the copper ions were calculated to be 1.15 × 10⁴ M−1 and 0.6 μM, respectively.
Kim et al.183 reported calix[4]arene-based chromogenic sensors bearing the 9,10-anthraquinone moiety 126 (Fig. 105) for copper detection. The receptor exhibited an absorption signal at 380 nm in acetonitrile. Copper addition produced a new absorption band at 450 nm along with a colorimetric change in the reaction solution from yellow to red. The titration graph indicates the 1![[thin space (1/6-em)]](https://www.rsc.org/images/entities/char_2009.gif) :
:![[thin space (1/6-em)]](https://www.rsc.org/images/entities/char_2009.gif) 1 receptor–copper binding stoichiometry, and the association constant value was found to be 1.80 × 10² M−1. The copper-induced spectral variation and the colorimetric change were found to be selective, in comparison to the various competing ionic species, suggesting the selective tendency of the receptor toward copper binding.
1 receptor–copper binding stoichiometry, and the association constant value was found to be 1.80 × 10² M−1. The copper-induced spectral variation and the colorimetric change were found to be selective, in comparison to the various competing ionic species, suggesting the selective tendency of the receptor toward copper binding.
Tabakci et al.184 reported the calix[4]arene amine derivative 127 (Fig. 106) for selective copper detection. Copper addition into the probe solution caused a gradual increase in the absorption signals at 414 and 635 nm along with a colorimetric change in the reaction solution. The titration graph yielded the 1![[thin space (1/6-em)]](https://www.rsc.org/images/entities/char_2009.gif) :
:![[thin space (1/6-em)]](https://www.rsc.org/images/entities/char_2009.gif) 2 ligand–copper binding stoichiometry, and the association constant was calculated by the Benesi–Hildebrand equation as 3.9 ± 0.5 × 10⁴. Similarly, the receptor showed a fluorescence emission signal at 385 nm when it was excited at 280 nm, and the copper addition caused a drastic quenching of the probe emission signal, thus indicating the applicability of receptor 127 as an “On–Off” fluorescence sensor for copper detection.
2 ligand–copper binding stoichiometry, and the association constant was calculated by the Benesi–Hildebrand equation as 3.9 ± 0.5 × 10⁴. Similarly, the receptor showed a fluorescence emission signal at 385 nm when it was excited at 280 nm, and the copper addition caused a drastic quenching of the probe emission signal, thus indicating the applicability of receptor 127 as an “On–Off” fluorescence sensor for copper detection.
Pathak et al.185 reported a benzimidazole-appended triazole linked 1,3-diconjugate of calix[4]arene 128 (Fig. 107) for the selective recognition of copper ions. Ligand 128 exhibited a fluorescence emission signal at 310 nm when it was excited at 280 nm. Copper addition caused a significant quenching in the emission band at 311 nm with the emergence of new emission signal at 380 nm. The quenching phenomena continued up to 2–3 equivalents copper addition. A further increase in copper concentration caused a gradual increase in the fluorescence emission intensity at 311 nm, reflecting saturation of the sensor. Similarly, the ligand exhibited absorption bands centered at 274 and 280 nm along with a shoulder peak at 293 nm. Copper addition caused an increase in these absorption bands, but became saturated with the copper concentration above 4 equivalents The appearance of the isosbestic point at 285 nm indicated the transition between the ligand and the newly formed ligand–metal complex. The association constant was calculated to be 7.24 × 10⁹ and 1.80 × 10¹⁰ M−2 based on the fluorescence emission and UV-visible absorption data, respectively. Mechanistic insight was obtained through the Job's plot, EPR titration, NMR analysis, cyclic voltammetry study, DFT calculations, and mass spectrometry measurements. The proposed ligand–metal complexation mechanisms are given in Fig. 107.
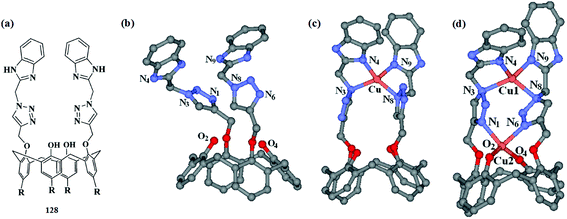 | ||
| Fig. 107 Chemical structure of receptor 128 (a); optimized geometry (b); mononuclear ligand–copper complex (c); binuclear ligand–copper complex (d). | ||
Joseph et al.186 reported the calix[4]arene-based sensor 129 (Fig. 108) for copper detection. The addition of copper ions caused the emergence of a new band at 655 nm, demonstrating the interaction between the ligand and the copper ions. The 1![[thin space (1/6-em)]](https://www.rsc.org/images/entities/char_2009.gif) :
:![[thin space (1/6-em)]](https://www.rsc.org/images/entities/char_2009.gif) 1 ligand–copper binding stoichiometry was calculated by the continuous variation method and was further confirmed by the mass spectrometry analysis. The titration graph yielded the association constant values of 17
1 ligand–copper binding stoichiometry was calculated by the continuous variation method and was further confirmed by the mass spectrometry analysis. The titration graph yielded the association constant values of 17![[thin space (1/6-em)]](https://www.rsc.org/images/entities/char_2009.gif) 547 ± 1000 and 30
547 ± 1000 and 30![[thin space (1/6-em)]](https://www.rsc.org/images/entities/char_2009.gif) 221 ± 1600 M−1, respectively, in methanol and 1
221 ± 1600 M−1, respectively, in methanol and 1![[thin space (1/6-em)]](https://www.rsc.org/images/entities/char_2009.gif) :
:![[thin space (1/6-em)]](https://www.rsc.org/images/entities/char_2009.gif) 1 aqueous methanol. These high binding constant values suggest the efficient binding tendency of the receptor toward copper ions. The detection limit of the receptor toward copper ions was found to be 196 and 341 ppb in methanol and 1
1 aqueous methanol. These high binding constant values suggest the efficient binding tendency of the receptor toward copper ions. The detection limit of the receptor toward copper ions was found to be 196 and 341 ppb in methanol and 1![[thin space (1/6-em)]](https://www.rsc.org/images/entities/char_2009.gif) :
:![[thin space (1/6-em)]](https://www.rsc.org/images/entities/char_2009.gif) 1 aqueous methanol, respectively.
1 aqueous methanol, respectively.
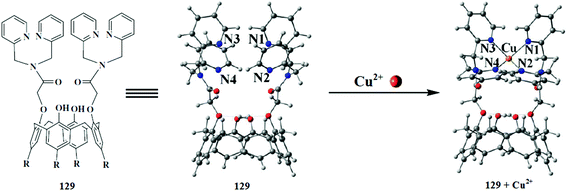 | ||
| Fig. 108 Chemical- and energy-minimized structure of receptor 129 along with the receptor–copper complex. | ||
2.24. Aniline-based Cu2+ sensors
Kacmaz et al.187 reported a stable and ultra-sensitive nano-scale fluorescent chemosensor for sensitive and selective copper detection. Fluoroionophore 130 (Fig. 109) was encapsulated on the polymeric ethyl cellulose. The sensing membrane was fabricated in the form of nanofibers and thin films. The dye was embedded in the polymeric material, which had strong photophysical properties. Steady-state and time resolved fluorescence spectroscopy permitted the sensing ability of the nanofibrous materials. The sensitivity of the sensor was found to be 3.3 × 10⁻¹³ M, which is quite low for environmental monitoring. This phenomenon was found to be selective only for copper ions in comparison to the various competing ionic species.Udhayakumari et al.188 reported receptors 131–133 (Fig. 110) for selective copper detection in pure aqueous media. The receptors 131–133 exhibited UV-visible absorption signals at 400, 500, and 375 nm, respectively. Copper addition caused a significant decrease in these absorption signals along with a colorimetric change in the reaction solution. The appearance of isosbestic point at 425 and 315 nm for receptors 132 and 133, respectively, confirmed the copper complexation. Copper addition caused a significant fluorescence quenching at 500 nm in receptor 131, and a fluorescence increase along with a 35 nm red-shift of the signal at 440 nm and a clear isoemissive point at 580 nm for receptor 132. Moreover, similar fluorescence enhancements were observed for receptor 133. These results reflect that receptor 238 acted as a fluorescence turn-off copper ion sensor and the rest of the ligands acted as fluorescent turn-on sensors for copper ions. The 1![[thin space (1/6-em)]](https://www.rsc.org/images/entities/char_2009.gif) :
:![[thin space (1/6-em)]](https://www.rsc.org/images/entities/char_2009.gif) 1 ligand–copper binding stoichiometry was observed for receptors 131 and 132, while it was 2
1 ligand–copper binding stoichiometry was observed for receptors 131 and 132, while it was 2![[thin space (1/6-em)]](https://www.rsc.org/images/entities/char_2009.gif) :
:![[thin space (1/6-em)]](https://www.rsc.org/images/entities/char_2009.gif) 1 for receptor 133. The binding constants were calculated to be 3.3 × 10⁵, 3.3 × 10⁵ and 2.8 × 10⁵ for receptors 131–133, respectively. The ligands were further employed in the bioimaging experiment to explore their potential as intracellular copper sensors utilizing the HeLa cell line under a confocal fluorescence microscope. The appearance of bright fluorescence from the live cells without any deformation inside them demonstrated the successful applicability and the efficient membrane permeability of the reported sensor toward live cells.
1 for receptor 133. The binding constants were calculated to be 3.3 × 10⁵, 3.3 × 10⁵ and 2.8 × 10⁵ for receptors 131–133, respectively. The ligands were further employed in the bioimaging experiment to explore their potential as intracellular copper sensors utilizing the HeLa cell line under a confocal fluorescence microscope. The appearance of bright fluorescence from the live cells without any deformation inside them demonstrated the successful applicability and the efficient membrane permeability of the reported sensor toward live cells.
2.25. Aminonaphthol-based Cu2+ sensor
Wu et al.189 reported a novel fluorescent chemosensor based on aminonaphthol 134 (Fig. 111) for selective copper recognition. The receptor 134 exhibited two emission bands at 366 and 436 nm in an aqueous solution, whereas copper addition caused a significant quenching of the emission signal. The ligand exhibited a ratiometric decrease in the fluorescence emission depending on the copper concentration in the case of the titration experiment, and this titration graph was used to determine the 1![[thin space (1/6-em)]](https://www.rsc.org/images/entities/char_2009.gif) :
:![[thin space (1/6-em)]](https://www.rsc.org/images/entities/char_2009.gif) 1 ligand–copper binding stoichiometry. The response of the receptor toward copper ions was found to be selective in comparison to the various competing ionic species, which showed negligible quenching of the ligand fluorescence.
1 ligand–copper binding stoichiometry. The response of the receptor toward copper ions was found to be selective in comparison to the various competing ionic species, which showed negligible quenching of the ligand fluorescence.
2.26. Benzothiadiazole-based Cu2+ sensor
Cimen et al.190 reported a novel fluorescent sensor 135 (Fig. 112) for selective copper and cobalt detection. The receptor 135 exhibited a UV-visible absorption signal at 346 and a fluorescence emission signal at 474 nm when it was excited at 350 nm in the benzonitrile solution. Co2+ introduction caused a 2 nm red-shift in the absorption signal centered at 346 and a remarkable visible absorption enhancement at 470 and 580 nm, turning the solution color into red-yellowish. Similarly, cobalt addition caused a gradual quenching of the fluorescence emission signal at 474 nm when the excitation slit was fixed at 350 nm. Interestingly, copper addition initially triggered an enhancement in the fluorescence emission signal intensity, whereas at higher concentrations it caused fluorescence quenching. The characteristic changes in the receptor solution upon Co2+/Cu2+ addition revealed the complexation tendency of the reported receptor toward these metallic ions. There was no such response in the case of the competing metallic ions additions. The limit of detection of the sensor toward Co2+ and Cu2+ was found to be 5.50 × 10⁻⁷ and 3.70 × 10⁻⁶ M, respectively. Moreover, the addition of EDTA and CN− caused a fluorescence enhancement of the receptor–Co2+ complex, whereas fluoride ion addition caused a fluorescence decrease. These observations reflect that the receptor–Co2+ complex might be useful for anionic detection.2.27. Hydrazide-based copper sensors
Wang et al.191 reported two new water-soluble hydrazide-based fluorescent probes 136 and 137 (Fig. 113) for the selective recognition of copper and mercury. The receptors 136 and 137 showed absorption signals at 141 and 390 nm and fluorescence emission signals at 540 and 505 nm, respectively. Receptor 136 exhibited a significant decrease in the fluorescence emission signal intensity at 540 on Cu2+/Hg2+ addition, whereas receptor 137 caused fluorescence quenching only in the presence of Cu2+ along with a colorimetric change in the reaction solution. The detection limit of receptor 136 for Cu2+/Hg2+ was estimated to be 2.0 × 10⁻¹⁰ and 2.0 × 10⁻⁹ M, respectively, while the detection limit of receptor 137 for copper ions was estimated to be 2.0 × 10⁻¹⁰ M in pure aqueous media. The considerable shifting in the UV-visible absorption and fluorescence emission signals along with colorimetric change upon metallic addition demonstrate the tendency of the receptor toward the selected metals ions.2.28. Thiosemicarbazide-based Cu2+ sensor
Lin et al.192 reported the acylthiosemicarbazide-based copper ion senor 138 (Fig. 114). Copper introduction caused a 25 nm hypsochromic shift in the absorption signal at 475 nm with the concomitant appearance of a new absorption peak at 650 nm along with a colorimetric change in the reaction solution from brown to green. The ligand–copper titration yielded three clear isosbestic points at 311, 387 and 530 nm, which confirm the formation of the resulting complex. The titration graph gave the information about the 2![[thin space (1/6-em)]](https://www.rsc.org/images/entities/char_2009.gif) :
:![[thin space (1/6-em)]](https://www.rsc.org/images/entities/char_2009.gif) 1 ligand–copper binding stoichiometry, which was further supported by the FT-IR and NMR titration experiment. The ligand exhibited an association constant value of 1.5 × 10⁴ M−1 and a precisely low detection limit of 1.0 × 10⁻⁷ M for copper monitoring. The colorimetric response of the ligand toward copper binding was further employed to generate the test kit for visual copper detection in real samples.
1 ligand–copper binding stoichiometry, which was further supported by the FT-IR and NMR titration experiment. The ligand exhibited an association constant value of 1.5 × 10⁴ M−1 and a precisely low detection limit of 1.0 × 10⁻⁷ M for copper monitoring. The colorimetric response of the ligand toward copper binding was further employed to generate the test kit for visual copper detection in real samples.
2.29. Hydrazinecarbothioamide-based Cu2+ sensor
Azath et al.193 reported 7-aminoflavone modified β-cyclodextrin with a hydrazinecarbothioamide linker 139 (Fig. 115) for selective copper detection. The sensor exhibited absorption signals at 206, 266 and 304 nm in pure water. Copper addition caused a 13 nm hypsochromic shift in the absorption signal at 266 nm along with a decrease in the signal intensity with the concomitant appearance of a new signal at 340 nm. The clear isosbestic point in the UV-visible titration of the ligand with the copper ions at 323 nm confirmed the simple one-step transformation from the sensor to the copper complex. This response of the sensor was found to be selective in comparison to the various competing ionic additions. Similarly, copper addition caused a significant fluorescence quenching of the emission signal at 481 nm when it was excited at 320 nm, whereas a negligible response was observed for the other metal ions. The fluorescence titration graph gave the 1![[thin space (1/6-em)]](https://www.rsc.org/images/entities/char_2009.gif) :
:![[thin space (1/6-em)]](https://www.rsc.org/images/entities/char_2009.gif) 1 sensor–copper binding stoichiometry, and the binding constant values were calculated to be 6000 M−1. Moreover, the probe was further employed to determine its response toward the amino acid sensation and it displayed satisfactory results.
1 sensor–copper binding stoichiometry, and the binding constant values were calculated to be 6000 M−1. Moreover, the probe was further employed to determine its response toward the amino acid sensation and it displayed satisfactory results.
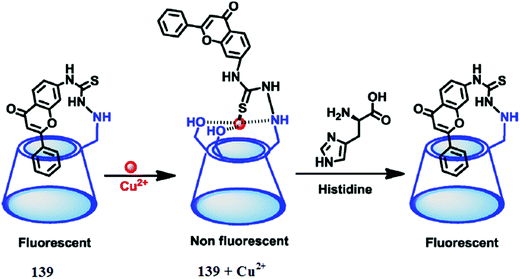 | ||
| Fig. 115 Schematic of sensor 139 and the proposed complexation mechanism toward Cu2+ and L-histidine. | ||
2.30. Urea/thiourea-based Cu2+ sensors
Maity et al.194 reported the urea/thiourea-based ligands 140 and 141 (Fig. 116) for selective copper detection. Ligand 140 exhibited a UV-visible absorption signal at 365 nm, which remained unchanged or slightly changed upon the addition of various competitive ions. Copper addition caused significant changes in the absorption signal with a constant decrease in the bands at 365 nm and the concomitant emergence of a new absorption band at 450 nm along with a colorimetric change in the reaction solution from light-green to primrose yellow. The titration experiment of receptor 140 with copper ions revealed clear isosbestic points at 390 nm, indicating the formation of a ligand–metal complex. However, an increase in copper concentration up to 5 equivalents led to a characteristic new band emerging at 535 nm along with a decrease in the signal at 450 nm and a further colorimetric change in the solution from primrose yellow to pink, whereas the copper concentration beyond 5 equivalents had no prominent effect on the absorption spectra. Similarly, receptor 141 exhibited an absorption signal at 395 nm, which showed a large red-shift of 541 nm and the emergence of a new signal at 936 nm along with an absorption band at 535 nm and a colorimetric change in the reaction solution from light-green to purple upon 2 equivalents copper additions. The absorption signal intensity centered at 535 and 936 nm became saturated upon 5 equivalents copper addition. The Job's plot indicates the 1![[thin space (1/6-em)]](https://www.rsc.org/images/entities/char_2009.gif) :
:![[thin space (1/6-em)]](https://www.rsc.org/images/entities/char_2009.gif) 2 ligand–copper complexation stoichiometries, which were further assisted by the mass spectrometry analysis. Ligand 141 showed an association constant of 13.63 M−1, and this high value of association constant and the significant changes in the absorption spectra along with the colorimetric change suggest the efficient binding affinity of the receptor toward copper binding.
2 ligand–copper complexation stoichiometries, which were further assisted by the mass spectrometry analysis. Ligand 141 showed an association constant of 13.63 M−1, and this high value of association constant and the significant changes in the absorption spectra along with the colorimetric change suggest the efficient binding affinity of the receptor toward copper binding.
 | ||
| Fig. 116 Chemical structure of receptors 140 and 141 along with the proposed ligand–metal complexation mechanism. | ||
2.31. Pyrrole-based Cu2+ sensor
Kaur et al.195 reported a fluorescent probe based on a diketopyrrolopyrrole alkyne conjugate structure 143 (Fig. 117) for the selective detection of Hg2+/Cu2+. The probe was pink colored in the absence of metallic species, whereas Hg2+ addition caused a colorimetric change in the reaction solution from pink to blue. Interestingly, the copper addition decolorized the pink color probe solution by turning it colorless. The ligand exhibited UV-visible absorption signals at 316, 377, 399, 542, and 582 nm, whereas Hg2+ addition caused a decrease in the absorption signal of the probe along with an increase in the intensity at 341 and 422 nm and a 41 nm bathochromic shift in the band at 582 nm. The titration experiment revealed four isosbestic points at 320, 361, 447 and 596 nm, confirming the reaction of the ligand with the mercury ions. In contrast, copper addition caused a decrease in the absorption signals at 316, 377, 399, 542 and 582 nm along with an increase in the new absorption signals at 274, 440, and 690 and the emergence of clear isosbestic points at 293, 453, and 611 nm. The receptor exhibited the 1![[thin space (1/6-em)]](https://www.rsc.org/images/entities/char_2009.gif) :
:![[thin space (1/6-em)]](https://www.rsc.org/images/entities/char_2009.gif) 2 binding stoichiometry with the copper ion, and the precisely low values of the detection limits, i.e., 1.3 × 10⁻⁷ M. Similarly, probe 143 exhibited a fluorescence emission signal at 603 nm when it was excited at 530 nm. Hg2+/Cu2+ addition caused a significant decrease in the emission signal intensity at 603 nm along with a detectable color change under a UV lamp or fluorescence microscope. From the fluorescence titration graph, the binding constant of the receptor toward copper ions was calculated to be 106 M−1. Mechanistic insight was obtained through the electronic spectral measurement, FT-IR, NMR and mass spectrometry analysis. The proposed sensing mechanisms are given in Fig. 117.
2 binding stoichiometry with the copper ion, and the precisely low values of the detection limits, i.e., 1.3 × 10⁻⁷ M. Similarly, probe 143 exhibited a fluorescence emission signal at 603 nm when it was excited at 530 nm. Hg2+/Cu2+ addition caused a significant decrease in the emission signal intensity at 603 nm along with a detectable color change under a UV lamp or fluorescence microscope. From the fluorescence titration graph, the binding constant of the receptor toward copper ions was calculated to be 106 M−1. Mechanistic insight was obtained through the electronic spectral measurement, FT-IR, NMR and mass spectrometry analysis. The proposed sensing mechanisms are given in Fig. 117.
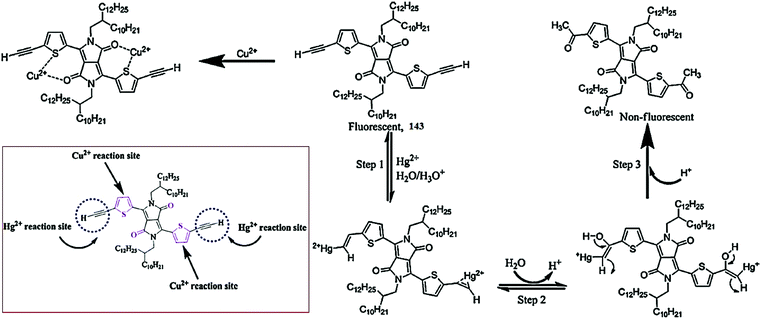 | ||
| Fig. 117 Chemical structure of receptor 143 and the proposed metal sensing mechanism; inset describes the reaction site inside the receptor. | ||
2.32. Aldazine-based Cu2+ sensors
Narayanaswamy et al.196 reported the novel aldazine-based colorimetric and fluorescence chemosensors 144 and 145 (Fig. 118) for Cu2+ and Fe3+. Receptor 144 was pale yellow and exhibited an absorption signal at 425 nm. Copper addition caused a colorimetric change in the reaction solution from pale yellow to purple and caused a 120 nm bathochromic shift in the spectral band at 425 nm to its new position at 545 nm. Receptor 145 showed a selective colorimetric change in the reaction solution from yellow to violet along with a 130 nm bathochromic shift upon ferric ion addition. There was no such response for a number of the competing ionic species. The titration graphs were used to determine the 1![[thin space (1/6-em)]](https://www.rsc.org/images/entities/char_2009.gif) :
:![[thin space (1/6-em)]](https://www.rsc.org/images/entities/char_2009.gif) 1 ligand–metal binding stoichiometry utilizing the continuous variation method, and the results were consistent with the FT-IR and mass spectrometry analysis data. Receptors 144 and 145 showed association constant values of 6.62 and 6.34 for the Cu2+ and Fe3+, respectively. The detection limits of both the receptors (144 and 145) were found to be 9.8 × 10⁻⁷ and 9.5 × 10⁻⁶ M, respectively, at 5 μM ligand concentration. Similarly, ligand 144 showed a fluorescence emission signal at 478 nm when it was excited at 425 nm, whereas receptor 145 exhibited an emission band at 497 nm when the excitation slit was fixed at 445 nm. Copper addition in the former case and ferric ion addition in the latter case caused a drastic fluorescence quenching, which was supposed to be due to the formation of the resulting complex. The fluorescence response of sensor 145 was found to be reversible on cysteine addition as assessed by the recovery of the original color as well as the spectral response.
1 ligand–metal binding stoichiometry utilizing the continuous variation method, and the results were consistent with the FT-IR and mass spectrometry analysis data. Receptors 144 and 145 showed association constant values of 6.62 and 6.34 for the Cu2+ and Fe3+, respectively. The detection limits of both the receptors (144 and 145) were found to be 9.8 × 10⁻⁷ and 9.5 × 10⁻⁶ M, respectively, at 5 μM ligand concentration. Similarly, ligand 144 showed a fluorescence emission signal at 478 nm when it was excited at 425 nm, whereas receptor 145 exhibited an emission band at 497 nm when the excitation slit was fixed at 445 nm. Copper addition in the former case and ferric ion addition in the latter case caused a drastic fluorescence quenching, which was supposed to be due to the formation of the resulting complex. The fluorescence response of sensor 145 was found to be reversible on cysteine addition as assessed by the recovery of the original color as well as the spectral response.
2.33. Iridium(III) complex-based Cu2+ sensors
Lu et al.197 reported a luminescent biscyclometalated iridium(III) complex 146 (Fig. 119) for selective copper recognition. The receptor exhibited an absorption signal in the wavelength region shorter than 350 nm along with a weaker absorption shoulder in the range of 350–450 nm. Similarly, the ligand showed a bright yellow phosphorescent emission around 593 nm when it was excited at 400 nm. Copper and mercury ion addition led to the appearance of a new band around 318 nm, wherein the intensity of the band induced by mercury was less than that from copper ions. Similarly, copper ions significantly quenched the fluorescence emission signal intensity, whereas the quenching efficiency of the mercury ions was much lower in comparison to the copper ions, and the other metal ions did not exhibit such behavior. The UV-visible titration of the ligand with progressive copper additions caused the emergence of an absorption signal at 318 nm along with a clear isosbestic point at 301 nm, suggesting the equilibrium between the receptor and receptor–copper complex. The titration graph clearly supported the 1![[thin space (1/6-em)]](https://www.rsc.org/images/entities/char_2009.gif) :
:![[thin space (1/6-em)]](https://www.rsc.org/images/entities/char_2009.gif) 1 receptor–copper binding stoichiometry with binding constant values of (1.43 ± 0.33) × 107 M−1. Further mechanistic insight was obtained through the fluorescence titration graph as well as mass spectrometry analysis. The ligand behaved reversibly on tetrabutylammonium iodide addition, which immediately restored the emission to the original level of the receptor, while further copper addition again quenched the emission signal. This switching process was probably due to the reduction of Cu2+ into CuI to regenerate the original receptor. Due to the low energy emission signal by the ligand complexed with the iridium ion, this type of receptor exhibited a unique character in the field of the analytical detection of hazardous analytes.
1 receptor–copper binding stoichiometry with binding constant values of (1.43 ± 0.33) × 107 M−1. Further mechanistic insight was obtained through the fluorescence titration graph as well as mass spectrometry analysis. The ligand behaved reversibly on tetrabutylammonium iodide addition, which immediately restored the emission to the original level of the receptor, while further copper addition again quenched the emission signal. This switching process was probably due to the reduction of Cu2+ into CuI to regenerate the original receptor. Due to the low energy emission signal by the ligand complexed with the iridium ion, this type of receptor exhibited a unique character in the field of the analytical detection of hazardous analytes.
Wang et al.198 reported the synthesis and application of a series of novel cyclometalated iridium(III) complexes 147–149 (Fig. 120) bearing a rhodamine-linked NˆN ligand for copper detection. Copper addition caused a remarkable colorimetric change in the reaction solution along with the emergence of a new absorption band at 555 nm corresponding to the copper-induced conformational changes in the receptor. The detection limits of receptors 147–149 toward the copper ions were estimated to be 4.5, 5.2 and 4.9 nM, respectively. The titration graph yielded the maximum intensity at 50% mole fraction, suggesting the 1![[thin space (1/6-em)]](https://www.rsc.org/images/entities/char_2009.gif) :
:![[thin space (1/6-em)]](https://www.rsc.org/images/entities/char_2009.gif) 1 receptor–copper complexation stoichiometry. The receptors were further employed for copper detection in the real-life water samples from different sources and gave satisfactory results.
1 receptor–copper complexation stoichiometry. The receptors were further employed for copper detection in the real-life water samples from different sources and gave satisfactory results.
2.34. Pseudo-crown-based Cu2+ sensor
Goswami et al.199 reported the pseudo-crown-based fluorescent receptor containing a naphthalene moiety 150 (Fig. 121) for copper detection. The receptor exhibited a strong absorption band at 294 nm, a characteristic signal for the naphthalene moiety. Copper addition caused a continuous decrease in the absorption signal at 294 nm along with the emergence of an isosbestic point at 324 nm, indicating the formation of a complex between the receptor and copper ions. The titration graph gave the 1![[thin space (1/6-em)]](https://www.rsc.org/images/entities/char_2009.gif) :
:![[thin space (1/6-em)]](https://www.rsc.org/images/entities/char_2009.gif) 1 receptor–copper binding stoichiometry, and the association constant of the receptor toward the copper ions was calculated to be 8.96 × 10⁵. Similarly, copper addition caused a decrease in the fluorescence emission signal intensity at 348 nm with the concomitant appearance of new emission band at 403 nm, which suggested complexation between the host and guest molecule.
1 receptor–copper binding stoichiometry, and the association constant of the receptor toward the copper ions was calculated to be 8.96 × 10⁵. Similarly, copper addition caused a decrease in the fluorescence emission signal intensity at 348 nm with the concomitant appearance of new emission band at 403 nm, which suggested complexation between the host and guest molecule.
2.35. Squaraine-based Cu2+ sensor
Wang et al.200 reported the squaraine-based receptor 151 (Fig. 122) functionalized with 2-picolyl units as a selective chemosensor for copper ions. The probe solution was pink and copper addition caused a drastic color change from pink to blue with this colorimetric change being selective upon copper addition. The competitive metal ions did not exhibit such a response on addition to the probe solution. This property of the sensor can be employed for the naked eye copper detection with a sensitivity of 3 μM. This colorimetric response of the probe–copper complex could be reversed on EDTA addition, suggesting that sensor 151 could function as a chemosensor for copper recognition. The probe showed the UV-visible absorption signal at 514 nm, and copper addition caused a 161 nm red-shift in the spectrum, while there was no spectral shift with the addition of the competitive ions. The probe absorption band at 514 nm declined gradually with the concomitant appearance of new absorption signal at 675 nm along with the clear isosbestic point at 565 nm on successive copper additions. The 1![[thin space (1/6-em)]](https://www.rsc.org/images/entities/char_2009.gif) :
:![[thin space (1/6-em)]](https://www.rsc.org/images/entities/char_2009.gif) 1 receptor–copper binding stoichiometry was calculated from the Job's curve utilizing the titration graph and the stability constant was calculated to be 1.9 × 10⁶ M−1. The 1
1 receptor–copper binding stoichiometry was calculated from the Job's curve utilizing the titration graph and the stability constant was calculated to be 1.9 × 10⁶ M−1. The 1![[thin space (1/6-em)]](https://www.rsc.org/images/entities/char_2009.gif) :
:![[thin space (1/6-em)]](https://www.rsc.org/images/entities/char_2009.gif) 1 binding mode was further supported by mass spectrometry analysis.
1 binding mode was further supported by mass spectrometry analysis.
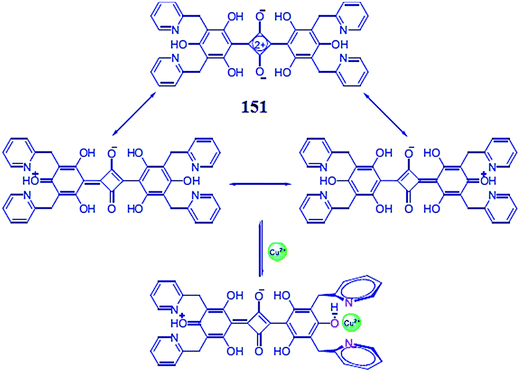 | ||
| Fig. 122 Chemical structure of receptor 151 and the proposed charge-localized mechanism of copper sensing. | ||
2.36. Rhodamine-based Cu2+ sensors
Banerjee et al.201 reported new chemosensors 152 (Fig. 123) for the selective and sensitive determination of Cu2+ and CN− ions in the pure aqueous media. The receptor alone was colorless and did not show any significant UV-visible absorption band or fluorescence emission band in the absence of copper ions. However, copper addition caused a significant enhancement in the fluorescence emission signal intensity from 577 to 583 nm along with a colorimetric change in the reaction solution, and this fluorescence increase was found to be selective in comparison to the competing species, except for Fe3+ and Hg2+, which caused a slight enhancement in the emission signal intensity. Similarly, there was significant enhancement in the UV-visible absorption signal intensity at 560 nm upon copper addition into the receptor solution. These colorimetric as well as optical changes in the receptor solution induced by copper ions could be used as a tool to detect the copper level in aqueous solutions and biological samples. The highly emissive pink color receptor–copper complex became colorless and non-emissive upon cyanide addition and this behavior was found to appear in a ratiometric way depending on the quantitative cyanide ion addition, suggesting that this behavior of the ligand–metal complex could be further employed for the simultaneous detection of cyanide ion. The detection limit of the sensor toward copper ions was found to be 2 μmol L−1, whereas the detection limit of the ligand–copper complex for cyanide ions was calculated to be <1 μmol L−1 (0.06 ppm).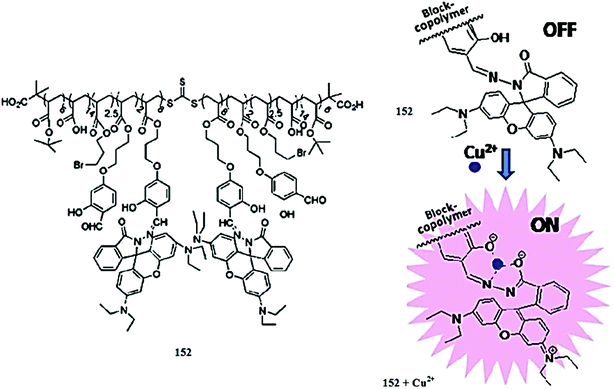 | ||
| Fig. 123 Structure of block copolymer 152 and copper-induced conformational changes in the receptor. | ||
Zhou et al.202 reported a new rhodamine-based derivative bearing a pyrene group 153 (Fig. 124) as a ratiometric and “off–on” chemosensor for Cu2+. In the fluorescence titration experiment, probe 153 displayed clear ratiometric and “off–on” fluorescence changes on copper ion addition when excited at 520 nm. On increasing the copper ion concentration, there was a significant decrease in the emission signal intensity at 424 nm with the emergence of a new emission signal at 575 nm and a clear isoemissive point at 558 nm, and this spectral shift was attributed to be due to copper-induced ring opening of the rhodamine spirolactam moiety. Similarly, there were significant changes in the absorption signal intensity, position, and colorimetric change in the reaction solution upon the progressive addition of copper ions into the ligand 153 solution. 7 equivalents copper addition brought about a decrease in the absorption signal intensity at 424 nm, whereas an increase in the absorption signal intensity occurred at 356 and 557 nm with a colorimetric change in the reaction solution from primrose yellow to pink. The appearance of three isosbestic points at 377, 491, and 584 nm indicate the presence of single species. The nonlinear fitting analysis from the titration curve and the Job's curve indicated the 1![[thin space (1/6-em)]](https://www.rsc.org/images/entities/char_2009.gif) :
:![[thin space (1/6-em)]](https://www.rsc.org/images/entities/char_2009.gif) 1 ligand–copper binding stoichiometry. Furthermore, the association constant for the ligand toward copper was calculated by the Benesi–Hildebrand equation to be 2.5 × 10⁴ M−1. Ligand 153 acted as a reversible sensor toward copper ions as assessed by the addition of EDTA solution into the ligand–metal complex solution, which turned the solution color back to the original as well as returning the original signal of the probe.
1 ligand–copper binding stoichiometry. Furthermore, the association constant for the ligand toward copper was calculated by the Benesi–Hildebrand equation to be 2.5 × 10⁴ M−1. Ligand 153 acted as a reversible sensor toward copper ions as assessed by the addition of EDTA solution into the ligand–metal complex solution, which turned the solution color back to the original as well as returning the original signal of the probe.
Kar et al.203 reported a new indole-functionalized rhodamine derivative 154 (Fig. 125) for specific copper detection. Ligand 154 exhibited an absorption signal with the maximum absorption intensity at 324 nm, which was attributed to be due to the intramolecular charge transfer. Copper introduction into the probe 154 solution triggered a near-infrared absorption signal with the absorption maxima at 702 nm along with a hump in the visible region near 557 nm, turning the reaction solution from colorless to blue. A further increase in copper concentration caused a gradual increase in the absorption signal at 557 nm, further turning the solution color from blue to pink. These significant changes in the absorption signal along with the colorimetric change in the reaction solution on copper addition in comparison to a number of the competing species show that it can be utilized as a selective sensor for copper detection with an appreciable sensitivity of 3.6 ppb. The 1![[thin space (1/6-em)]](https://www.rsc.org/images/entities/char_2009.gif) :
:![[thin space (1/6-em)]](https://www.rsc.org/images/entities/char_2009.gif) 1 ligand–metal binding stoichiometry was calculated by the method of continuous variation utilizing the UV-visible absorption titration changes at 702 nm, and the binding constant was determined by the Benesi–Hildebrand equation as 1.71 × 10⁴ M−1. Further mechanistic insight was obtained through the fluorescence titration experiment and mass spectrometry analysis. Ligand 154 exhibited a negligible fluorescence emission signal when it was excited at 495 nm, confirming the existence of the rhodamine moiety in the spirolactam conformation. 5 equivalents copper addition triggered the new emission signal at 580 nm with a 600-fold enhancement in the emission intensity, confirming the conformational changes in the receptor on copper binding, whereas competitive metallic additions did not bring about such changes in the emission signal, thus suggesting the appreciable selectivity of the reported sensor toward copper ions. The ligand behaved reversibly on sulfide ion addition, as found by the regeneration of the original spectral data for the ligand, as well as the colorimetric change reverting back to the original one. An MTT assay was performed to determine the availability of the chemosensor for intracellular copper detection, which showed the decisive cell viability of sensor 159 toward live cells, and the safest dose of the ligand for the bioimaging experiment was 15 μM. The appearance of bright red fluorescence from the live cells upon incubation of the cells with the ligand and copper ions suggest the practical applicability of sensor 154 toward copper detection inside biological media, as assessed by utilizing the HeLa cell lines.
1 ligand–metal binding stoichiometry was calculated by the method of continuous variation utilizing the UV-visible absorption titration changes at 702 nm, and the binding constant was determined by the Benesi–Hildebrand equation as 1.71 × 10⁴ M−1. Further mechanistic insight was obtained through the fluorescence titration experiment and mass spectrometry analysis. Ligand 154 exhibited a negligible fluorescence emission signal when it was excited at 495 nm, confirming the existence of the rhodamine moiety in the spirolactam conformation. 5 equivalents copper addition triggered the new emission signal at 580 nm with a 600-fold enhancement in the emission intensity, confirming the conformational changes in the receptor on copper binding, whereas competitive metallic additions did not bring about such changes in the emission signal, thus suggesting the appreciable selectivity of the reported sensor toward copper ions. The ligand behaved reversibly on sulfide ion addition, as found by the regeneration of the original spectral data for the ligand, as well as the colorimetric change reverting back to the original one. An MTT assay was performed to determine the availability of the chemosensor for intracellular copper detection, which showed the decisive cell viability of sensor 159 toward live cells, and the safest dose of the ligand for the bioimaging experiment was 15 μM. The appearance of bright red fluorescence from the live cells upon incubation of the cells with the ligand and copper ions suggest the practical applicability of sensor 154 toward copper detection inside biological media, as assessed by utilizing the HeLa cell lines.
Guo et al.204 reported a novel selective fluorescent chemosensor based on rhodamine B derivative 155 (Fig. 126) for the selective detection of Cu2+ and S2− in an aqueous buffer solution. The ligand alone is colorless and exhibited no absorption signal beyond 500 nm; while on copper addition, an intense signal at 556 nm appeared, but there was no such signal with a number of other competing species, except for with ferric ions, which showed a low intensity absorption signal at 555 nm. On UV-visible titration of the ligand with copper ions, a ratiometric increase in the absorption signal intensity at 555 nm and a slight increase in the new signal intensity at 401 nm were observed. Copper addition brought about a strong colorimetric change in the colorless solution, which is one of the advantageous features of the receptor for naked eye detection. This titration experiment was utilized for the stoichiometry calculation, which revealed the 1![[thin space (1/6-em)]](https://www.rsc.org/images/entities/char_2009.gif) :
:![[thin space (1/6-em)]](https://www.rsc.org/images/entities/char_2009.gif) 1 ligand–metal binding stoichiometry, as determined by plotting the Job's curve. Furthermore, the association constant was calculated by the Benesi–Hildebrand equation as 6.47 × 10⁴ M−1. Further mechanistic insight was obtained from the mass spectrometry analysis and DFT calculation. Similarly, copper introduction caused a drastic jump in the fluorescence emission signal at 572 when it was excited at 530 nm and this fluorescence emission signal underwent a slight red-shift from 572 to 581 nm on successive copper additions, giving the linear relationship with linearly dependent coefficient values of 0.9910. Using the titration experiment, a 2.43 × 10⁻⁸ mol L−1 detection limit of the receptor toward copper ions was calculated, which is quite low for practical applicability. However, the ligand–copper complex solution reverted to the original non-emissive scaffold along with a colorimetric change in the complex solution from pink to colorless upon sulfide addition, and these experimental facts suggest the reversible tendency of the receptor upon sulfide ion addition.
1 ligand–metal binding stoichiometry, as determined by plotting the Job's curve. Furthermore, the association constant was calculated by the Benesi–Hildebrand equation as 6.47 × 10⁴ M−1. Further mechanistic insight was obtained from the mass spectrometry analysis and DFT calculation. Similarly, copper introduction caused a drastic jump in the fluorescence emission signal at 572 when it was excited at 530 nm and this fluorescence emission signal underwent a slight red-shift from 572 to 581 nm on successive copper additions, giving the linear relationship with linearly dependent coefficient values of 0.9910. Using the titration experiment, a 2.43 × 10⁻⁸ mol L−1 detection limit of the receptor toward copper ions was calculated, which is quite low for practical applicability. However, the ligand–copper complex solution reverted to the original non-emissive scaffold along with a colorimetric change in the complex solution from pink to colorless upon sulfide addition, and these experimental facts suggest the reversible tendency of the receptor upon sulfide ion addition.
Mi et al.205 reported a multi-responsive sensor 156 (Fig. 127) based on rhodamine derivatives for the selective detection of copper ions. Probe 156 alone was colorless and did not show any absorption signal in the range of 500–560 nm; however, copper addition caused the emergence of a new absorption band centered at 555 nm along with the colorimetric change in the reaction solution from colorless to pink. The absorption intensity at 555 nm increased ratiometrically depending on the copper concentration, whereas the competitive metal ions did not exhibit such a response with the receptor. Similarly, copper addition triggered an intense emission band at 575 nm when it was excited at 530 nm. There was no such band in the probe solution without copper addition. These characteristic changes in the receptor solution upon copper binding suggest the efficient binding affinity of copper with probe 156. The 2![[thin space (1/6-em)]](https://www.rsc.org/images/entities/char_2009.gif) :
:![[thin space (1/6-em)]](https://www.rsc.org/images/entities/char_2009.gif) 1 ligand–copper binding stoichiometry was calculated by the method of continuous variation utilizing the titration graph, while the association constant was calculated by the Benesi–Hildebrand equation as 4.65 × 10⁷ M−1. The 2 nM detection sensitivity of the sensor toward copper detection was determined, which was low sufficient to administer the reported material among the best chemosensors. The ligand behaved reversibly on the addition of EDTA as assessed by the recovery of the original properties of the probe along with turning the solution color from pink to colorless, suggesting the engagement of the liberated copper ions with EDTA and recovery of receptor 156. This reversible character of the ligand can be further employed for the integration of logic gates.
1 ligand–copper binding stoichiometry was calculated by the method of continuous variation utilizing the titration graph, while the association constant was calculated by the Benesi–Hildebrand equation as 4.65 × 10⁷ M−1. The 2 nM detection sensitivity of the sensor toward copper detection was determined, which was low sufficient to administer the reported material among the best chemosensors. The ligand behaved reversibly on the addition of EDTA as assessed by the recovery of the original properties of the probe along with turning the solution color from pink to colorless, suggesting the engagement of the liberated copper ions with EDTA and recovery of receptor 156. This reversible character of the ligand can be further employed for the integration of logic gates.
 | ||
| Fig. 127 Chemical structure of receptor 156 and schematic of the fluorescence copper sensing mechanism. | ||
Ma et al.206 reported a ‘‘turn-on’’ fluorescence probe 157 (Fig. 128) for Cu2+ detection. Probe 157 could be completely solubilized in pure aqueous solution and did not shown any absorption or emission signal due to the existence of the rhodamine skeleton in the spirolactam conformation. However, copper introduction triggered a fluorescence emission signal intensity centered at 560 nm when it was excited at 520 nm, together with a ratiometric increase in the fluorescence emission signal intensity along with a colorimetric change in the reaction solution. Similarly, the receptor showed a specificity toward copper ions over the competitive ions, as there was no such fluorescence enhancement or colorimetric response observed on treating the probe with the competing species. The probe exhibited a linear relationship with the increasing copper concentration with excellent sensitivity toward the copper detection, exhibiting a detection limit of 12 μg L−1.
Liu et al.207 reported a new rhodamine B-based dual-function chromo- and fluorogenic probe 158 (Fig. 129) for Cu2+ and ClO−. The ligand 158 solution was colorless and exhibited no prominent absorption signal above 500 nm, whereas copper introduction caused the emergence of a new absorption signal at 565 nm along with a colorimetric change in the reaction solution. The absorption intensity at 565 nm increased ratiometrically depending on the concentration of the added copper ions, suggesting the concentration-dependent response of the receptor toward the copper ions. The association constant for Cu2+ was estimated to be 3.9 × 10⁵ M−1 using the Benesi–Hildebrand equation, and the 1![[thin space (1/6-em)]](https://www.rsc.org/images/entities/char_2009.gif) :
:![[thin space (1/6-em)]](https://www.rsc.org/images/entities/char_2009.gif) 1 ligand–metal binding stoichiometry was found from the Job's curve and from the mass spectrometry analysis. Similarly, there was no fluorescence emission signal by the probe due to existence of rhodamine in the spirolactam conformation, while copper addition triggered a new emission band at 582 nm, and a linear increase in the emission intensity of the signal centered at 582 nm was observed on the ratiometric addition of copper ions into the receptor solution when the excitation wavelength was fixed at 540 nm. By using the fluorescence titration graph, the association constant of the probe toward the copper ions was found to be 1.79 × 10⁶ M−1, whereas the method of continuous variation suggested the 1
1 ligand–metal binding stoichiometry was found from the Job's curve and from the mass spectrometry analysis. Similarly, there was no fluorescence emission signal by the probe due to existence of rhodamine in the spirolactam conformation, while copper addition triggered a new emission band at 582 nm, and a linear increase in the emission intensity of the signal centered at 582 nm was observed on the ratiometric addition of copper ions into the receptor solution when the excitation wavelength was fixed at 540 nm. By using the fluorescence titration graph, the association constant of the probe toward the copper ions was found to be 1.79 × 10⁶ M−1, whereas the method of continuous variation suggested the 1![[thin space (1/6-em)]](https://www.rsc.org/images/entities/char_2009.gif) :
:![[thin space (1/6-em)]](https://www.rsc.org/images/entities/char_2009.gif) 1 ligand–metal binding stoichiometry. This fluorescence as well the colorimetric response of the receptor was found to be specific only upon copper addition in comparison to the various competing metallic ions. However, upon ClO− addition, there was also a colorimetric change in the reaction solution as well as the emergence of a new emission band at 558 nm when it was excited at 515 nm, and these changes in the probe solution on ClO− addition were assigned to the decomposition of the receptor to the rhodamine molecules. This is another application of the reported sensor for the dual channel detection of the cations and anions via different operating mechanism with a sensitivity of 1 nM.
1 ligand–metal binding stoichiometry. This fluorescence as well the colorimetric response of the receptor was found to be specific only upon copper addition in comparison to the various competing metallic ions. However, upon ClO− addition, there was also a colorimetric change in the reaction solution as well as the emergence of a new emission band at 558 nm when it was excited at 515 nm, and these changes in the probe solution on ClO− addition were assigned to the decomposition of the receptor to the rhodamine molecules. This is another application of the reported sensor for the dual channel detection of the cations and anions via different operating mechanism with a sensitivity of 1 nM.
 | ||
| Fig. 129 Chemical structure of receptor 158 and the proposed operating mechanism toward the ionic species. | ||
Georgiev et al.208 reported a novel fluorescence sensing system based on rhodamine 6G and 1,8-naphthalimide fluorophores 159 (Fig. 130). The probe alone exhibited an absorption band in the range of 420–440 nm, which was the characteristic absorption for the 1,8-naphthalimide chromophore, whereas there was no absorption from the rhodamine backbone due to its existence in the spirolactam non-emissive conformation. The probe was acid sensitive and showed an absorption band at 530 nm in the acidic media below pH 5. Similarly, the probe exhibited a weak emission band in the range of 480–700 nm, showing the emission maxima at 539 nm when it was excited at 420 nm. However, the probe exhibited a strong fluorescence emission signal on the addition of Cu2+ and Hg2+ along with a colorimetric change in the reaction solution, whereas a negligible emission signal appeared in the presence of lead ion. Furthermore, the lead-induced emission band was negligible compared to that of Cu2+ and Hg2+ and there was no such emissive or colorimetric response in the probe solution with the various competing species. The limit of detection of the probe toward copper ions was calculated to be 5 × 10⁻⁷ mol L−1. Similarly, mercury introduction caused the emergence of a new emission band at 555 nm along with a decrease in the intensity of the 1,8-naphthalimide signal centered at 420 nm, indicating the Hg2+-induced FRET process. The limit of detection of the probe toward mercury ions was calculated to be 9 × 10⁻⁸ mol L−1 utilizing the titration graph. The 1![[thin space (1/6-em)]](https://www.rsc.org/images/entities/char_2009.gif) :
:![[thin space (1/6-em)]](https://www.rsc.org/images/entities/char_2009.gif) 1 ligand–metal binding stoichiometry was calculated by the method of continuous variation. The proposed binding models are shown in Fig. 130. The excellent optical properties of the probe upon treatment with the protons and Cu2+ and Hg2+ ions make this material suitable to execute “OR” and “INHIBIT” logic gates.
1 ligand–metal binding stoichiometry was calculated by the method of continuous variation. The proposed binding models are shown in Fig. 130. The excellent optical properties of the probe upon treatment with the protons and Cu2+ and Hg2+ ions make this material suitable to execute “OR” and “INHIBIT” logic gates.
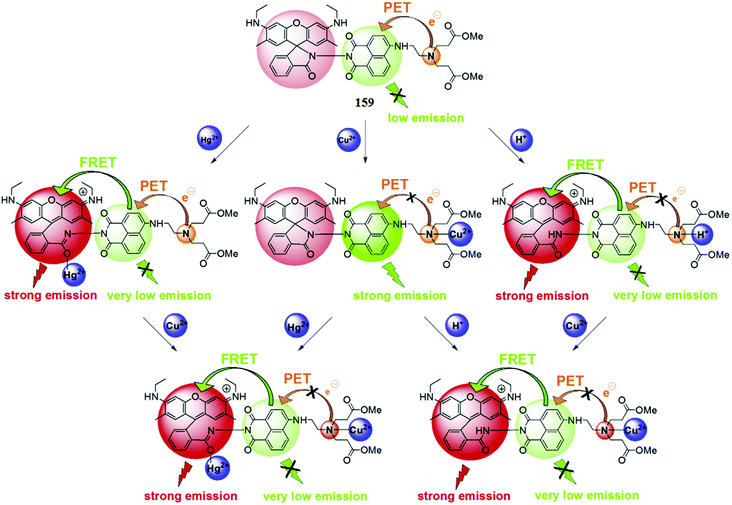 | ||
| Fig. 130 Chemical structure of receptor 159 and the fluorescence changes of the ligand solution in the presence of 2 equivalents of protons, 1 equivalent of Cu2+, and 1 equivalent of Hg2+. | ||
Wang et al.209 reported a rhodamine B-based receptor 160 (Fig. 131) for selective copper detection. Ligand 160 was colorless and exhibited a negligible absorption signal at 500 nm in the absence of metal ions, whereas copper addition triggered a new absorption band centered at 557 nm along with a colorimetric change in the reaction solution, thus revealing the complexation tendency of the receptor toward copper ions. The ratiometric absorption signal increase at 557 nm was utilized to determine the ligand–copper complexation stoichiometry, and the Job's plot clearly reflected the 1![[thin space (1/6-em)]](https://www.rsc.org/images/entities/char_2009.gif) :
:![[thin space (1/6-em)]](https://www.rsc.org/images/entities/char_2009.gif) 2 complex formation, which was further assisted by the mass spectrometry analysis. Similarly, copper induced the increase in the fluorescence emission signal intensity at 580 nm, whereas the competitive ions showed a negligible effect on introduction to the ligand solution. EDTA addition caused a decrease in the absorption and florescence emission signal intensity along with turning the reaction solution from pink to colorless. This suggests the EDTA-induced reversibility of the receptor.
2 complex formation, which was further assisted by the mass spectrometry analysis. Similarly, copper induced the increase in the fluorescence emission signal intensity at 580 nm, whereas the competitive ions showed a negligible effect on introduction to the ligand solution. EDTA addition caused a decrease in the absorption and florescence emission signal intensity along with turning the reaction solution from pink to colorless. This suggests the EDTA-induced reversibility of the receptor.
Wang et al.210 reported rhodamine-based reversible chemosensor 161 (Fig. 132) for selective copper detection. The receptor 161 exhibited an absorption band at 388 nm but no absorption above 500 nm, confirming the existence of rhodamine in the spirolactam conformation. However, copper addition caused a significant increase in the absorption signal at 388 nm along with the emergence of a new absorption band at 500 nm and a change in the reaction solution from colorless to pink. The linear increase in the absorption signals on titration of the probe solution with the copper ion was used to determine the 1![[thin space (1/6-em)]](https://www.rsc.org/images/entities/char_2009.gif) :
:![[thin space (1/6-em)]](https://www.rsc.org/images/entities/char_2009.gif) 1 ligand–copper complexation stoichiometry. The probe showed a fluorescence emission signal at 512 nm when it was excited at 386 nm, whereas copper addition caused a decrease in the emission band at 512 nm with a concomitant blue-shift up to 12 nm along with the appearance of a new emission band at 548 nm, which was completely quenched on 5 equivalents copper addition. However, upon excitation at 512 nm, the florescence emission band at 548 nm increased in intensity upon successive copper additions, which was attributed to the rhodamine spirolactam ring-opening process, whereas on adjusting the excitation slit at 386 nm, there was quenching of both emission signals on the increasing copper ion concentration. The ligand behaved reversibly on the addition of the EDTA solution, as assessed by the increase in the emission signal intensity at 512 nm on increasing EDTA concentration along with the colorimetric change in the reaction solution. The liberated copper form complex with the EDTA to recover the ligand.
1 ligand–copper complexation stoichiometry. The probe showed a fluorescence emission signal at 512 nm when it was excited at 386 nm, whereas copper addition caused a decrease in the emission band at 512 nm with a concomitant blue-shift up to 12 nm along with the appearance of a new emission band at 548 nm, which was completely quenched on 5 equivalents copper addition. However, upon excitation at 512 nm, the florescence emission band at 548 nm increased in intensity upon successive copper additions, which was attributed to the rhodamine spirolactam ring-opening process, whereas on adjusting the excitation slit at 386 nm, there was quenching of both emission signals on the increasing copper ion concentration. The ligand behaved reversibly on the addition of the EDTA solution, as assessed by the increase in the emission signal intensity at 512 nm on increasing EDTA concentration along with the colorimetric change in the reaction solution. The liberated copper form complex with the EDTA to recover the ligand.
Saleem et al.211 reported a rhodamine-based chemosensor 162 (Fig. 133) for selective copper detection. The probe was colorless and non-emissive, whereas copper addition triggered an absorption signal at 560 nm and a fluorescence emission signal at 596 nm along with a colorimetric change in the reaction solution from colorless to pink. A ratiometric fluorescence and absorption response was observed by the receptor on copper addition, whereas the various other competing species did not exhibit such a response on mixing with the probe solution. The fluorescence titration experiment was utilized to determine the sensitivity of the receptor, which was calculated to be 1.6 × 10⁻⁷ mol L−1. Further mechanistic insight was obtained from the optical measurement and mass spectrometry analysis. For practical applicability, the probe was further utilized in the bioimaging experiment, and the appearance of a bright red fluorescence from the live cells without any deformation suggested the potential applicability of the reported probe toward live cells employing the HeLa cells line.
Tang et al.212 reported a new rhodamine–benzothiazole conjugated colorimetric sensor 163 (Fig. 134) for copper detection. The ligand alone exhibited an absorption band at 368 nm, a characteristic signal for the benzothiazole moiety. Copper addition triggered new absorption bands at 420 and 556 nm with a concomitant decrease in the first absorption band at 368 nm along with a colorimetric change in the reaction solution from colorless to pink. The addition of Fe3+ and Co2+ brought slight changes in the absorption signal but the variation was negligible in comparison to the copper ion, reflecting the selective tendency of the receptor toward copper binding. The titration of the ligand with copper ions greatly enhanced the newly formed bands at 420 and 556 nm with a continuous decrease in the absorption band at 368 nm, suggesting the ratiometric copper detection ability of the sensor. From the titration profile, the association constant and detection limit were calculated to be 1.01 × 10⁶ M−1 and 6.89 × 10⁻⁶ M. The Job's plot indicated the 1![[thin space (1/6-em)]](https://www.rsc.org/images/entities/char_2009.gif) :
:![[thin space (1/6-em)]](https://www.rsc.org/images/entities/char_2009.gif) 1 ligand–copper binding stoichiometry, which was further supported by the mass spectrometry analysis. The ligand behaved reversibly on sulfide ion addition, as assessed by the successive decrease in the absorption signal intensity, thus revealing the liberation of copper from the complex to regenerate the receptor.
1 ligand–copper binding stoichiometry, which was further supported by the mass spectrometry analysis. The ligand behaved reversibly on sulfide ion addition, as assessed by the successive decrease in the absorption signal intensity, thus revealing the liberation of copper from the complex to regenerate the receptor.
Gao et al.213 reported the salicylaldehyde derivative 164 (Fig. 135) for selective copper detection. The addition of copper ions induced the significant appearance of new absorption bands at 420 and 555 nm along with a colorimetric change in the reaction solution from light yellow to sanguine. Similarly, receptor 164 exhibited a strong fluorescence emission band at 551 nm when it was excited at 400 nm, whereas copper addition caused a drastic fluorescence quenching and a colorimetric change in the reaction solution from green to colorless under a UV lamp when illuminated at a higher wavelength. Furthermore, a 4 equivalents copper addition induced a 34 nm blue-shift in the signal at 551 nm. The ligand exhibited the 1![[thin space (1/6-em)]](https://www.rsc.org/images/entities/char_2009.gif) :
:![[thin space (1/6-em)]](https://www.rsc.org/images/entities/char_2009.gif) 1 binding stoichiometry found by the method of continuous variation. The detection limit was found to be 1.2 × 10⁻⁹ mol L−1. The appearance of green fluorescence from the cells incubated with ligand 164 and the disappearance of the green color on incubation of the ligand mixed cells with copper ions suggests the successful operating tendency of the receptor inside live cells, as tested by utilizing the HepG2 cells line under a confocal fluorescence microscope.
1 binding stoichiometry found by the method of continuous variation. The detection limit was found to be 1.2 × 10⁻⁹ mol L−1. The appearance of green fluorescence from the cells incubated with ligand 164 and the disappearance of the green color on incubation of the ligand mixed cells with copper ions suggests the successful operating tendency of the receptor inside live cells, as tested by utilizing the HepG2 cells line under a confocal fluorescence microscope.
Goswami et al.214 reported a new coumarin-containing rhodamine architecture 165 (Fig. 136) for selective copper detection in aqueous media. The sensor exhibited a new absorption signal at 540 nm upon copper addition along with a colorimetric change in the reaction solution from colorless to pink. The ligand showed a ratiometric enhancement in the UV-visible absorption signal depending on the copper ion concentration, and the titration graph suggested the 1![[thin space (1/6-em)]](https://www.rsc.org/images/entities/char_2009.gif) :
:![[thin space (1/6-em)]](https://www.rsc.org/images/entities/char_2009.gif) 1 ligand–copper binding stoichiometry, which was further confirmed by mass spectrometry analysis. The probe exhibited a considerably high association constant value of 4.06 × 10⁴ M−1 and a sensitivity of 2.3 μM toward copper ions. Similarly, the incremental addition of copper ions caused a progressive enhancement in the fluorescence emission signal intensity at 582 nm, suggesting the copper-induced conformational changes in the probe molecule. Moreover, the sensor behaved reversibly on EDTA addition by turning the colored solution back to colorless along with the fluorescence quenching, which permits the decomplexation process. The ligand exhibited precise cell permeability and an efficient viability toward live cells, as assessed in the bioimaging experiment utilizing HeLa cells under a confocal fluorescence microscope.
1 ligand–copper binding stoichiometry, which was further confirmed by mass spectrometry analysis. The probe exhibited a considerably high association constant value of 4.06 × 10⁴ M−1 and a sensitivity of 2.3 μM toward copper ions. Similarly, the incremental addition of copper ions caused a progressive enhancement in the fluorescence emission signal intensity at 582 nm, suggesting the copper-induced conformational changes in the probe molecule. Moreover, the sensor behaved reversibly on EDTA addition by turning the colored solution back to colorless along with the fluorescence quenching, which permits the decomplexation process. The ligand exhibited precise cell permeability and an efficient viability toward live cells, as assessed in the bioimaging experiment utilizing HeLa cells under a confocal fluorescence microscope.
Lee et al.215 reported rhodamine hydrazone derivatives 166–168 (Fig. 137) for selective copper and mercury detection. The receptor 166 exhibited a dramatic increase in the fluorescence emission signal intensity at 582 nm on mercury addition when it was excited at 544 nm, along with a turn-on colorimetric change in the reaction solution from colorless to pink. The receptor behaved irreversibly toward mercury ions, suggesting that 166 acted as a chemodosimeter for mercury ions, which was further confirmed by the mass spectrometry analysis. The ligand exhibited a detection limit and rate constant of 0.22 μM and 2.86 × 10⁻² L mol−1 s−1, respectively, as assessed by employing the UV-visible titration graph. Similarly, receptor 167 showed an enhancement in the UV-visible absorption signal at 558 nm on the incremental addition of mercury ions, as well as a fluorescence enhancement with a slight shift in the signal from 575 to 586 nm when it was excited at 550 nm. However, the detection limit of receptor 166 was much lower than for the dimeric analogue 167, which exhibited a detection limit of 22.6 μM. Interestingly, receptor 168 showed an enhancement in the UV-visible absorption signal intensity at 550.6 nm upon copper addition along with a colorimetric change in the reaction solution, and this behavior could be reversed by the addition of EDTA solution. These finding revealed that receptor 168 acted as a selective copper chemosensor in the mixed aqueous–organic media. The 1![[thin space (1/6-em)]](https://www.rsc.org/images/entities/char_2009.gif) :
:![[thin space (1/6-em)]](https://www.rsc.org/images/entities/char_2009.gif) 2 ligand–copper binding stoichiometry was calculated by the method of continuous variation; furthermore, the association constant was calculated to be 3.5 × 10¹⁰ M−2. Ligand 168 showed a detection limit of 0.15 μM for copper detection. The receptors were further applied in the bioimaging experiment and displayed satisfactory results for the intracellular metal detection utilizing HeLa cell lines under a confocal fluorescence microscope.
2 ligand–copper binding stoichiometry was calculated by the method of continuous variation; furthermore, the association constant was calculated to be 3.5 × 10¹⁰ M−2. Ligand 168 showed a detection limit of 0.15 μM for copper detection. The receptors were further applied in the bioimaging experiment and displayed satisfactory results for the intracellular metal detection utilizing HeLa cell lines under a confocal fluorescence microscope.
Chen et al.216 reported rhodamine derivatives 169 and 170 (Fig. 138) bearing binaphthyl group as selective copper sensors. Copper addition caused a great enhancement in the fluorescence emission signal intensity when it was excited at 530 nm along with a colorimetric change in the reaction solution from colorless to pink. The fluorescence titration experiment suggested a 1![[thin space (1/6-em)]](https://www.rsc.org/images/entities/char_2009.gif) :
:![[thin space (1/6-em)]](https://www.rsc.org/images/entities/char_2009.gif) 1 ligand–copper binding stoichiometry, which was further confirmed by the mass spectrometry analysis. The binding constant of receptor 169 toward copper ions was calculated to be 4.93. Similar fluorescence “turn-on” behavior was observed for receptor 170 upon copper addition at the same excitation wavelength of 530 nm, whereas the competing metallic ions did not obviously exhibit such a response. The 1
1 ligand–copper binding stoichiometry, which was further confirmed by the mass spectrometry analysis. The binding constant of receptor 169 toward copper ions was calculated to be 4.93. Similar fluorescence “turn-on” behavior was observed for receptor 170 upon copper addition at the same excitation wavelength of 530 nm, whereas the competing metallic ions did not obviously exhibit such a response. The 1![[thin space (1/6-em)]](https://www.rsc.org/images/entities/char_2009.gif) :
:![[thin space (1/6-em)]](https://www.rsc.org/images/entities/char_2009.gif) 2 ligand–copper binding stoichiometry was calculated by the method of continuous variation for receptor 170, and the results were consistent with the data obtained from the mass spectrometry analysis.
2 ligand–copper binding stoichiometry was calculated by the method of continuous variation for receptor 170, and the results were consistent with the data obtained from the mass spectrometry analysis.
2.37. Material-based copper sensors
Ghiaci et al.217 reported a Schiff base ligand 171 (Fig. 139) covalently linked onto the SiO2–Al2O3 mixed oxide as a new modifier of a carbon paste electrode for the highly sensitive voltammetry determination of copper(II). Copper addition caused a linear response in the concentration range of 3.4 × 10⁻¹⁰–3.3 × 10⁻⁷ mol L−1 and a precisely low detection limit of 1.8 × 10⁻¹⁰ mol L−1. The applicability of the sensor was assessed in a real sample analysis test utilizing distilled and tap water. The facile generation and high sensitivity of the sensor might be useful in environmental and biomedical analyses. | ||
| Fig. 139 Chemical structure of the Schiff base ligand 171 and the proposed copper complexation mechanism. | ||
Lee et al.218 reported a highly fluorescent surface-modified polyacrylonitrile nanoparticle 172 (Fig. 140) for selective Cu2+ sensing. The sensor exhibited a UV-visible absorption band at 260 nm and a fluorescence emission band at 410 nm when it was excited at 290 nm. Copper introduction caused considerable fluorescence quenching of the sensor, whereas other metallic ions did not influence the fluorescence properties of the sensor. The interaction between the nanoparticles and the copper ions was confirmed by the FT-IR spectral analysis. The fluorescence titration of the sensor with copper ions caused a continuous decrease in the emission signal along with a blue-shift from 410 to 370 nm. The quenched fluorescence of the sensor by the copper ions was recovered by the addition of the EDTA solution, thus confirming the reversible nature of the sensor, wherein the liberated copper ions form a complex with EDTA, resulting in the recovery of the original material. The appearance of blue fluorescence from the live cells on incubation with the sensor and an elimination of this fluorescence on copper addition revealed the successful operating ability of the sensor in biological media.
3. Iron ion sensors
Iron is probably the most important metal exploited by living organisms as it is involved in many metabolic pathways such as oxygen transportation, nerves signal conduction, cellular growth and tissue formation.219 Iron is an essential element for almost all living cells, including bacteria, and a necessary cofactor for many enzymes involved in a wide variety of physiological processes.220 However, unregulated amounts may cause or exacerbate damage to vital organs, resulting in progression in a disease state or cell apoptosis.221 Both iron deficiency and overload can induce various disorders. According to the U.S. Environmental Protection Agency (EPA), the maximum content of iron in drinking water is ∼5.357 μM.222 Iron transport in plasma is carried out by transferrin, which donates iron to cells through its interaction with a specific membrane receptor.223 The soluble transferrin receptor is a truncated form of the tissue receptor that circulates in serum as a complex of transferrin and its receptor, and its concentration rises with enhanced erythropoiesis and iron deficiency.224 The practical implications of these nonspecific effects on the efficacy of measuring the serum ferritin concentration to detect iron deficiency have not been fully investigated.225,226 Anemia is an extremely common problem in all age groups and populations.227,228 Moreover, in patients without anemia, iron deficiency still causes psychomotor and cognitive impairment, developmental delay and also induces an increase in susceptibility to infectious diseases and mortality.229 Hyposideraemic anemia is a common symptom of rheumatoid arthritis similar to iron deficiency anemia, with normal or low iron binding capacity.230 In contrast, the effects of significant iron ingestion, including cardiovascular collapse, alteration of mental status, gastrointestinal hemorrhage, and hepatic and renal failure, may be prevented or mitigated with prompt recognition and treatment.231 The indiscriminate use of oral iron may cause hemochromatosis or cell injury and a high frequency of gastrointestinal side effects.232 Iron overload in the liver may be due to a genetic disorder or multiple blood transfusions and chronic diseases such as increased absorption, myelodysplasia and thalassemia.233 Iron availability inside the body can be boosted under some pathologic conditions by releasing the intracellular iron; however, this high dose iron accumulation dramatically increases the host's susceptibility to a variety of opportunistic pathogens, including V. vulnificus.234To prevent these complications, it is imperative to establish specific and reliable biochemical markers to diagnose iron deficiency with sensitive and high specificity diagnostic algorithms.235 The development of a fluorescent chemosensor with optical feedback on iron levels is an immense exigency in order to prevent anemia.236–241 Herein, we summarize iron sensors with optical feedback of the binding with low level iron as well as those useful for imaging iron in the intracellular environment.
3.1. Rhodamine-based Fe3+ sensors
Zhang et al.242 reported a rhodamine-based “turn-on” fluorescent sensor 173 (Fig. 141) for Fe3+ detection in mixed aqueous–organic media as well as inside living cells. Ligand 173 was colorless and showed a very weak absorption signal at 561 nm. In the case of fluorescence measurement, the ligand 173 solution turned from colorless to red-orange with the emergence of a strong emission signal at 583 nm when it was excited at 510 nm. These characteristic changes of the ligand on binding with the ferric ion along with the colorimetric change revealed the applicability of probe 173 as an optical as well naked eye detection method for trace ferric ion detection. The 1![[thin space (1/6-em)]](https://www.rsc.org/images/entities/char_2009.gif) :
:![[thin space (1/6-em)]](https://www.rsc.org/images/entities/char_2009.gif) 1 stoichiometry of the ligand–metal complex was calculated from the Job's plot and the stability constant was obtained by the Benesi–Hildebrand equation as 2.3 × 10⁴ M−1. Bioimaging experiment suggested the practical applicability of ligand 173 for the detection of ferric ion levels in the biological sample, as assessed by utilizing living pig iliac artery endothelium cells. The high intensity red fluorescence appearance from the cells on incubation with the ligand and metal ions was an indication of the permeability and cell viability of probe 173 toward living cells.
1 stoichiometry of the ligand–metal complex was calculated from the Job's plot and the stability constant was obtained by the Benesi–Hildebrand equation as 2.3 × 10⁴ M−1. Bioimaging experiment suggested the practical applicability of ligand 173 for the detection of ferric ion levels in the biological sample, as assessed by utilizing living pig iliac artery endothelium cells. The high intensity red fluorescence appearance from the cells on incubation with the ligand and metal ions was an indication of the permeability and cell viability of probe 173 toward living cells.
Zhang et al.243 reported a rhodamine-based fluorescent sensor 174 (Fig. 142) for Fe3+ detection. Ligand 174 was colorless and exhibited no fluorescence. Upon the addition of ferric ions, it showed a significant enhancement in the absorption signal at 531 nm and an emission signal at 557 nm with a colorimetric change in the reaction solution for naked eye detection. Ligand 174 behaved selectively toward ferric ions in comparison to the various competitive ions. The 1![[thin space (1/6-em)]](https://www.rsc.org/images/entities/char_2009.gif) :
:![[thin space (1/6-em)]](https://www.rsc.org/images/entities/char_2009.gif) 1 complexation stoichiometric was exhibited by ligand 174 on binding with the ferric ions as found by the Job's method with a stability constant of 104. Further confirmation of the complexation mode was obtained from mass spectrometry analysis and the results were consistent with that obtained by the optical analysis. Sensor 174 can be applicable over a pH range of 5–9. Furthermore, ligand 174 possessed significant cell permeability toward live cells and low level cytotoxicity, as found from the bioimaging experiment utilizing HeLa cells and PC12 cells.
1 complexation stoichiometric was exhibited by ligand 174 on binding with the ferric ions as found by the Job's method with a stability constant of 104. Further confirmation of the complexation mode was obtained from mass spectrometry analysis and the results were consistent with that obtained by the optical analysis. Sensor 174 can be applicable over a pH range of 5–9. Furthermore, ligand 174 possessed significant cell permeability toward live cells and low level cytotoxicity, as found from the bioimaging experiment utilizing HeLa cells and PC12 cells.
Huang et al.244 introduced a rhodamine-based fluorescent chemosensor 175 (Fig. 143) for ferric ion detection. Ligand 175 showed a very weak absorption signal above 500 nm, whereas upon Fe3+ addition, a new absorption signal appeared at 532 nm with ratiometric enhancement in the absorption intensity and a colorimetric change of the reaction solution from colorless to pink for naked eye detection. Fe3+ induced optical response was selective in comparison to the various competitive ions. Similarly, in the case of fluorescence, 20 equivalents Fe3+ induced a 189-fold enhancement in the emission intensity at 559 nm with a quantum yield of 0.42 when it was excited at 505 nm. The 1![[thin space (1/6-em)]](https://www.rsc.org/images/entities/char_2009.gif) :
:![[thin space (1/6-em)]](https://www.rsc.org/images/entities/char_2009.gif) 1 binding mode of the ligand–metal adduct was found by the optical analysis and from the Job's curve. The ligand showed practical applicability to probe for ferric ion inside live cells, as found by the laser confocal fluorescence microscopy experiment utilizing EJ (lung cancer) cells. The overlay of fluorescence and PTS images revealed that the fluorescence signals are localized in the perinuclear area of the cytosol, indicating a subcellular distribution of Fe3+. The MCT experimental result indicated that sensor 175 had good cell-membrane permeability and allowed for the subcellular detection of Fe3+ in cytosol. Furthermore, an MTT assay was performed to assess the cytotoxicity of ligand 175 and showed the appreciable cell viability of the ligand, which could be reasonably employed to live cells.
1 binding mode of the ligand–metal adduct was found by the optical analysis and from the Job's curve. The ligand showed practical applicability to probe for ferric ion inside live cells, as found by the laser confocal fluorescence microscopy experiment utilizing EJ (lung cancer) cells. The overlay of fluorescence and PTS images revealed that the fluorescence signals are localized in the perinuclear area of the cytosol, indicating a subcellular distribution of Fe3+. The MCT experimental result indicated that sensor 175 had good cell-membrane permeability and allowed for the subcellular detection of Fe3+ in cytosol. Furthermore, an MTT assay was performed to assess the cytotoxicity of ligand 175 and showed the appreciable cell viability of the ligand, which could be reasonably employed to live cells.
Bao et al.245 reported a new fluorescent chemosensor based on a rhodamine B and pyrrole conjugate 176 (Fig. 144) for the selective detection of ferric ions against the various other metal ions. Ligand 176 was colorless and exhibited no absorption signal in the entire spectral range from 500 to 560 nm. Ferric ion addition induced a strong absorption band at 558 nm with a colorimetric change in the reaction solution from colorless to pink in the mixed aqueous–organic media. The Job's plot analysis revealed an approximate maximum absorption at a 0.5 mole fraction, which indicated a 1![[thin space (1/6-em)]](https://www.rsc.org/images/entities/char_2009.gif) :
:![[thin space (1/6-em)]](https://www.rsc.org/images/entities/char_2009.gif) 1 stoichiometry of the ligand–metal complex. The 1
1 stoichiometry of the ligand–metal complex. The 1![[thin space (1/6-em)]](https://www.rsc.org/images/entities/char_2009.gif) :
:![[thin space (1/6-em)]](https://www.rsc.org/images/entities/char_2009.gif) 1 stoichiometry was further assessed by the fluorescence titration experiment and by NMR, as well as by mass spectrometry analysis. Similarly, the non-emissive solution of ligand 176 became emissive with the maximum emission at 581 nm upon ferric ion addition when it was excited at 558 nm. On fluorescence titration of the ligand with ferric ions, a 150-fold enhancement in the emission intensity centered at 581 nm was observed, which was selective in comparison to the background metal ions. Sensor 176 showed a detection limit of 0.031 μM, which was quite low for practical environmental monitoring. Ligand 176 showed very good cell viability toward living cells, as found by the MTT assay, which was further employed for the bioimaging experiment utilizing L-02 cells. The appearance of red fluorescence from the live cells after incubation of the ligand mixed cells with the ferric ion exposed the potential applicability of the sensor 176 for the sensing of trace ferric levels in biological samples.
1 stoichiometry was further assessed by the fluorescence titration experiment and by NMR, as well as by mass spectrometry analysis. Similarly, the non-emissive solution of ligand 176 became emissive with the maximum emission at 581 nm upon ferric ion addition when it was excited at 558 nm. On fluorescence titration of the ligand with ferric ions, a 150-fold enhancement in the emission intensity centered at 581 nm was observed, which was selective in comparison to the background metal ions. Sensor 176 showed a detection limit of 0.031 μM, which was quite low for practical environmental monitoring. Ligand 176 showed very good cell viability toward living cells, as found by the MTT assay, which was further employed for the bioimaging experiment utilizing L-02 cells. The appearance of red fluorescence from the live cells after incubation of the ligand mixed cells with the ferric ion exposed the potential applicability of the sensor 176 for the sensing of trace ferric levels in biological samples.
Saleem et al.246 reported alanine-substituted rhodamine B derivative 177 (Fig. 145) for the micro-molar level detection of ferric ions in mixed aqueous–organic media as well as inside living cells. Probe 177 is colorless and non-emissive due to residing in the spirocyclic conformation, whereas ferric ion addition into the probe 177 solution triggered a tremendous increase in the fluorescence intensity at 599 nm. Moreover, increasing the ferric ion concentration led to the fluorescence intensity ratiometrically increasing. Similarly, there was no absorption signal in the entire 500–560 nm range by the probe solution, whereas there was a significant increase in the absorption intensity at 557 nm along with a colorimetric change of the solution, suggesting the utility of the probe as an iron reporting candidate with micro-molar level sensitivity. The fluorescence titration experiment yielded a good linear relationship with a higher value of linearly dependent coefficient factor, suggesting the 1![[thin space (1/6-em)]](https://www.rsc.org/images/entities/char_2009.gif) :
:![[thin space (1/6-em)]](https://www.rsc.org/images/entities/char_2009.gif) 1 stoichiometry of the ligand–metal complex. The 1
1 stoichiometry of the ligand–metal complex. The 1![[thin space (1/6-em)]](https://www.rsc.org/images/entities/char_2009.gif) :
:![[thin space (1/6-em)]](https://www.rsc.org/images/entities/char_2009.gif) 1 stoichiometry was further supported by mass spectrometry analysis. The selective tendency of the probe was assessed by a competitive ion experiment employing a variety of competing analytes. Probe 177 behaved reversibly on the addition of KCN into the probe solution, as found by the transformation of the colored solution back to colorless as well as due to the rapid quenching of the fluorescence emission intensity. The appreciable features of the probe were further utilized to trace the metal contamination inside intracellular media through testing in a bioimaging experiment utilizing two different cell lines, i.e., L-929 cells (mouse fibroblast cells) and BHK-21 cells (hamster kidney fibroblast). The appearance of red fluorescence in the intracellular environment suggested the discernible cell permeability of the probe for biological sample analysis. An MTT assay was performed to assess the cytotoxicity of probe 177 by using the BHK-21 and L-929 cells, and the results revealed the substantial viability of the probe toward living cells.
1 stoichiometry was further supported by mass spectrometry analysis. The selective tendency of the probe was assessed by a competitive ion experiment employing a variety of competing analytes. Probe 177 behaved reversibly on the addition of KCN into the probe solution, as found by the transformation of the colored solution back to colorless as well as due to the rapid quenching of the fluorescence emission intensity. The appreciable features of the probe were further utilized to trace the metal contamination inside intracellular media through testing in a bioimaging experiment utilizing two different cell lines, i.e., L-929 cells (mouse fibroblast cells) and BHK-21 cells (hamster kidney fibroblast). The appearance of red fluorescence in the intracellular environment suggested the discernible cell permeability of the probe for biological sample analysis. An MTT assay was performed to assess the cytotoxicity of probe 177 by using the BHK-21 and L-929 cells, and the results revealed the substantial viability of the probe toward living cells.
 | ||
| Fig. 145 Chemical structure of probe 177, proposed ligand–metal complexation mechanism, KCN-induced reversibility and bioimaging applications. | ||
Xie et al.247 reported a new fluorescent resonance energy transfer (FRET)-based fluorescent probe 178 (Fig. 146) containing a dansyl unit as a donor and rhodamine as an acceptor for selective recognition of ferric ions. Ligand 178 showed a maximum absorbance at 302 nm in the UV-visible absorption spectra and this signal was assigned to the dansyl group as rhodamine was still in the spirolactam conformation. Upon introduction of ferric ions into the probe solution, a new absorption band appeared at 578 nm, together with a constant increase in the absorption intensity on increasing ferric ion concentration along with turning the reaction solution from colorless to pink. This dramatic change in the absorption spectra as well as colorimetric change in the reaction solution were selective only for ferric ions, and thus could be employed for reporting ferric ions in the solution form. Similarly, probe 178 showed an emission band centered at 515 nm when it was excited at 380 nm, which was attributed to the fluorescence emitted from the dansyl energy-donor unit. However, Fe3+ addition significantly quenched the fluorescence emission intensity at 515 nm with the emergence of a new emission signal at 605 nm and an isoemissive point at 570 nm. These changes in the fluorescence emission spectra were assigned to the iron-induced ring opening of the rhodamine moiety. Probe 178 was capable of detecting ferric ions with 0.64 μM sensitivity. The probe exhibited a maximum emission intensity at 0.5 mole fraction in Job's method, suggesting the 1![[thin space (1/6-em)]](https://www.rsc.org/images/entities/char_2009.gif) :
:![[thin space (1/6-em)]](https://www.rsc.org/images/entities/char_2009.gif) 1 stoichiometry of the ligand–metal complex, and the association constant for Fe3+ binding in probe 178 was determined to be 1.74 × 10⁴ M−1 using the Benesi–Hildebrand equation.
1 stoichiometry of the ligand–metal complex, and the association constant for Fe3+ binding in probe 178 was determined to be 1.74 × 10⁴ M−1 using the Benesi–Hildebrand equation.
Rathinam et al.248 reported a simple and efficient method for the dual detection of Cu2+ and Fe3+ by the respective coordination of triazole–triazole and triazole–carbonate in aqueous media using bistriazole rhodamine B chemosensor 179 (Fig. 147). Probe 179 did not show any obvious absorption or emission bands as rhodamine exists in the spirocyclic conformation. Upon introduction of Fe3+ and Cu2+, the probe solution became colored as well as a new absorption band emerged at 560 nm and an emission band at ∼572–580 nm. This response of the probe was found to be selective toward only Fe3+/Cu2+, thus revealing the specific tendency of probe 179 toward these two metal ions. The probe solution was found to become saturated upon two equivalents of metal addition with a 20-fold enhancement of the emission signal in the case of Cu2+ and a 14-fold enhancement in the case of Fe3+. The probe was capable of detecting 5 ppm level of metal in the solution by employing its colorimetric response. The method of continuous variation revealed the 1![[thin space (1/6-em)]](https://www.rsc.org/images/entities/char_2009.gif) :
:![[thin space (1/6-em)]](https://www.rsc.org/images/entities/char_2009.gif) 1 stoichiometry of the resulting complex. Further mechanistic insight was obtained from the FT-IR analysis and NMR titration experiment on the progressive additions of the metal ions in the ligand solution. The probe solution became colorless following the addition of ethylene diamine with complete quenching of fluorescence of the ligand–metal complex solution, indicating the decomplexation of the adduct back to the original probe 179. Moreover, NO2− and CH3COO− caused fluorescence quenching as well as changed the color of the solution back to colorless, whereas there was no quenching observed in the case of the competitive anions. These observations suggest that these complexes can be employed as efficient and selective chromogenic reagents for anion sensing. In summary, the reported chemosensor might be of potential importance for the trace detection of biologically important cations and anions.
1 stoichiometry of the resulting complex. Further mechanistic insight was obtained from the FT-IR analysis and NMR titration experiment on the progressive additions of the metal ions in the ligand solution. The probe solution became colorless following the addition of ethylene diamine with complete quenching of fluorescence of the ligand–metal complex solution, indicating the decomplexation of the adduct back to the original probe 179. Moreover, NO2− and CH3COO− caused fluorescence quenching as well as changed the color of the solution back to colorless, whereas there was no quenching observed in the case of the competitive anions. These observations suggest that these complexes can be employed as efficient and selective chromogenic reagents for anion sensing. In summary, the reported chemosensor might be of potential importance for the trace detection of biologically important cations and anions.
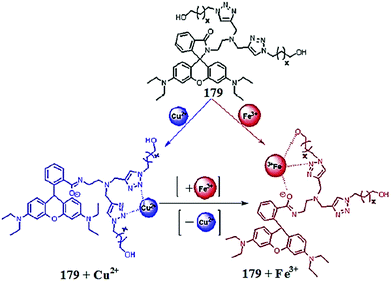 | ||
| Fig. 147 Chemical structure of the dual sensing probe 179 and the proposed ligand–metal complexation mechanism toward two different cations. | ||
Moon et al.249 reported a novel ferric ion-selective rhodamine-based fluorescent chemosensor containing the bis-aminoxy chain moiety 180 (Fig. 148). The ligand exhibited a very weak fluorescence band at 557 nm when it was excited at 500 nm. Introduction of ferric ions into the probe 180 solutions drastically increased the intensity of the emission signal at 557 nm. The emission intensity was found to increase ratiometrically upon the successive addition of ferric ions into the probe solution and becomes saturated after 5 equivalents Fe3+ additions. The method of continuous variations was used to determine the ligand–metal complex stoichiometry by employing the UV-visible and fluorescence titration spectra, which revealed the 1![[thin space (1/6-em)]](https://www.rsc.org/images/entities/char_2009.gif) :
:![[thin space (1/6-em)]](https://www.rsc.org/images/entities/char_2009.gif) 1 binding mode of the ligand with ferric ions. The binding constant was calculated by the Benesi–Hildebrand equation as 8 × 10⁴. Ligand 180 behaved as a reversible reporting material, as assessed by the introduction of cyanide ions. The selectivity of the sensor was found by the colorimetric response. Ligand 180 remained colorless in the presence of competing ions, except for ferric ions, which revealed the applicability of the ligand as a colorimetric sensor for ferric ion detection. This colorimetric response of the ligand–metal complex could be reversed by the addition of cyanide ions, which snatches the ferric ion from the complex by chelating it.
1 binding mode of the ligand with ferric ions. The binding constant was calculated by the Benesi–Hildebrand equation as 8 × 10⁴. Ligand 180 behaved as a reversible reporting material, as assessed by the introduction of cyanide ions. The selectivity of the sensor was found by the colorimetric response. Ligand 180 remained colorless in the presence of competing ions, except for ferric ions, which revealed the applicability of the ligand as a colorimetric sensor for ferric ion detection. This colorimetric response of the ligand–metal complex could be reversed by the addition of cyanide ions, which snatches the ferric ion from the complex by chelating it.
Weerasinghe et al.250 reported a new rhodamine-based dual sensor 181 (Fig. 149) for the selective recognition of Cu2+ and Fe3+. Ligand 181 exhibited a very weak fluorescence emission signal at 570 nm when it was excited at 520 nm as it predominantly exists in the spirolactam conformation. Similarly, there was no prominent absorption signal by ligand 181 in the absence of analytes, whereas 40 equivalents Cu2+ additions induced a new absorption band at 551 nm with a shoulder at 520 nm, indicating the conformational changes in the ligand molecule upon chelation with the Cu2+. Moreover, the addition of ferric ions also induced a new absorption band at 562 nm and a 180-fold enhancement in the absorption intensity. Both the metal ions induced an immediate color change of the ligand solution and this colorimetric change in the solution was an advantage for naked eye metal detection. The 1![[thin space (1/6-em)]](https://www.rsc.org/images/entities/char_2009.gif) :
:![[thin space (1/6-em)]](https://www.rsc.org/images/entities/char_2009.gif) 1 stoichiometry of the ligand–metal complex was observed by Job's methods with a binding constant value of 1.65 × 10³ M−1. Further mechanistic insight was obtained by the NMR titration experiment, which was found consistent with the optical data.
1 stoichiometry of the ligand–metal complex was observed by Job's methods with a binding constant value of 1.65 × 10³ M−1. Further mechanistic insight was obtained by the NMR titration experiment, which was found consistent with the optical data.
Zhang et al.251 reported 2-[3′,6′-bis(ethylamino)-2′,7′-dimethyl-3-oxospiro[1H-isoindole-1,9′-[9H]xanthen]-2-((2-aminoethyl) methyl)]phenol 182 (Fig. 150) as a fluorescent sensor for ferric ions. Probe 182 was colorless and non-emissive in the absence of the analyte. However, on ferric ion addition, there was a strong fluorescence enhancement at 554 nm along with a colorimetric change in the reaction solution from colorless to pink. A similar response was observed in the case of the UV-visible spectroscopy measurement by the appearance of a new absorption signal at 530 nm only on ferric ion addition, also with a significant colorimetric change in the reaction solution. These characteristic changes in the fluorescence emission spectrum and UV-visible absorption spectrum as well as the color change of the solution on ferric ion addition can be employed as a sensing scaffold for the trace detection of ferric ions. The 1![[thin space (1/6-em)]](https://www.rsc.org/images/entities/char_2009.gif) :
:![[thin space (1/6-em)]](https://www.rsc.org/images/entities/char_2009.gif) 1 stoichiometry of the ligand–metal complex was found by the continuous variation method. The binding constant for the ligand toward ferric ion was calculated to be 1.1 × 10⁴ using the Benesi–Hildebrand equation.
1 stoichiometry of the ligand–metal complex was found by the continuous variation method. The binding constant for the ligand toward ferric ion was calculated to be 1.1 × 10⁴ using the Benesi–Hildebrand equation.
Xu et al.252 reported a water-soluble FRET-based ratiometric sensor 183 (Fig. 151) for ferric ion detection by forming a supramolecular β-cyclodextrin/dye complex. The sensor was composed of dansyl-linked β-cyclodextrin (β CD-DNS) and adamantyl-linked spirolactam rhodamine (AD-SRhB), in which the dansyl moiety acts as the donor site, whereas the spirolactam rhodamine B derivative can act as an energy acceptor unit. The aqueous solution of the supramolecular complex was colorless and exhibited absorption signals at 330, 380 and 410 nm, which are characteristic absorption signals for the donor dansyl side, whereas the rhodamine unit remained silent due to its existence in the spirolactam conformation. Ferric ion addition into the probe solution caused the emergence of a new absorption signal at 560 nm along with a colorimetric change in the reaction solution from colorless to pink, as promoted by the ligand–metal complexation. Similarly, ligand 183 showed an emission signal at 530 nm when it was excited at 410 nm with a fluorescence quantum yield of 0.11. The introduction of ferric ions into the probe solution decreased the signal at 530 nm with the emergence of a new signal at 587 nm. A ratiometric enhancement in the emission signal intensity at 587 nm was observed on increasing the ferric ion concentration with the lowest Fe3+ detection ability being 1 μM. These characteristic changes in the absorption as well as in the emission spectra of the probe 183 solution along with the colorimetric change on ferric ion addition suggested its applicability as a sensitive ratiometric sensor for ferric ion detection.
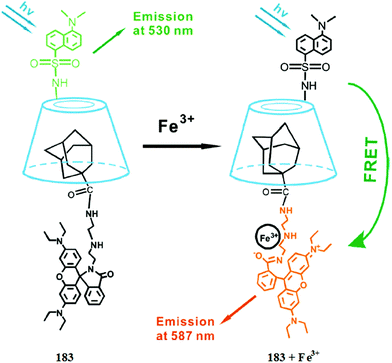 | ||
| Fig. 151 Formation of the AD-SRhB/β-CD-DNS supramolecular complex 183 and its FRET-based ratiometric sensing of ferric ions in aqueous media. | ||
3.2. Thiazole-based Fe3+ sensors
Nandre et al.253 reported an electronically active and spectral sensitive fluorescent “turn-on” chemosensor 184 (Fig. 152) for the sensitive and selective detection of ferric ions from an aqueous solution. Ligand 184 exhibited an absorption signal at 313 nm along with narrow bands at 271 nm. This reaction solution showed considerable variation in the absorption properties on 5 equivalents ferric ion addition. The high energy bands showed a blue-shift with the appearance of a new band between 350 and 425 nm, whereas the absorption signal at 313 completely disappeared. This red-shift signal was due to the extension in the electronic cloud triggered by the ligand complexation of the ferric ions. The ligand–metal titration experiment produced a clear isosbestic point at 328 nm, indicating the formation of a single complex species between ligand 184 and Fe3+. The limit of detection and the ferric ion quantification was calculated to be 0.10 and 0.32 μM, which are in line with the US EPA (0.3 mg L−1, 5.4 μM) limit in drinking water. The 1![[thin space (1/6-em)]](https://www.rsc.org/images/entities/char_2009.gif) :
:![[thin space (1/6-em)]](https://www.rsc.org/images/entities/char_2009.gif) 1 stoichiometry of the ligand–metal complex was calculated using Job's method, which was further assisted by the LC-MS analysis. The ligand behaved reversibly on treatment with EDTA solution, as indicated by the turn-off response. Ligand 184 showed no emission signal in the range from 440 to 690 nm, while Fe3+ addition significantly triggered a high intensity signal at 554 nm when it was excited at 314 nm. Furthermore, this occurred selectively in comparison to the various competing species. The binding constant for the ligand toward ferric ions was calculated by the Benesi–Hildebrand equation as ≈4 × 10⁴ M−1. From the fluorescence titration experiment, the limit of detection and the limit of quantification were found to be 0.74 and 2.23 nM, respectively. Furthermore, ligand 184 was successfully applied in the bioimaging experiment, utilizing two liver cell lines, i.e., HepG2 cells (human hepato cellular liver carcinoma cell line) and HL-7701 cells (human normal liver cell line), which showed a significant appearance of green fluorescence on ferric ion binding in the intracellular environment. These results showed that ligand 184 is cell-permeable and non-toxic toward live cells.
1 stoichiometry of the ligand–metal complex was calculated using Job's method, which was further assisted by the LC-MS analysis. The ligand behaved reversibly on treatment with EDTA solution, as indicated by the turn-off response. Ligand 184 showed no emission signal in the range from 440 to 690 nm, while Fe3+ addition significantly triggered a high intensity signal at 554 nm when it was excited at 314 nm. Furthermore, this occurred selectively in comparison to the various competing species. The binding constant for the ligand toward ferric ions was calculated by the Benesi–Hildebrand equation as ≈4 × 10⁴ M−1. From the fluorescence titration experiment, the limit of detection and the limit of quantification were found to be 0.74 and 2.23 nM, respectively. Furthermore, ligand 184 was successfully applied in the bioimaging experiment, utilizing two liver cell lines, i.e., HepG2 cells (human hepato cellular liver carcinoma cell line) and HL-7701 cells (human normal liver cell line), which showed a significant appearance of green fluorescence on ferric ion binding in the intracellular environment. These results showed that ligand 184 is cell-permeable and non-toxic toward live cells.
Bhardwaj et al.254 reported benzothiazole-based multifunctional chemosensors (185 and 186, Fig. 153) for the recognition of Fe3+ as well as both hydrogen bond donor and acceptor binding sites for the oxyanion HSO4−. The sensors 185 and 186 exhibited absorption bands at 310 and 370 nm, respectively, due to imine linkage. The ligand detection ability toward several metal ions was investigated by recording the UV-visible absorption and fluorescence emission spectra on incubating with several ionic species, but this yielded no prominent effect on the spectra except for Fe3+. The addition of Fe3+ to ligand 185 caused a fluorescence enhancement at 440 nm when it was excited at 310 nm, whereas ligand 186 showed fluorescence intensity quenching at 440 nm upon ferric ion addition when it was excited at 370 nm. In the case of the fluorescence titration experiment, a ratiometric increase in the fluorescence emission intensity at 440 nm was observed for ligand 185 on 0–20 μM ferric ion addition. The 1![[thin space (1/6-em)]](https://www.rsc.org/images/entities/char_2009.gif) :
:![[thin space (1/6-em)]](https://www.rsc.org/images/entities/char_2009.gif) 1 ligand–metal stoichiometry was found from the Job's curve as well as the appearance of prominent peaks for the ligand–metal complex in the mass spectrometry analysis. The association constant was calculated by the Benesi–Hildebrand equation as (2.9 ± 0.13) × 105 M−1, and the detection limit was determined to be 8.5 μM. Furthermore, the UV-visible absorption spectra of sensor 185 showed a shift in the band from 365 nm with clear isosbestic points at 345 and 395 nm upon treatment with HSO4−. Furthermore, this sensing was found to be selective against the various other anionic species, thus revealing the dual applicability of the sensor for cation as well as for anion detection. The ligand binds with the sulfate ions with a high value of association constant of (1.8 ± 0.05) × 102 M−1, whereas the detection limit for sulfate ions was calculated to be 5.4 μM. Further mechanistic insight was obtained from the optical titration experiment, NMR studies and computational analysis.
1 ligand–metal stoichiometry was found from the Job's curve as well as the appearance of prominent peaks for the ligand–metal complex in the mass spectrometry analysis. The association constant was calculated by the Benesi–Hildebrand equation as (2.9 ± 0.13) × 105 M−1, and the detection limit was determined to be 8.5 μM. Furthermore, the UV-visible absorption spectra of sensor 185 showed a shift in the band from 365 nm with clear isosbestic points at 345 and 395 nm upon treatment with HSO4−. Furthermore, this sensing was found to be selective against the various other anionic species, thus revealing the dual applicability of the sensor for cation as well as for anion detection. The ligand binds with the sulfate ions with a high value of association constant of (1.8 ± 0.05) × 102 M−1, whereas the detection limit for sulfate ions was calculated to be 5.4 μM. Further mechanistic insight was obtained from the optical titration experiment, NMR studies and computational analysis.
3.3. Benzimidazole-based Fe3+ sensor
Lee et al.255 reported a novel receptor with benzimidazole moieties in a tripodal framework 187 (Fig. 154) for specific ferric ion detection. Ligand 187 exhibited a fluorescence emission band at 415 nm on exciting at 361 nm. The addition of Cu2+ into the ligand 187 solution caused a significant increase in the emission intensity at 415 nm, whereas the addition of Fe3+ caused momentous quenching in the fluorescence emission spectrum at 415 nm. However, the other metal ions, including Ca2+, Mg2+, Co2+, Ni2+, Zn2+, and Ag+, did not show such a variation in the receptor solution under the same conditions. Receptor 187 behaved selectively toward Cu2+ and Fe3+, suggesting specific chelation with these two ionic species. In the fluorescence titration experiment of the receptor 187 solution with the Cu2+ addition, there was an increase in the emission signal intensity at 415 nm, whereas successive Fe3+ addition caused considerable quenching in the emission signal at 415 nm with a drastic enhancement in the intensity of the emission band at 470 nm, thus strongly suggesting the formation of a complex between receptor 187 and the respective metal ions. The receptor was found to detect a minimum Cu2+ level of 2.3 × 10⁻⁵ M, whereas for Fe3+, the minimum level was 2.1 × 10⁻⁵ M. The 1![[thin space (1/6-em)]](https://www.rsc.org/images/entities/char_2009.gif) :
:![[thin space (1/6-em)]](https://www.rsc.org/images/entities/char_2009.gif) 1 binding stoichiometry was assessed using Job's method and the binding constants were calculated by the Benesi–Hildebrand equation as (5.9 ± 0.1) × 103 M−1 for Cu2+ and (1.3 ± 0.1) × 103 M−1 for Fe3+.
1 binding stoichiometry was assessed using Job's method and the binding constants were calculated by the Benesi–Hildebrand equation as (5.9 ± 0.1) × 103 M−1 for Cu2+ and (1.3 ± 0.1) × 103 M−1 for Fe3+.
3.4. Triazole-based Fe3+ sensor
Saleem et al.256 reported a novel fluorogenic signaling probe 188 (Fig. 155) for the selective detection of ferric ions in mixed aqueous–organic media. Probe 188 exhibited a fluorescence emission signal at 478 nm, which decreased on the successive addition of ferric ions; furthermore, this response of the probe was selective in comparison to a number of the other competing species. A ratiometric fluorescence quenching was observed by probe 188 on increasing the ferric ion concentration with linearly dependent coefficient values of 0.9592. Moreover, in the case of the UV-visible absorption spectrum, the probe showed two absorption bands at 253 and 293 nm prior to ferric ion addition, whereas a significant shift in these signals and the appearance of a new red-shifted signal at 357 nm was observed on the addition of ferric ions into the probe solution. The probes behaved reversibly on the addition of ferric ions into the solution as assessed by the increase in the fluorescence intensity of the ligand solution upon treatment with potassium cyanide, and this behavior returned the complex back to the original molecule by the formation of a new complex between the released ferric ion and cyanide ion. The 1![[thin space (1/6-em)]](https://www.rsc.org/images/entities/char_2009.gif) :
:![[thin space (1/6-em)]](https://www.rsc.org/images/entities/char_2009.gif) 1 binding stoichiometry of the ligand–metal complex was observed by the continuous variation method, and the detection limit of the probe toward ferric ion detection was found by the 3σ per slope method as 1.1 × 10⁻⁷ M−1.
1 binding stoichiometry of the ligand–metal complex was observed by the continuous variation method, and the detection limit of the probe toward ferric ion detection was found by the 3σ per slope method as 1.1 × 10⁻⁷ M−1.
3.5. Pyrene-based Fe3+ sensors
Kumar et al.257 reported a thiacalix[4]arene-based fluorescent chemosensor 189 (Fig. 156) for the recognition of ferric ions in solutions and in living cells. Ligand 189 showed an absorption signal at 342 nm, which is a characteristic for pyrene. The addition of an increasing concentration of ferric ions brought about a ratiometric enhancement in the absorption signal at 342 nm, whereas there was no such increase in the absorption band in the presence of the competing ionic species. In the case of the fluorescence emission signal, significant fluorescence quenching was observed as induced by the ferric ions due to photoinduced electron transfer from the pyrene units to the carbonyl oxygen atoms, in which the electron density was diminished upon metal ion complexation, resulting in an “On–Off” response. The nonlinear regression analysis and the method of continuous variation suggested the 1![[thin space (1/6-em)]](https://www.rsc.org/images/entities/char_2009.gif) :
:![[thin space (1/6-em)]](https://www.rsc.org/images/entities/char_2009.gif) 1 binding stoichiometry of the ligand–metal complex with the binding constant value of 3.7 ± 0.05. These results revealed the applicability of the ligand for the detection of ferric ions in the mixed aqueous–organic media as well as inside live cells. The capability of ligand 189 for the detection of intracellular iron level was assessed in the bioimaging experiment using PC3 cells. The appearance of blue fluorescence from the cells suggests that the ligand is cell-permeable and viable for intracellular iron detection.
1 binding stoichiometry of the ligand–metal complex with the binding constant value of 3.7 ± 0.05. These results revealed the applicability of the ligand for the detection of ferric ions in the mixed aqueous–organic media as well as inside live cells. The capability of ligand 189 for the detection of intracellular iron level was assessed in the bioimaging experiment using PC3 cells. The appearance of blue fluorescence from the cells suggests that the ligand is cell-permeable and viable for intracellular iron detection.
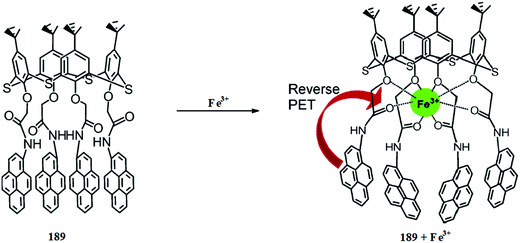 | ||
| Fig. 156 The binding modes of receptor 189 with Fe3+ ions through a reverse PET mechanism from pyrene to carbonyl oxygen atoms. | ||
Chung et al.258 reported a new pyrene-based chemosensor 190 (Fig. 157) for selective Fe3+ detection over a wide range of biologically and environmentally important metals ions. Chemosensor 190 showed an absorption band with the maximum intensity at 382 nm and a very weak fluorescence with a fluorescence quantum yield of 0.001, and this weak fluorescence was due to the fluorescence quenching by the photoinduced electron transfer from the electrons on the nitrogen atom to pyrene. On incubating the probe solution with the various metal ions, there was no observable change, except with ferric ions, which turned the solution from colorless to yellow, and this colorimetric change might be useful for Fe3+ detection using the naked eye. Moreover, upon Fe3+ addition, the probe absorption band at 382 nm gradually underwent a blue-shift with the maximum absorption at 363 nm. In the case of fluorescence spectroscopy, a new emission band appeared at 507 nm on titrating chemosensor 190 with Fe3+ and this emission band reached a maximum value on 4 equivalents Fe3+ additions with a 41-fold enhancement in the fluorescence quantum yield from 0.001 to 0.041. These characteristic changes in the absorption and emission as well as in the color of probe 190 upon ferric ion addition suggest that it could function as a chemosensor for ferric ions. The ligand–metal binding stoichiometry was determined by plotting the emission intensity at 507 nm against the mole fraction of the metal ions, which yielded the maximum intensity at 0.5 mole fraction values, suggesting the 1![[thin space (1/6-em)]](https://www.rsc.org/images/entities/char_2009.gif) :
:![[thin space (1/6-em)]](https://www.rsc.org/images/entities/char_2009.gif) 1 stoichiometry of the resulting complex with a binding constant value of 1.27 × 10⁴ M−1, as calculated from the Benesi–Hildebrand equation. The 1
1 stoichiometry of the resulting complex with a binding constant value of 1.27 × 10⁴ M−1, as calculated from the Benesi–Hildebrand equation. The 1![[thin space (1/6-em)]](https://www.rsc.org/images/entities/char_2009.gif) :
:![[thin space (1/6-em)]](https://www.rsc.org/images/entities/char_2009.gif) 1 stoichiometry of the ligand–metal complex was further supported by mass spectrometry analysis. Furthermore, the results of the NMR titration and FT-IR analysis were consistent with the results from the Job's plot analysis. The ligand was further employed in the cell imaging experiment using HeLa cells through a confocal fluorescence microscope. The significant appearance of green fluorescence from the cells after mixing with the ligand and ferric ions suggested the practical applicability of ligand 190 toward live cell imaging.
1 stoichiometry of the ligand–metal complex was further supported by mass spectrometry analysis. Furthermore, the results of the NMR titration and FT-IR analysis were consistent with the results from the Job's plot analysis. The ligand was further employed in the cell imaging experiment using HeLa cells through a confocal fluorescence microscope. The significant appearance of green fluorescence from the cells after mixing with the ligand and ferric ions suggested the practical applicability of ligand 190 toward live cell imaging.
3.6. Naphthalene-based Fe3+ sensors
Mitra et al.259 reported a new glucose-based C2-derivatized colorimetric chemosensor 191 (Fig. 158) by a one-step condensation of glucosamine and 2-hydroxy-1-naphthaldehyde for the recognition of transition metal ions. To determine the binding affinity of ligand 191 toward the transition metal ions, the colorimetric experiment was conducted by adding a 1![[thin space (1/6-em)]](https://www.rsc.org/images/entities/char_2009.gif) :
:![[thin space (1/6-em)]](https://www.rsc.org/images/entities/char_2009.gif) 1 ratio of the ligand and various metals ions. A visual color change from ligand 191 solution was observed on Fe3+, Fe2+ and Cu2+. The results showed equal sensitivity of ligand 191 toward Fe3+ and Fe2+. To further assess the specificity, a competitive ion experiment was conducted by adding M2+ solution into the ligand–Fe3+ and ligand–Fe2+ solution with Cu2+. The competitive ion experiment led to a continuous fading of the ligand–Fe2+ solution color, whereas no fading was observed in the case of the ligand–Fe3+. Further titrations were carried out between 191–Cu2+ and the other ions, which indicated that Cu2+ could still be recognized in the presence of other ions, except with Fe3+. Thus, in a methanolic solution, ligand 191 can clearly sense Fe2+ and Fe3+ largely and Cu2+ to a reasonable extent by simple visual color changes that can be noticed with the naked eye. However, in the presence of other ions, only Fe3+ can be sensed by 191. The naked eye can notice a visual color change in the ligand 191 solution, which becomes more precise in HEPES buffer (pH 7.2) as compared to in a methanol medium. Fe2+ and Fe3+ cause a great change in the absorption spectra by the appearance of a metal-induced absorption signal in the range of 300, 420 and 550 nm. The 2
1 ratio of the ligand and various metals ions. A visual color change from ligand 191 solution was observed on Fe3+, Fe2+ and Cu2+. The results showed equal sensitivity of ligand 191 toward Fe3+ and Fe2+. To further assess the specificity, a competitive ion experiment was conducted by adding M2+ solution into the ligand–Fe3+ and ligand–Fe2+ solution with Cu2+. The competitive ion experiment led to a continuous fading of the ligand–Fe2+ solution color, whereas no fading was observed in the case of the ligand–Fe3+. Further titrations were carried out between 191–Cu2+ and the other ions, which indicated that Cu2+ could still be recognized in the presence of other ions, except with Fe3+. Thus, in a methanolic solution, ligand 191 can clearly sense Fe2+ and Fe3+ largely and Cu2+ to a reasonable extent by simple visual color changes that can be noticed with the naked eye. However, in the presence of other ions, only Fe3+ can be sensed by 191. The naked eye can notice a visual color change in the ligand 191 solution, which becomes more precise in HEPES buffer (pH 7.2) as compared to in a methanol medium. Fe2+ and Fe3+ cause a great change in the absorption spectra by the appearance of a metal-induced absorption signal in the range of 300, 420 and 550 nm. The 2![[thin space (1/6-em)]](https://www.rsc.org/images/entities/char_2009.gif) :
:![[thin space (1/6-em)]](https://www.rsc.org/images/entities/char_2009.gif) 1 stoichiometry of the ligand–metal complex was found by the method of continuous variation as well as from the mass spectrometry analysis. The 2
1 stoichiometry of the ligand–metal complex was found by the method of continuous variation as well as from the mass spectrometry analysis. The 2![[thin space (1/6-em)]](https://www.rsc.org/images/entities/char_2009.gif) :
:![[thin space (1/6-em)]](https://www.rsc.org/images/entities/char_2009.gif) 1 stoichiometric complex formation was further supported by computational analysis. The minimum detection ability of ligand 191 toward Fe3+ was found to be 5 × 10⁻⁶ M, which is low enough for environmental monitoring.
1 stoichiometric complex formation was further supported by computational analysis. The minimum detection ability of ligand 191 toward Fe3+ was found to be 5 × 10⁻⁶ M, which is low enough for environmental monitoring.
Ghosh et al.260 reported a simple epoxy-based polymer 192 (Fig. 159) bearing 1-naphthylamine units as a fluorescent chemosensor for ferric ions. The probe 192 solution showed an absorption signal with the maximum intensity at 315 nm, which is a characteristic for 1-naphthylamine absorption. The introduction of various metal ions induced a hyperchromic shift in the spectrum, whereas the maximum hyperchromic shift was observed for ferric ion, thus clearly indicating the strong binding affinity of the ferric ion to ligand 192. In the case of fluorescence spectroscopy analysis, ligand 192 showed a strong fluorescence emission signal centered at 409 nm, whereas iron introduction caused a drastic quenching in this fluorescence band. Furthermore, the behavior of ligand 192 toward ferric ions was selective in comparison to the various other competing species. The “On–Off” response of ligand 192 upon fluorescence titration with ferric ions suggests that it can be employed as a fluorescence sensing material for its selective recognition ability toward ferric ions.
Marenco et al.261 reported N-phenyl-2-(2-hydroxynaphthalen-1-ylmethylene)hydrazine carbothioamide 193 (Fig. 160) as a fluorescent sensor for the determination of Fe3+ in aqueous solutions. The ligand exhibited a broad absorption band from 210 to 450 nm by the appearance of four main absorption signals with the maximum intensities at 210, 245, 320 and 370 nm. On excitation at 370 nm, probe 193 showed two emission bands at 425 and 485 nm. Iron addition caused a significant enhancement in both emission signals with a 104% increase in the signal intensity at 425 nm and a 194% increase in the signal intensity centered at 485 nm. This fluorescence enhancement was found to increase ratiometrically on increasing the ferric ion concentration in the probe solution. An excellent linear relationship was observed with a high value of linearly dependent coefficient values. The 1![[thin space (1/6-em)]](https://www.rsc.org/images/entities/char_2009.gif) :
:![[thin space (1/6-em)]](https://www.rsc.org/images/entities/char_2009.gif) 1 binding stoichiometry was observed for the ligand with metal ions, as calculated by the method of continuous variation, whereas the binding constant was calculated to be 4.56 by assuming the 1
1 binding stoichiometry was observed for the ligand with metal ions, as calculated by the method of continuous variation, whereas the binding constant was calculated to be 4.56 by assuming the 1![[thin space (1/6-em)]](https://www.rsc.org/images/entities/char_2009.gif) :
:![[thin space (1/6-em)]](https://www.rsc.org/images/entities/char_2009.gif) 1 complex. In short, the proposed “Off–On” sensor might be of potential use for ferric ion detection due to its high optical response and appreciable sensitivity.
1 complex. In short, the proposed “Off–On” sensor might be of potential use for ferric ion detection due to its high optical response and appreciable sensitivity.
Marenco et al.262 reported a simple fluorescent sensor 194 (Fig. 161) for the recognition of Fe3+ in a semi-aqueous solution at pH 7.0. Receptor 194 showed two main absorption bands at 280 and 475 nm, reflecting the aryl and naphthalene chromophores, respectively. Upon introduction of ferric ions into the probe solution, a significant blue-shift from 475 to 325 nm was observed along with a colorimetric change in the reaction solution from yellow to colorless, thus revealing the conformational changes in receptor 194 as induced by complexation with the ferric ion. The 1![[thin space (1/6-em)]](https://www.rsc.org/images/entities/char_2009.gif) :
:![[thin space (1/6-em)]](https://www.rsc.org/images/entities/char_2009.gif) 1 stoichiometry complex of the host–guest species was found by the method of continuous variation employing the spectral response of the ligand on iron addition and the calculated binding constant value was 4.01. Similarly, receptor 194 exhibited an emission signal at 507 nm when it was excited at 475 nm. However, treatment of this solution with the various other metal ions yielded no significant quenching response except for Fe3+ and Cu2+. The maximum quenching behavior was observed with the ferric ion of more than 90%, whereas 50% quenching was found as a result of Cu2+ addition. The fluorescence intensity of receptor 194 decreased ratiometrically upon increasing the concentration of the ferric ions, resulting in a good linear relationship with the good linearly dependent coefficient values, which further support the 1
1 stoichiometry complex of the host–guest species was found by the method of continuous variation employing the spectral response of the ligand on iron addition and the calculated binding constant value was 4.01. Similarly, receptor 194 exhibited an emission signal at 507 nm when it was excited at 475 nm. However, treatment of this solution with the various other metal ions yielded no significant quenching response except for Fe3+ and Cu2+. The maximum quenching behavior was observed with the ferric ion of more than 90%, whereas 50% quenching was found as a result of Cu2+ addition. The fluorescence intensity of receptor 194 decreased ratiometrically upon increasing the concentration of the ferric ions, resulting in a good linear relationship with the good linearly dependent coefficient values, which further support the 1![[thin space (1/6-em)]](https://www.rsc.org/images/entities/char_2009.gif) :
:![[thin space (1/6-em)]](https://www.rsc.org/images/entities/char_2009.gif) 1 ligand–metal binding stoichiometry.
1 ligand–metal binding stoichiometry.
Singh et al.263 reported a simple fluorescent sensor 195 (Fig. 162) for the determination of Fe3+ in 100% aqueous solution at pH 7.0. Sensor 195 displayed an absorption signal with the maximum absorption intensity at 280 nm, a characteristics signal for the naphthalene chromophore. On excitation at 280 nm, sensor 195 showed an intense emission signal at 335 nm for naphthalene emission. The ligand was found to be sensitive toward the pH of the reaction solution, and the emission was found to switch “On” with the decreasing pH of the solution. From the sigmoidal profile of the ligand optical spectra, 1![[thin space (1/6-em)]](https://www.rsc.org/images/entities/char_2009.gif) :
:![[thin space (1/6-em)]](https://www.rsc.org/images/entities/char_2009.gif) 1 binding stoichiometry was observed between sensor 195 and the protons. However, at neutral pH conditions, the ligand binding affinity was investigated using various metallic species, including Na+, K+, Mg2+, Ca2+, Co2+, and Zn2+, which exhibited a slight change in the ligand signal, suggesting a weak binding interaction between the ligand and these metallic species. Interestingly, a significant quenching of more than 80% resulted on the addition of ferric ion in the ligand solution, whereas a lower quenching with a smaller magnitude of about 20% occurred on Cu2+ addition. Due to the paramagnetic nature of these metallic ions, they triggered the nonradiative deactivation process. This significant quenching behavior of the ligand toward Fe3+ can be used as a tool to determine the ferric ion level in the pure aqueous media. The fluorescence quenching of the ligand with iron ions yielded a good linearly dependent coefficient, suggesting a 1
1 binding stoichiometry was observed between sensor 195 and the protons. However, at neutral pH conditions, the ligand binding affinity was investigated using various metallic species, including Na+, K+, Mg2+, Ca2+, Co2+, and Zn2+, which exhibited a slight change in the ligand signal, suggesting a weak binding interaction between the ligand and these metallic species. Interestingly, a significant quenching of more than 80% resulted on the addition of ferric ion in the ligand solution, whereas a lower quenching with a smaller magnitude of about 20% occurred on Cu2+ addition. Due to the paramagnetic nature of these metallic ions, they triggered the nonradiative deactivation process. This significant quenching behavior of the ligand toward Fe3+ can be used as a tool to determine the ferric ion level in the pure aqueous media. The fluorescence quenching of the ligand with iron ions yielded a good linearly dependent coefficient, suggesting a 1![[thin space (1/6-em)]](https://www.rsc.org/images/entities/char_2009.gif) :
:![[thin space (1/6-em)]](https://www.rsc.org/images/entities/char_2009.gif) 1 stoichiometry of the host–guest material, which was further supported using the Stern–Volmer equation. The binding constant of the ligand toward ferric ions was calculated using the Benesi–Hildebrand equation as (7.6 ± 0.6) × 104 M−1, thus showing the considerably high binding affinity of ligand 195 toward ferric ions in comparison to copper ions and demonstrating that ligand 195 is capable of detecting ferric levels in the presence of equimolar amounts of copper ions.
1 stoichiometry of the host–guest material, which was further supported using the Stern–Volmer equation. The binding constant of the ligand toward ferric ions was calculated using the Benesi–Hildebrand equation as (7.6 ± 0.6) × 104 M−1, thus showing the considerably high binding affinity of ligand 195 toward ferric ions in comparison to copper ions and demonstrating that ligand 195 is capable of detecting ferric levels in the presence of equimolar amounts of copper ions.
3.7. Quinolone-based Fe3+ sensor
Li et al.264 reported a blue fluorescent polymer 196 (Fig. 163) with a quinoline derivative in the side chain for the detection of ferric ions by employing its fluorescence quenching response. The polymer solution exhibited an absorption band with the maximum intensity at 356 nm and a high intensity emission signal at 445 nm when excited at 356 nm. The metal detection ability of polymer 196 was evaluated by the introduction of a number of competing ionic species into the polymer solution, including Zn2+, Cu2+, Ni2+, Al3+, Mg2+, Co2+, Sn2+, Fe3+ and Mn2+, which showed different extents of quenching of the polymer emission band. Cu2+, Co2+ and Ni2+ showed a negligible influence on the fluorescence of the polymer, whereas a drastic quenching in the fluorescence of the polymer was observed on ferric ion addition along with an 8 nm red-shift in the spectrum, thus suggesting the selective tendency of the polymer toward iron detection. The relatively high value of the Stern–Volmer quenching constant (Ksv = 1.44 × 10⁴ M−1) indicates that this polymer has a high sensitivity for Fe3+ ions in comparison to the various other ionic species. The linear decrease in the fluorescence intensity triggered by the ferric ion reveals the sensitive and specific tendency of the resulting polymer material toward ferric ions in the pure aqueous media, pure organic media and mixed aqueous–organic media.3.8. Quinazolinone-based Fe3+ sensor
Yuan et al.265 reported a novel quinazolinone compound containing the quinazoline-fused moiety 197 (Fig. 164) as a fluorescence “Off–On” sensor for ferric ions. Ligand 197 exhibited a strong fluorescence emission signal when excited at 344 nm. However, ferric ion introduction caused a significant quenching of this signal. In the case of the fluorescence titration experiment with ferric ions, there was a ratiometric quenching in the emission signal intensity with a linear relationship between the fluorescence intensity and the metal concentration with good linearly dependent coefficient values of 0.9977. Under identical conditions, no obvious quenching phenomena were observed for a number of the competing ions, suggesting the specific tendency of ligand 197 toward the ferric ions. The 1![[thin space (1/6-em)]](https://www.rsc.org/images/entities/char_2009.gif) :
:![[thin space (1/6-em)]](https://www.rsc.org/images/entities/char_2009.gif) 1 ligand–metal binding stoichiometry was calculated using Job's method and the binding constant was calculated by the Benesi–Hildebrand equation as 6.89 × 10³.
1 ligand–metal binding stoichiometry was calculated using Job's method and the binding constant was calculated by the Benesi–Hildebrand equation as 6.89 × 10³.
3.9. Naphthalimide-based Fe3+ sensors
Li et al.266 reported a new Fe3+-selective “turn-on” chemosensor 198 (Fig. 165) based on coumarin and naphthalimide. Compound 198 showed a weak fluorescence emission signal when it was excited at 456 nm. However, on ferric ion addition, there was a sudden increase in the new emission band at 504 nm, which increased in intensity, depending on the ferric ion concentration. The fluorescence enhancement of the ligand solution continued to increase with the continuous addition of ferric ions into the reaction solution, suggesting the ratiometric response of the sensor toward the ferric ions. The 1![[thin space (1/6-em)]](https://www.rsc.org/images/entities/char_2009.gif) :
:![[thin space (1/6-em)]](https://www.rsc.org/images/entities/char_2009.gif) 1 stoichiometry of the ligand–metal complex was calculated from the Job's curve, and the association constant was found to be 2.589 ± 0.206 × 10³ M−1. Sensor 198 exhibited a precise sensitivity of 0.388 μM, which is quite low for practical applicability of the sensor for environmental monitoring of ferric ions.
1 stoichiometry of the ligand–metal complex was calculated from the Job's curve, and the association constant was found to be 2.589 ± 0.206 × 10³ M−1. Sensor 198 exhibited a precise sensitivity of 0.388 μM, which is quite low for practical applicability of the sensor for environmental monitoring of ferric ions.
Xu et al.267 described the fabrication and analytical characterization of fluorescence-based ferric ion-sensing glass slides by using the naphthalimide derivative 199 (Fig. 166) with a terminal double bond and copolymerized it with 2-hydroxyethyl methacrylate on the activated surface of glass slides by UV irradiation. The optode membrane displayed excitation and emission maxima at 408 and 521 nm in the absence of ferric ions, whereas the sequential addition of ferric ions caused a 98% quenching of the optode membrane fluorescence intensity and this quenching behavior revealed the applicability of the optode membrane as a good candidate for recognition of the ferric ion. Similarly, in the case of UV-visible absorption spectroscopy analysis, the optode membrane exhibited a broad absorption band around 408 nm, which is a characteristic absorption for 1,8-naphthalimide derivatives with an amino group connected at the 4-position of the naphthalene imide ring. Iron introduction caused a significant hyperchromic shift in the spectra, which was related to the conformational changes in the sensor on the iron binding. A linear relationship in the case of the fluorescence was observed on titration of the sensor with an increasing iron ion concentration with a good linearly dependent coefficient factor value (R = 0.9931), indicating the 1![[thin space (1/6-em)]](https://www.rsc.org/images/entities/char_2009.gif) :
:![[thin space (1/6-em)]](https://www.rsc.org/images/entities/char_2009.gif) 1 stoichiometry of the host–guest material. The detection limit of the sensor toward ferric ions was calculated to be 4.5 × 10⁻⁶ mol L−1 and the quenching constant value was found to be 1.1 × 10³ M−1. In short, the applicability of the sensor toward broad pH span, efficient selectivity, reproducibility and quick response time are the interesting advantageous features of the sensor for practical applicability.
1 stoichiometry of the host–guest material. The detection limit of the sensor toward ferric ions was calculated to be 4.5 × 10⁻⁶ mol L−1 and the quenching constant value was found to be 1.1 × 10³ M−1. In short, the applicability of the sensor toward broad pH span, efficient selectivity, reproducibility and quick response time are the interesting advantageous features of the sensor for practical applicability.
3.10. Anthracene-based Fe3+ sensors
Qui et al.268 reported the macrocycle fluorescent sensor 200 (Fig. 167) for selective ferric ion detection. Ligand 200 showed three characteristic emission bands of anthracene centered at 398, 421 and 447 nm and a weak structured less broad peak around 500 nm, which could be assigned as the excimer emission band, when it was excited at 373 nm. Upon the introduction of ferric ions into the probe solution, there was a sudden increase in the emission intensity and the emission bands grew ratiometrically, depending on the added concentration of the ferric ion. Similarly, the ligand showed an absorption band at 250 nm with a shoulder peak at 256 nm, as well as several minor bands in the range of 350–410 nm. Ferric ion addition significantly enhanced the intensity of the shoulder signal. These characteristic changes in the ligand solution upon ferric ion addition suggest the applicability of ligand 200 for the sensing of ferric ions in mixed aqueous–organic media with a precise sensitivity of 5.8 × 10⁻⁷ M. The ligand's optical features could be reversed on the addition of Na2S2O4 solution, as observed by the quenching of the fluorescence emission response. The 2![[thin space (1/6-em)]](https://www.rsc.org/images/entities/char_2009.gif) :
:![[thin space (1/6-em)]](https://www.rsc.org/images/entities/char_2009.gif) 1 stoichiometry of the ligand–metal complex was evaluated from the Job's curve and NMR titration analysis, as well as from the mass spectrometry measurement. The ligand was found to operate over a broad pH span of 6.5–12, and therefore might be useful for ferric ion imaging in live cells. The appearance of green fluorescence from the cells incubated with ligand 200 and ferric ions revealed the tendency of the probe for sensing intracellular iron levels, as assessed in the bioimaging experiment utilizing SKOV-3 cells. There was no deformation of the cells on incubation with probe 200, which suggests an ascertainable viability and perceptible membrane permeability making it an outstanding candidate for biomedical applications.
1 stoichiometry of the ligand–metal complex was evaluated from the Job's curve and NMR titration analysis, as well as from the mass spectrometry measurement. The ligand was found to operate over a broad pH span of 6.5–12, and therefore might be useful for ferric ion imaging in live cells. The appearance of green fluorescence from the cells incubated with ligand 200 and ferric ions revealed the tendency of the probe for sensing intracellular iron levels, as assessed in the bioimaging experiment utilizing SKOV-3 cells. There was no deformation of the cells on incubation with probe 200, which suggests an ascertainable viability and perceptible membrane permeability making it an outstanding candidate for biomedical applications.
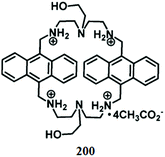 | ||
| Fig. 167 Chemical structure of probe 200, colorimetric change, reversibility and bioimaging applications. | ||
Huang et al.269 described poly(1-amino-5-chloroanthraquinone) 201 (Fig. 168) by a chemically oxidative interfacial polymerization. Polymer 201 showed several excitation peaks at 301, 334 and 385 nm with an excitation maximum of 334 nm and a strong broad emission band at 414 nm. The selectivity of the sensor toward several metal ions was assessed by incubating the receptor 201 solution with the various metal ions. The negligible changes in the florescence emission band of the receptor upon Na+, Mg2+, K+, Ca2+, Fe2+, Ni2+, Zn2+, Ag+, Cd2+, Ba2+, Hg2+, and Pb2+ additions suggest a weak affinity of these metals toward polymer 201. The introduction of Mn2+ and Cu2+ caused minor enhancements of the fluorescence intensities, whereas slight quenching in the fluorescence was observed on Cr3+, Co2+, Ce3+ and Bi3+ addition. In contrast, Al3+ caused a 34.8% quenching in the emission signal, whereas a substantial quenching of up to 85.9% of the original fluorescence was observed in the case of Fe3+ addition. The fluorescence titration experiment with receptor 201 with ferric ions showed a good linear relationship, suggesting the suitability of the receptor toward ferric ions. This momentous quenching of the fluorescence intensity upon ferric ion addition can be employed as an adequate fluorescent sensor for Fe3+. The significant low detection limit values, i.e., 2.0 × 10⁻¹¹ M, of receptor 201 for iron detection is the sign of an efficient sensing material toward ferric probing.
Lee et al.270 reported a novel benzimidazole-based, anthracene-coupled fluorescent receptor 202 (Fig. 169) capable of recognizing and estimating the concentrations of Fe3+ in a semi-aqueous solution in a ratiometric way. The receptor 202 showed the fluorescence emission maxima at 414 nm when it was excited at 367 nm. Ferric ion addition caused a significant quenching of the fluorescence emission band at 414 nm and a minor enhancement in the intensity of the signal at 500 nm. The quenching of the fluorescence emission signal depends on the concentration of the ferric ion. The ratiometric fluorescence quenching of the probe solution took place with the increasing ferric ion concentration. This quenching behavior of the sensor on ferric ion addition could be used as a tool to detect ferric ions in solutions. The ligand–metal binding stoichiometry was calculated by the method of continuous variation as 1![[thin space (1/6-em)]](https://www.rsc.org/images/entities/char_2009.gif) :
:![[thin space (1/6-em)]](https://www.rsc.org/images/entities/char_2009.gif) 1. The Benesi–Hildebrand equation gave the association constant as 1.2 × 10³ M−1. Although Cu2+ addition can slightly vary the fluorescence response, in the competitive experiment, the fluorescence quenching by the ferric ion was not disturbed, thus indicating the selective tendency of the ferric ion toward ligand 202.
1. The Benesi–Hildebrand equation gave the association constant as 1.2 × 10³ M−1. Although Cu2+ addition can slightly vary the fluorescence response, in the competitive experiment, the fluorescence quenching by the ferric ion was not disturbed, thus indicating the selective tendency of the ferric ion toward ligand 202.
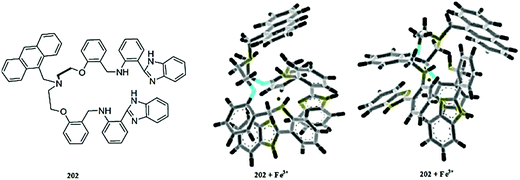 | ||
| Fig. 169 Chemical structure of receptor 202 and energy-minimized structure of the Fe3+ complex of receptor 202 as obtained by MacroModel calculation (two different views). | ||
Lohani et al.271 reported new fluorescent chemical sensors (203 and 204, Fig. 170) for Fe3+ detection by conjugating amino acids as receptors into an anthracene fluorophore. Both the receptors exhibited an emission signal at 412 nm when it was excited at 363 nm. The addition of ferric ions into the probe receptor solution caused quenching of the fluorescence emission signal, and the quenching behavior was found to be selective in comparison to the thirteen competing ions. The fluorescence titration experiment yielded a linear relationship between the fluorescence intensity and the ion concentration. The 1![[thin space (1/6-em)]](https://www.rsc.org/images/entities/char_2009.gif) :
:![[thin space (1/6-em)]](https://www.rsc.org/images/entities/char_2009.gif) 1 ligand–metal stoichiometry was calculated by the method of continuous variation and the association constants was calculated to be 60 μM for both receptors. These observation indicate that both the sensors have a potent binding affinity toward Fe3+ in the pure aqueous media and in the pure organic media, as well as in the mixed aqueous–organic media. The 40 equivalents addition of EDTA solution into the metal–ligand complex regenerated the original fluorescence intensity, suggesting the reversible nature of the prepared sensor material. The reported material has potential for further application for determining fluoride ions in pure aqueous media.
1 ligand–metal stoichiometry was calculated by the method of continuous variation and the association constants was calculated to be 60 μM for both receptors. These observation indicate that both the sensors have a potent binding affinity toward Fe3+ in the pure aqueous media and in the pure organic media, as well as in the mixed aqueous–organic media. The 40 equivalents addition of EDTA solution into the metal–ligand complex regenerated the original fluorescence intensity, suggesting the reversible nature of the prepared sensor material. The reported material has potential for further application for determining fluoride ions in pure aqueous media.
3.11. Tetraphenylethylene-based Fe3+ sensor
Yan et al.272 reported a novel selective and sensitive fluorescence probe 205 (Fig. 171) based on a tetraphenylethylene (TPE) motif for the sequential recognition of Fe3+ and Hg2+ in water. Ligand 90 showed a fluorescence emission signal at 465 nm with the relative fluorescence quantum yield value of 0.06993. There was a significant quenching in the fluorescence emission signal at 465 nm with an 8.71-fold decrease in the fluorescence emission intensity with the new quantum yield values of 0.003046. This quenching phenomenon was found to be selective in comparison to the various other competing species. The 1![[thin space (1/6-em)]](https://www.rsc.org/images/entities/char_2009.gif) :
:![[thin space (1/6-em)]](https://www.rsc.org/images/entities/char_2009.gif) 1 stoichiometry of the ligand–metal complex was observed by the method of continuous variation, and the dissociation constant (Kd) was calculated to be 1.41 × 10⁻⁴ M, according to the fluorescence titration profile. However, the ligand–metal complex solution underwent a colorimetric change from colorless to cyan with a 5.86-fold increase in the emission intensity at 474 nm upon Hg2+ addition, which clearly represented the decomplexation of ferric ions from the Fe3+–205 adduct. The Fe3+ complex with the ligand underwent a turn-on fluorescence response as well as a colorimetric change of the reaction solution with a precise sensitivity of 2 ppb, which is considerably low for efficient mercury detection via fluorescence as well as for naked eye detection.
1 stoichiometry of the ligand–metal complex was observed by the method of continuous variation, and the dissociation constant (Kd) was calculated to be 1.41 × 10⁻⁴ M, according to the fluorescence titration profile. However, the ligand–metal complex solution underwent a colorimetric change from colorless to cyan with a 5.86-fold increase in the emission intensity at 474 nm upon Hg2+ addition, which clearly represented the decomplexation of ferric ions from the Fe3+–205 adduct. The Fe3+ complex with the ligand underwent a turn-on fluorescence response as well as a colorimetric change of the reaction solution with a precise sensitivity of 2 ppb, which is considerably low for efficient mercury detection via fluorescence as well as for naked eye detection.
3.12. Hydrazone-based Fe3+ sensor
Chandra et al.273 reported dibenzoylmethane bis(carbohydrazone) 206 (Fig. 172) as an excellent ion carrier in the construction of an iron(III) ion-selective membrane sensor. The 1![[thin space (1/6-em)]](https://www.rsc.org/images/entities/char_2009.gif) :
:![[thin space (1/6-em)]](https://www.rsc.org/images/entities/char_2009.gif) 1 stoichiometry of the ligand–metal complex was studied conductometrically in acetonitrile, and the possible interaction behavior is shown in Fig. 172. The formation constant for the resulting 1
1 stoichiometry of the ligand–metal complex was studied conductometrically in acetonitrile, and the possible interaction behavior is shown in Fig. 172. The formation constant for the resulting 1![[thin space (1/6-em)]](https://www.rsc.org/images/entities/char_2009.gif) :
:![[thin space (1/6-em)]](https://www.rsc.org/images/entities/char_2009.gif) 1 complex was found to be log
1 complex was found to be log![[thin space (1/6-em)]](https://www.rsc.org/images/entities/char_2009.gif) Kf = 5.92 ± 0.12. The ionophore 206 works well over a wide concentration range with a detection sensitivity of 3.2 × 10⁻⁹ M. UV-spectroscopy and electron impedance spectroscopy were used to determine the interaction mechanism of the ionophore 206 toward ferric ions. The reported sensor was found to be able to determine iron ions in different samples in a reproducible behavior.
Kf = 5.92 ± 0.12. The ionophore 206 works well over a wide concentration range with a detection sensitivity of 3.2 × 10⁻⁹ M. UV-spectroscopy and electron impedance spectroscopy were used to determine the interaction mechanism of the ionophore 206 toward ferric ions. The reported sensor was found to be able to determine iron ions in different samples in a reproducible behavior.
3.13. Porphyrin-based Fe3+ sensors
Chen et al.274 reported two porphyrinato-zinc derivatives modified with two and four N,N-di(2-pyridylmethyl) amino groups (207 and 208, Fig. 173) for ferric ion detection. Ligand 207 exhibited three absorption bands at 423, 557 and 597 nm, while ligand 208 showed two absorption signals at 261 and 614 nm. Compound 207 showed a fluorescence emission signal at 604 nm with a shoulder at 652 nm, while compound 208 exhibited emission signals at 614 and 664 nm. There was no obvious change in the fluorescence emission spectra of both the target molecules. However, upon ferric ion addition, there was a significant quenching in the fluorescence emission spectrum of both compounds. Ferric ion addition into the solution of compound 207 caused a 37.2% quenching in the emission spectra, while drastic quenching was observed for compound 208 upon ferric ion introduction, suggesting that molecule 208 is more sensitive toward iron addition in comparison to molecule 207. The 1![[thin space (1/6-em)]](https://www.rsc.org/images/entities/char_2009.gif) :
:![[thin space (1/6-em)]](https://www.rsc.org/images/entities/char_2009.gif) 2 stoichiometries were observed for both sensor materials, as found by employing their optical responses on Fe3+ binding. These characteristics On–Off changes in sensor materials 207 and 208 could be used as an efficient tool for ferric ion detection due to its considerable sensitivity and selectivity against various competing species.
2 stoichiometries were observed for both sensor materials, as found by employing their optical responses on Fe3+ binding. These characteristics On–Off changes in sensor materials 207 and 208 could be used as an efficient tool for ferric ion detection due to its considerable sensitivity and selectivity against various competing species.
3.14. Macrocyclic Fe3+ sensors
Shamsipur et al.275 reported a novel fluorescent chemical sensor 209 (Fig. 174) for the highly sensitive and selective determination of Fe3+ ions in aqueous solutions. Ligand 209 showed an emission signal with the maximum intensity at 505 nm when it was excited at 265 nm. 1 equivalent Fe3+ addition into the ligand solution caused significant quenching in the emission intensity along with an increase in the emission signal at 410 nm. A similar behavior was observed on 1 equivalent addition of Cd2+, Zn2+ or Cu2+, whereas Ni2+ and Ag+ caused only fluorescence quenching at 505 nm without any increase in the emission signal at 410 nm. The fluorescence titration experiment indicated a ratiometric fluorescence quenching upon ferric ion addition, while the titration experiment gave the 1![[thin space (1/6-em)]](https://www.rsc.org/images/entities/char_2009.gif) :
:![[thin space (1/6-em)]](https://www.rsc.org/images/entities/char_2009.gif) 1 stoichiometric complex formation. The proposed fluorescence optode material was further applied for ferric ion detection in rice straw, spinach and inside various other samples in the pure aqueous media. A fully reversible nature, stable response toward the ferric ion, reproducibility, selectivity and efficient sensitivity of sensor 209 rank it as one of the best reported chemosensors.
1 stoichiometric complex formation. The proposed fluorescence optode material was further applied for ferric ion detection in rice straw, spinach and inside various other samples in the pure aqueous media. A fully reversible nature, stable response toward the ferric ion, reproducibility, selectivity and efficient sensitivity of sensor 209 rank it as one of the best reported chemosensors.
Li et al.276 reported a novel “three-level” deepened cavitand 210 (Fig. 175) for transition metal ions detection in THF–H2O binary solvent using a fluorescence quenching technique. The cavitand 210 exhibited a strong fluorescence emission signal between 320–580 nm when it was excited at 300 nm. The binding affinity of the cavitand 210 toward various transition metal ions was investigated by the introduction of the ionic species into the host solution. Interestingly, a 100-fold excess of Fe3+ and Cu2+ caused significant quenching in the emission spectra, whereas there were no prominent changes in the emission spectra of cavitand 210 upon the introduction of other metallic species. A ratiometric fluorescence quenching was observed by the Cu2+ and Fe3+ ions, along with a slight red-shift in the case of the titration experiment with the Cu2+, whereas a slight blue-shift in the spectrum was observed on Fe3+ titration. These significant changes in the emission spectra on Fe3+ and Cu2+ addition revealed the applicability of cavitand 210 as a probe for Fe3+ and Cu2+ detection. Cavitand 210 showed appreciably low detection limit values for Fe3+ and Cu2+ with experimental values of 2.1 × 10⁻⁶ M (3σ) and 3.6 × 10⁻⁶ M (3σ), respectively. The competitive experiment showed that a number of the competing species, including K+, Na+, Mg2+, Ca2+, Co2+, La3+, and Mn2+, do not have any significant effects on the determination of Fe3+ or Cu2+.
3.15. Coumarin-based Fe3+ sensor
Lim et al.277 described the synthesis and in vitro evaluation of a squarate hydroxamate–coumarin conjugate 211 (Fig. 176) as a chemodosimeter for Fe3+ and other oxidants such as Cr(VI) and Ce(IV). Receptor 211 exhibited a purple color complex with ferric ions, wherein this colorimetric change is due to intramolecular charge transfer in the wavelength range from 500 and 600 nm. The addition of an aqueous solution of ferric chloride into the probe buffer solution led to a 9-fold enhancement in the fluorescence emission intensity along with a colorimetric change of the reaction solution, which could be employed as a dynamic way to probe iron levels in the solution. Furthermore, during the competitive experiment, receptor 211 was found to be capable of differentiating between Fe3+ and Fe2+ by employing their distinct fluorescence responses. The mechanistic insight about the ligand–metal binding was obtained through NMR analysis and mass spectrometry measurements. A 1 ppm ferric ion detection sensitivity of receptor 211 was observed by fluorimetric measurement. Moreover, receptor 211 was screened as a suitable sensor for the redox-sensitive chemodosimetric determination of Fe(III) or other oxidants, such as Cr(VI) or Ce(IV), in aqueous buffer solutions.3.16. Terpyridine-based Fe3+ sensor
Liang et al.278 reported a novel colorimetric chemosensor 212 (Fig. 177) containing a terpyridine moiety. Probe 212 showed absorption signals at 318 and 366 nm, whereas the addition of Fe2+ or Fe3+ caused the emergence of a new sharp band at 567 nm, which was due to metal to ligand charge transfer. There was a gradual growth in the intensity of the sharp peak at 567 nm up to 1![[thin space (1/6-em)]](https://www.rsc.org/images/entities/char_2009.gif) :
:![[thin space (1/6-em)]](https://www.rsc.org/images/entities/char_2009.gif) 2 mole ratios along with a ratiometric increase in the absorption intensity with the linear relationship having good linearly dependent coefficient values. On increasing the concentration of Fe2+ from 0 to 50 μg mL−1, there was a constant increase in the intensity of the absorption signal at 318 and 366 nm, whereas Fe3+ in the same concentrations led to an increase in the first absorption signal at 318 nm and decrease in the second absorption band at 366 nm. This different behavior of probe 212 toward Fe2+ and Fe3+ could be used as a sensing platform to discriminate between these two ionic species. The selectivity of the sensor was also tested using a variety of ionic species, including Cd2+, Cr3+, Ni2+, Zn2+, Cu2+, Pb2+, Co2+, Na+, Ca2+, Mg2+ and K+, and no significant change was observed in the signal at 567 nm except with Ag+, which caused the emergence of a new absorption signal at 450 nm; however, no interference from silver was observed during the competitive experiment. The selective colorimetric as well as the optical response of ligand 212 toward Fe2+ and Fe3+, in comparison to a number of the competing species, can be used as an efficient tool for the recognition of these ionic species in solution.
2 mole ratios along with a ratiometric increase in the absorption intensity with the linear relationship having good linearly dependent coefficient values. On increasing the concentration of Fe2+ from 0 to 50 μg mL−1, there was a constant increase in the intensity of the absorption signal at 318 and 366 nm, whereas Fe3+ in the same concentrations led to an increase in the first absorption signal at 318 nm and decrease in the second absorption band at 366 nm. This different behavior of probe 212 toward Fe2+ and Fe3+ could be used as a sensing platform to discriminate between these two ionic species. The selectivity of the sensor was also tested using a variety of ionic species, including Cd2+, Cr3+, Ni2+, Zn2+, Cu2+, Pb2+, Co2+, Na+, Ca2+, Mg2+ and K+, and no significant change was observed in the signal at 567 nm except with Ag+, which caused the emergence of a new absorption signal at 450 nm; however, no interference from silver was observed during the competitive experiment. The selective colorimetric as well as the optical response of ligand 212 toward Fe2+ and Fe3+, in comparison to a number of the competing species, can be used as an efficient tool for the recognition of these ionic species in solution.
3.17. Calixarene-based Fe3+ sensor
Zhang et al.279 developed a novel pyridyl-appended calix[4]arene 213 (Fig. 178) for selective iron binding synthesized via a click reaction. Furthermore, calix[4]arene 213 was employed to synthesize silver nanoparticles that exhibited a distinct colorimetric response toward Fe3+ due to complexation of the Fe3+ ion with calix[4]arene, inducing aggregation of Ag NPs. Molecule 213 showed the emission spectrum with the maximum intensity at 313 nm when it was excited at 285 nm. However, upon treatment with various metal ions, Fe3+ was the only metal that caused significant quenching in the emission spectrum of the calix[4]arene 213. The progressive addition of ferric ions into the solution of 213 brought about a ratiometric quenching response depending on the concentration of ferric ions, wherein the maximum fluorescence quenching was reached on 1.2 equivalent Fe3+ addition. A linear relationship was obtained by the ligand upon titration with ferric ions with the high linearly dependent coefficient values, indicating the 1![[thin space (1/6-em)]](https://www.rsc.org/images/entities/char_2009.gif) :
:![[thin space (1/6-em)]](https://www.rsc.org/images/entities/char_2009.gif) 1 stoichiometric complex formation. Further mechanistic insight was obtained from the Job's plot and mass spectrometry analysis, both suggesting the formation of the 1
1 stoichiometric complex formation. Further mechanistic insight was obtained from the Job's plot and mass spectrometry analysis, both suggesting the formation of the 1![[thin space (1/6-em)]](https://www.rsc.org/images/entities/char_2009.gif) :
:![[thin space (1/6-em)]](https://www.rsc.org/images/entities/char_2009.gif) 1 stoichiometric complex. Similarly, iron introduction into the solution of compound 213 triggered a new absorption band at 320 nm, whereas the other metal ions did not show changes at this wavelength. In the UV-visible titration experiment, there was a momentous decrease in the signal at 267 nm, whereas the ratiometric increase in the absorption signal intensity at 320 nm on successive Fe3+ additions revealed the complex formation between the ligand and ferric ions. The corresponding complex constant (Ks) for this chelation process was evaluated to be 1.76 × 10⁴ M−1 using the Benesi–Hildebrand equation. Furthermore, due to the very good stabilization capability of the 4-pyridyl toward nanoparticles, calix[4]arene 213 was exposed to AgNO3 with UV radiation to obtain 213–AgNPs, as confirmed by the appearance of a new absorption signal at 414 nm as well as by TEM and DLS analysis. These prepared nanoparticles caused a variation in the absorption spectra at 320 nm, as well as exhibited a selective colorimetric response on Fe3+ binding, thus revealing its potential applicability as a colorimetric sensor for Fe3+.
1 stoichiometric complex. Similarly, iron introduction into the solution of compound 213 triggered a new absorption band at 320 nm, whereas the other metal ions did not show changes at this wavelength. In the UV-visible titration experiment, there was a momentous decrease in the signal at 267 nm, whereas the ratiometric increase in the absorption signal intensity at 320 nm on successive Fe3+ additions revealed the complex formation between the ligand and ferric ions. The corresponding complex constant (Ks) for this chelation process was evaluated to be 1.76 × 10⁴ M−1 using the Benesi–Hildebrand equation. Furthermore, due to the very good stabilization capability of the 4-pyridyl toward nanoparticles, calix[4]arene 213 was exposed to AgNO3 with UV radiation to obtain 213–AgNPs, as confirmed by the appearance of a new absorption signal at 414 nm as well as by TEM and DLS analysis. These prepared nanoparticles caused a variation in the absorption spectra at 320 nm, as well as exhibited a selective colorimetric response on Fe3+ binding, thus revealing its potential applicability as a colorimetric sensor for Fe3+.
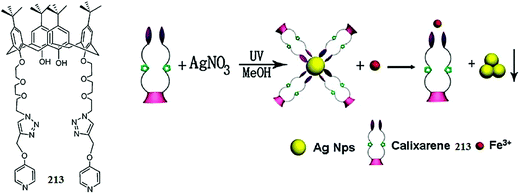 | ||
| Fig. 178 Chemical structure of calix[4]arene 213, synthesis of 213–Ag NPs and schematic of Fe3+-induced 213–Ag NP aggregation. | ||
3.18. Schiff base-based Fe3+ sensors
Mashhadizadeh et al.280 reported a new PVC membrane potentiometric sensor using the neutral ion carrier 214 (Fig. 179) for selective Fe3+ detection. 2-[(2-Hydroxy-1-propenyl-buta-1,3-dienylimino)-methyl]-4-p-tolylazo-phenol 214 was found to be an excellent neutral ion carrier in the construction of a novel Fe3+–PVC membrane electrode. The reported methods showed that the good sensitivity toward the metal ions could be employed for the recognition of the ionic species in an aqueous solution. The electrode worked well in the pH range from 4.5 to 6.5. The proposed sensor could be successfully applied to discriminate between the Fe3+ and various competitive ionic species, including Fe2+, Cd2+, Cu2+, Al3+ and Ca2+. The quick response time of less than 15 seconds and the longer shelf life of the prepared sensor are two incentive features toward the development of a good sensor material. The developed sensor has promising features for Fe3+ sensing in an aqueous solution, and this property of the sensor to perform in pure aqueous media makes it superior over pure organic chemosensors, which show poor solubility in aqueous media.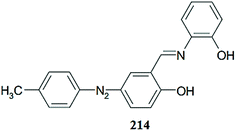 | ||
| Fig. 179 Chemical structure of 2-[(2-hydroxy-1-propenyl-buta-1,3-dienylimino)-methyl]-4-p-tolylazo-phenol 214. | ||
Wei et al.281 reported novel colorimetric sensors (215 and 216, Fig. 180) for the detection of Fe3+ by the naked eye in pure aqueous media. To explore the detection ability of sensors 215 and 216 toward ferric ions, the colorimetric assessment of the ligand was done by treating it with equal concentrations of the competing species. As a result, there was no detectable color change in the solution of the ligand upon addition of the competing metal ions, except for ferric ions, which turned the ligand solution from slight yellow to dark red. These results were highly attractive for the development of an organic chemosensor for naked eye detection in pure aqueous media. Moreover, the proposed sensing material was also useful for the discrimination of Fe3+ and Fe2+ as there was no distinguishable colorimetric change in the ligand solution on Fe2+ addition and the only ion that induced the colorimetric change in the solution was Fe3+. To further explore the practical applicability of the sensor toward ferric ion detection, a paper strip was prepared and exhibited a drastic color change on exposure to ferric ions.
3.19. Pyoverdin-based Fe3+ sensor
Pulido-Tofino et al.282 described a flow-through fluorescent sensor for the consecutive determination of Fe3+ and the total iron content. Pyoverdin 217 (Fig. 181) used as a reactive phase of the proposed sensor was immobilized on controlled pore glass (CPG) by covalent bonding and showed high affinity toward Fe3+ binding. On reacting with ferric ions, the sensor material caused fluorescence quenching and this quenching response was employed to determine the total inorganic ferric content. The sensor was successfully applied to trace ferric ions in synthetic, tap and well waters and wines. Moreover, the prepared sensor showed a considerably long shelf life of three months. These interesting features of the sensor suggested that it had the potential to be used in the accurate, precise and selective determination of Fe3+ and Fe2+ over a wide variety of materials.3.20. Polydiphenylamine-based Fe3+ sensor
Suganandam et al.283 reported a platinum/indium tin oxide coated glass (ITO) electrode deposited by polydiphenylamine (PDPA) 218 (Fig. 182) for ferric ion detection in an aqueous acidic medium. In the cyclic voltammetry analysis, ionophore 218 showed two distinguishable redox pairs in the potential range between 0.0 and 1.0 V, which were assigned to the generation of an N,N′-diphenyl benzidine type radical cation (DPB+, polaronic form of PDPA) and N,N′-diphenyl benzidine dication (DPB2+, bipolaronic form of PDPA). However, after repeated oxidation and reduction of the PDPA film in 1.2 mM FeCl3/1 M HCl solution, the two peaks were merged into a single peak and appeared at the potential of about 850 mV. Moreover, the peak current value representing the process was found to be low in comparison with PDPA film alone. The changes in the cyclic voltammetry behavior of PDPA may arise from the trapping of Fe3+ ions in the PDPA matrix. The diffusion coefficient (Do) value for PDPA film was determined using the Randles–Sevcik equation as 5.6 × 10⁻⁸ cm2 s−1, demonstrating the transport of Fe3+ from the bulk to the electrode surface within the polymeric matrix. Furthermore, the PDPA 218 solution showed a broad band at 550 nm on the introduction of Fe3+ into the solution. A ratiometric increase in the absorption signal at 550 nm with a red-shift of 30 nm was observed on the successive addition of Fe3+ into the ionophore solution, showing the binding tendency of 218 toward Fe3+. These characteristics changes in the CV data as well as in the UV-visible absorption spectra strongly favor the interaction between the amine sites of PDPA and ferric ions and highlight the utility of the PDPA-modified electrode for sensing Fe3+ ions.3.21. Material-based Fe3+ sensors
Shervedani et al.284 described the development and application of a gold 2-mercaptosuccinic acid self-assembled monolayer (Au-MSA SAM) electrode 219 (Fig. 183) for the determination of iron(III) in the presence of iron(II) by cyclic voltammetry, electrochemical impedance spectroscopy, and Osteryoung square wave voltammetry. 1.0 × 10⁻¹⁰ to 6.0 × 10⁻⁹ M iron(III) yielded a linear range calibration curve with the relative standard deviation of 6.5% at 1.0 × 10⁻⁹ M iron(III), showing a precisely low detection limit of 3.0 × 10⁻¹¹ M. The prepared sensor material works well in the presence of other competing species. The sensor was successfully applied for ferric ion detection in a number of environmental samples, including natural water and tap and mineral water, as well as pharmaceutical samples without interference from the competing species.Tripathy et al.285 reported colorimetric, label-free, and non-aggregation-based gold nanoparticle (AuNP) probes 220 (Fig. 184) for the highly selective detection of Fe(III) ions in aqueous media. The sensor solution was purple in color and on successive additions of ferric ions into aqueous dispersions of 30 nm AuNPs, a significant colorimetric change was observed by turning the solution color from purple to colorless, whereas the dispersion became complete with a ferric ion concentration beyond 1000 ppm. In the case of the UV-visible absorption spectra, the aqueous dispersion of AuNPs in the presence of hydrochloric acid and thiourea yielded a distinct absorbance peak at 525 nm, which drastically decreased in intensity on the introduction of ferric ions into the dispersion. However, there were no such changes in the dispersion absorption spectra in the presence of the competitive ionic species. There was some effect by Cu2+ introduction on the optical characteristics; however, the sensitivity of the sensor toward ferric ions was much higher compared to copper ions. Mechanistic insight of the sensor toward the ferric ion was obtained through XRD analysis, and the morphology of the sensor was assessed by scanning electron microscopy measurements. The color sensing mechanism was determined using X-ray photoelectron spectroscopy. These interesting features of the prepared sensor make it a good candidate for the environmental monitoring of ferric levels in industrial pollution.
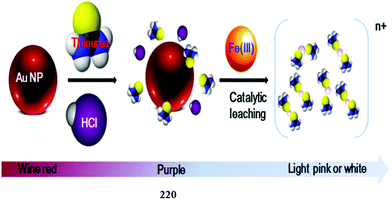 | ||
| Fig. 184 Proposed mechanism for the colorimetric change of AuNPs 220 induced by Fe3+ ions in the presence of an acidic thiourea system. | ||
Shervedani et al.286 described deferrioxamine, a bacterial hydroxamic siderophore, with a high binding affinity for Fe(III) in its immobilized form as a self-assembled monolayer on Au 221 (Fig. 185) and successfully applied it for the accumulation and recognition of Fe(III) in the solution phase. The proposed sensor was capable of detecting the accumulated ferric level via an active mode based on the faradaic reduction current of Fe(III), as well as in an inactive mode based on the impedimetric effect of accumulated Fe(III) against the redox reaction of a suitable probe. The analytical signal harvested by the sensor material on binding with ferric ions was assessed by the appropriate electrochemical techniques, including square wave voltammetry and electrochemical impedance spectroscopy. The experimental observation showed the selective tendency of the sensor over a broad range of competing species with an appreciably low detection limit of 2.0 × 10⁻¹¹ M. The sensor validity was checked over multiple varieties of environmental samples, including plant tissues, industrial alloys and pharmaceutical samples.
 | ||
| Fig. 185 Schematic of the proposed mechanism for the Au–MPA–DFO SAM 221 formation and its interaction with Fe(III). | ||
Mu et al.287 described a one-pot synthetic methodology by employing L-proline as the stabilizer for the preparation of fluorescent AuNCs 222 (Fig. 186) for the selective recognition of ferric ions. The prepared AuNCs exhibited blue fluorescence with a maximum emission at 440 nm. However, upon ferric ion introduction, this fluorescence was significantly quenched and the quenching of the fluorescence was directly proportional to the ferric ion concentration. The sensor works well in the pH range of 2.0–6.0 with a fast response time of less than 1 min and a colorimetric change upon ferric ion addition. The ferric ion binding to AuNCs was investigated by TEM analysis, which resulted in bigger clusters on incubation of the sensor material with ferric ions due to the involvement of the ferric ion inside the cavities of the gold nanoclusters. The ratiometric response of the AuNCs toward ferric ions had a good linear relationship with a linearly dependent coefficient value of 0.989 and Stern–Volmer quenching constant value of 0.002, suggesting the favorable affinity of the sensor toward ferric ions. The sensor behaved specifically toward ferric ions over a wide range of the competing ionic species, including Ca2+, Cd2+, Co2+, Cr3+, Cu2+, Fe2+, Hg2+, K+, Al3+, Mg2+, Mn2+, Na+, Ni2+, Pb2+, Zn2+, and Ag+, which is one of the beneficial features of the sensor for environmental monitoring.
Ju et al.288 developed a simple and low-cost synthetic strategy to prepare nitrogen-doped graphene quantum dots (N-GQDs) 223 (Fig. 187) through the hydrothermal treatment of GQDs with hydrazine and evaluated its applicability as a ferric ion sensor in an aqueous solution. The reported quantum dots 223 exhibited blue emission with a 23.3% fluorescence quantum yield. Sensor 223 exhibited an absorption signal at 332 nm and a fluorescence emission signal at 440 nm when it was excited at 360 nm. However, upon the introduction of ferric ions in to the probe 223 aqueous solution, a significant quenching of the fluorescence emission signal at 440 nm was observed. The fluorescence intensity was found to decrease linearly on increasing the ferric ion concentration, showing good linearly dependent coefficient values. Moreover, the optical response showed a good fitting with the Stern–Volmer equation. Furthermore, sensor 223 showed a quick response time of about 4 min, specific ferric ion recognition in comparison to a number of competing ions and precisely low detection limit of up to 90 nM ferric in pure aqueous media.
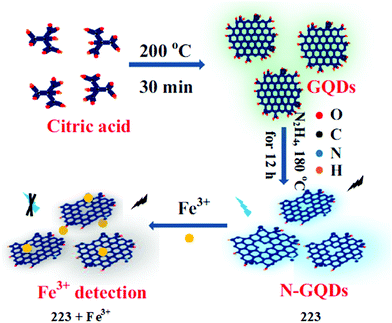 | ||
| Fig. 187 Schematic of the procedure for synthesizing N-GQDs 223 and the proposed ferric ion detection mechanism. | ||
Ananthanarayanan et al.289 introduced a facile method to electrochemically exfoliate graphene quantum dots (GQDs) 224 (Fig. 188) from three-dimensional graphene grown by chemical vapor deposition (CVD) for the sensitive and specific detection of ferric ions. The sensor 224 dispersion appears as a light-brown color in daylight and exhibited a blue emission under UV lamp. The graphene quantum dots material showed two UV-visible absorption bands at 243 and 360 nm, whereas the fluorescence emission signal was at 440 nm when it was excited at 360 nm. Interestingly, ferric ion addition into the dispersion of sensor 224 caused a drastic emission signal quenching, and this quenching behavior was observed at a maximum at pH 4. Sensor 224 showed dose dependent fluorescence quenching on incubation with ferric ions, and the minimum detection ability of the sensor toward ferric ions was found to be 7.22 μM by the 3σ/m methods. Ferric ions induced aggregation to the sensor material, as confirmed by the AFM imaging, and the particle sizes were measured by dynamic light scattering analysis.
 | ||
| Fig. 188 Schematic of graphene quantum dots (GQD) synthesis from 3D graphene and the mechanism of Fe3+ detection. | ||
McIlwee et al.290 presented homogeneous chitosan films 225 (Fig. 189) of various thicknesses (10–65 nm) deposited on thin gold films through a spin-coating method and evaluated its applicability as a strong chelating agent toward ferric ions. The iron binding capacity on chitosan film was investigated by cyclic voltammetry analysis. The sensor exhibited a 9.49 × 10⁵ M−1 affinity constant between chitosan and Fe3+. The minimum detection ability of the sensor was lower than 250 ppb, underlining the strong chelation properties of the chitosan film toward ferric ions.
Mehta et al.291 developed a selective and sensitive colorimetric method for the determination of Fe3+ ions using p-amino salicylic acid dithiocarbamate-functionalized gold nanoparticles (DTC-PAS-Au NPs) 226 (Fig. 190). The nanoparticles solution showed a red appearance and exhibited an absorption signal at 520 nm in the absence of ferric ions, whereas ferric ion addition into the solution of 226 turned the red colored solution blue along with a shifting of the absorption signal from 520 nm to 700 nm, which confirmed the ligand-to-metal charge transfer between DTC-PAS-Au NPs and Fe3+ ions. The fact the ferric ions induced aggregation in the nanoparticles was confirmed by AFM, TEM and DLS analysis. The ligand behaved selectively toward ferric ions in comparison to the various competitive ions, and under optimal conditions exhibited a good linear relationship with correlation coefficient values of 0.993 between the ratio of the extinction at 700 nm and that at 520 nm and for a concentration of Fe3+ over the range of 40–80 μM. The detection limit of the sensor was evaluated to be 14.82 nM. These characteristic colorimetric changes as well as the optical variation in the sensor solution upon ferric ion binding revealed the applicability of the sensor as a sensitive reporting material for trace iron detection in environmental and biomedical monitoring.
 | ||
| Fig. 190 Schematic for the colorimetric sensing of Fe3+ using DTC-PAS-Au NPs 226 as colorimetric probes. | ||
Gupta et al.292 demonstrated reagentless optical recognition and the parts-per-million (ppm) quantification of FeCl3 in CH3CN using a redox-active Os(II)-chromophore-based monolayer on glass 227 (Fig. 191). The ferric ion induced oxidation of the monolayer, which was fully reversible and could easily be monitored by optical spectroscopy analysis. The 227-based monolayer exhibited three characteristic absorption signals at 692, 516, and 293 nm, which showed strong hypochromic shifts upon exposure to dry CH3CN solution containing ppm levels of FeCl3 in a short timeframe of about 30 min. The sensor behaved selectively over a wide range of competing species, including alkali metals, alkaline earth metals, and other transition metal salts. Ferric ion detection by the sensor and the concurrent generation of Fe2+ brought about a colorimetric change in the solution that could easily be assessed by the naked eye. The sensor was found capable of detecting 0.5–162 ppm of FeCl3 in CH3CN and 100–1000 ppm of ferric ions in the aqueous media. The reaction kinetics revealed the pseudo-first-order pathway of the monolayer with a CH3CN solution containing 5 ppm FeCl3.
Feng et al.293 described a facile one-pot method for the synthesis of water-soluble and stable fluorescent CuNCs at room temperature, in which branched polyethylene imine (BPEI) served as a capping scaffold, whereas ascorbic acid served as a reducing agent, and together they could serve as a fluorescent sensor 228 for ferric ion detection (Fig. 192). The BPEI–CuNCs solution was colorless under visible light, whereas it emitted blue fluorescence under a UV lamp by illuminating at a longer wavelength at 360 nm. The UV-visible absorption spectra of the BPEI–CuNCs exhibited an absorption signal at 355 nm and a fluorescence emission signal at 430 nm when it was excited at 360 nm. However, following the introduction of ferric ions into the BPEI–CuNCs solution, a significant quenching in the fluorescence emission signal at 430 nm was observed. Ratiometric fluorescence quenching was observed for BPEI–CuNCs on gradual ferric ion addition, and the quenching response was completed within 5 min, yielding a good linear correlation with the linearly dependent coefficient values of 0.996, reflecting the applicability of the probe for sensitive ferric ion detection. The appropriate operating pH was selected to be 4 for the best sensing response of the probe toward ferric ion detection. The quenching constant for the probe was determined by the Stern–Volmer equation as 4.0 × 10³ M−1, and the sensor had a satisfactory sensitivity of 340 nM for ferric ion detection in the solution. The sensor material behaved selectively to Fe3+ in comparison to a number of competing species, except for Fe2+, which caused fluorescence quenching up to certain degree. The proposed method showed great potential for the selective determination of ferric ions in biological and environmental samples, as assessed by testing with tap water, yellow river water and human urine.
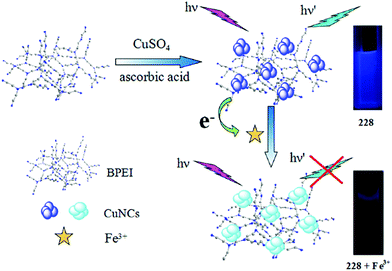 | ||
| Fig. 192 Synthetic strategy of the BPEI–CuNCs and the mechanism of the BPEI–CuNCs probe for Fe3+ sensing. | ||
4. Zinc ion sensors
Zinc is the second most abundant and essential transition element in the human body after iron and is indispensable to living organism in a minute quantity.294,295 Zn2+ has been documented to influence many cellular processes, including proliferation, differentiation, apoptosis, transcription, immune function, pathology, neural signal transmission, microtubule polymerization and DNA repair, as well as acting as a mediator for cell–cell signaling in the central nervous system and as an enzyme inhibitor for caspases and phosphatases at concentrations ranging from the picomolar to nanomolar.296–299 Divalent zinc exists in both tightly bound and mobile forms. The labile zinc pools may refer to loosely bound, chelatable, or free zinc, which is present in particular in high concentrations in the brain, intestine, pancreas, retina, prostate, olfactory bulb, and spermatic sac.300 Although chelatable Zn2+ has many important roles in biological systems, including brain function, gene transcription, the immune response and reproduction, its mechanisms of action are little known in comparison to other cations such as Ca2+, Na+, and K+. The intracellular concentration of mobile zinc is tightly regulated and varies from the picomolar to millimolar, depending on the organ; the total zinc ion concentration in serum is 10 μM.301–304 To regulate intracellular free Zn2+ concentrations, an elaborated system exists in mammalian cells, involving metal binding proteins such as metallothionein (MT), 3,5 zinc transporters (ZnT, encoded by Slc30a1–10), and zinc importers (ZiP, Zrt- and Irt-like proteins encoded by Slc39a1–14).305The imbalance of Zn2+ as an excess or deficit is linked to severe neurological disorders and growth defects.306–308 Depletion of biological zinc levels leads to a decrease in wound healing strength as a result of impaired collagen synthesis, and an unbalanced metabolism could lead to an increased risk of several diseases such as low blood sugar, Alzheimer's disease, epilepsy, ischemic stroke, Parkinson's disease, and infantile diarrhea.309–312 Contrary to these structural and functional applications, a high level of zinc is cytotoxic and may lead to skin disease, diabetes, prostatic adenocarcinoma, and pancreatic islets, which play critical roles in insulin biosynthesis, storage, and secretion.313,314
However, because of the closed-shell 3d104s0 electronic configuration and absence of redox activity, the exact roles, either structural or functional, of Zn2+ in biological systems are not entirely clear.315 Research into zinc recognition has expanded in recent decades to encompass many areas of chemistry: from small molecule sensors to peptide-based systems and elaborate supramolecular complexes.316 The standard instrumental analysis techniques for heavy metal ions detection often require sample preparation, which may change the oxidation states of the metal ions, leading to false positives.317 Therefore, subcellular Zn2+ imaging using fluorescence sensors in the specific compartments along with distinct intracellular distribution patterns is of great interest.318 Furthermore, the detection of zinc is also important for environmental safety as it is widely employed in electroplating industries and can be a persistent environmental pollutant, wherein its toxicity has been found in both acute and chronic forms.319,320 Thus, intensive efforts have been devoted to develop sensitive fluorescent sensors for the detection of trace amounts of zinc ions in both biological and environmental systems in the past and in particular, sensors with long-wave absorption or a wide emission region (650–900 nm) have attracted considerable attention for bioimaging applications due to the retardation of autofluorescence and photodamage to living cells.321,322 Herein, we summarized the different types of zinc sensors, together with their variable functionalities.
4.1. Pyrene-based Zn2+ sensors
Zhou et al.323 reported the hydrazone–pyrene-based sensor 229 (Fig. 193) for the selective detection of zinc ions in solutions and in biological samples. Sensor 229 exhibited a selective 12-fold fluorescence enhancement upon zinc addition with the maximum fluorescence intensity at 527 nm when it was excited at 450 nm. The 1![[thin space (1/6-em)]](https://www.rsc.org/images/entities/char_2009.gif) :
:![[thin space (1/6-em)]](https://www.rsc.org/images/entities/char_2009.gif) 1 binding stoichiometry was calculated from the Job's curve and the binding constant was evaluated to be 2.43 × 10⁴ M. Further mechanistic insight was obtained through the NMR titration experiment. The appearance of strong green fluorescence from the ligand mixed cells upon incubation with zinc ions demonstrated the successful applicability of the reported material for intracellular zinc detection, as evaluated through a bioimaging experiment utilizing HaCaT cells.
1 binding stoichiometry was calculated from the Job's curve and the binding constant was evaluated to be 2.43 × 10⁴ M. Further mechanistic insight was obtained through the NMR titration experiment. The appearance of strong green fluorescence from the ligand mixed cells upon incubation with zinc ions demonstrated the successful applicability of the reported material for intracellular zinc detection, as evaluated through a bioimaging experiment utilizing HaCaT cells.
Thirupathi et al.324 reported pyrene-appended histidine 230 (Fig. 194) as a zinc ion sensor in pure aqueous media. The probe exhibited a UV-visible absorption signal at 352 nm, which is a characteristic band for the pyrene moiety. Similarly, the emission bands at 384 and 402 nm were attributed to the pyrene monomeric emissions. The probe showed a ratiometric response toward zinc and mercury ions, but a turn-off response on copper and silver addition. Zinc addition caused a ratiometric decrease in the pyrene monomer emissions at 384 and 402 nm and a concomitant increase in the pyrene excimer emission at 484 nm in the pure aqueous media. Similarly, zinc addition caused a hypochromic shift with a significant decrease in the absorption signal intensity at 352 nm. The characteristic changes in the absorption/emission signal of the probe on mercury, copper and silver addition also suggest the multiple channel detection capacity of the probe. Job's plot indicates the 2![[thin space (1/6-em)]](https://www.rsc.org/images/entities/char_2009.gif) :
:![[thin space (1/6-em)]](https://www.rsc.org/images/entities/char_2009.gif) 1 ligand–metal binding stoichiometry for zinc and mercury ions, but a 1
1 ligand–metal binding stoichiometry for zinc and mercury ions, but a 1![[thin space (1/6-em)]](https://www.rsc.org/images/entities/char_2009.gif) :
:![[thin space (1/6-em)]](https://www.rsc.org/images/entities/char_2009.gif) 1 binding stoichiometry for the copper and silver ions. The association constant of the receptor toward Zn2+, Hg2+, Cu2+ and Ag+ were found to be 1.17 × 10¹³ M−2 (R2 = 0.89), 5.21 × 10¹³ M−2 (R2 = 0.96), 1.55 × 10⁴ M−1 (R2 = 0.98) and 4.52 × 10³ M−1 (R2 = 0.99), respectively. The sensitivity of receptor 230 toward zinc ions was found to be 80.8 nM.
1 binding stoichiometry for the copper and silver ions. The association constant of the receptor toward Zn2+, Hg2+, Cu2+ and Ag+ were found to be 1.17 × 10¹³ M−2 (R2 = 0.89), 5.21 × 10¹³ M−2 (R2 = 0.96), 1.55 × 10⁴ M−1 (R2 = 0.98) and 4.52 × 10³ M−1 (R2 = 0.99), respectively. The sensitivity of receptor 230 toward zinc ions was found to be 80.8 nM.
Ingale et al.325 reported the pyrene-linked Tris–triazole-based fluorescent sensor 231 (Fig. 195) for zinc ion detection. The probe exhibited an absorption signal at 340 nm, whereas the fluorescence emission signals at 465 nm and 376 were due to excimer/monomer emissions. The increasing concentration of zinc ions showed an increase in the monomer emission at 376 with a concomitant decrease in the excimer emission at 465 nm. The fluorescence titration experiment revealed the clear isoemissive point at 425 nm, which indicated the successful complexation between the receptor and zinc ion. Moreover, the addition of NaH2PO4 into the probe–zinc complex solution caused a reversible change in the optical properties, indicating the reversible character of the reported sensor. The association constant and the detection limit of the receptor toward zinc ions were found to be 7.0 × 10⁵ M−1 and 2.0 × 10⁻⁷ M, respectively.
Ni et al.326 reported pyrene-linked triazole-modified homooxacalix[3]arene 232 (Fig. 196) as a fluorescent sensor for zinc and H2PO4− detection. The probe showed monomer and excimer emissions maxima at 396 and 485 nm, respectively. The increasing concentration of zinc ions caused a gradual decrease in the excimer emission and a successive increase in the monomer emission along with a clear isoemissive point at 431 nm. Job's plot indicates the 1![[thin space (1/6-em)]](https://www.rsc.org/images/entities/char_2009.gif) :
:![[thin space (1/6-em)]](https://www.rsc.org/images/entities/char_2009.gif) 1 ligand–metal binding stoichiometry, which was further confirmed by mass spectrometry and NMR spectroscopy analysis. The association constant of the receptor toward zinc ions was found to be 9.51 × 10⁴ M−1. Furthermore, there was a considerable fluctuation in the fluorescence emission signal intensity only on H2PO4− addition, in comparison to the various background tested anionic species, thus revealing the sensing affinity of the resulting complex toward H2PO4−.
1 ligand–metal binding stoichiometry, which was further confirmed by mass spectrometry and NMR spectroscopy analysis. The association constant of the receptor toward zinc ions was found to be 9.51 × 10⁴ M−1. Furthermore, there was a considerable fluctuation in the fluorescence emission signal intensity only on H2PO4− addition, in comparison to the various background tested anionic species, thus revealing the sensing affinity of the resulting complex toward H2PO4−.
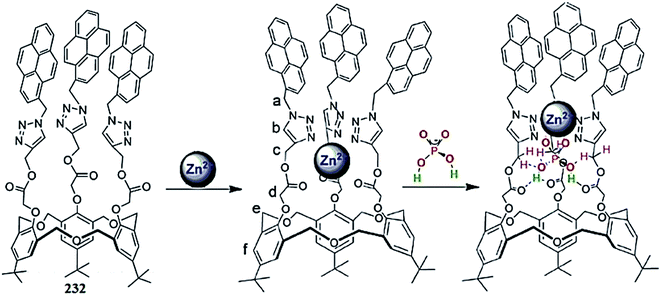 | ||
| Fig. 196 Chemical structure of receptor 232 and the proposed complexation mechanism toward zinc/H2PO4−. | ||
4.2. Quinolone-based Zn2+ sensors
Zhang et al.327 reported the quinolone-based ratiometric zinc ion sensor 233 (Fig. 197). Zinc addition caused a red-shift in the absorption signal at 240 and 302 nm along with three isosbestic points at 245, 280 and 325 nm. Similarly, the probe showed a weak fluorescence emission band at 415 nm when it was excited at 325 nm, whereas zinc addition caused a 85 nm red-shift in the emission signal. The ratiometric increase in the fluorescence emission signal intensity on progressive zinc additions into the probe solution showed the efficient chelation ability of receptor 233 with the zinc ion. The UV-visible and fluorescence titration experiment of the probe with zinc ions showed the 2![[thin space (1/6-em)]](https://www.rsc.org/images/entities/char_2009.gif) :
:![[thin space (1/6-em)]](https://www.rsc.org/images/entities/char_2009.gif) 1 ligand–zinc binding stoichiometry. The dissociation constant and detection limit of the probe were calculated by utilizing the fluorescence titration graph and were calculated to be 7.02 × 10⁻¹² M2 and 8.85 × 10⁻⁸ M, respectively. Moreover, the strong fluorescence emission signal of the receptor–zinc complex underwent drastic fluorescence quenching upon copper addition, wherein the ratiometric decrease in the fluorescence emission signal of the receptor–zinc complex with copper ions might open up the possibility for utilizing the resulting complex for copper detection. The ligand exhibited an efficient cell viability and membrane permeability as assessed in the bioimaging experiment, which revealed the sensor applicability for intracellular metal detection.
1 ligand–zinc binding stoichiometry. The dissociation constant and detection limit of the probe were calculated by utilizing the fluorescence titration graph and were calculated to be 7.02 × 10⁻¹² M2 and 8.85 × 10⁻⁸ M, respectively. Moreover, the strong fluorescence emission signal of the receptor–zinc complex underwent drastic fluorescence quenching upon copper addition, wherein the ratiometric decrease in the fluorescence emission signal of the receptor–zinc complex with copper ions might open up the possibility for utilizing the resulting complex for copper detection. The ligand exhibited an efficient cell viability and membrane permeability as assessed in the bioimaging experiment, which revealed the sensor applicability for intracellular metal detection.
Mahapatra et al.328 reported the quinolone-based fluorescent sensor 234 (Fig. 198) for zinc ion detection. The probe showed absorption signals at 267 and 348 nm in the absence of zinc ions. Zinc addition caused a decrease in the absorption signal at 267 nm and an increase in the signals at 282 and 390 nm. The absorption titration resulted in the appearance of two well-defined isosbestic points, indicating the presence of multiple species in the reaction solution. Similarly, the addition of zinc ions caused a constant decrease in the emission signal intensity at 405 nm with a concomitant appearance of a red-shifted signal at 491 nm. The fluorescence titration resulted in the formation of a clear isoemissive point, which indicated the complexation process between the ligand and zinc ion. The 1![[thin space (1/6-em)]](https://www.rsc.org/images/entities/char_2009.gif) :
:![[thin space (1/6-em)]](https://www.rsc.org/images/entities/char_2009.gif) 3 ligand–zinc binding stoichiometry was calculated from the Job's curve, mass spectrometry and computational analyses. A precisely low detection limit of 9.87 μM was displayed by the receptor molecule. Moreover, the ligand was successfully applied for molecular logic gate and intracellular zinc detection.
3 ligand–zinc binding stoichiometry was calculated from the Job's curve, mass spectrometry and computational analyses. A precisely low detection limit of 9.87 μM was displayed by the receptor molecule. Moreover, the ligand was successfully applied for molecular logic gate and intracellular zinc detection.
Wang et al.329 reported the quinolone-substituted fluorescence sensor 235 (Fig. 199) for zinc ion detection. The probe exhibited an absorption signal at 248 nm in the absence of zinc ions. Zinc addition caused a red-shift in the spectrum. The absorption titration of the ligand on the successive addition of zinc ions triggered a well-defined isosbestic point at 307 nm, indicating the successful complexation process between the receptor and the added zinc ion. The 2![[thin space (1/6-em)]](https://www.rsc.org/images/entities/char_2009.gif) :
:![[thin space (1/6-em)]](https://www.rsc.org/images/entities/char_2009.gif) 1 ligand–zinc binding stoichiometry was found from the Job's curve and NMR titration analysis. Similarly, the receptor showed a weak emission signal at 410 nm, which was red-shifted to 428 nm on zinc addition. The fluorescence intensity at 428 nm was found to increase linearly on increasing zinc addition, which suggests the applicability of the sensor for ratiometric zinc detection.
1 ligand–zinc binding stoichiometry was found from the Job's curve and NMR titration analysis. Similarly, the receptor showed a weak emission signal at 410 nm, which was red-shifted to 428 nm on zinc addition. The fluorescence intensity at 428 nm was found to increase linearly on increasing zinc addition, which suggests the applicability of the sensor for ratiometric zinc detection.
Wang et al.330 reported the quinolone-based fluorescent sensor 236 (Fig. 200) for zinc ion detection. The probe showed a high intensity absorption signal at 244 nm and two broad band absorption signals at 270 and 315 nm in the absence of zinc ions. The zinc addition caused the considerable decline in the absorption signal at 244 nm accompanied by the little bathochromic shift while the signal at 270 nm was declined without any shift in the spectral position. The absorption titration of the probe with zinc ions caused the emergence of a new signal at 320 nm, which tailed out up to 370 nm along with three distinct isosbestic points at 245, 250, and 312 nm, indicating the successful complexation between the receptor and zinc ion. Similarly, the probe showed a weak emission signal at 425 nm in the absence of zinc ions when it was excited at 315 nm. Zinc addition caused a drastic enhancement in the intensity of this signal with a 13 nm bathochromic shift in the spectral position. Job's plot indicates the 1![[thin space (1/6-em)]](https://www.rsc.org/images/entities/char_2009.gif) :
:![[thin space (1/6-em)]](https://www.rsc.org/images/entities/char_2009.gif) 1 ligand–metal binding stoichiometry along with the estimated values for Kd of 59 nM.
1 ligand–metal binding stoichiometry along with the estimated values for Kd of 59 nM.
 | ||
| Fig. 200 Chemical structure of receptor 236 and the ORTEP view of the ligand–zinc complex structure. | ||
Xue et al.331 reported the quinoline-based fluorescent sensor 237 (Fig. 201) for ratiometric zinc detection. Zinc addition into the probe solution caused a decrease in the absorption signal at 346 nm along with a 4 nm red-shift in the spectral position. The zinc titration triggered the shoulder signal at 405 nm and several isosbestic points at 390, 322, 306, and 272 nm, indicating the complexation process between the receptor and zinc ion. Similarly, the probe showed an emission signal at 545 nm in the absence of zinc ions when the excitation wave was fixed at 405 nm. The addition of zinc ions triggered the red-shifted emission signal at 620 nm alongside the clear isoemissive point. The titration results were utilized to determine the 1![[thin space (1/6-em)]](https://www.rsc.org/images/entities/char_2009.gif) :
:![[thin space (1/6-em)]](https://www.rsc.org/images/entities/char_2009.gif) 1 ligand–zinc binding stoichiometry by the method of continuous variation, which was further assisted by mass spectrometry analysis. The dissociation constant for the probe toward zinc binding was estimated to be 21.2 × 1.2 nM. Furthermore, the bioimaging experiment demonstrated the appreciable membrane permeability and maximum cell viability of the receptor for intracellular zinc detection, as assessed under a confocal fluorescence microscope utilizing NIH 3T3 cells.
1 ligand–zinc binding stoichiometry by the method of continuous variation, which was further assisted by mass spectrometry analysis. The dissociation constant for the probe toward zinc binding was estimated to be 21.2 × 1.2 nM. Furthermore, the bioimaging experiment demonstrated the appreciable membrane permeability and maximum cell viability of the receptor for intracellular zinc detection, as assessed under a confocal fluorescence microscope utilizing NIH 3T3 cells.
Zhou et al.332 reported the quinoline-based fluorescent receptor 238 (Fig. 202) for the recognition of zinc ions in pure aqueous or mixed aqueous–organic media. The probe exhibited a constant decrease in the absorption signals at 237 and 315 nm with the concomitant appearance of new absorption signals at 250 and 350 nm. Titration of the ligand with the zinc ions triggered two clear isosbestic points at 280 and 326 nm along with a colorimetric change in the reaction solution to light yellow at the end of the titration. Similarly, the probe showed a constant decrease in the emission signal at 410 nm along with the appearance of a new emission signal at 490 nm with a clear isoemissive point at 430 nm. These spectral shifts in the ligand solution on zinc addition suggest the intramolecular charge transfer in the ligand molecule. The association constant of the probe for zinc ions was calculated to be 1.84 × 10⁶ M−1, and limit of detection was calculated to be 28.3 nM. Mechanistic insight was obtained through the Job's curve, NMR titration experiment and mass spectrometry analysis. Moreover, the probe was further employed in the bioimaging experiment, which showed the appreciable membrane permeability of the reported receptor, as assessed by utilizing it for HK-1 cells under a confocal fluorescence microscope.
Praveen et al.333 reported the quinoline-based fluorescence sensor 239 (Fig. 203) for zinc detection. The ligand exhibited absorption signals at 279 nm and 340 nm in the absence of metal ions, whereas zinc ion addition caused a 13 nm red-shift in the signal at 279 and a 22 nm red-shift in the signal at 340 nm along with a substantial increase in the absorption signal intensity. Similarly, the ligand showed a 13-fold increase in the emission signal intensity at 480 nm due to chelation enhancement of fluorescence when the excitation wavelength was fixed at 309 nm. The ligand–metal complexation stoichiometry was calculated by the method of continuous variation, and further information about the complexation mechanism was obtained through the mass spectrometry analysis and NMR titration experiment. The binding constant and detection limit were calculated to be 8.35 × 10¹¹ M−2 and 3.8 × 10⁻⁶ M, respectively.
4.3. Naphthalene-based Zn2+ sensors
Li et al.334 reported the naphthalene-based fluorescent chemosensor 240 (Fig. 204) for selective zinc recognition. The probe alone exhibited an absorption signal in the range of 250–375 nm. Zinc addition caused a gradual enhancement in the absorption signal at 356–430 nm along with a synchronous decrease in the absorbance at 270 and 356 nm. Ratiometric zinc addition triggered a clear isosbestic point at 356 nm. Similarly, zinc addition caused a simultaneous red-shift in the emission signal from 405 to 450 nm along with one isoemissive point at 410 nm when it was excited at 356 nm. The 1![[thin space (1/6-em)]](https://www.rsc.org/images/entities/char_2009.gif) :
:![[thin space (1/6-em)]](https://www.rsc.org/images/entities/char_2009.gif) 1 ligand–zinc binding stoichiometry was calculated from the Job's curve and was further confirmed by the mass spectrometry analysis. The association constant and sensitivity of the receptor toward the zinc ion were found to be 106 M−1 and 0.5 μΜ, respectively.
1 ligand–zinc binding stoichiometry was calculated from the Job's curve and was further confirmed by the mass spectrometry analysis. The association constant and sensitivity of the receptor toward the zinc ion were found to be 106 M−1 and 0.5 μΜ, respectively.
Azadbakht et al.335 reported the naphthalene-based macrocyclic molecule 241 (Fig. 205) for zinc ion detection. The ligand exhibited a very weak fluorescence emission signal when it was excited at 280 nm, whereas zinc addition caused a significant enhancement in the emission signal intensity at 360 nm, suggesting the efficient affinity of the receptor toward zinc ions. The ratiometric enhancement in the signal intensity was utilized to determine the 1![[thin space (1/6-em)]](https://www.rsc.org/images/entities/char_2009.gif) :
:![[thin space (1/6-em)]](https://www.rsc.org/images/entities/char_2009.gif) 1 ligand–zinc complexation stoichiometry by the method of continuous variation, which was further supported by the mass spectrometry analysis. The stability constant and detection limit of the receptor toward zinc ions were found to be >106 M−1 and 1.0 × 10⁻⁷ M, respectively.
1 ligand–zinc complexation stoichiometry by the method of continuous variation, which was further supported by the mass spectrometry analysis. The stability constant and detection limit of the receptor toward zinc ions were found to be >106 M−1 and 1.0 × 10⁻⁷ M, respectively.
Song et al.336 reported the simple naphthalene-based fluorescent sensor 242 (Fig. 206) for zinc and fluoride ion detection. The ligand exhibited a weak emission signal at 389 nm in the absence of zinc ions. Zinc addition caused a significant enhancement in the fluorescence emission signal intensity at 463 nm, whereas there was a negligible effect from the competing metallic addition toward the fluorescence intensity of the ligand–zinc complex. Similarly, zinc addition caused a gradual decrease in the absorption signals intensity at 270, 284, and 412 nm with a concomitant increase in the absorption signal intensity at 218 and 337 nm along with a blue-shift in the spectral position. The absorption titration experiment triggered clear isosbestic points at 263, 274, 281, 311, 388 and 459 nm, indicating the equilibrium between the probe and probe–metal complex. The 1![[thin space (1/6-em)]](https://www.rsc.org/images/entities/char_2009.gif) :
:![[thin space (1/6-em)]](https://www.rsc.org/images/entities/char_2009.gif) 1 ligand–zinc binding stoichiometry was estimated from the Job's curve and confirmed by mass spectrometry and NMR spectroscopy analysis. The association constant and the detection limit of the receptor were calculated to be 1.25 × 10⁴ M−1 and 18.2 nM, respectively. The bioimaging experiment demonstrated the efficient membrane permeability and appreciable cell viability of the receptor, which could be successfully utilized for intracellular zinc detection.
1 ligand–zinc binding stoichiometry was estimated from the Job's curve and confirmed by mass spectrometry and NMR spectroscopy analysis. The association constant and the detection limit of the receptor were calculated to be 1.25 × 10⁴ M−1 and 18.2 nM, respectively. The bioimaging experiment demonstrated the efficient membrane permeability and appreciable cell viability of the receptor, which could be successfully utilized for intracellular zinc detection.
Hu et al.337 reported the naphthalene-based “turn-on” fluorescence sensor 243 (Fig. 207) for zinc ion detection. The ligand did not show any emission signal in the range of 400–500 nm in the absence of zinc ions, whereas zinc addition triggered a strong emission signal at 480 nm. The fluorescence intensity at 480 nm gradually increased on increasing the concentration of zinc ions along with a colorimetric change in the reaction solution, which could be visualized by the naked eye. The detection limit of the receptor for naked eye detection as well as for fluorescent zinc detection were found to be 5.0 × 10⁻⁷ M and 9.3 × 10⁻⁸ M, respectively. The 1![[thin space (1/6-em)]](https://www.rsc.org/images/entities/char_2009.gif) :
:![[thin space (1/6-em)]](https://www.rsc.org/images/entities/char_2009.gif) 1 ligand–zinc binding stoichiometry was calculated from the Job's curve, FT-IR, mass spectrometry and NMR spectroscopy.
1 ligand–zinc binding stoichiometry was calculated from the Job's curve, FT-IR, mass spectrometry and NMR spectroscopy.
Park et al.338 reported the naphthalene-based chemosensor 244 (Fig. 208) for zinc ion detection. The ligand alone exhibited a weak fluorescence emission signal when it was excited at 410 nm. Zinc addition caused the appearance of a strong fluorescence signal at 525 nm, and the intensity of this signal increased linearly depending on the concentration of the added zinc ions. Similarly, the ligand showed an absorption signal at 400 nm in the absence of zinc ions, whereas zinc addition triggered the red-shifted absorption signal at 425 nm along with two clear isosbestic points at 352 and 407 nm, indicating the successful complexation process between the receptor and zinc ion. The Job's plot indicates the 2![[thin space (1/6-em)]](https://www.rsc.org/images/entities/char_2009.gif) :
:![[thin space (1/6-em)]](https://www.rsc.org/images/entities/char_2009.gif) 1 ligand–receptor binding stoichiometry, which was further confirmed by mass spectrometry and NMR titration spectral analysis. The association constant and the detection limit of the receptor were found to be 1.0 × 10⁹ M−2 and 3.3 × 10⁻⁶ M, respectively. Moreover, the ligand was successfully applied to intracellular zinc detection by employing fibroblasts cultured under a confocal fluorescence microscope.
1 ligand–receptor binding stoichiometry, which was further confirmed by mass spectrometry and NMR titration spectral analysis. The association constant and the detection limit of the receptor were found to be 1.0 × 10⁹ M−2 and 3.3 × 10⁻⁶ M, respectively. Moreover, the ligand was successfully applied to intracellular zinc detection by employing fibroblasts cultured under a confocal fluorescence microscope.
4.4. Naphthol-based Zn2+ sensors
Helal et al.339 reported the naphthol-thiazole-based ratiometric zinc ion sensor 245 (Fig. 209). The probe exhibited a decrease in the absorption signal at 314 nm with the concomitant appearance of a red-shifted signal at 425 nm and another signal at 328 nm with the maximum intensity, and this high intensity signal was attributed to the ICT from naphthol to pyridine moiety. The 1![[thin space (1/6-em)]](https://www.rsc.org/images/entities/char_2009.gif) :
:![[thin space (1/6-em)]](https://www.rsc.org/images/entities/char_2009.gif) 1 binding stoichiometry was assessed by the method of continuous variation. Similarly, the addition of zinc ions caused a continuous decrease in the emission signal at 421 nm with a progressive increase in the red-shifted emission band at 561 nm. The fluorescence titration experiment displayed a clear isoemissive point at 513 nm, which showed the successful complexation between the ligand and zinc ion.
1 binding stoichiometry was assessed by the method of continuous variation. Similarly, the addition of zinc ions caused a continuous decrease in the emission signal at 421 nm with a progressive increase in the red-shifted emission band at 561 nm. The fluorescence titration experiment displayed a clear isoemissive point at 513 nm, which showed the successful complexation between the ligand and zinc ion.
Zhang et al.340 reported the naphthyl-based fluorescence chemosensor 246 (Fig. 210) for selective zinc detection. The ligand exhibited an emission signal around 451 nm when it was excited at 400 nm, whereas zinc addition caused a remarkable enhancement in the emission signal intensity at 451 nm along with 3 nm blue-shifts in the spectrum. The fluorescence titration experiment showed the saturation of the emission signal at 448 nm at 0.5 equivalent zinc ion concentrations, indicating the 2![[thin space (1/6-em)]](https://www.rsc.org/images/entities/char_2009.gif) :
:![[thin space (1/6-em)]](https://www.rsc.org/images/entities/char_2009.gif) 1 ligand–zinc complexation stoichiometry. Moreover, the ligand behaved reversibly toward the zinc ion as assessed by the addition of H2PO4− into the ligand–metal complex solution, which reversed the original ligand optical response, indicating the decomplexation reaction.
1 ligand–zinc complexation stoichiometry. Moreover, the ligand behaved reversibly toward the zinc ion as assessed by the addition of H2PO4− into the ligand–metal complex solution, which reversed the original ligand optical response, indicating the decomplexation reaction.
 | ||
| Fig. 210 Chemical structure of receptor 246, proposed ligand–zinc complexation mechanism and reversibility. | ||
Hsieh et al.341 introduced the Schiff base fluorescence sensor 247 (Fig. 211) for zinc ion detection. The probe displayed a very weak emission signal at 450 nm in the absence of zinc ions when the excitation wave was fixed at 308 nm. However, zinc addition triggered a strong emission signal along with a colorimetric change in the reaction solution from colorless to blue under a UV lamp, which indicated it might be useful for naked eye zinc detection. The 1![[thin space (1/6-em)]](https://www.rsc.org/images/entities/char_2009.gif) :
:![[thin space (1/6-em)]](https://www.rsc.org/images/entities/char_2009.gif) 1 ligand–zinc binding stoichiometry was calculated by the method of continuous variation and was further confirmed by the mass spectrometry analysis and NMR titration experiment. The association constant and detection limit of the receptor toward zinc ions were calculated to be 1.23 × 10⁷ M−1 and 4.89 × 10⁻⁸ M, respectively.
1 ligand–zinc binding stoichiometry was calculated by the method of continuous variation and was further confirmed by the mass spectrometry analysis and NMR titration experiment. The association constant and detection limit of the receptor toward zinc ions were calculated to be 1.23 × 10⁷ M−1 and 4.89 × 10⁻⁸ M, respectively.
4.5. Naphthalimide-based Zn2+ sensors
Kim et al.342 reported naphthalimide-based fluorescent chemosensor 248 (Fig. 212) for zinc ion addition. The receptor showed a considerable variation in the emission signal intensity at 394 nm when it was excited at 335 nm on metallic addition. The ligand exhibited a ratiometric increase in the fluorescence emission signal intensity at 394 nm due to inhibition of the PET process. The chain length between the metal binding site and the fluorophore unit had a direct effect on the efficiency of the receptor due to inhibition of the PET process by different extents. A shorter linker length resulted in a more efficient PET process, which also directly influenced the sensitivity and selectivity of the sensor.Zhao et al.343 reported the naphthalimide-based fluorescent sensor 249 (Fig. 213) for zinc detection. The probe exhibited an absorption signal at 397 nm, which was red-shifted on different metallic ion additions without any selectivity. Moreover, the ligand exhibited a very weak emission band at 518 nm. However, only zinc ions caused the significant “turn-on” fluorescence response at 556 nm with a 38 nm red-shift in the spectral position. The fluorescence change in the ligand can be visualized by the naked eye under a UV lamp by illuminating at a higher wavelength, which could be used for naked eye zinc detection. The 1![[thin space (1/6-em)]](https://www.rsc.org/images/entities/char_2009.gif) :
:![[thin space (1/6-em)]](https://www.rsc.org/images/entities/char_2009.gif) 1 ligand–zinc binding stoichiometry was calculated from the Job's curve, mass spectrometry analysis and NMR titration experiment. The dissociation constant and detection limit were found to be 3.02 × 10³ M−1 and 1.03 × 10⁻⁶ M, respectively. The ligand was further employed in the bioimaging experiment, employing HepG2 cells. The appearance of bright green fluorescence from the ligand mixed cells upon incubation with zinc ions demonstrated the efficient viability of the receptor for intracellular zinc detection.
1 ligand–zinc binding stoichiometry was calculated from the Job's curve, mass spectrometry analysis and NMR titration experiment. The dissociation constant and detection limit were found to be 3.02 × 10³ M−1 and 1.03 × 10⁻⁶ M, respectively. The ligand was further employed in the bioimaging experiment, employing HepG2 cells. The appearance of bright green fluorescence from the ligand mixed cells upon incubation with zinc ions demonstrated the efficient viability of the receptor for intracellular zinc detection.
Xu et al.344 reported the naphthalimide-based fluorophore 250 (Fig. 214) as a sensor for metal ion detection. Zinc addition into the probe solution caused a 22-fold enhancement in the fluorescence emission signal intensity at 514 nm, whereas cadmium ion addition caused a blue-shift and signal enhancement at 446 nm along with a colorimetric change in the reaction solution. The Job's plot indicates the 1![[thin space (1/6-em)]](https://www.rsc.org/images/entities/char_2009.gif) :
:![[thin space (1/6-em)]](https://www.rsc.org/images/entities/char_2009.gif) 1 ligand–metal binding stoichiometry and the Benesi–Hildebrand equation revealed the dissociation constant values of 5.7 nM and 48.5 nM for Zn2+ and Cd2+, respectively. The response of the probe toward the metal ions was greatly affected by the nature of the media. In 100% CH3CN media, Zn2+ and Cd2+ caused a blue-shift in the spectral position, whereas the addition of Zn2+ and Cd2+ to the probe in 100% DMSO caused red-shifts in the spectral position. The Job's curve, mass spectrometry and NMR titration experiment provided the evidence about the different operational protocol of the receptor toward metal binding in the different media. As a good metal ion reporter, the probe was further employed for intracellular metal ion detection in a bioimaging experiment. The appearance of bright fluorescence from the live cells and organism without any deformation indicated the appreciable membrane permeability and high viability of the resulting sensor for the analysis of biological samples.
1 ligand–metal binding stoichiometry and the Benesi–Hildebrand equation revealed the dissociation constant values of 5.7 nM and 48.5 nM for Zn2+ and Cd2+, respectively. The response of the probe toward the metal ions was greatly affected by the nature of the media. In 100% CH3CN media, Zn2+ and Cd2+ caused a blue-shift in the spectral position, whereas the addition of Zn2+ and Cd2+ to the probe in 100% DMSO caused red-shifts in the spectral position. The Job's curve, mass spectrometry and NMR titration experiment provided the evidence about the different operational protocol of the receptor toward metal binding in the different media. As a good metal ion reporter, the probe was further employed for intracellular metal ion detection in a bioimaging experiment. The appearance of bright fluorescence from the live cells and organism without any deformation indicated the appreciable membrane permeability and high viability of the resulting sensor for the analysis of biological samples.
4.6. Porphyrin-based Zn2+ sensor
Li et al.345 reported the porphyrin-based fluorescent chemosensor 251 (Fig. 215) for zinc detection. The probe alone showed a fluorescence emission signal at 650 nm due to the porphyrin moiety. Zinc addition caused a remarkable increase in the emission signal at 605 nm with a concomitant decrease in the emission signal intensity at 650 nm when it was excited at 418 nm. Similarly, the probe showed a high intensity absorption signal at 415 nm but a weak absorption signal at 512 nm. Zinc addition caused a red-shift in both the absorption bands from 415 to 432 nm in the former case, and 512 to 557 nm in the latter case. The Job's plot indicates the 1![[thin space (1/6-em)]](https://www.rsc.org/images/entities/char_2009.gif) :
:![[thin space (1/6-em)]](https://www.rsc.org/images/entities/char_2009.gif) 1 ligand–zinc binding stoichiometry with the association constant values of K = 1.04 × 10⁵. The sensitivity of the probe toward zinc ions was found to be 5.5 × 10⁻⁸ M.
1 ligand–zinc binding stoichiometry with the association constant values of K = 1.04 × 10⁵. The sensitivity of the probe toward zinc ions was found to be 5.5 × 10⁻⁸ M.
4.7. Schiff base Zn2+ sensors
Li et al.346 reported the Schiff base derivative 252 (Fig. 216) as a “turn-on” chemosensor for zinc ions. The probe exhibited UV-visible absorption signals at 322 and 383 nm, which drastically decreased in intensity on zinc ion addition. In contrast, zinc addition caused an increase in the fluorescence emission signal at 470 nm with a 40-fold enhancement in the signal intensity. The 1![[thin space (1/6-em)]](https://www.rsc.org/images/entities/char_2009.gif) :
:![[thin space (1/6-em)]](https://www.rsc.org/images/entities/char_2009.gif) 1 ligand–metal binding stoichiometry was calculated from the Job's curve, and the results were consistent with the data obtained from the mass spectrometry analysis. The limit of detection and Ka values of the probe toward zinc binding were found to be 25 nmol L−1 and 6.6, respectively. Furthermore, the appearance of a bright blue fluorescence from the live HeLa cells on incubation of the ligand mixed cells with the zinc ions demonstrated the potential applicability of the probe for intracellular zinc detection.
1 ligand–metal binding stoichiometry was calculated from the Job's curve, and the results were consistent with the data obtained from the mass spectrometry analysis. The limit of detection and Ka values of the probe toward zinc binding were found to be 25 nmol L−1 and 6.6, respectively. Furthermore, the appearance of a bright blue fluorescence from the live HeLa cells on incubation of the ligand mixed cells with the zinc ions demonstrated the potential applicability of the probe for intracellular zinc detection.
Park et al.347 reported the Schiff base “off–on” sensor 253 (Fig. 217) for selective zinc detection. The probe exhibited a very weak fluorescence emission signal when it was excited at 390 nm, while zinc ion addition triggered a strong fluorescence emission signal with the maximum emission signal intensity at 517 nm. Similarly, the ligand exhibited a UV-visible absorption signal at 377 nm, which underwent a 40 nm red-shift to the new position at 417 nm on zinc ion addition. The UV-visible titration experiment yielded a clear isosbestic point at 392 nm, indicating the undoubted transformation of the receptor into the receptor–zinc complex. The 2![[thin space (1/6-em)]](https://www.rsc.org/images/entities/char_2009.gif) :
:![[thin space (1/6-em)]](https://www.rsc.org/images/entities/char_2009.gif) 1 ligand–zinc binding stoichiometry was calculated by the method of continuous variation along with the association constant values of 5.0 × 10⁹ M−1. Determination of the mechanism of action was further assisted by the NMR titration and mass spectrometry analysis. Moreover, the sensitivity of the sensor toward zinc ions was calculated to be 68 nM. Furthermore, the ligand behaved reversibly on EDTA addition, as seen by the quenching of the strong fluorescence of the ligand–zinc complex on EDTA addition.
1 ligand–zinc binding stoichiometry was calculated by the method of continuous variation along with the association constant values of 5.0 × 10⁹ M−1. Determination of the mechanism of action was further assisted by the NMR titration and mass spectrometry analysis. Moreover, the sensitivity of the sensor toward zinc ions was calculated to be 68 nM. Furthermore, the ligand behaved reversibly on EDTA addition, as seen by the quenching of the strong fluorescence of the ligand–zinc complex on EDTA addition.
Park et al.348 reported the multifunctional Schiff base chemosensor 254 (Fig. 218) for metal ion detection. The probe solution was almost colorless, while metal addition caused a colorimetric change in the reaction solution along with shifts in the absorption signal with a clear isosbestic point and a momentous variation in the emission signal intensity. The 1![[thin space (1/6-em)]](https://www.rsc.org/images/entities/char_2009.gif) :
:![[thin space (1/6-em)]](https://www.rsc.org/images/entities/char_2009.gif) 1 ligand–metal binding stoichiometry was found by the method of continuous variation and mass spectrometry analysis. Further mechanistic insight was obtained through the NMR titration experiment.
1 ligand–metal binding stoichiometry was found by the method of continuous variation and mass spectrometry analysis. Further mechanistic insight was obtained through the NMR titration experiment.
Udhayakumari et al.349 reported a Schiff base derivative 255 (Fig. 219) for the fluorescent detection of zinc ions in aqueous medium. The ligand exhibited the three types of transition in the absence of zinc ions, while zinc addition caused a new high intensity absorption signal at 380 nm. Titration of the receptor with zinc ions caused a colorimetric change in the reaction solution along with a clear isosbestic point appearing at 363 nm, indicating that there were two species present in reaction mixture. The absorption titration resulted in a gradual decrease of the signal intensities at 265 and 345 nm and a progressive increase in the signal intensities at 240 and 295 nm along with the appearance of a new band at 385 nm on 0.8 equivalent zinc addition. The Job's plot indicates the 1![[thin space (1/6-em)]](https://www.rsc.org/images/entities/char_2009.gif) :
:![[thin space (1/6-em)]](https://www.rsc.org/images/entities/char_2009.gif) 1 ligand–metal binding stoichiometry with a binding constant value of 2.87 × 10⁴.
1 ligand–metal binding stoichiometry with a binding constant value of 2.87 × 10⁴.
Lee et al.350 reported the Schiff base multifunctional chemosensor 256 (Fig. 220) for metal ion detection. The probe showed a colorimetric change upon manganese ion addition and a fluorogenic change on Zn2+ and Al3+ addition. The receptor exhibited a very weak emission signal when excited at 381 nm. Aluminum and zinc ion additions triggered an emission signal centered at 465 and 440 nm with a 108-fold and 154-fold enhancement in the signal intensity, respectively. Similarly, the zinc ion addition caused a decrease in the absorption signal at 353 nm and an increase in the signal at 371 nm. The absorption titration resulted in the emergence of a clear isosbestic point at 359 nm, which indicated the well-defined complexation process between the receptor and zinc ion. On Al3+ addition, there was a decrease in the signal intensity at 353 nm along with the appearance of a new absorption signal at 377 nm. The titration experiment resulted in the appearance of an isosbestic point at 364 nm on the increasing addition of Al3+. The 1![[thin space (1/6-em)]](https://www.rsc.org/images/entities/char_2009.gif) :
:![[thin space (1/6-em)]](https://www.rsc.org/images/entities/char_2009.gif) 1 ligand–metal binding stoichiometries were calculated from the Job's curve, mass spectrometry analysis and NMR titration experiment. The association constant of the receptor toward Zn2+ and Al3+ binding were calculated using the Benesi–Hildebrand equation as 9.24 × 10⁴ M−1 and 3.81 × 10⁴ M−1, respectively. The ligand showed an appreciably low detection limit of 14.3 and 28.5 nM, respectively, for Zn2+ and Al3+.
1 ligand–metal binding stoichiometries were calculated from the Job's curve, mass spectrometry analysis and NMR titration experiment. The association constant of the receptor toward Zn2+ and Al3+ binding were calculated using the Benesi–Hildebrand equation as 9.24 × 10⁴ M−1 and 3.81 × 10⁴ M−1, respectively. The ligand showed an appreciably low detection limit of 14.3 and 28.5 nM, respectively, for Zn2+ and Al3+.
Wu et al.351 introduced a Schiff base derivative 257 (Fig. 221) as a fluorescent sensor for zinc ion detection. Zinc ion addition triggered the fluorescence emission signal at 534 nm when the excitation was fixed at 451 nm. The emission signal intensity at 534 nm increased linearly depending on the concentration of the zinc ion and this finding suggested the applicability of the receptor as a sensor for ratiometric zinc ion detection. However, Hg2+ addition caused a quenching of the fluorescence arising from the probe–zinc complex due to the formation of a new complex between the receptor and Hg2+. Similarly, Hg2+ addition caused a blue-shift in the absorption signal position from 451 to 422 nm, which was due to the engagement of the receptor toward the new complexation process with the mercuric ion.
4.8. Macrocyclic ligand as a Zn2+ sensor
Shen et al.352 reported polyimine macrocyclic ligand 258 (Fig. 222) for selective zinc detection. The probe exhibited a fluorescence emission signal at 370 nm, although a few metal ions caused a slight variation in this emission band. Interestingly, zinc addition caused the emergence of a new high intensity signal at 470 nm with a 100 nm red-shift in the spectrum along with a colorimetric change in the reaction solution under a UV lamp on illuminating at 365 nm. Similarly, the ligand exhibited UV-visible absorption signals at 308 and 350 nm in the acetonitrile solvent. Zinc addition caused a gradual increase in the absorption signals at 285 and 308 nm along with the appearance of two isosbestic points at 298 and 318 nm. Moreover, zinc addition triggered a new absorption band centered at 400 nm, whose intensity increased ratiometrically on the increasing addition of zinc ions. The Job's plot was constructed by employing the UV-visible titration graph and utilizing the absorption maxima at 400 nm, which indicate the 1![[thin space (1/6-em)]](https://www.rsc.org/images/entities/char_2009.gif) :
:![[thin space (1/6-em)]](https://www.rsc.org/images/entities/char_2009.gif) 1 ligand–zinc binding stoichiometry along with the binding constant value of 1.53 × 10⁵ M−1. Determination of the binding mechanism was further assisted by the NMR titration experiment.
1 ligand–zinc binding stoichiometry along with the binding constant value of 1.53 × 10⁵ M−1. Determination of the binding mechanism was further assisted by the NMR titration experiment.
4.9. Triazole-based Zn2+ sensor
Gusev et al.353 reported the triazole-based fluorescent sensor 259 (Fig. 223) for zinc ion detection. The ligand exhibited UV-visible absorption signals at 282, 347, 398 nm, whereas zinc/cadmium triggered the new absorption band at 407 nm along with a colorimetric change in the reaction solution. Similarly, zinc addition triggered a new emission band at 502 nm, whereas some of the competing metallic additions caused a quenching of the emission band at 429 nm. However, there was a precise selectivity by the probe toward zinc ions at the emission maxima of 502 nm. The Job's plot indicated the 1![[thin space (1/6-em)]](https://www.rsc.org/images/entities/char_2009.gif) :
:![[thin space (1/6-em)]](https://www.rsc.org/images/entities/char_2009.gif) 1 binding stoichiometry of the ligand–zinc complex along with the binding constant value of 1.78 × 10⁶ M−1. Further mechanistic insight was obtained from the NMR spectral analysis.
1 binding stoichiometry of the ligand–zinc complex along with the binding constant value of 1.78 × 10⁶ M−1. Further mechanistic insight was obtained from the NMR spectral analysis.
4.10. Tetrazole-based Zn2+ sensor
Ding et al.354 reported the tetrazole derivative 260 (Fig. 224) as a fluorescence sensor for zinc and aluminum ions. The ligand exhibited a very weak fluorescence emission signal in the absence of metal ions, whereas zinc ion addition caused a significant enhancement in the fluorescence emission signal intensity at 483 nm using DMF solvent. Similarly, Al3+ triggered a high intensity emission signal at 470 nm in DMSO, and there was no such signal enhancement at this region by the competing metallic ions addition at a fixed excitation of 420 nm. The 1![[thin space (1/6-em)]](https://www.rsc.org/images/entities/char_2009.gif) :
:![[thin space (1/6-em)]](https://www.rsc.org/images/entities/char_2009.gif) 1 ligand–metal binding stoichiometry was calculated by the method of continuous variation and was further confirmed by the mass spectrometry, computational and NMR titration analyses. Moreover, the ligand was successfully employed in the bioimaging experiment using HeLa cell lines and displayed satisfactory results.
1 ligand–metal binding stoichiometry was calculated by the method of continuous variation and was further confirmed by the mass spectrometry, computational and NMR titration analyses. Moreover, the ligand was successfully employed in the bioimaging experiment using HeLa cell lines and displayed satisfactory results.
4.11. Thiazole-based Zn2+ sensor
Gogoi et al.355 introduced the benzothiazole-based probe 261 (Fig. 225) for the fluorometric and colorimetric detection of metal ions. The ligand showed the absorption maxima at 380 nm in the absence of metal ions, while zinc ion addition triggered a new absorption band at 422 nm with the concurrent disappearance of the absorption peak at 380 nm. The absorption titration of the probe with the sequential addition of zinc ion caused a gradual decrease in the absorption signal intensity at 380 nm along with the appearance of a new red-shifted signal at 442 nm. The appearance of two clear isosbestic points at 405 and 324 nm evidenced the successful complexation between the receptor and the zinc ion. Similarly, the ligand showed emission signals at 426 and 495 nm due to excited state intramolecular proton transfer mechanism. Zinc ion addition caused the emergence of a red-shifted emission band at 510 nm along with a colorimetric change in the reaction solution from colorless to yellow green. The 1![[thin space (1/6-em)]](https://www.rsc.org/images/entities/char_2009.gif) :
:![[thin space (1/6-em)]](https://www.rsc.org/images/entities/char_2009.gif) 1 ligand–zinc binding stoichiometry was calculated from the Job's curve, mass spectrometry, computational and NMR titration measurements. The ligand exhibited the dissociation constant and detection limit values of 1.3 × 10⁴ M−1 and 6.5 × 10⁻⁷, respectively. Moreover, the ligand was further employed to explore its applicability for use with molecular logic gates.
1 ligand–zinc binding stoichiometry was calculated from the Job's curve, mass spectrometry, computational and NMR titration measurements. The ligand exhibited the dissociation constant and detection limit values of 1.3 × 10⁴ M−1 and 6.5 × 10⁻⁷, respectively. Moreover, the ligand was further employed to explore its applicability for use with molecular logic gates.
4.12. Oxadiazole-based Zn2+ sensor
Qian et al.356 introduced the oxadiazole-based fluorescent sensor 262 (Fig. 226) for zinc ion detection. The probe showed two main absorption bands at 496 and 350 nm in the absence of zinc ions, while zinc addition caused a reduction in the intensity of the band at 496 nm, accompanied by an evident hypsochromic shift from 496 to 478 nm. The absorption titration with the zinc ions revealed three distinct isosbestic points at 453, 375, and 323, implying successful complexation between the receptor and zinc ion. The dissociation constant of the receptor toward the zinc ion was found to be 2 nM, and the 1![[thin space (1/6-em)]](https://www.rsc.org/images/entities/char_2009.gif) :
:![[thin space (1/6-em)]](https://www.rsc.org/images/entities/char_2009.gif) 1 ligand–zinc binding stoichiometry was found from the Job's curve, mass spectrometry and NMR titration analysis. Similarly, the probe exhibited an emission maxima at 550 nm when it was excited at 469 nm, thus evidencing the complexation process. The ligand was further employed in the bioimaging experiment to explore its applicability for intracellular zinc detection and displayed satisfactory results.
1 ligand–zinc binding stoichiometry was found from the Job's curve, mass spectrometry and NMR titration analysis. Similarly, the probe exhibited an emission maxima at 550 nm when it was excited at 469 nm, thus evidencing the complexation process. The ligand was further employed in the bioimaging experiment to explore its applicability for intracellular zinc detection and displayed satisfactory results.
4.13. Coumarin-based Zn2+ sensor
Hou et al.357 reported the coumarin-based multifunctional fluorescent sensor containing di-2-picolylamine moieties 263 (Fig. 227) for the multiple detection of cations and anions. The probe exhibited a strong fluorescence emission signal at 500 nm, which was red-shifted from 500 to 505 nm upon the addition of cadmium ions, whereas zinc ions induced a 16 nm red-shift in the spectrum from 500 to 516 nm. These different values of spectral shifting in the presence of cadmium and zinc can be utilized to discriminate between these two metallic species. Interestingly, the addition of copper and cobalt caused complete quenching of the probe emission. The fluorescence titration graph yielded the 1![[thin space (1/6-em)]](https://www.rsc.org/images/entities/char_2009.gif) :
:![[thin space (1/6-em)]](https://www.rsc.org/images/entities/char_2009.gif) 1 ligand–cobalt complex stoichiometry along with the binding constant value of 2.8 × 10⁵ M−1. In the case of the competitive ions experiment with the ligand–cobalt complex, zinc triggered the fluorescence enhancement of the resulting complex by the appearance of emission maxima at 516 nm, whereas cadmium addition caused a moderate reinforcement at 507 nm. The detection limit of the zinc ions by the ligand–cobalt complex was calculated to be 5.7 × 10⁻⁷ M. The calculated values of the association constants for the ligand–cobalt–zinc and ligand–zinc complexes were found to be 1.2 × 10⁴ M−1 and 3.4 × 10⁹ M−1, respectively. The 1
1 ligand–cobalt complex stoichiometry along with the binding constant value of 2.8 × 10⁵ M−1. In the case of the competitive ions experiment with the ligand–cobalt complex, zinc triggered the fluorescence enhancement of the resulting complex by the appearance of emission maxima at 516 nm, whereas cadmium addition caused a moderate reinforcement at 507 nm. The detection limit of the zinc ions by the ligand–cobalt complex was calculated to be 5.7 × 10⁻⁷ M. The calculated values of the association constants for the ligand–cobalt–zinc and ligand–zinc complexes were found to be 1.2 × 10⁴ M−1 and 3.4 × 10⁹ M−1, respectively. The 1![[thin space (1/6-em)]](https://www.rsc.org/images/entities/char_2009.gif) :
:![[thin space (1/6-em)]](https://www.rsc.org/images/entities/char_2009.gif) 1 ligand–metal binding stoichiometry was further confirmed by the mass spectrometry analysis. The quenched fluorescence spectra of the probe–copper complex exhibited a turn-on fluorescence response upon sulfide ion addition, which might be useful for sulfide ion detection employing the corresponding complex. The appearance of blue fluorescence from live HeLa cells on incubation with the receptor indicated the successful applicability of the resulting probe for intracellular metal detection.
1 ligand–metal binding stoichiometry was further confirmed by the mass spectrometry analysis. The quenched fluorescence spectra of the probe–copper complex exhibited a turn-on fluorescence response upon sulfide ion addition, which might be useful for sulfide ion detection employing the corresponding complex. The appearance of blue fluorescence from live HeLa cells on incubation with the receptor indicated the successful applicability of the resulting probe for intracellular metal detection.
4.14. Azobenzene-based Zn2+ sensor
Wang et al.358 introduced a reversible fluorescence turn-on and colorimetric recognition probe 228 (Fig. 204) based on an azobenzene derivative. The probe was colorless and non-emissive in the absence of zinc ions, whereas zinc addition triggered a strong emission signal at 610 nm along with a colorimetric change in the reaction solution from light yellow to reddish orange, which might be useful for the naked eye zinc detection. The probe behaved reversibly on the addition of EDTA solution due to the snatching of zinc ions from the probe–zinc adduct after the involvement of zinc ions in the new complexation process with EDTA. The 1![[thin space (1/6-em)]](https://www.rsc.org/images/entities/char_2009.gif) :
:![[thin space (1/6-em)]](https://www.rsc.org/images/entities/char_2009.gif) 1 ligand–metal complexation stoichiometry was found from the method of continuous variation and the association constant of 4.0 × 10⁵ M−2 was calculated by a least squares fitting analysis. Further mechanistic insight was obtained from the mass spectrometry analysis by the appearance of a signal at m/z 825.2 due to probe–Zn2+ (Fig. 228).
1 ligand–metal complexation stoichiometry was found from the method of continuous variation and the association constant of 4.0 × 10⁵ M−2 was calculated by a least squares fitting analysis. Further mechanistic insight was obtained from the mass spectrometry analysis by the appearance of a signal at m/z 825.2 due to probe–Zn2+ (Fig. 228).
4.15. Spiropyran-based Zn2+ sensors
Natali et al.359 reported a spiropyran-based fluorescent and photoregenerable receptor 229 (Fig. 205) for selective zinc ion detection. The probe exhibited a zinc-induced colorimetric and optical change in the reaction solution by turning from colorless to orange, as well as by the appearance of new absorption signal at 504 nm. Similarly, only the probe–zinc complex exhibited a strong emission band at 624 nm when it was excited at 492 nm, while there was no emission signal appearance in the presence of the various competing metallic species. The Job's plot indicated the 1![[thin space (1/6-em)]](https://www.rsc.org/images/entities/char_2009.gif) :
:![[thin space (1/6-em)]](https://www.rsc.org/images/entities/char_2009.gif) 1 binding stoichiometry of the resulting complex along with the K values of 1.6 × 10⁴ M−1, and this complexation stoichiometry was further confirmed by the NMR spectral analysis (Fig. 229).
1 binding stoichiometry of the resulting complex along with the K values of 1.6 × 10⁴ M−1, and this complexation stoichiometry was further confirmed by the NMR spectral analysis (Fig. 229).
Zhu et al.360 reported the quinoline-based spiropyran derivative 230 (Fig. 211) as a chemosensor for zinc ions. Zinc ion addition into the ligand solution caused the emergence of two broad absorption peaks at 380 and 540 nm. The titration of the ligand solution with the increasing concentration of zinc ions caused a gradual increase in the absorption signal intensity of these two signals, allowing ratiometric zinc ion detection by the probe. On the basis of a nonlinear fitting analysis, the binding constant of the receptor was calculated to be 7.2 × 10⁴ M−1. The 1![[thin space (1/6-em)]](https://www.rsc.org/images/entities/char_2009.gif) :
:![[thin space (1/6-em)]](https://www.rsc.org/images/entities/char_2009.gif) 1 ligand–metal binding stoichiometry was calculated from the Job's curve, which showed the maximum intensity with the 0.5 mole fraction. Further mechanistic insight was obtained through mass spectrometry analysis and NMR titration experiment. Similarly, the ligand exhibited a 170-fold enhancement in the emission signal intensity at 645 nm on 5 equivalents zinc addition when it was excited at 520 nm. The fluorescence titration of the ligand solution with zinc ions triggered the clear isoemissive point, indicating the successful binding between the ligand and zinc ion (Fig. 230).
1 ligand–metal binding stoichiometry was calculated from the Job's curve, which showed the maximum intensity with the 0.5 mole fraction. Further mechanistic insight was obtained through mass spectrometry analysis and NMR titration experiment. Similarly, the ligand exhibited a 170-fold enhancement in the emission signal intensity at 645 nm on 5 equivalents zinc addition when it was excited at 520 nm. The fluorescence titration of the ligand solution with zinc ions triggered the clear isoemissive point, indicating the successful binding between the ligand and zinc ion (Fig. 230).
Zhu et al.361 reported the spirobenzopyran-based fluorescent sensor 231 (Fig. 214) for the ratiometric detection of zinc ions. The binding of the ligand with zinc ions was assessed by fluorescence spectral measurements and colorimetric analysis. The gradual addition of zinc ions into the probe solution caused a decrease in the weak emission signal at 560 nm with a concomitant appearance of new emission band at 665 nm. The titration experiment displayed a clear isoemissive point at 585 nm, indicating that the two species were in equilibrium in the reaction solution. The 1![[thin space (1/6-em)]](https://www.rsc.org/images/entities/char_2009.gif) :
:![[thin space (1/6-em)]](https://www.rsc.org/images/entities/char_2009.gif) 1 ligand–zinc binding stoichiometry was calculated by the method of continuous variation and was further confirmed by the mass spectrometry analysis and NMR titration experiment. The probe exhibited the binding constant value of (1.34 ± 0.70) × 10−7 M and a nanomolar detection sensitivity toward zinc ions (Fig. 231).
1 ligand–zinc binding stoichiometry was calculated by the method of continuous variation and was further confirmed by the mass spectrometry analysis and NMR titration experiment. The probe exhibited the binding constant value of (1.34 ± 0.70) × 10−7 M and a nanomolar detection sensitivity toward zinc ions (Fig. 231).
4.16. Cyanine-based Zn2+ sensor
Guo et al.362 introduced the highly sensitive and selective cyanine-based fluorescent sensor 232 (Fig. 217) for zinc ion detection in extracellular and intracellular media. The probe showed a high intensity absorption signal at 670 nm in the absence of metallic ions, whereas zinc addition caused a successive decrease in the absorption signal at 670 nm along with the appearance of a new short wavelength absorption band at 510 nm. The absorption titration caused the appearance of a clear isosbestic point at 560 nm and a colorimetric change in the reaction solution from blue to light red. Similarly, zinc addition caused a decrease in the higher wavelength emission signal at 730 nm with a concomitant increase in the emission signal at 590 nm along with the appearance of a clear isoemissive point. The 1![[thin space (1/6-em)]](https://www.rsc.org/images/entities/char_2009.gif) :
:![[thin space (1/6-em)]](https://www.rsc.org/images/entities/char_2009.gif) 1 binding stoichiometry between the ligand and zinc ion was confirmed by the Job's curve, mass spectrometry analysis and NMR titration experiment. The apparent dissociation constant of the probe toward zinc ions was found to be 1.2 nM. The probe could detect zinc ions in a nanomolar concentration level. Moreover, to explore the practical utility of the prepared receptor for intracellular zinc detection, a bioimaging experiment was conducted to monitor endogenous zinc ions released during apoptosis and to trace intact Zn2+ during zebrafish development (Fig. 232).
1 binding stoichiometry between the ligand and zinc ion was confirmed by the Job's curve, mass spectrometry analysis and NMR titration experiment. The apparent dissociation constant of the probe toward zinc ions was found to be 1.2 nM. The probe could detect zinc ions in a nanomolar concentration level. Moreover, to explore the practical utility of the prepared receptor for intracellular zinc detection, a bioimaging experiment was conducted to monitor endogenous zinc ions released during apoptosis and to trace intact Zn2+ during zebrafish development (Fig. 232).
4.17. Fluorescein-based Zn2+ sensor
An et al.363 reported the fluorescein-based “turn-on” sensor 233 (Fig. 218) for zinc ion detection. The probe alone exhibited an absorption signal at 323 nm, whereas zinc addition caused a constant decrease in the intensity of this absorption signal with a concomitant appearance of a new absorption signal at 405 nm. The zinc titration led to a colorimetric change in the reaction solution along with the emergence of a clear isosbestic point at 335 nm. The absorption intensity became saturated at 1 equivalent zinc ion addition, evidencing the 1![[thin space (1/6-em)]](https://www.rsc.org/images/entities/char_2009.gif) :
:![[thin space (1/6-em)]](https://www.rsc.org/images/entities/char_2009.gif) 1 ligand–zinc binding stoichiometry. Similarly, zinc addition caused a constant increase in the emission signal intensity at 501 nm when it was excited at 404 nm, representing ratiometric zinc detection by the probe. The detection tendency of the receptor was found to be 6.54 ppb in the mixed aqueous–organic media. Further mechanistic insight was obtained through the Job's curve and mass spectrometry analysis. The probe exhibited a considerably high dissociation constant value of 1.213 × 10⁴ mol−1 (Fig. 233).
1 ligand–zinc binding stoichiometry. Similarly, zinc addition caused a constant increase in the emission signal intensity at 501 nm when it was excited at 404 nm, representing ratiometric zinc detection by the probe. The detection tendency of the receptor was found to be 6.54 ppb in the mixed aqueous–organic media. Further mechanistic insight was obtained through the Job's curve and mass spectrometry analysis. The probe exhibited a considerably high dissociation constant value of 1.213 × 10⁴ mol−1 (Fig. 233).
4.18. Squaraine-based Zn2+ sensors
Huang et al.364 introduced the squaraine-based near-infrared fluorescent probe 234 (Fig. 219) for the ratiometric detection of zinc ions. The probe exhibited an emission band in the near-infrared region centered at 690 nm, which 22 nm red-shifted on zinc ion additions. The zinc titration caused the emergence of a well-defined isoemissive point at 710 nm. The fluorescence emission signal leveled off at 1![[thin space (1/6-em)]](https://www.rsc.org/images/entities/char_2009.gif) :
:![[thin space (1/6-em)]](https://www.rsc.org/images/entities/char_2009.gif) 4 mole ratios. Similarly, zinc addition caused a 15 nm red-shift in the absorption signal from 680 to 695 nm, demonstrating the good affinity of the receptor toward zinc ions. The dissociation constant and the detection limit of the receptor toward the zinc binding were found to be 6.90 × 10⁷ au M−1 and 6.1 × 10⁻⁸ M, respectively. The ligand–zinc binding stoichiometry was estimated from the Job's curve as well as by mass spectrometry analysis (Fig. 234).
4 mole ratios. Similarly, zinc addition caused a 15 nm red-shift in the absorption signal from 680 to 695 nm, demonstrating the good affinity of the receptor toward zinc ions. The dissociation constant and the detection limit of the receptor toward the zinc binding were found to be 6.90 × 10⁷ au M−1 and 6.1 × 10⁻⁸ M, respectively. The ligand–zinc binding stoichiometry was estimated from the Job's curve as well as by mass spectrometry analysis (Fig. 234).
Zhu et al.365 reported the spiropyran-based fluorescent sensor 235 (Fig. 241) for zinc ion detection. Zinc addition caused a decrease in the absorption signal intensity at 230 and 350 nm with the concomitant appearance of a new absorption signal at 240, 380 and 540 nm along with a colorimetric change in the reaction solution. The absorption titration resulted in the appearance of clear isosbestic points at 250, 290 and 360 nm, indicating the undoubted formation of a receptor–zinc complex. The binding constant of the receptor toward zinc was found to be 7.23 × 10⁶ M−1. Similarly, the probe exhibited a very weak fluorescence emission signal at 650 nm when it was excited at 515 nm. However, zinc addition caused a drastic jump in the emission signal intensity at 650 nm due to spiropyran ring opening of the receptor molecule. The 1![[thin space (1/6-em)]](https://www.rsc.org/images/entities/char_2009.gif) :
:![[thin space (1/6-em)]](https://www.rsc.org/images/entities/char_2009.gif) 1 ligand–receptor binding stoichiometry was estimated from the Job's curve, mass spectrometry analysis and NMR titration experiment (Fig. 235).
1 ligand–receptor binding stoichiometry was estimated from the Job's curve, mass spectrometry analysis and NMR titration experiment (Fig. 235).
4.19. Anthracene-based Zn2+ sensor
Ma et al.366 reported the anthracene-based fluorescent sensor 236 (Fig. 220) for selective zinc detection. The probe showed the characteristic emission bands for the anthracene moiety centered at 400, 420 and 445 nm. Zinc addition caused a dramatic enhancement in the emission signal intensity at 497 nm with a concomitant decrease in the structured emission bands. The fluorescence titration experiment on successive addition of zinc ions caused the emergence of a well-defined isoemissive point at 460 nm. The dissociation constant and the detection limit for the probe toward zinc binding were calculated to be 52 × 8 mM and 33.6 nM, respectively. The 1![[thin space (1/6-em)]](https://www.rsc.org/images/entities/char_2009.gif) :
:![[thin space (1/6-em)]](https://www.rsc.org/images/entities/char_2009.gif) 1 ligand–receptor binding stoichiometry was found from the Job's curve and mass spectrometry analysis. Results from the bioimaging experiment indicated the successful applicability of the receptor for intracellular zinc detection (Fig. 236).
1 ligand–receptor binding stoichiometry was found from the Job's curve and mass spectrometry analysis. Results from the bioimaging experiment indicated the successful applicability of the receptor for intracellular zinc detection (Fig. 236).
4.20. Julolidine imidazole-based Zn2+ sensor
Choi et al.367 reported the julolidine imidazole-based fluorescent sensor 237 (Fig. 221) for zinc ion detection. The ligand showed a weak fluorescence emission signal at 370 nm, which was drastically enhanced in intensity on zinc addition, whereas there was no or only a negligible effect from the background tested metal ions. Similarly, zinc titration caused a gradual increase in the absorption signal intensity at 370 nm along with the appearance of two isosbestic points at 327 and 389 nm. The 2![[thin space (1/6-em)]](https://www.rsc.org/images/entities/char_2009.gif) :
:![[thin space (1/6-em)]](https://www.rsc.org/images/entities/char_2009.gif) 1 ligand–zinc binding stoichiometry was calculated from the Job's curve, mass spectrometry analysis and NMR titration experiment. The dissociation constant and the detection limit were calculated to be Ka = 1.0 × 10⁸ M−1 and 15.6 μM, respectively (Fig. 237).
1 ligand–zinc binding stoichiometry was calculated from the Job's curve, mass spectrometry analysis and NMR titration experiment. The dissociation constant and the detection limit were calculated to be Ka = 1.0 × 10⁸ M−1 and 15.6 μM, respectively (Fig. 237).
4.21. Lanthanide chelate as a Zn2+ sensor
Ye et al.368 introduced the lanthanide chelate 274–Tb3+ (Fig. 238) as a luminescence probe for intracellular zinc detection. The probe exhibited a strong absorption signal at 311 nm and a relatively weak signal at 542 nm in the absence of zinc ions. Zinc addition caused a 6-fold enhancement in the fluorescence emission signal intensity of the receptor along with a slight red-shift in the high energy absorption band. The fluorescence titration of the receptor with the probe represents the 1![[thin space (1/6-em)]](https://www.rsc.org/images/entities/char_2009.gif) :
:![[thin space (1/6-em)]](https://www.rsc.org/images/entities/char_2009.gif) 1 ligand–zinc binding stoichiometry. The probe exhibited the association constant and detection limit values of 1.5 × 10⁵ and 4.6 × 10⁻⁹ M, respectively. Moreover, the ligand was successfully applied in the bioimaging experiment in order to trace intracellular zinc levels, utilizing HeLa cell lines.
1 ligand–zinc binding stoichiometry. The probe exhibited the association constant and detection limit values of 1.5 × 10⁵ and 4.6 × 10⁻⁹ M, respectively. Moreover, the ligand was successfully applied in the bioimaging experiment in order to trace intracellular zinc levels, utilizing HeLa cell lines.
 | ||
| Fig. 238 Schematic of the cell loading and luminescence response of 274–Tb3+ chelate to intracellular Zn2+ ions. | ||
4.22. Pyrazoline-based Zn2+ sensor
Gong et al.369 reported the pyrazoline-based fluorescent probe 275 (Fig. 239) for selective zinc detection. The probe showed an absorption signal at 347 nm in the absence of zinc ions. Zinc addition caused a decrease in the absorption signal at 347 nm along with a hypsochromic shift of 31 nm with the concomitant appearance of a new shoulder peak at 375 nm. The absorption titration resulted in the appearance of several isosbestic points at 256, 282, 318 and 370 nm, indicating the successful complexation reaction between the receptor and zinc ion. The 1![[thin space (1/6-em)]](https://www.rsc.org/images/entities/char_2009.gif) :
:![[thin space (1/6-em)]](https://www.rsc.org/images/entities/char_2009.gif) 1 ligand–zinc binding stoichiometry was found by the method of continuous variation and was further supported by mass spectrometry analysis. Similarly, zinc addition caused a drastic increase in the fluorescence emission signal intensity at 480 nm when the excitation wave was fixed at 347 nm. The dissociation constant and detection limit for the receptor toward zinc binding were determined to be 2.5 × 10⁶ M−1 and 4 × 10⁻⁷ M, respectively.
1 ligand–zinc binding stoichiometry was found by the method of continuous variation and was further supported by mass spectrometry analysis. Similarly, zinc addition caused a drastic increase in the fluorescence emission signal intensity at 480 nm when the excitation wave was fixed at 347 nm. The dissociation constant and detection limit for the receptor toward zinc binding were determined to be 2.5 × 10⁶ M−1 and 4 × 10⁻⁷ M, respectively.
4.23. Aniline-based Zn2+ sensor
Mahato et al.370 reported the aniline-based fluorescent sensor 276 (Fig. 240) for zinc detection and further explored its applicability for ATP sensing. The ligand showed absorption bands at 422 and 453 nm in the absence of zinc ions. Zinc addition caused the emergence of a new red-shifted absorption signal at 463 nm along with a colorimetric change in the reaction solution, which arises due to the formation of a ligand–zinc complex. This signal was further red-shifted to 503 nm on the addition of the sodium salt of ATP. Similarly, CTP induced an insignificant shift of 9 nm, while it had a less significant effect on the electronic spectra due to ADP addition. ATP triggered a strong colorimetric change in the ligand–zinc complex solution, whereas a colorimetric change was barely detectable for ADP and CTP.4.24. Pyrrin-based Zn2+ sensor
Ding et al.371 reported the pyrrin-based fluorescent sensor 277 (Fig. 241) for zinc ion detection. Zinc addition caused a gradual decrease in the intensity of the peak centered at 532 nm along with the appearance of a new red-shifted signal at 624 nm, which was attributed to be due to the involvement of the receptor with zinc ion complexation. The detection limit of the sensor toward zinc ions was found to be 4.6 × 10⁻⁸ M, which is low enough for practical applicability. Similarly, zinc ion addition caused a drastic jump in the emission signal intensity of the receptor at 637 nm when it was excited at 568 nm, and this low energy emissive property of the sensor was further utilized for intracellular zinc detection in the bioimaging experiment.4.25. Coumarin-based Zn2+ sensors
Maity et al.372 reported the quinoline–coumarin-based fluorescent sensor 278 (Fig. 242) for the chromogenic and fluorogenic detection of metal ions. The probe exhibited a weak emission signal at around 400 nm when it was excited at 340 nm. A distinct behavior was observed by the probe on zinc and aluminium ion addition. Zinc addition caused a 18 nm red-shift with a 4-fold enhancement in the emission signal intensity. Moreover, the signal intensity at 418 nm was found to increase linearly with the increasing concentration of zinc ions. Al3+ caused a quenching of the emission signal at 400 nm with the concomitant appearance of a new emission signal at 484 nm. Al3+ titration yielded a well-defined isoemissive point at 430 nm along with a colorimetric change in the reaction solution, indicating the successful complexation between the receptor and Al3+. Furthermore, Al3+ displayed a selective binding tendency toward the receptor–zinc complex by replacing zinc ions in the complex. The Job's plot, mass spectra and NMR titration spectra indicated the 1![[thin space (1/6-em)]](https://www.rsc.org/images/entities/char_2009.gif) :
:![[thin space (1/6-em)]](https://www.rsc.org/images/entities/char_2009.gif) 1 ligand–metal binding stoichiometry.
1 ligand–metal binding stoichiometry.
Xu et al.373 introduced the coumarin-based fluorescent sensor 279 (Fig. 243) for zinc ion detection. The probe exhibited emission signals at 435 and 485 nm in the absence of zinc ions. Zinc addition caused a red-shifts in the spectrum with the new position at 505 nm along with a 9-fold enhancement in the signal intensity when the excitation was fixed at 340 nm. The dissociation constant of the receptor for the zinc ions was found to be 18 nM. The 1![[thin space (1/6-em)]](https://www.rsc.org/images/entities/char_2009.gif) :
:![[thin space (1/6-em)]](https://www.rsc.org/images/entities/char_2009.gif) 1 ligand–metal binding stoichiometry was found through the Job's plot, mass spectra and NMR titration analysis. The ligand also showed a tendency toward cadmium ions, whereas the competitive ions experiment indicated the lesser affinity of the receptor toward cadmium binding in comparison to the zinc ions. Moreover, the ligand was further employed in the bioimaging experiment to determine its potential for zinc sensation in intracellular media. The appearance of a bright fluorescence from the live cells demonstrated the potential applicability of the receptor toward intracellular zinc detection.
1 ligand–metal binding stoichiometry was found through the Job's plot, mass spectra and NMR titration analysis. The ligand also showed a tendency toward cadmium ions, whereas the competitive ions experiment indicated the lesser affinity of the receptor toward cadmium binding in comparison to the zinc ions. Moreover, the ligand was further employed in the bioimaging experiment to determine its potential for zinc sensation in intracellular media. The appearance of a bright fluorescence from the live cells demonstrated the potential applicability of the receptor toward intracellular zinc detection.
4.26. Terphenyl-based Zn2+ sensor
Bhalla et al.374 introduced the terphenyl-based macrocycle 280 (Fig. 244) as a fluorescent sensor for zinc ion detection. The probe alone exhibited absorption signals at 217, 284 and 374 nm. Zinc addition caused the emergence of a red-shifted signal at 430 nm along with a clear isosbestic point at 398 nm, indicating a successful complexation process between the receptor and zinc ion. Similarly, the probe showed a fluorescence emission band at 438 nm when the excitation was fixed at 300 nm. Zinc addition caused a 19 nm red-shift and a drastic enhancement in the fluorescence emission signal intensity at 457 nm. The ligand–zinc binding stoichiometry was found from the Job's curve, mass spectra and NMR titration measurements. The detection limit of the sensor toward zinc ions was determined to be 100 nM.4.27. Crown ether based Zn2+ sensor
Safin et al.375 introduced the crown ether-containing Schiff derivative 281 (Fig. 245) for zinc ion detection. The probe alone showed an emission signal at 354 nm when the excitation was fixed at 270 nm. The addition of zinc ions caused an intense emission band at 428 nm, whose intensity continued to increase with increasing zinc additions due to the chelation-enhanced fluorescence (CHEF) effect. Similarly, the zinc addition caused an enhancement in the absorption signal intensity at 350 nm along with a slight red-shift in the spectral position. The Job's plot indicates the 1![[thin space (1/6-em)]](https://www.rsc.org/images/entities/char_2009.gif) :
:![[thin space (1/6-em)]](https://www.rsc.org/images/entities/char_2009.gif) 2 coordination stoichiometries between the receptor and zinc ion, which was further assisted by the NMR and mass spectrometry analysis. The dissociation constant and detection limit of the receptor toward zinc binding were determined to be 2.8 × 10⁶ M−2 and 10−6 M, respectively. The addition of KNO3 into the probe–zinc complex solution completely quenched the fluorescence due to precipitation of the reaction media.
2 coordination stoichiometries between the receptor and zinc ion, which was further assisted by the NMR and mass spectrometry analysis. The dissociation constant and detection limit of the receptor toward zinc binding were determined to be 2.8 × 10⁶ M−2 and 10−6 M, respectively. The addition of KNO3 into the probe–zinc complex solution completely quenched the fluorescence due to precipitation of the reaction media.
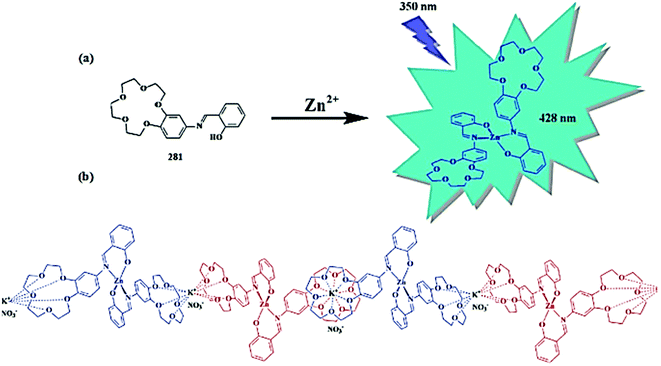 | ||
| Fig. 245 Chemical structure of receptor 281 and the proposed complexation mechanism toward zinc and potassium ions. | ||
4.28. Pyrazoline-based Zn2+ sensor
Zhang et al.376 reported the pyrazoline-based fluorescent sensor 282 (Fig. 246) for zinc ion detection. The ligand exhibited an absorption signal at 341 nm, which decreased on zinc addition along with the appearance of a new red-shifted signal at 395 nm. The absorption titration triggered a clear isosbestic point at 366 nm, indicating the equilibrium between the receptor and its metal complex. Similarly, there was a very weak emission signal by the probe at 476 nm in the absence of zinc ions, whereas zinc addition significantly enhanced this emission band along with a colorimetric change in the reaction solution from colorless to yellow. The dissociation constant and the detection limit of the receptor toward zinc binding were determined to be 4.83 × 10⁴ M−1 and 6.1 × 10⁻⁷ M, respectively. Furthermore, the ligand was successfully applied in the bioimaging experiment, utilizing PC12 cells under a confocal fluorescence microscope.4.29. Cyclen-based receptor as a Zn2+ sensor
Nouri et al.377 reported the cyclen derivative 283 (Fig. 247) as a fluorescent sensor for the dual channel detection of zinc and copper ions. The ligand behaved as an “Off–On–On” sensor for zinc ions, and the photophysical properties of the receptor were determined to be PET regulated. Similarly, the ligand was non-emissive in the absence of metallic ions, while zinc addition caused a strong fluorescence in response to the receptor molecule due to complexation with zinc ion following the CHEF effect. Similarly, the 1 equivalent copper addition caused a shift in the absorption signal from 325 to 335, while 2 equivalents copper addition caused a further red-shift with a new signal position at 390 nm. These shifts in the spectral position were due to the complexation of the receptor with the copper ion.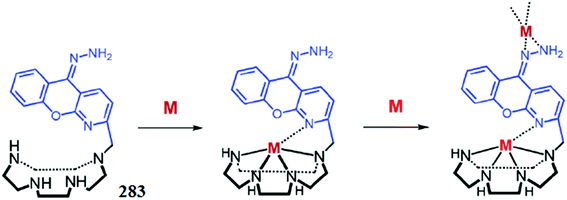 | ||
| Fig. 247 Chemical structure of receptor 283 and the proposed receptor–metal complexation mechanism (M = Zn2+, Cu2+). | ||
4.30. Triazolylpyridine-based Zn2+ sensor
Kaleeswaran et al.378 introduced the triazolylpyridine-based fluorescent sensor 284 (Fig. 248) for zinc ion detection. Zinc addition caused a decrease in the emission signal intensity at 379 nm with a concomitant increase in the intensity of signal at 331 nm. The titration experiment triggered the well-defined isoemissive point at 376 nm, indicating the successful complexation between the receptor and zinc ion via a five-membered ring formation, which was confirmed by the mass spectrometry analysis. The Job's plot and mass spectra indicated the 1![[thin space (1/6-em)]](https://www.rsc.org/images/entities/char_2009.gif) :
:![[thin space (1/6-em)]](https://www.rsc.org/images/entities/char_2009.gif) 1 ligand–zinc binding stoichiometry, which was further supported by the NMR titration experiment and computational analysis. The detection limit of the receptor toward zinc ion was determined to be 7.5 × 10⁻⁷ M.
1 ligand–zinc binding stoichiometry, which was further supported by the NMR titration experiment and computational analysis. The detection limit of the receptor toward zinc ion was determined to be 7.5 × 10⁻⁷ M.
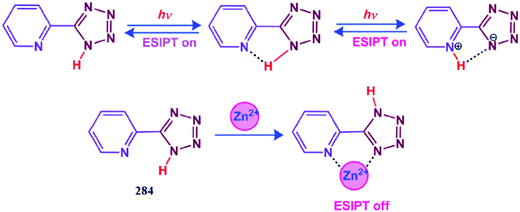 | ||
| Fig. 248 Chemical structure of receptor 284, hydrogen bonding pattern and the proposed complexation mechanism. | ||
4.31. Rhodafluor-based Zn2+ sensor
Burdette et al.379 reported the rhodafluor-based fluorescent sensor 285 (Fig. 249) for zinc ion detection. The probe exhibited an absorption maxima at 514 nm and fluorescence emission maxima at 539 nm in the absence of zinc ions. Zinc addition caused a 4 nm blue-shift in the absorption maxima, whereas the position of the emission maxima remains unchanged. Moreover, the zinc addition caused an increase in the fluorescence quantum yield up to 50% due to enhancement in the fluorescence emission signal intensity of the probe on zinc chelation.4.32. Calixarene-based Zn2+ sensor
Park et al.380 reported the calix[4]arene-based fluorescent chemosensor 286 (Fig. 250) for metal ion detection. The addition of Zn2+ or Cd2+ caused an increase in the monomer emission with a concomitant decrease in the excimer emission, whereas this behavior was determined to be selective in comparison to the various background metallic ions. However, Pb2+, Hg2+, and Cu2+ addition into the probe solution caused fluorescence quenching due to the heavy metal ion effect. The association constants of the receptor toward Cd2+ and Zn2+ were determined to be 5.18 × 10⁴ and 1.7 × 10⁴ M−1, respectively. The 1![[thin space (1/6-em)]](https://www.rsc.org/images/entities/char_2009.gif) :
:![[thin space (1/6-em)]](https://www.rsc.org/images/entities/char_2009.gif) 1 ligand–metal binding stoichiometries were estimated from the Job's plot, mass spectrometry and NMR titration analysis.
1 ligand–metal binding stoichiometries were estimated from the Job's plot, mass spectrometry and NMR titration analysis.
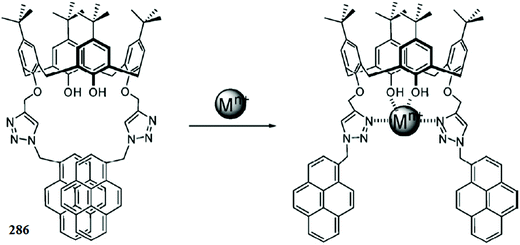 | ||
| Fig. 250 Chemical structure of receptor 286 and the proposed complexation mechanism (Mn+ = Zn2+/Cd2+). | ||
5. Mercuric ion sensors
Heavy metal ion contamination of the atmosphere is a significant global concern due to their toxicity to human health.381,382 Transition metal ions are particularly attractive, because these ions play important roles in living systems and have an extreme impact on the environment.383–386 Heavy metal ions, released from both natural and industrial sources, have severe adverse effects on human health and the environment even at low concentrations.387 Among the various heavy metals, Hg2+ is extensively distributed in the atmosphere, air, water, soil and anthropogenic materials.388 It is considered as one of the most highly toxic metal ions.389 Hg2+ can easily pass through the skin, respiratory, and gastrointestinal tissues into the human body.390 Hg2+ is a ubiquitous pollutant and has attracted considerable concerns for its deleterious effect on human health and natural ecosystems;391 moreover, it is considered as one of the more toxic environmental contaminants because of its high reactivity, extreme volatility and relative solubility in water and living tissues. The toxicity of Hg2+ even at very low concentrations can cause several human health problems, including vision loss, serious cognitive motion disorders, prenatal brain injury and damage to the human heart, kidney, stomach, and genes and even cause mammalian death.392–396The main sources of Hg2+ contamination are natural and industrial activities such as oceans and volcanic eruptions, gold production, coal plants, the use of fossil fuels, mining, paints, batteries and electronic products.397,398 Water-soluble divalent mercuric ion (Hg2+) is one of the most usual and stable forms of mercury pollution, which provides a pathway for contaminating vast amounts of water and soil. Its contamination originates from a variety of natural sources and human activities.399 Biomagnifications of mercury in human beings have been reported from aquatic food, which can eventually enter human bodies.400,401 Inorganic contaminations can be absorbed and converted into organic ones by microbes and bacteria. After being accumulated through the food chain, more harm could be brought to living entities.402–405 The annual release amount was 4400–7500 metric tons as estimated by the United Nations Environment Programme (UNEP).406,407 Several international committees have targeted mercury with regard to its emissions and effects on human health.408 Therefore, mercury is collectively banned by the European Union according to the Restriction of Hazardous Substances Directive since 2006.409 The World Health Organization (WHO) standard for the maximum allowable level of inorganic mercury is no more than 6 ppb (30 nM) in drinking water.410,411
On these repercussions, it is highly desirable to probe for mercury contamination in aquatic systems as well as in living cells. A ligand that can provide optical feedback on binding to Hg2+ in aqueous or mixed aqueous environments in the form of a visually detectable change in color and fluorescence could find application both as a colorimetric staining agent for easy and facile detection and as fluorescent imaging reagents for the biological cells that are affected by Hg2+ adsorption. Moreover, a fluorescence imaging technique could help map the distribution of guest species within living cells.
5.1. Rhodamine-based Hg2+ sensors
Karakus et al.412 synthesized the turn-on dual fluorescent probe 287 (Fig. 251) based on a rhodamine/BODIPY platform that displayed differential fluorescence responses toward Hg2+ and Au3+ on nanomolar detection sensitivity and demonstrated its utility in intracellular ion imaging using A549 cells. Before the introduction of the ionic species, the free probe 287 exhibited a single absorption band at 527 nm, which belonged to the BODIPY core as the rhodamine core is in the ring-closed isomeric form. A new strong absorption band at 554 nm on 1 equivalent Hg2+ addition was due to ring opening of the rhodamine skeleton triggered by Hg2+ ions. Moreover, a similar response was obtained in the case of the fluorescence emission spectrum with a new emission band appearing with a 50-fold increase in intensity on Hg2+ addition when the reaction solution was excited at 525 nm. The sensor reversibility was assessed by the cyanide ion source. The probe–metal stoichiometry was calculated to be 4![[thin space (1/6-em)]](https://www.rsc.org/images/entities/char_2009.gif) :
:![[thin space (1/6-em)]](https://www.rsc.org/images/entities/char_2009.gif) 1 from the Job's measurement. The same probe on addition of Au3+ exhibited characteristic emission signals at 526 and 585 nm when it was excited at 470 and 506 nm, respectively.
1 from the Job's measurement. The same probe on addition of Au3+ exhibited characteristic emission signals at 526 and 585 nm when it was excited at 470 and 506 nm, respectively.
Bera et al.413 introduced the rhodamine-based “turn-on” fluorescent sensor 288 (Fig. 252) and described its application for the detection of mercury in solutions and in live cells as well as in living vertebrate organisms. The colorless solution of probe 288 exhibited a 26-fold increase in the fluorescence emission intensity on 1 equivalent Hg2+ addition with a slight bathochromic shift of 4 nm. Sensor 288 underwent a rapid irreversible 1![[thin space (1/6-em)]](https://www.rsc.org/images/entities/char_2009.gif) :
:![[thin space (1/6-em)]](https://www.rsc.org/images/entities/char_2009.gif) 1 stoichiometric reaction with Hg2+ in an aqueous medium. The minimum detection ability of ligand 288 toward Hg2+ was reported to be 0.5 pM using fluorescence correlation spectroscopy. The bioimaging results of the probe showed its permeability toward mammalian cells and zebrafish larvae with a selective response for mercury over other metal ions. The author further explored the acquisition of high-resolution real-time distribution maps of inorganic mercury in the zebrafish brain using a simple fluorescence confocal imaging technique.
1 stoichiometric reaction with Hg2+ in an aqueous medium. The minimum detection ability of ligand 288 toward Hg2+ was reported to be 0.5 pM using fluorescence correlation spectroscopy. The bioimaging results of the probe showed its permeability toward mammalian cells and zebrafish larvae with a selective response for mercury over other metal ions. The author further explored the acquisition of high-resolution real-time distribution maps of inorganic mercury in the zebrafish brain using a simple fluorescence confocal imaging technique.
Kumar et al.414 reported a novel fluorescent chemosensor rhodamine B phenyl hydrazide 289 (Fig. 253) for Hg2+ detection. This probe is highly sensitive, selective, and irreversible for Hg2+ and exhibits a fluorescent response at 580 nm. Probe 289 could be utilized as a naked eye detector for Hg2+ as it displayed a detectable color change from colorless to pink upon treatment with Hg2+. The proposed probe 289 could detect Hg2+ with a good linear relationship from 1 to 100 nM with R = 0.99983, and the limit of detection was determined to be 0.019 nM with ±0.91% RSD at 10 nM concentrations. Confocal fluorescence microscopy experiments demonstrated that this chemosensor was cell-permeable and could be used for the fluorescence imaging of Hg2+ in cellular media.
Mistri et al.415 introduced a new rhodamine-based dual signaling probe 290 (Fig. 254) as a quick responsive colorimetric as well as fluorogenic scrutinizer for selective Hg2+ detection. The probe exhibited 1![[thin space (1/6-em)]](https://www.rsc.org/images/entities/char_2009.gif) :
:![[thin space (1/6-em)]](https://www.rsc.org/images/entities/char_2009.gif) 1 binding stoichiometry toward Hg2+, as determined by the optical spectra, Job's methods and mass spectrometry analysis. The designed ligand displayed a 252-fold fluorescence enhancement on binding to Hg2+. A Benesi–Hildebrand fit of the absorption titration data gave Kd of 32.01 ± 0.74 μM and a detection limit of 9.28 ng L−1. The intracellular Hg2+ imaging behavior of ligand 290 was studied using HeLa cells in conjunction with fluorescence microscopy and returned appreciable results against living cells. Moreover, the reversible binding of ligand 290 toward Hg2+ was assessed by the introduction of potassium iodide into the reaction mixture. The “Off–On–Off” fluorescence sensing behavior observed in the presence of Hg2+ and I− strengthens the potential applications of the 290–Hg2+ system as a device with logic gate functions, and therefore it shows advantages for the development of new-generation digital devices.
1 binding stoichiometry toward Hg2+, as determined by the optical spectra, Job's methods and mass spectrometry analysis. The designed ligand displayed a 252-fold fluorescence enhancement on binding to Hg2+. A Benesi–Hildebrand fit of the absorption titration data gave Kd of 32.01 ± 0.74 μM and a detection limit of 9.28 ng L−1. The intracellular Hg2+ imaging behavior of ligand 290 was studied using HeLa cells in conjunction with fluorescence microscopy and returned appreciable results against living cells. Moreover, the reversible binding of ligand 290 toward Hg2+ was assessed by the introduction of potassium iodide into the reaction mixture. The “Off–On–Off” fluorescence sensing behavior observed in the presence of Hg2+ and I− strengthens the potential applications of the 290–Hg2+ system as a device with logic gate functions, and therefore it shows advantages for the development of new-generation digital devices.
Ghosh et al.416 proposed a new rhodamine-based chemosensor 291 (Fig. 255) for the dual sensation of Co2+ and Hg2+ ions in CH3CN–water (4![[thin space (1/6-em)]](https://www.rsc.org/images/entities/char_2009.gif) :
:![[thin space (1/6-em)]](https://www.rsc.org/images/entities/char_2009.gif) 1, v/v; 10 l M Tris–HCl buffer, pH 6.8). The simultaneous involvement of the amide parts of the rhodamines with the polyether chain favored the strong chelation of Co2+ and Hg2+ ions over the other cations examined. Despite the almost identical behavior in fluorescence of receptor 291 toward Hg2+ and Co2+, the disappearance of the color of the mercury-ensemble in the presence of L-cysteine distinguishes it from Co2+ ions. The stoichiometries of the complexes of 291 with both Co2+ and Hg2+ ions were established to be 1
1, v/v; 10 l M Tris–HCl buffer, pH 6.8). The simultaneous involvement of the amide parts of the rhodamines with the polyether chain favored the strong chelation of Co2+ and Hg2+ ions over the other cations examined. Despite the almost identical behavior in fluorescence of receptor 291 toward Hg2+ and Co2+, the disappearance of the color of the mercury-ensemble in the presence of L-cysteine distinguishes it from Co2+ ions. The stoichiometries of the complexes of 291 with both Co2+ and Hg2+ ions were established to be 1![[thin space (1/6-em)]](https://www.rsc.org/images/entities/char_2009.gif) :
:![[thin space (1/6-em)]](https://www.rsc.org/images/entities/char_2009.gif) 1 from the Job's curves and the binding constant values (Ka) were determined to be (8.95 ± 0.89) × 104 M−1 and (6.02 ± 1.9) × 104 M−1 for Co2+ and Hg2+. Moreover, chemosensor 291 could be successfully applied to report the presence of both Co2+ and Hg2+ ions inside live cells, as assessed by confocal fluorescence microscopy experiment on human cervical cancer (HeLa) cells.
1 from the Job's curves and the binding constant values (Ka) were determined to be (8.95 ± 0.89) × 104 M−1 and (6.02 ± 1.9) × 104 M−1 for Co2+ and Hg2+. Moreover, chemosensor 291 could be successfully applied to report the presence of both Co2+ and Hg2+ ions inside live cells, as assessed by confocal fluorescence microscopy experiment on human cervical cancer (HeLa) cells.
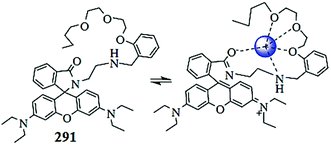 | ||
| Fig. 255 Chemical structure of ligand 291 and the suggested binding modes of interaction with the metal ions. | ||
Hu et al.417 designed a fluorescence resonance energy transfer (FRET)-based ratiometric fluorescence sensor in an aqueous solution and biological systems with rhodamine 6G derivative-mercury conjugate 292 as the acceptor and N-acetyl-L-cysteine functionalized quantum dots as the donor site (Fig. 256). Mercury annihilates the fluorescence of N-acetyl-L-cysteine at 508 nm and simultaneously interacts with the R6G derivative 292 to form a fluorescent conjugate, giving rise to an emission at 554 nm. The resonance energy transfer from N-acetyl-L-cysteine to 292–Hg2+ is triggered by mercury, resulting in a concentration-dependent variation of the fluorescence ratio F508/F554. A linear calibration of F508/F554 versus mercury concentration was obtained within 5–250 μg L−1, along with a detection limit of 0.75 μg L−1 and an RSD of 3.2% (175 μg L−1). The sensor generated colorimetric images for mercury within 0–250 μg L−1, facilitating the visual detection of mercury with a distinguishing ability of 50 μg L−1. This feature was further demonstrated by the colorimetric imaging of intracellular mercury. The designed sensor could be successfully employed for the colorimetric detection and quantification of mercury inside live cells, as shown by the bioimaging experiment under a confocal fluorescence microscope utilizing HeLa cell lines.
Yan et al.418 introduced the ratiometric fluorescence probes 193a and 293b (Fig. 257) for the selective recognition of Hg2+ in mixed aqueous–organic media. Both the ligands displayed a fluorescence intensity enhancement following Hg2+ coordination with the limits of detection for Hg2+ at the ppb level and the experimental values in the range of 2.5 × 10⁻⁸ M and 4.2 × 10⁻⁸ M, respectively. A nonlinear least squares fitting of the titration profiles based on the 1![[thin space (1/6-em)]](https://www.rsc.org/images/entities/char_2009.gif) :
:![[thin space (1/6-em)]](https://www.rsc.org/images/entities/char_2009.gif) 1 binding model strongly support the 1
1 binding model strongly support the 1![[thin space (1/6-em)]](https://www.rsc.org/images/entities/char_2009.gif) :
:![[thin space (1/6-em)]](https://www.rsc.org/images/entities/char_2009.gif) 1 stoichiometry of the ligands toward Hg2+, and the binding constant was calculated to be 2.1 × 10⁷ and 4.4 × 10⁵, respectively. The cellular viability estimated by the MTT assay was determined to be 97% toward HL-7702 cells. Due to its low toxicity and efficient cell permeability, the probe was successfully employed in the bioimaging experiment through a confocal fluorescence microscopy experiment on HL-7702 cells and gave appreciable results.
1 stoichiometry of the ligands toward Hg2+, and the binding constant was calculated to be 2.1 × 10⁷ and 4.4 × 10⁵, respectively. The cellular viability estimated by the MTT assay was determined to be 97% toward HL-7702 cells. Due to its low toxicity and efficient cell permeability, the probe was successfully employed in the bioimaging experiment through a confocal fluorescence microscopy experiment on HL-7702 cells and gave appreciable results.
Lee et al.419 reported new rhodamine hydrazone derivative 294 (Fig. 258) as a selective fluorescent and colorimetric chemodosimeter for Hg2+. Ligand 294 exhibited an “off–on” fluorescence enhancement at the maximum emission of 582 nm on the introduction of Hg2+ with a 170-fold fluorescence increase when excited at 544 nm. The detection limit was calculated to be as low as 0.22 μM with a linear range of 280–800 nM in CH3CN–HEPES buffer (0.01 M, pH 7.4) (4![[thin space (1/6-em)]](https://www.rsc.org/images/entities/char_2009.gif) :
:![[thin space (1/6-em)]](https://www.rsc.org/images/entities/char_2009.gif) 1, v/v) and a rate constant (k) of 2.86 × 10⁻² L mol−1 s−1 was obtained. The 1
1, v/v) and a rate constant (k) of 2.86 × 10⁻² L mol−1 s−1 was obtained. The 1![[thin space (1/6-em)]](https://www.rsc.org/images/entities/char_2009.gif) :
:![[thin space (1/6-em)]](https://www.rsc.org/images/entities/char_2009.gif) 1 complexation stoichiometry was observed for sensor 294, and the proposed chelation mechanism is shown in Fig. 257. A remarkable fluorescence enhancement from live cells under a confocal fluorescence microscope was observed, indicating the applicability of the proposed sensor for the detection of intracellular mercury contamination.
1 complexation stoichiometry was observed for sensor 294, and the proposed chelation mechanism is shown in Fig. 257. A remarkable fluorescence enhancement from live cells under a confocal fluorescence microscope was observed, indicating the applicability of the proposed sensor for the detection of intracellular mercury contamination.
 | ||
| Fig. 258 Chemical structure of chemodosimeter 294 and a proposed mechanism of interaction with Hg2+. | ||
Zhou et al.420 reported the novel FRET fluorescent sensor 295 (Fig. 259) based on a coumarin–rhodamine platform for the selective detection of Hg2+ in an aqueous solution and living systems. Probe 295 exhibited a new emission band at 590 nm with successive decreases in the emission intensity of the coumarin skeleton at 467 nm on ratiometric enhancement of the Hg2+ concentration into the reaction solution. The ratio of emission intensities of rhodamine and coumarin (F590/F467) varied from 0.02 to 4.68, corresponding to a 240-fold enhancement and a change in the solution color from green to red. The titration reaction curve showed a steady and smooth increase until a plateau was reached (1.20 equiv. Hg2+ ions) with the quantum yield of 0.13, suggesting the 1 equivalent consumption of the opened cyclic form. The 1![[thin space (1/6-em)]](https://www.rsc.org/images/entities/char_2009.gif) :
:![[thin space (1/6-em)]](https://www.rsc.org/images/entities/char_2009.gif) 1 mode stoichiometry was further supported by the mass spectrometry analysis. For practical applicability in biological systems, A375 cells (human malignant melanoma cell line) were used in the bioimaging experiment to monitor intracellular Hg2+ ions.
1 mode stoichiometry was further supported by the mass spectrometry analysis. For practical applicability in biological systems, A375 cells (human malignant melanoma cell line) were used in the bioimaging experiment to monitor intracellular Hg2+ ions.
Saleem et al.421 designed and reported a rhodamine B derivative 296 (Fig. 260) with a terminal mercapto thiadiazole moiety for the selective recognition of Hg2+ in an aqueous–acetonitrile (1![[thin space (1/6-em)]](https://www.rsc.org/images/entities/char_2009.gif) :
:![[thin space (1/6-em)]](https://www.rsc.org/images/entities/char_2009.gif) 1, v/v, pH 7) solution by employing its photophysical properties. Ligand 296 alone did not exhibit any fluorescence or UV-visible response in the range of 550–600 nm in the absence of metal ions, whereas a high intensity florescence emission band at 587 nm and a UV-visible absorption band at 554 nm were observed upon the addition of Hg2+ into the aqueous–acetonitrile (1: 1, v/v, pH 7.0) solution of ligand 296 with a significant color change from colorless to reddish pink, suggesting the conversion of the ligand into a spirolactam ring-opened xanthene conformation triggered by activation of the spirolactam carbonyl group with mercury ions. A linear relationship was obtained between the fluorescence intensity at 587 nm upon increasing the concentration of mercuric ions from 0.03 μM to 0.42 μM, and the value of the linearly dependent coefficient (R2) was determined to be 0.99. From this titration experiment, the detection limit of the chemosensor was estimated to be about 30 nM. To investigate the capability of ligand 296 to track changes in the Hg2+ level within biological samples, fluorescence imaging experiments were performed utilizing L-929 (mouse fibroblast cells) and BHK-21 (hamster kidney fibroblast cells). Ligand 296 exhibited low toxicity, as assessed by the MTT assay, and precise cell permeability, as determined by the bioimaging experiment. These properties of the ligand make it a borderline candidate for tracing Hg2+ contamination in an aqueous solution as well as in living cells.
1, v/v, pH 7) solution by employing its photophysical properties. Ligand 296 alone did not exhibit any fluorescence or UV-visible response in the range of 550–600 nm in the absence of metal ions, whereas a high intensity florescence emission band at 587 nm and a UV-visible absorption band at 554 nm were observed upon the addition of Hg2+ into the aqueous–acetonitrile (1: 1, v/v, pH 7.0) solution of ligand 296 with a significant color change from colorless to reddish pink, suggesting the conversion of the ligand into a spirolactam ring-opened xanthene conformation triggered by activation of the spirolactam carbonyl group with mercury ions. A linear relationship was obtained between the fluorescence intensity at 587 nm upon increasing the concentration of mercuric ions from 0.03 μM to 0.42 μM, and the value of the linearly dependent coefficient (R2) was determined to be 0.99. From this titration experiment, the detection limit of the chemosensor was estimated to be about 30 nM. To investigate the capability of ligand 296 to track changes in the Hg2+ level within biological samples, fluorescence imaging experiments were performed utilizing L-929 (mouse fibroblast cells) and BHK-21 (hamster kidney fibroblast cells). Ligand 296 exhibited low toxicity, as assessed by the MTT assay, and precise cell permeability, as determined by the bioimaging experiment. These properties of the ligand make it a borderline candidate for tracing Hg2+ contamination in an aqueous solution as well as in living cells.
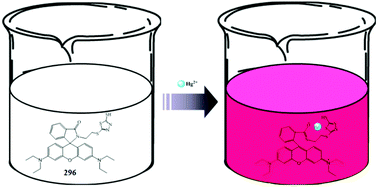 | ||
| Fig. 260 Chemical structure of probe 296, proposed ligand–Hg2+ binding mechanism and bioimaging applications. | ||
Yan et al.422 introduced a novel rhodamine derivative 297 (Fig. 261) synthesized by the reaction of rhodamine ethylenediamine and cinnamoyl chloride as a chemoselective Hg2+ ion sensor. The ligand solution was colorless and exhibited almost no absorption peak in the visible wavelength range due to the closed spirolactam ring. In the presence of 2 equivalents of Hg2+, the absorbance was enhanced obviously and a new peak at 562 nm was observed, accompanied by a clear color change from colorless to pink for naked eye detection. This enhancement in absorbance could be ascribed to the clear formation of the ring-opened amide form of 297 upon Hg2+ ions binding. Similarly, the ligand showed a very weak band in the range of 500–700 nm due to the spirocyclic structure, whereas the gradual addition of Hg2+ caused a significant enhancement in fluorescence intensity at 586 nm following excitation at 535 nm together with the solution showing an orange fluorescence. The method of continuous variation was used with the 297 + Hg2+ system in buffered (HEPES 20 mM, pH 7.0) water–ethanol (7/3, v/v) to show that when the molar fraction of Hg2+ was 0.5, the absorbance at 562 nm was at the maximum, indicating the formation of a 1![[thin space (1/6-em)]](https://www.rsc.org/images/entities/char_2009.gif) :
:![[thin space (1/6-em)]](https://www.rsc.org/images/entities/char_2009.gif) 1 complex between 297 and Hg2+, which was further supported by the Benesi–Hildebrand method and the fluorescence titration experiments. The chemosensor displayed a linear response to Hg2+ in the range of 0.4–5 μM with a detection limit of 7.4 × 10⁻⁸ M. The HL-7702 cells were used in the bioimaging experiment to determine the applicability of the ligand for the detection of Hg2+ in intracellular media.
1 complex between 297 and Hg2+, which was further supported by the Benesi–Hildebrand method and the fluorescence titration experiments. The chemosensor displayed a linear response to Hg2+ in the range of 0.4–5 μM with a detection limit of 7.4 × 10⁻⁸ M. The HL-7702 cells were used in the bioimaging experiment to determine the applicability of the ligand for the detection of Hg2+ in intracellular media.
Bhalla et al.423 developed new pentaquinone derivatives with rhodamine moieties 298 (Fig. 262), which underwent a through-bond energy transfer (TBET) in the presence of Hg2+ ions among the various cations (Cu2+, Pb2+, Fe2+, Fe3+, Zn2+, Ni2+, Cd2+, Co2+, Ag+, Ba2+, Mg2+, K+, Na+, and Li+) tested in the mixed aqueous media. The probe exhibited absorption bands at 275 and 322 nm in THF–H2O (9.5![[thin space (1/6-em)]](https://www.rsc.org/images/entities/char_2009.gif) :
:![[thin space (1/6-em)]](https://www.rsc.org/images/entities/char_2009.gif) 0.5, v/v) due to the pentaquinone moiety. However, upon the addition of Hg2+ ions (0–200 equivalents), the intensities of these absorption bands increased and a new band appeared at 554 nm for the receptor along with a colorimetric change of the solution from colorless to pink, which was visible to the naked eye. The formation of a new band at 554 nm was attributed to the interaction of Hg2+ ions with the receptor, leading to the opening of the spirolactam ring. Similarly, the ligand was non-fluorescent in THF–H2O (9.5
0.5, v/v) due to the pentaquinone moiety. However, upon the addition of Hg2+ ions (0–200 equivalents), the intensities of these absorption bands increased and a new band appeared at 554 nm for the receptor along with a colorimetric change of the solution from colorless to pink, which was visible to the naked eye. The formation of a new band at 554 nm was attributed to the interaction of Hg2+ ions with the receptor, leading to the opening of the spirolactam ring. Similarly, the ligand was non-fluorescent in THF–H2O (9.5![[thin space (1/6-em)]](https://www.rsc.org/images/entities/char_2009.gif) :
:![[thin space (1/6-em)]](https://www.rsc.org/images/entities/char_2009.gif) 0.5, v/v) when excited at 360 nm. The quenched fluorescence emission was probably due to photoinduced electron transfer (PET) from the nitrogen atom of the spirolactam ring to the pentaquinone moiety. Interestingly, the addition of increasing amounts of Hg2+ ions (0–200 equivalents) to the solution of receptors in THF–H2O led to the appearance of an emission band at 582 nm, and the emission intensity of the receptor increased linearly as a function of the Hg2+ ion concentration. This emission enhancement was proposed to be due to the opening of the spirolactam ring of rhodamine to the amide form, thus indicating the TBET process in the receptor, i.e., via the conjugated linker from the donor to acceptor (Fig. 261). Compound 298 showed fluorescence quantum yields (Φfs) of 0.01, whereas there was a massive jump in the fluorescence quantum yield (from 0.01–0.21) of the receptor on Hg2+ additions. Fitting the changes in the fluorescence spectra of compound 298 with Hg2+ ions using a nonlinear regression analysis gave a good fit with 1
0.5, v/v) when excited at 360 nm. The quenched fluorescence emission was probably due to photoinduced electron transfer (PET) from the nitrogen atom of the spirolactam ring to the pentaquinone moiety. Interestingly, the addition of increasing amounts of Hg2+ ions (0–200 equivalents) to the solution of receptors in THF–H2O led to the appearance of an emission band at 582 nm, and the emission intensity of the receptor increased linearly as a function of the Hg2+ ion concentration. This emission enhancement was proposed to be due to the opening of the spirolactam ring of rhodamine to the amide form, thus indicating the TBET process in the receptor, i.e., via the conjugated linker from the donor to acceptor (Fig. 261). Compound 298 showed fluorescence quantum yields (Φfs) of 0.01, whereas there was a massive jump in the fluorescence quantum yield (from 0.01–0.21) of the receptor on Hg2+ additions. Fitting the changes in the fluorescence spectra of compound 298 with Hg2+ ions using a nonlinear regression analysis gave a good fit with 1![[thin space (1/6-em)]](https://www.rsc.org/images/entities/char_2009.gif) :
:![[thin space (1/6-em)]](https://www.rsc.org/images/entities/char_2009.gif) 2 stoichiometric demonstration and binding constant values of (log
2 stoichiometric demonstration and binding constant values of (log![[thin space (1/6-em)]](https://www.rsc.org/images/entities/char_2009.gif) β) = 7.92. The method of continuous variation also supported the 1
β) = 7.92. The method of continuous variation also supported the 1![[thin space (1/6-em)]](https://www.rsc.org/images/entities/char_2009.gif) :
:![[thin space (1/6-em)]](https://www.rsc.org/images/entities/char_2009.gif) 2 binding mode of the ligand–metal complex. The minimal detection ability of the probe toward Hg2+ ions was determined to be 7 × 10⁻⁷ M, which was sufficiently low for detection of submillimolar concentrations of Hg2+ ions. The proposed ligand–Hg2+ complex underwent a reversible transformation in the presence of potassium iodide. The fluorescence quenching of the complex in the presence of potassium iodide was due to the strong affinity of iodide ions for Hg2+ ions, which resulted in decomplexation of the receptor–Hg2+ complex by switching it back to the reactant. The potential biological application of the receptor was evaluated for the in vitro detection of Hg2+ ions in prostate cancer (PC3) cell lines through a bioimaging experiment. These results suggested that 298 is an effective intracellular Hg2+ imaging agent with the appearance of a red emission attributed to the working of the TBET phenomenon within the cells.
2 binding mode of the ligand–metal complex. The minimal detection ability of the probe toward Hg2+ ions was determined to be 7 × 10⁻⁷ M, which was sufficiently low for detection of submillimolar concentrations of Hg2+ ions. The proposed ligand–Hg2+ complex underwent a reversible transformation in the presence of potassium iodide. The fluorescence quenching of the complex in the presence of potassium iodide was due to the strong affinity of iodide ions for Hg2+ ions, which resulted in decomplexation of the receptor–Hg2+ complex by switching it back to the reactant. The potential biological application of the receptor was evaluated for the in vitro detection of Hg2+ ions in prostate cancer (PC3) cell lines through a bioimaging experiment. These results suggested that 298 is an effective intracellular Hg2+ imaging agent with the appearance of a red emission attributed to the working of the TBET phenomenon within the cells.
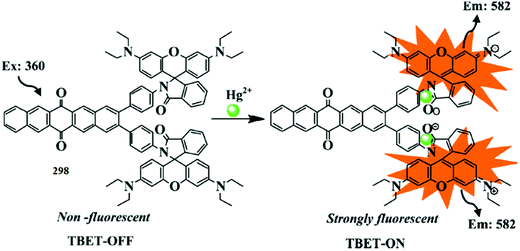 | ||
| Fig. 262 Chemical structure of ligand 298, Hg2+-induced TBET-Off–On mechanism and the bioimaging response. | ||
Mahato et al.424 presented the rhodamine-based sensor 299 (Fig. 263) for the specific detection of Hg2+ or Cr3+ in mixed aqueous–organic media. The ligand displayed an absorption band at 455 nm and a yellow fluorescence emission band at 533 nm when it was excited at 455 nm. The emission at 533 nm, following excitation at 455 nm, was attributed to an intramolecular charge transfer (ICT) process associated with the 1,8-naphthalimide chromophore. The rhodamine moiety retained its spirolactam form. In the presence of Cr3+/Hg2+, the switch on response at 561 nm for the electronic spectra and at 583 nm for the luminescence spectra accounted for a visually detectable change in the solution color and luminescence because of the opening of the spirolactam ring and the generation of the delocalized xanthene moiety. The 1![[thin space (1/6-em)]](https://www.rsc.org/images/entities/char_2009.gif) :
:![[thin space (1/6-em)]](https://www.rsc.org/images/entities/char_2009.gif) 1 stoichiometric complex was observed for the ligand toward the metal ions supported by optical, FT-IR and NMR analyses as well as by the nonlinear regression methods. The respective binding constant values for the two metal ions was calculated to be KCr3+ = (1.22 ± 0.07) × 105 and KHg2+ = (1.01 ± 0.05) × 105 M−1. The spectral response of the ligand toward Hg2+ and Cr3+ in the presence of excess KI confirmed that this reagent could be used for delineating Cr3+ from Hg2+ in a mixed solvent medium. The binding of Cr3+/Hg2+ ions induced the opening of the spirolactam ring in the ligand with an associated switch on of the UV-vis spectral response in the range 515–585 nm, which has a significant spectral overlap with the emission spectrum of the N,N-dialkylamine-naphthalimide fragment and facilitates a nonradiative transfer of excitation energy between the donor naphthalimide to the acceptor xanthene moiety and initiates an intramolecular FRET process. Moreover, the ligand reversible binding toward Cr3+/Hg2+ was established through spectral studies in the presence of 3 mol equivalents of Na2EDTA. Furthermore, a bioimaging experiment was carried out to investigate the applicability of the ligand for intracellular metal detection by incubating the A431 cells with 10 μM of ligand, 50 μM Cr(NO3)3, or 40 μM Hg(NO3)2. A negligible intracellular fluorescence was detected from the cells only in the presence of a ligand, which showed the cell permeability of the ligand, whereas the marked enhancement of the intracellular red fluorescence confirmed the binding of ligand with Cr3+ and Hg2+ within the A431 cells.
1 stoichiometric complex was observed for the ligand toward the metal ions supported by optical, FT-IR and NMR analyses as well as by the nonlinear regression methods. The respective binding constant values for the two metal ions was calculated to be KCr3+ = (1.22 ± 0.07) × 105 and KHg2+ = (1.01 ± 0.05) × 105 M−1. The spectral response of the ligand toward Hg2+ and Cr3+ in the presence of excess KI confirmed that this reagent could be used for delineating Cr3+ from Hg2+ in a mixed solvent medium. The binding of Cr3+/Hg2+ ions induced the opening of the spirolactam ring in the ligand with an associated switch on of the UV-vis spectral response in the range 515–585 nm, which has a significant spectral overlap with the emission spectrum of the N,N-dialkylamine-naphthalimide fragment and facilitates a nonradiative transfer of excitation energy between the donor naphthalimide to the acceptor xanthene moiety and initiates an intramolecular FRET process. Moreover, the ligand reversible binding toward Cr3+/Hg2+ was established through spectral studies in the presence of 3 mol equivalents of Na2EDTA. Furthermore, a bioimaging experiment was carried out to investigate the applicability of the ligand for intracellular metal detection by incubating the A431 cells with 10 μM of ligand, 50 μM Cr(NO3)3, or 40 μM Hg(NO3)2. A negligible intracellular fluorescence was detected from the cells only in the presence of a ligand, which showed the cell permeability of the ligand, whereas the marked enhancement of the intracellular red fluorescence confirmed the binding of ligand with Cr3+ and Hg2+ within the A431 cells.
Wang et al.425 developed a novel fluorescent sensor based on thiooxorhodamine B 300 (Fig. 264) for the detection of Hg2+ in an aqueous buffer solution. The sensor exhibited a very weak absorption in the visible range due to its existence in the spirocyclic form in the solution. The addition of Hg2+ to the 300 solution led to a distinct absorption band centered at 563 nm with a colorimetric change in the solution from colorless to red due to the ring-opening process provoked by Hg2+. The reversibility of the resulting complex was determined by the addition of Na2S, which turned the colored solution back to colorless, implying a reversible coordination process between the receptor and Hg2+. The Job's plot indicates that 300 and the mercury ion form a 1![[thin space (1/6-em)]](https://www.rsc.org/images/entities/char_2009.gif) :
:![[thin space (1/6-em)]](https://www.rsc.org/images/entities/char_2009.gif) 1 adduct, which was further confirmed by the appearance of a peak at m/z 777.1928 assignable to [300 + Hg2+ + Cl−]+ in the HRMS-ESI spectrum. The binding constant was calculated to be Kd = 7.5 ± 0.6 μM via a nonlinear least squares fitting (R = 0.995) using the fluorescence titration curve. The properties of 300 should render it suitable for biological applications, which were evaluated by the bioimaging experiment utilizing A549 cell lines. The results showed that 300 is cell-permeable and can visualize the changes of intracellular Hg2+ in living cells.
1 adduct, which was further confirmed by the appearance of a peak at m/z 777.1928 assignable to [300 + Hg2+ + Cl−]+ in the HRMS-ESI spectrum. The binding constant was calculated to be Kd = 7.5 ± 0.6 μM via a nonlinear least squares fitting (R = 0.995) using the fluorescence titration curve. The properties of 300 should render it suitable for biological applications, which were evaluated by the bioimaging experiment utilizing A549 cell lines. The results showed that 300 is cell-permeable and can visualize the changes of intracellular Hg2+ in living cells.
Zhao et al.426 developed a novel rhodamine-based fluorescent chemosensor 301 (Fig. 265) as a molecular probe for Hg2+ and Mg2+ by the emergence of an optical signal at different wavelengths. The free probe was non-fluorescent, whereas on the successive addition of Hg2+ into the probe reaction solution, a ratiometric enhancement in the absorption spectrum was observed at 558 nm. The ratiometric increase in the absorbance clearly validated that the ligand could serve as a highly sensitive sensor for Hg2+ with a detectable color change for naked eye detection. The Job plot indicated that the ligand was coordinated to Hg2+ in a 1![[thin space (1/6-em)]](https://www.rsc.org/images/entities/char_2009.gif) :
:![[thin space (1/6-em)]](https://www.rsc.org/images/entities/char_2009.gif) 1 binding stoichiometry, which was further confirmed by the NMR spectral analysis. Despite the Hg2+-induced fluorescence at 589 nm on exciting at 360 nm, a new emission band was observed in the high energy region with a maximum emission at 523 on the addition of Mg2+ at the same excitation wavelength of 360 nm. These two well-resolved independent emission bands of the ligand indicate the dual channel applicability of the ligand toward Hg2+ and Mg2+ with high resolution. The ligand acted as a reversible fluorescent sensor upon 4 equivalent addition of Na2S, which led to quenching of the fluorescence with turning the solution from colored to colorless, implying the decomplexation of Hg2+ complex by S2− and a subsequent spirolactam ring closure reaction. Furthermore, a bioimaging experiment with the laser scanning confocal microscopy utilizing HeLa cells showed that the ligand could permeate into cells and was suitable for the fluorescence imaging of Hg2+ or Mg2+ in living cells because of its favorable amphiphilic and spectroscopic properties.
1 binding stoichiometry, which was further confirmed by the NMR spectral analysis. Despite the Hg2+-induced fluorescence at 589 nm on exciting at 360 nm, a new emission band was observed in the high energy region with a maximum emission at 523 on the addition of Mg2+ at the same excitation wavelength of 360 nm. These two well-resolved independent emission bands of the ligand indicate the dual channel applicability of the ligand toward Hg2+ and Mg2+ with high resolution. The ligand acted as a reversible fluorescent sensor upon 4 equivalent addition of Na2S, which led to quenching of the fluorescence with turning the solution from colored to colorless, implying the decomplexation of Hg2+ complex by S2− and a subsequent spirolactam ring closure reaction. Furthermore, a bioimaging experiment with the laser scanning confocal microscopy utilizing HeLa cells showed that the ligand could permeate into cells and was suitable for the fluorescence imaging of Hg2+ or Mg2+ in living cells because of its favorable amphiphilic and spectroscopic properties.
Wang et al.427 designed a novel rhodamine-based off–on fluorescent chemosensor 302 (Fig. 266) for Hg2+ ions using the well-known thiospirolactam rhodamine chromophore and furfural hydrazone as signal-reporting groups. There was no prominent absorbance by the ligand alone in the entire range from 450 to 600 nm due to the existence of the ligand in the spirocyclic conformation. Upon the addition of mercuric ions, there was a sudden emergence of an absorption signal at 537 nm along with a colorimetric change in the reaction solution, suggesting potential applicability as a chemosensor for Hg2+ by an optical spectroscopy method as well as through naked eye detection. The binding stoichiometry of the ligand toward Hg2+ was determined from the Job plot for absorbance. The maximum absorbance was obtained when the mole fraction was 0.3, giving a clear indication of the 1![[thin space (1/6-em)]](https://www.rsc.org/images/entities/char_2009.gif) :
:![[thin space (1/6-em)]](https://www.rsc.org/images/entities/char_2009.gif) 2 stoichiometry of the resulting complex. Moreover, the association constant for Hg2+ was estimated to be 5.20 × 10⁵ M−2 on the basis of a nonlinear fitting of the titration curve assuming 1
2 stoichiometry of the resulting complex. Moreover, the association constant for Hg2+ was estimated to be 5.20 × 10⁵ M−2 on the basis of a nonlinear fitting of the titration curve assuming 1![[thin space (1/6-em)]](https://www.rsc.org/images/entities/char_2009.gif) :
:![[thin space (1/6-em)]](https://www.rsc.org/images/entities/char_2009.gif) 2 stoichiometries. Similarly, the sensor showed a 120-fold enhancement in the fluorescence intensity with the maximum emission at 564 nm, and maximum orange fluorescence could be achieved by the sensor upon 9 equivalents Hg2+ addition. A good linear relationship with the linearly dependent coefficient R2 = 0.9979 was observed between the fluorescence intensity of the sensor and the concentration of Hg2+ ions. The sensor responded reversibly on the excess addition of S2−, as indicated by the quenching of the orange fluorescence of the ligand–Hg2+ complex as well as by the turning of the solution color from reddish pink to colorless. Furthermore, for intracellular mercury detection, a bioimaging experiment was conducted utilizing Rat Schwann cells, which gave prominent results, suggesting very good cell permeability of the chemosensor to trace mercury contamination inside the living cells.
2 stoichiometries. Similarly, the sensor showed a 120-fold enhancement in the fluorescence intensity with the maximum emission at 564 nm, and maximum orange fluorescence could be achieved by the sensor upon 9 equivalents Hg2+ addition. A good linear relationship with the linearly dependent coefficient R2 = 0.9979 was observed between the fluorescence intensity of the sensor and the concentration of Hg2+ ions. The sensor responded reversibly on the excess addition of S2−, as indicated by the quenching of the orange fluorescence of the ligand–Hg2+ complex as well as by the turning of the solution color from reddish pink to colorless. Furthermore, for intracellular mercury detection, a bioimaging experiment was conducted utilizing Rat Schwann cells, which gave prominent results, suggesting very good cell permeability of the chemosensor to trace mercury contamination inside the living cells.
Kim et al.428 reported new rhodamine hydrazone derivatives 303 and 304 (Fig. 267) bearing thiol and carboxylic acid groups as selective fluorescent and colorimetric chemosensors for Hg2+. Both the ligand solutions were colorless and approximately non-fluorescence in the absence of Hg2+, whereas on mercuric ion introduction, there was a prominent emission signal appearance at 580 nm when it was excited at 510 nm along with a colorimetric change in the reaction solution for naked eye detection. The maximum fluorescence enhancement was observed on 100 equivalents mercuric ion addition with an increase in the fluorescence intensity up to 10-fold and 50-fold for sensors 303 and 303, respectively. The 1![[thin space (1/6-em)]](https://www.rsc.org/images/entities/char_2009.gif) :
:![[thin space (1/6-em)]](https://www.rsc.org/images/entities/char_2009.gif) 2 stoichiometries for sensor molecule 303 and the 1
2 stoichiometries for sensor molecule 303 and the 1![[thin space (1/6-em)]](https://www.rsc.org/images/entities/char_2009.gif) :
:![[thin space (1/6-em)]](https://www.rsc.org/images/entities/char_2009.gif) 1 stoichiometry for sensor 304 were calculated using Job's methods. The developed sensor behaved reversibly on the addition of KI into the reaction solution, as indicated by quenching of the fluorescence intensity and the change in the solution color from reddish pink to colorless. These changes revealed the detachment of Hg2+ from the complex. The stoichiometry was further confirmed by mass spectrometry analysis. The chemosensors were successfully applied to microfluidic systems and were shown to be capable of detecting Hg2+ in the nanomolar range. Moreover, the feasibility of both the chemosensors for in vivo imaging was established in a bioimaging experiment to evaluate the mercury distribution in nematodes. Despite some discrepancy, the fluorescence intensities of both the chemosensors in the nematodes exposed to the metal ions were clearly correlated to the concentration of the toxic metal ion, suggesting that the chemosensors were highly useful for visualizing the distribution of Hg2+ in C. elegans.
1 stoichiometry for sensor 304 were calculated using Job's methods. The developed sensor behaved reversibly on the addition of KI into the reaction solution, as indicated by quenching of the fluorescence intensity and the change in the solution color from reddish pink to colorless. These changes revealed the detachment of Hg2+ from the complex. The stoichiometry was further confirmed by mass spectrometry analysis. The chemosensors were successfully applied to microfluidic systems and were shown to be capable of detecting Hg2+ in the nanomolar range. Moreover, the feasibility of both the chemosensors for in vivo imaging was established in a bioimaging experiment to evaluate the mercury distribution in nematodes. Despite some discrepancy, the fluorescence intensities of both the chemosensors in the nematodes exposed to the metal ions were clearly correlated to the concentration of the toxic metal ion, suggesting that the chemosensors were highly useful for visualizing the distribution of Hg2+ in C. elegans.
Yu et al.429 developed two ratiometric sensors 305 and 306 (Fig. 268) with different spirocyclic receptors for the recognition of Hg2+ in different reaction mechanisms. Upon excitation at a single wavelength (488 nm), at which only BODIPY is absorbed, both the FRET sensors exhibited clear Hg2+-induced changes in the intensity ratio of the two strong emission bands of BODIPY and rhodamine. Ligand 305 exhibited maximum absorption bands at 498 and 540 nm, whereas on excitation at 488 nm, they exhibited a strong orange emission at 568 nm with a high fluorescence quantum yield of 0.47. Upon the addition of Hg2+ into the reaction solution of 305, a new absorption band at 562 nm appeared, which continued to increase in intensity on increasing the Hg2+ concentration, indicating the generation of a rhodamine chromophore. In the case of the fluorescence emission spectral recording, there emerged two emission bands at 510 and 584 nm and their intensity ratiometrically increased with the increase in Hg2+ concentration. The clear isosbestic points observed for the two species in the reaction solution indicated a 1![[thin space (1/6-em)]](https://www.rsc.org/images/entities/char_2009.gif) :
:![[thin space (1/6-em)]](https://www.rsc.org/images/entities/char_2009.gif) 1 binding ratio in the case of sensor 305. Sensor 305 was sensitive enough, showing a detection limit of parts per billion levels for Hg2+. Sensor 305 underwent cyclization by the transformation of the thiosemicarbazides section into 1,3,4-oxadiazide promoted by Hg2+, and the irreversible ring-opening reaction of the rhodamine section was confirmed by the mass spectrometry analysis. A similar trend in the absorption and fluorescence titrations with Hg2+ was observed for sensor 306 with a high selectivity toward the competitive ions. The sensing mechanism of sensor 306 was different with Hg2+ compared to sensor 305. Thiospirolactone in the rhodamine moiety of 306 underwent a ring opening with Hg2+ due to its high thiophilicity following the metal-coordination-induced ring-opening reaction. The 1
1 binding ratio in the case of sensor 305. Sensor 305 was sensitive enough, showing a detection limit of parts per billion levels for Hg2+. Sensor 305 underwent cyclization by the transformation of the thiosemicarbazides section into 1,3,4-oxadiazide promoted by Hg2+, and the irreversible ring-opening reaction of the rhodamine section was confirmed by the mass spectrometry analysis. A similar trend in the absorption and fluorescence titrations with Hg2+ was observed for sensor 306 with a high selectivity toward the competitive ions. The sensing mechanism of sensor 306 was different with Hg2+ compared to sensor 305. Thiospirolactone in the rhodamine moiety of 306 underwent a ring opening with Hg2+ due to its high thiophilicity following the metal-coordination-induced ring-opening reaction. The 1![[thin space (1/6-em)]](https://www.rsc.org/images/entities/char_2009.gif) :
:![[thin space (1/6-em)]](https://www.rsc.org/images/entities/char_2009.gif) 2 stoichiometric mechanisms of the 306–Hg2+ complex were clearly investigated by the mass spectrometry analysis as well as in a Job's plot. Concurrently, a bioimaging experiment was conducted to assess the applicability of sensors 305 and 306 toward live cell imaging using a confocal fluorescence microscope. Both the developed sensors were determined to be good candidates for the quick and sensitive detection of Hg2+ inside living cells with precise membrane permeability.
2 stoichiometric mechanisms of the 306–Hg2+ complex were clearly investigated by the mass spectrometry analysis as well as in a Job's plot. Concurrently, a bioimaging experiment was conducted to assess the applicability of sensors 305 and 306 toward live cell imaging using a confocal fluorescence microscope. Both the developed sensors were determined to be good candidates for the quick and sensitive detection of Hg2+ inside living cells with precise membrane permeability.
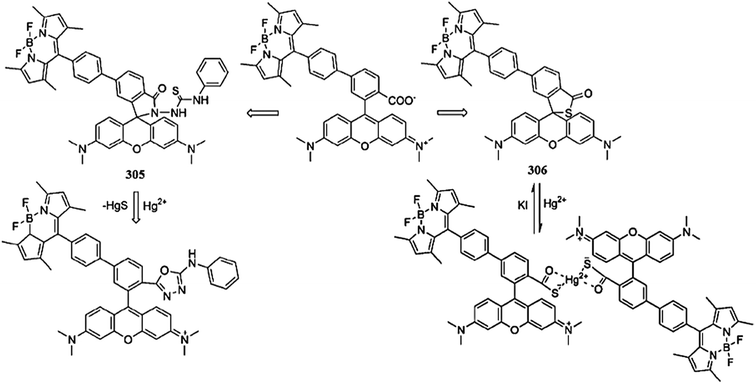 | ||
| Fig. 268 Chemical structure of ligands 305 and 306 and the Hg2+-induced conformational changes in both the ligands molecules. | ||
Zhang et al.430 reported the cyclometalated platinum(II)-containing rhodamine probe 307 (Fig. 269) with two-photon induced luminescent properties for mercury detection. The ligand showed the typical absorption band in the range of 250–380 nm, which was responsible for its pale yellow color, whereas no absorbance was observed for the rhodamine fluorophore due to its existence in the ring-closed conformation. A sudden increase in the fluorescence intensity at 535 nm was observed on increasing the Hg2+ concentration and became saturated on 1 equivalent Hg2+ addition with a colorimetric change in the solution from pale yellow to pink for naked eye detection. Moreover, a remarkable turn-on fluorescence response was obtained with a 23-fold increase in the emission intensity at 545 nm, which was selective for only Hg2+ compared to the competing ions. The sensor exhibited a noteworthy low detection limit with the sensing ability of 4.87 × 10⁻⁷ M. The ligand–mercury complex stoichiometry was determined from the Job's plot, which revealed the 1![[thin space (1/6-em)]](https://www.rsc.org/images/entities/char_2009.gif) :
:![[thin space (1/6-em)]](https://www.rsc.org/images/entities/char_2009.gif) 1 binding mode of the ligand and mercury. Furthermore, practical insight into the product formed after mercuric ion interaction was obtained through mass spectrometry analysis. The interesting UV-visible and fluorescence properties of the ligand upon Hg2+ addition, along with its water solubility, selectivity, low detection limit and colorimetric response make it an efficient sensing material for Hg2+ detection. Due to its wonderful optical characteristics and cell permeability, the ligand might be of great benefit to biomedical researchers for studying the effects of Hg2+ in biological systems.
1 binding mode of the ligand and mercury. Furthermore, practical insight into the product formed after mercuric ion interaction was obtained through mass spectrometry analysis. The interesting UV-visible and fluorescence properties of the ligand upon Hg2+ addition, along with its water solubility, selectivity, low detection limit and colorimetric response make it an efficient sensing material for Hg2+ detection. Due to its wonderful optical characteristics and cell permeability, the ligand might be of great benefit to biomedical researchers for studying the effects of Hg2+ in biological systems.
Fang et al.431 reported the ratiometric sensor 308 (Fig. 270) for the sensitive detection of mercury ions in aqueous media, some biological fluids, and live cells. The probe exhibited an absorption band around 490 nm, which corresponds to the absorption profile of the donor fluorescein isothiocyanate (FITC). Upon the addition of Hg2+ ions into the probe aqueous solution, a characteristic absorption signal centered at 560 nm appeared, corresponding to the rhodamine moiety along with a colorimetric change in the solution from green to pink, which is useful for the naked eye detection of Hg2+. These changes led to the spirolactam ring opening of the rhodamine moiety triggered by Hg2+. Similarly, before the addition of Hg2+ in the thiocarbamido-SRhB-β-CD/FITC-AD system, there was an appearance of an emission band at 518 nm when it was excited at 495 nm with this band corresponding to the FITC. Interestingly, upon Hg2+ addition, the donor emission at 518 nm decreased with a linear increase in the new emission band at 586 nm. The steady-state increase in the emission intensities ratios at 586 and 518 nm (I586/I518) reflect the applicability of the sensor as a sensitive ratiometric sensor for Hg2+ in pure aqueous media. Further evidence of the FRET process was obtained by the fluorescence lifetime measurement of the thiocarbamido-SRhB-β-CD/FITC-AD FRET system in an aqueous solution. The supramolecular complex aqueous solution showed a fluorescence lifetime of 3.58 nm before mercury addition, whereas a fast decay in the donor curve was observed after mercury addition into the probe solution, indicating quenching of the FITC emission by the rhodamine molecules as a result of the metal-provoked ring opening of the rhodamine spirolactam. The decrease in the fluorescence lifetime of the donor site from 3.58 to 0.38 ns provided additional evidence for the involvement of the FRET process in decreasing the fluorescence lifetime of the FITC, induced by energy transfer to the rhodamine fluorophore. The overlap of the fluorescence emission spectrum of the FITC moiety (donor) and the absorption spectrum of the open-ring thiocarbamido-SRhB-β-CD/Hg2+ are associated with the possibility of FRET occurring. To explore the applicability of the sensor for mercury monitoring in the environmental area as well as in biological assays, the experiment was conducted using tap water for environmental monitoring and human urine and fetal bovine as biological samples. Good agreement between the experimental and the actual concentrations of mercuric ions indicated the potential applications of the developed sensor for the analysis of Hg2+ contamination in a broad range of samples. The cell proliferation in the presence of the sensor as well as no reduction in the cells viability on 48 h incubation with the sensor molecule compared to the control cells suggested the no toxicity of the sensor toward the living cells, as assessed by the MTT and cell proliferation assays utilizing L929 cells. The bioimaging experiment with the sensor utilizing HeLa and L929 live cells revealed a good cell permeability and efficient intracellular fluorescence on binding with Hg2+.
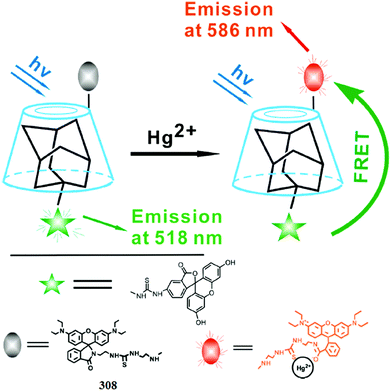 | ||
| Fig. 270 Schematic for the formation of the FRET-based ratiometric sensing system for Hg2+ with β-CD as the vehicle. | ||
Yi et al.432 reported a rhodamine-based sensor 309 (Fig. 271) for high affinity Hg2+ detection. The probe alone exhibited a very weak absorption band at 500 nm, reflecting the existence of rhodamine in a spirolactam ring-closed conformation, whereas upon 1.5 equivalents Hg2+ addition, the significant increase in the absorption intensity at 567 nm with a 217-fold enhancement in the intensity and prominent colorimetric change in the reaction solution suggest the conformational changes in the ligand structure induced by Hg2+ from the ring-closed form to the spirolactam ring-open form. The Hg2+-induced changes in the absorption as well as in the emission spectra were selective in comparison to the competing ions, which had a negligible effect toward the corresponding spectral intensities. The 1![[thin space (1/6-em)]](https://www.rsc.org/images/entities/char_2009.gif) :
:![[thin space (1/6-em)]](https://www.rsc.org/images/entities/char_2009.gif) 1 stoichiometry of the ligand toward the metal was determined using Job's methods and was further confirmed by the mass spectrometry analysis. Similarly, the probe exhibited no fluorescence in the mixed aqueous–organic media without mercury introduction into its reaction solution, while a prominent emission signal with a 442-fold enhancement in the emission intensity at 593 nm was observed on the introduction of mercury, suggesting the sensitive tendency of the sensor toward mercury for the real-time detection of Hg2+ in environmental and biological samples. The minimum detection ability of the ligand toward Hg2+ was determined by the fluorescence titration experiment to be 1.72 × 10⁻⁹ M, and the association constant for 309 with Hg2+ was calculated by the nonlinear curve-fitting of the fluorescence titration results as 1.86 × 10⁶ M−1. The toxicity of the sensor material was assessed with the MTT assay and the results showed that the probe may be a good candidate to reduce the cytotoxicity of Hg2+ due to it having a sulfur atom in the core skeleton that exhibited compatibility toward the biological system. To further validate the applicability of the sensor to track Hg2+ levels in living cells using a model for respiratory Hg2+ exposure, a bioimaging experiment was conducted using MCF-7 cells (human breast carcinoma cell line). The results indicate good cell-membrane permeability and an efficient reporting tendency of the sensor for reporting mercury in the perinuclear area.
1 stoichiometry of the ligand toward the metal was determined using Job's methods and was further confirmed by the mass spectrometry analysis. Similarly, the probe exhibited no fluorescence in the mixed aqueous–organic media without mercury introduction into its reaction solution, while a prominent emission signal with a 442-fold enhancement in the emission intensity at 593 nm was observed on the introduction of mercury, suggesting the sensitive tendency of the sensor toward mercury for the real-time detection of Hg2+ in environmental and biological samples. The minimum detection ability of the ligand toward Hg2+ was determined by the fluorescence titration experiment to be 1.72 × 10⁻⁹ M, and the association constant for 309 with Hg2+ was calculated by the nonlinear curve-fitting of the fluorescence titration results as 1.86 × 10⁶ M−1. The toxicity of the sensor material was assessed with the MTT assay and the results showed that the probe may be a good candidate to reduce the cytotoxicity of Hg2+ due to it having a sulfur atom in the core skeleton that exhibited compatibility toward the biological system. To further validate the applicability of the sensor to track Hg2+ levels in living cells using a model for respiratory Hg2+ exposure, a bioimaging experiment was conducted using MCF-7 cells (human breast carcinoma cell line). The results indicate good cell-membrane permeability and an efficient reporting tendency of the sensor for reporting mercury in the perinuclear area.
Jiang et al.433 proposed a rhodamine-based “turn-on”-type fluorescent chemosensor 310 (Fig. 272) for sensitive and selective mercury detection. The ligand exhibited no absorption in the visible region due to the existence of the spirolactam moiety, which inhibits the internal charge transfer between the two components in the molecule. However, the same molecule in the presence of metals, including Hg2+, Cu2+ and Fe3+, caused the emergence of absorption signals at 562, 551, and 555.5 nm, respectively, with an easily detectable absorption shift of 5 nm among them. Interestingly, in the case of fluorescence, only Hg2+ induced a 300-fold enhancement in the fluorescence emission intensity at 575 nm, whereas the other metal ions exhibited only a limited or negligible fluorescence enhancement in comparison to Hg2+. These results showed the selectivity of the ligand toward Hg2+ in comparison to the competing ions. The four well-defined isosbestic points at 313, 334, 380 and 460 nm indicate the presence of a unique complex in equilibrium with the free ligand. This experimental result was further supported by the NMR spectroscopy and mass spectrometry analysis as well as the Job's curve, clearly indicating the 1![[thin space (1/6-em)]](https://www.rsc.org/images/entities/char_2009.gif) :
:![[thin space (1/6-em)]](https://www.rsc.org/images/entities/char_2009.gif) 1 stoichiometric complex between the ligand and mercury. The association constant of the ligand with Hg2+ was determined to be 3.9 × 10⁻⁵ using a nonlinear least squares analysis utilizing the absorption titration results. To trace Hg2+ level in living cells, the proposed sensor proved to be a good candidate due to its precise cell permeability and interesting optical characteristics, as assessed by a bioimaging experiment utilizing yeast and HeLa cells. There was very faint fluorescence from cells without Hg2+ addition, whereas on incubating the cells with Hg2+, there emerged strong fluorescence from the live cells. Confocal fluorescence microscopy results indicate the applicability of the sensor to sense Hg2+ within live cells.
1 stoichiometric complex between the ligand and mercury. The association constant of the ligand with Hg2+ was determined to be 3.9 × 10⁻⁵ using a nonlinear least squares analysis utilizing the absorption titration results. To trace Hg2+ level in living cells, the proposed sensor proved to be a good candidate due to its precise cell permeability and interesting optical characteristics, as assessed by a bioimaging experiment utilizing yeast and HeLa cells. There was very faint fluorescence from cells without Hg2+ addition, whereas on incubating the cells with Hg2+, there emerged strong fluorescence from the live cells. Confocal fluorescence microscopy results indicate the applicability of the sensor to sense Hg2+ within live cells.
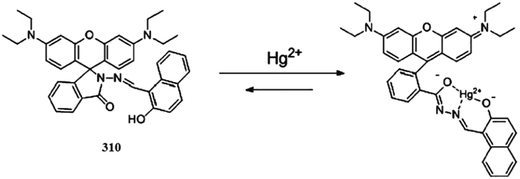 | ||
| Fig. 272 Chemical structure and proposed mechanism for the fluorescent changes of 310 upon the addition of Hg2+. | ||
Zhao et al.434 reported a new “off–on” rhodamine B-based fluorescent probe 311 (Fig. 273) for selective and sensitive Hg2+-detection in a mixed solution with a broad pH range of 4–9. The probe alone did not show any absorption signal above 500 nm due to the existence of the sensor in the spirolactam ring-closed conformation. Upon Hg2+ addition, there was an absorption signal at 560 nm with turning of the solution color from colorless to pink, which was triggered by Hg2+. Moreover, a clear isosbestic point at 330 nm in the absorption spectra indicated that the binding of 311 with Hg2+ produces a single component. The association constant for Hg2+ was estimated to be 2.18 × 10⁶ M−1 with good linearly dependent coefficient values of R2 = 0.9916 determined on the basis of a nonlinear fitting of the titration curve assuming 1: 1 stoichiometry of the forming complex, and these results was consistent with those obtained from the Job's plot. The same results were obtained by the fluorescence experiments, wherein initially the probe lacked any emission signal; however, after the addition of Hg2+, a significant emission signal with a 1200-fold enhancement in the emission intensity suggested the binding of the ligand with that of Hg2+, which brought about the conformational changes in the ligand by converting it from the spirolactam ring-closed conformation to the ring-open conformation along with a colorimetric change in the reaction solution. The sensitivity of Hg2+ to the sensor was appreciably low with experimental values of 1.14 ppb. The reversibility of the sensor was checked by the introduction of iodide ions into the ligand–metal complex solution, which turned the solution color from pink to colorless along with a quenching of the emission, suggesting that iodide ions snatch Hg2+ from the ligand–Hg2+ complex, reverting it back to the original ligand. Moreover, a bioimaging experiment was performed to determine the potential of the ligand to detect Hg2+ level in the intracellular environment using HeLa cell lines. The results showed that the ligand could successfully be applied to detect Hg2+ ions in the intracellular environment through use of a confocal fluorescence microscopy experiment.
Lin et al.435 reported a novel reversible fluorescence turn-on chemosensor 312 (Fig. 274) for Hg2+ detection. The ligand exhibited no emission signal in the absence of Hg2+, while a drastic change in the fluorescence emission spectrum by the emergence of a new signal at 561 nm with a 1000-fold enhancement in intensity and a turn-on colorimetric change on the addition of Hg2+ revealed the applicability of the ligand as a potential Hg2+ detector. A similar case was observed in the UV-visible absorption spectrum by the appearance of a new absorption signal centered at 534 nm on Hg2+ introduction, giving clear evidence of the conversion of the ligand from the colorless spirocyclic form to the highly fluorescent ring-open form on binding with Hg2+. The ligand–metal complex showed a reversible behavior on the addition of EDTA, as observed by the transformation of the colored solution to colorless as well as from fluorescence quenching. A maximum emission was observed when the mole fraction of Hg2+ was 0.5 at the emission maxima of 561 nm, indicating the 1![[thin space (1/6-em)]](https://www.rsc.org/images/entities/char_2009.gif) :
:![[thin space (1/6-em)]](https://www.rsc.org/images/entities/char_2009.gif) 1 stoichiometry of the ligand with Hg2+. The 1
1 stoichiometry of the ligand with Hg2+. The 1![[thin space (1/6-em)]](https://www.rsc.org/images/entities/char_2009.gif) :
:![[thin space (1/6-em)]](https://www.rsc.org/images/entities/char_2009.gif) 1 stoichiometry was further confirmed by the NMR titration and mass spectrometry analysis. The dissociation constant of the complex was determined to be 2.5 × 10⁻⁵ M with good linearly dependent coefficient values determined by employing the Benesi–Hildebrand equation. The minimum detection tendency of the ligand toward Hg2+ was determined to be 2.75 × 10⁻⁸ M, which is quite low for environmental monitoring. Furthermore, the visible fluorescence appearance from the HeLa cells on incubation with Hg2+ gave clear evidence about the biocompatibility of the ligand for intracellular investigation.
1 stoichiometry was further confirmed by the NMR titration and mass spectrometry analysis. The dissociation constant of the complex was determined to be 2.5 × 10⁻⁵ M with good linearly dependent coefficient values determined by employing the Benesi–Hildebrand equation. The minimum detection tendency of the ligand toward Hg2+ was determined to be 2.75 × 10⁻⁸ M, which is quite low for environmental monitoring. Furthermore, the visible fluorescence appearance from the HeLa cells on incubation with Hg2+ gave clear evidence about the biocompatibility of the ligand for intracellular investigation.
Huang et al.436 reported the selective chemosensor 313 (Fig. 275) for detecting Hg2+ in natural water and living cells by the combination of a sugar group and a rhodamine group into one molecule. The probe exhibited a weak fluorescence at 550 nm when it was excited at 500 nm. Upon the introduction of Hg2+, there was a sudden enhancement in the fluorescence intensity with a colorimetric change in the reaction solution, demonstrating the formation of a xanthene tautomer of the rhodamine group. The Benesi–Hildebrand analysis established a 1![[thin space (1/6-em)]](https://www.rsc.org/images/entities/char_2009.gif) :
:![[thin space (1/6-em)]](https://www.rsc.org/images/entities/char_2009.gif) 1 stoichiometry for the 313–Hg2+ complex with an association constant value of 5.4 ± 0.1 × 10⁵ M−1. Further confirmation of the ligand–metal stoichiometry was confirmed by NMR analysis. The probe behaved selectively toward Hg2+ in comparison to the competitive ions. Moreover, upon the introduction of NaI and Na2S, there was a sudden decrease in the emission intensity, suggesting the reversible nature of the ligand–metal complex. Similarly, the free ligand showed a weak absorption signal at 525 nm, and the rapid growth of this signal with a slight red-shift on Hg2+ addition revealed the conformational changes in the ligand induced by Hg2+. The 1
1 stoichiometry for the 313–Hg2+ complex with an association constant value of 5.4 ± 0.1 × 10⁵ M−1. Further confirmation of the ligand–metal stoichiometry was confirmed by NMR analysis. The probe behaved selectively toward Hg2+ in comparison to the competitive ions. Moreover, upon the introduction of NaI and Na2S, there was a sudden decrease in the emission intensity, suggesting the reversible nature of the ligand–metal complex. Similarly, the free ligand showed a weak absorption signal at 525 nm, and the rapid growth of this signal with a slight red-shift on Hg2+ addition revealed the conformational changes in the ligand induced by Hg2+. The 1![[thin space (1/6-em)]](https://www.rsc.org/images/entities/char_2009.gif) :
:![[thin space (1/6-em)]](https://www.rsc.org/images/entities/char_2009.gif) 1 stoichiometry was further supported by the appearance of the maximum absorbance at a 0.5 mole fraction of Hg2+ in the Job's plot evaluation. The sensor molecule was capable of sensing 2 ppb level of Hg2+ in the aqueous solution, as evaluated by using fresh water for practical environmental monitoring. Due to the high selectivity of the ligand toward Hg2+ in comparison to other biologically and environmentally relevant species, it was further used to detect Hg2+ in live cells in a bioimaging experiment. The appearance of an intense fluorescence from the live cells incubated with the ligand and Hg2+ suggest that the developed sensor might be useful for intracellular Hg2+ detection.
1 stoichiometry was further supported by the appearance of the maximum absorbance at a 0.5 mole fraction of Hg2+ in the Job's plot evaluation. The sensor molecule was capable of sensing 2 ppb level of Hg2+ in the aqueous solution, as evaluated by using fresh water for practical environmental monitoring. Due to the high selectivity of the ligand toward Hg2+ in comparison to other biologically and environmentally relevant species, it was further used to detect Hg2+ in live cells in a bioimaging experiment. The appearance of an intense fluorescence from the live cells incubated with the ligand and Hg2+ suggest that the developed sensor might be useful for intracellular Hg2+ detection.
Chen et al.437 reported the Hg2+-selective rhodamine 6G derivative 314 (Fig. 276) bearing thiolactone moiety. The sensor showed an intense emission signal on treatment with Hg2+ in comparison to various competitive ions when it was excited at 515 nm. A 200-fold enhancement in the emission intensity with a considerable “Off–On” response suggests the applicability of the ligand as a selective Hg2+ sensor. The ligand reversibility was determined by the addition of KI into the ligand–Hg2+ complex solution, which significantly faded the color of the reaction solution, as well as by the sudden quenching in the fluorescence intensity, suggesting the detachment of Hg2+ from the complex to regenerate the ligand. The 2![[thin space (1/6-em)]](https://www.rsc.org/images/entities/char_2009.gif) :
:![[thin space (1/6-em)]](https://www.rsc.org/images/entities/char_2009.gif) 1 stoichiometry of the ligand–metal complex was determined from the Job's plot and from mass spectrometry measurements, as well as from a single crystal X-ray diffraction analysis. The appreciable “Off–On” response of the sensor was further applied to detect mercury levels inside living species through a bioimaging experiment utilizing C. elegans. Nematode showed very weak fluorescence when it was incubated with only the ligand, while an intense red fluorescence appeared on incubating the ligand mixed nematode with Hg2+, suggesting the momentous permeability and efficiency of the ligand to detect Hg2+ inside living species.
1 stoichiometry of the ligand–metal complex was determined from the Job's plot and from mass spectrometry measurements, as well as from a single crystal X-ray diffraction analysis. The appreciable “Off–On” response of the sensor was further applied to detect mercury levels inside living species through a bioimaging experiment utilizing C. elegans. Nematode showed very weak fluorescence when it was incubated with only the ligand, while an intense red fluorescence appeared on incubating the ligand mixed nematode with Hg2+, suggesting the momentous permeability and efficiency of the ligand to detect Hg2+ inside living species.
Zhang et al.438 reported a BODIPY-rhodamine “off–on” system 315 (Fig. 277) for ratiometric Hg2+ detection. The probe alone exhibited an emission signal at 514 nm, and this emission was a characteristic for the BODIPY part when it was excited at 488 nm. However, on mercury addition, a drastic change in the emission spectrum with a red-shift from 514 to 589 nm occurred and the emission intensity ratiometrically increased on increasing the concentration of Hg2+. These characteristic changes in the emission spectrum in the mixed aqueous–organic media are useful for environmental and biomedical mercury detection. A similar case was observed in the UV-visible absorption spectra. The ligand exhibited an absorption profile with the maximum absorbance at 501 nm, corresponding to the donor side, whereas on Hg2+ addition, the significant enhancement in the absorbance signal at 560 nm and colorimetric change in the ligand reaction solution from green to pink confirmed the Hg2+-induced conformational changes in the ligand. A confocal fluorescence microscopy experiment resulted in the appearance of green fluorescence from the live cells on incubation with the ligands and a significant change in the cellular color from green to red, suggesting the good cell permeability and excellent cell viability of the ligand for its practical applicability for intracellular Hg2+ detection.
Yang et al.439 reported a new multi-signaling sensor based on rhodamine B with a ferrocene substituent 316 (Fig. 278) for selective Hg2+ detection. The ligand exhibited only a weak absorption band at 500 nm, which was ascribed to the ligand predominantly existing in the spirolactam conformation. However, upon Hg2+ addition, a new high intensity absorption signal appeared with the maximum absorption at 560 nm along with a colorimetric change in the reaction solution, suggesting a Hg2+-induced transformation of the ligand from the spirocyclic conformation to the ring-open xanthene conformation, which has more delocalization of the electronic cloud over a wider area, which ultimately causes more electronic excitation. The association constant for Hg2+ was estimated to be 3.7 × 10³ M−1 in buffer solutions, as calculated using a nonlinear fitting analysis utilizing the titration curve. The 1![[thin space (1/6-em)]](https://www.rsc.org/images/entities/char_2009.gif) :
:![[thin space (1/6-em)]](https://www.rsc.org/images/entities/char_2009.gif) 1 stoichiometry of the ligand–metal complex was determined from the Job's plot. Similar results were observed in the case of the fluorescence spectra with the appearance of a new high intensity emission signal only on Hg2+ addition at 580 nm and the probe becoming saturated on 15 equivalents Hg2+ addition, which led to a 105-fold enhancement in the emission intensity. The ligand behaved reversibly on 15 equivalents addition of KI, as confirmed by the colored solution turning colorless along with fluorescence quenching. The ligand could be successfully applied for biomedical applications, as determined in the bioimaging experiment utilizing Caov-3 cells. Herein, there was no fluorescence from the cells incubated with the ligand but the same cells on incubation with Hg2+ triggered an efficient red fluorescence. These results revealed the appreciable cell permeability of the ligand for intracellular Hg2+ detection.
1 stoichiometry of the ligand–metal complex was determined from the Job's plot. Similar results were observed in the case of the fluorescence spectra with the appearance of a new high intensity emission signal only on Hg2+ addition at 580 nm and the probe becoming saturated on 15 equivalents Hg2+ addition, which led to a 105-fold enhancement in the emission intensity. The ligand behaved reversibly on 15 equivalents addition of KI, as confirmed by the colored solution turning colorless along with fluorescence quenching. The ligand could be successfully applied for biomedical applications, as determined in the bioimaging experiment utilizing Caov-3 cells. Herein, there was no fluorescence from the cells incubated with the ligand but the same cells on incubation with Hg2+ triggered an efficient red fluorescence. These results revealed the appreciable cell permeability of the ligand for intracellular Hg2+ detection.
Jana et al.440 reported a cryptand–rhodamine conjugated chemodosimeter 317 (Fig. 279) for Hg2+ detection. The probe alone exhibited a very small absorption band at 560 nm, while a prominent absorption signal appearing on mercury addition was ascribed to the spirolactam ring-opening of the ligand induced by the chelation with Hg2+. From the UV-visible titration experiment, the 1![[thin space (1/6-em)]](https://www.rsc.org/images/entities/char_2009.gif) :
:![[thin space (1/6-em)]](https://www.rsc.org/images/entities/char_2009.gif) 3 stoichiometry was estimated for the ligand toward Hg2+ along with the calculated association constant value of 7 × 10¹¹ M−3, which was further supported by the mass spectrometry analysis. Similarly, the fluorescence emission spectra corroborate the results obtained from the absorption spectra with the emergence of an emission signal at 580 nm on exciting at 520 nm with the ratiometric enhancement in the emission intensity, indicating the applicability of the ligand to detect Hg2+ in the mixed aqueous–organic media. Furthermore, the colorimetric change in the reaction solution upon Hg2+ addition was another advantageous feature of the developed sensor for naked eye detection. The sensor is capable of detecting Hg2+ in the ppb level, which is quite low for environmental monitoring. The ligand showed a very good cell viability profile and promising permeability toward live cells for bioimaging, as assessed using HEK 293 cell lines in the confocal fluorescence microscopy experiment.
3 stoichiometry was estimated for the ligand toward Hg2+ along with the calculated association constant value of 7 × 10¹¹ M−3, which was further supported by the mass spectrometry analysis. Similarly, the fluorescence emission spectra corroborate the results obtained from the absorption spectra with the emergence of an emission signal at 580 nm on exciting at 520 nm with the ratiometric enhancement in the emission intensity, indicating the applicability of the ligand to detect Hg2+ in the mixed aqueous–organic media. Furthermore, the colorimetric change in the reaction solution upon Hg2+ addition was another advantageous feature of the developed sensor for naked eye detection. The sensor is capable of detecting Hg2+ in the ppb level, which is quite low for environmental monitoring. The ligand showed a very good cell viability profile and promising permeability toward live cells for bioimaging, as assessed using HEK 293 cell lines in the confocal fluorescence microscopy experiment.
Ko et al.441 reported the irreversible rhodamine-based chemosensor 318 (Fig. 280) for Hg2+ monitoring in aqueous solutions, living cells, vertebrate organisms and their organs. The strong appearance of fluorescence at 557 nm from the non-fluorescent molecule 318 on exposure to Hg2+ revealed the metal-induced ring opening in the molecule 318, and this property of the sensor could be used to detect low levels of Hg2+ under physiological conditions. A detection limit up to the ppb level has been determined for the sensor. The 1![[thin space (1/6-em)]](https://www.rsc.org/images/entities/char_2009.gif) :
:![[thin space (1/6-em)]](https://www.rsc.org/images/entities/char_2009.gif) 1 stoichiometry of the ligand–metal complex was determined by the titration experiment. For the in vivo determination of Hg2+, a bioimaging experiment was conducted using mouse muscle precursor cells, rat neuron cells and human muscle precursor cells. Fluorescence microscopy experiment showed that the sensor was capable of entering the cells to react with mercury, as assessed by the appearance of fluorescence from the ligand-incubated cells when subjected to mercury. Moreover, the minimum detection ability of the ligand to trace mercury in the in vivo environment could be examined by measuring the fluorescence intensity of the treated C2C12 cells with a fluorescence microplate reader. It was determined that mercury ions in C2C12 cells treated with more than 40 μM Hg2+ could be monitored by this method. The successful applicability with precise cell permeability of the sensor further encouraged the authors to explore the sensor for mercury detection inside living organisms, utilizing a five-day-old Zebra fish. There was no fluorescence from the Zebra fish incubated with Hg2+ with the ligand, while a significant appearance of strong red fluorescence appeared after introduction of the sensor. This bioimaging experiment showed that the sensor could be successfully applied to sense mercury levels inside the Zebra fish. Due to very good biocompatibility of the sensor, it was further applied to detect mercury uptake by the cells and organs using a confocal fluorescence microscope. The bright fluorescence from the organs, including the brain, heart, liver, and gall bladder of the zebrafish, after treatment with the 318 and Hg2+, suggested that 318 was able to reach all of these organs.
1 stoichiometry of the ligand–metal complex was determined by the titration experiment. For the in vivo determination of Hg2+, a bioimaging experiment was conducted using mouse muscle precursor cells, rat neuron cells and human muscle precursor cells. Fluorescence microscopy experiment showed that the sensor was capable of entering the cells to react with mercury, as assessed by the appearance of fluorescence from the ligand-incubated cells when subjected to mercury. Moreover, the minimum detection ability of the ligand to trace mercury in the in vivo environment could be examined by measuring the fluorescence intensity of the treated C2C12 cells with a fluorescence microplate reader. It was determined that mercury ions in C2C12 cells treated with more than 40 μM Hg2+ could be monitored by this method. The successful applicability with precise cell permeability of the sensor further encouraged the authors to explore the sensor for mercury detection inside living organisms, utilizing a five-day-old Zebra fish. There was no fluorescence from the Zebra fish incubated with Hg2+ with the ligand, while a significant appearance of strong red fluorescence appeared after introduction of the sensor. This bioimaging experiment showed that the sensor could be successfully applied to sense mercury levels inside the Zebra fish. Due to very good biocompatibility of the sensor, it was further applied to detect mercury uptake by the cells and organs using a confocal fluorescence microscope. The bright fluorescence from the organs, including the brain, heart, liver, and gall bladder of the zebrafish, after treatment with the 318 and Hg2+, suggested that 318 was able to reach all of these organs.
5.2. Rosamine-based Hg2+ sensor
Taki et al.442 designed a RosHg-based fluorescent sensor 319 (Fig. 281) for selective Hg2+ detection. In the absence of Hg2+, RosHg 319 exhibited a characteristic absorption band centered at 556 nm (ε = 43![[thin space (1/6-em)]](https://www.rsc.org/images/entities/char_2009.gif) 300 M−1 cm−1) and a weak fluorescence emission peak at 574 nm with a very low fluorescence quantum yield (Φ) of 0.005. Interestingly, upon the addition of Hg2+, the fluorescence intensity increased 20-fold along with a considerable increase of the fluorescence quantum yield (Φ = 0.11) and a slight bathochromic shift in the excitation (557 nm; ε = 48
300 M−1 cm−1) and a weak fluorescence emission peak at 574 nm with a very low fluorescence quantum yield (Φ) of 0.005. Interestingly, upon the addition of Hg2+, the fluorescence intensity increased 20-fold along with a considerable increase of the fluorescence quantum yield (Φ = 0.11) and a slight bathochromic shift in the excitation (557 nm; ε = 48![[thin space (1/6-em)]](https://www.rsc.org/images/entities/char_2009.gif) 600 M−1 cm−1) and emission (579 nm) maxima. The fluorescence intensity at 579 nm linearly increased up to a 1
600 M−1 cm−1) and emission (579 nm) maxima. The fluorescence intensity at 579 nm linearly increased up to a 1![[thin space (1/6-em)]](https://www.rsc.org/images/entities/char_2009.gif) :
:![[thin space (1/6-em)]](https://www.rsc.org/images/entities/char_2009.gif) 1 [Hg2+]–[RosHg] ratio, which is consistent with a 1
1 [Hg2+]–[RosHg] ratio, which is consistent with a 1![[thin space (1/6-em)]](https://www.rsc.org/images/entities/char_2009.gif) :
:![[thin space (1/6-em)]](https://www.rsc.org/images/entities/char_2009.gif) 1 complex stoichiometry. The formation of a 1
1 complex stoichiometry. The formation of a 1![[thin space (1/6-em)]](https://www.rsc.org/images/entities/char_2009.gif) :
:![[thin space (1/6-em)]](https://www.rsc.org/images/entities/char_2009.gif) 1 complex was further confirmed by the Job's plot, wherein the intensity at 579 nm reached the maximum when the molar fraction of Hg2+ was 0.5. On the basis of a nonlinear curve-fitting analysis of the emission intensities (F/F0) at each [Hg2+]free, Kd was calculated to be 1.04 ± 0.05 × 10⁻¹⁶ M, which is much lower than the allowable level for Hg2+ in drinking water suggested by the U.S. Environmental Protection Agency, i.e., 2 ppb (10 nM). The probe behaved reversibly with an excess amount of glutathione, resulting in an immediate decrease in the fluorescence intensity to the original value of the metal-unbound RosHg 319. This reversible binding feature of RosHg and Hg2+ implied that this sensor may be a useful chemical tool to monitor not only the cellular uptake of Hg2+ but also the increase of the intracellular glutathione concentration, which induces the increase in mercury elimination from cells and tissues. Furthermore, the probe was capable of monitoring the changes of Hg2+ levels in the mitochondria of living cells, as determined by the bioimaging experiment on HeLa cell lines.
1 complex was further confirmed by the Job's plot, wherein the intensity at 579 nm reached the maximum when the molar fraction of Hg2+ was 0.5. On the basis of a nonlinear curve-fitting analysis of the emission intensities (F/F0) at each [Hg2+]free, Kd was calculated to be 1.04 ± 0.05 × 10⁻¹⁶ M, which is much lower than the allowable level for Hg2+ in drinking water suggested by the U.S. Environmental Protection Agency, i.e., 2 ppb (10 nM). The probe behaved reversibly with an excess amount of glutathione, resulting in an immediate decrease in the fluorescence intensity to the original value of the metal-unbound RosHg 319. This reversible binding feature of RosHg and Hg2+ implied that this sensor may be a useful chemical tool to monitor not only the cellular uptake of Hg2+ but also the increase of the intracellular glutathione concentration, which induces the increase in mercury elimination from cells and tissues. Furthermore, the probe was capable of monitoring the changes of Hg2+ levels in the mitochondria of living cells, as determined by the bioimaging experiment on HeLa cell lines.
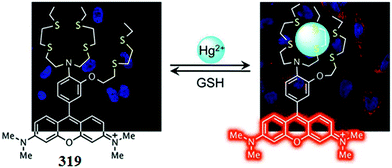 | ||
| Fig. 281 Chemical structure of RosHg-based fluorescent sensor 319, its proposed binding mode with that of Hg2+, and reversibility in the presence of glutathione (GSH). | ||
5.3. Coumarin-based Hg2+ sensors
Yu et al.443 introduced a new coumarin derivative 320 (Fig. 282) containing an imine moiety and a hydroxyl moiety that exhibited an enhanced fluorescence with the emission maxima of 455 nm in the presence of Hg2+ ions, whereas there was negligible emission in the case of multiple competing metal ions. The binding ratio of the probe–Hg2+ complexes was determined from the Job's plot as 1![[thin space (1/6-em)]](https://www.rsc.org/images/entities/char_2009.gif) :
:![[thin space (1/6-em)]](https://www.rsc.org/images/entities/char_2009.gif) 1 and the binding constant (Ka) for Hg2+ was determined to be 6.85 × 10³ M−1. The probe showed the maximum fluorescence enhancement on Hg2+ binding over a broad pH range of 6.5–9.0. Confocal fluorescence microscopy imaging was drawn using RAW 264.7 cells, which suggest the applicability of the probe for detecting Hg2+ in living cells.
1 and the binding constant (Ka) for Hg2+ was determined to be 6.85 × 10³ M−1. The probe showed the maximum fluorescence enhancement on Hg2+ binding over a broad pH range of 6.5–9.0. Confocal fluorescence microscopy imaging was drawn using RAW 264.7 cells, which suggest the applicability of the probe for detecting Hg2+ in living cells.
 | ||
| Fig. 282 Chemical and DFT-optimized structure of ligand 320 and the proposed ligand–metal complexation mechanism. | ||
Bazzicalupi et al.444 reported the synthesis and characterization of three new coumarin-based fluorescent chemosensors 321–323 (Fig. 283), which exhibited Off–On selective responses toward Hg2+ ions assessed in MeCN–H2O 4![[thin space (1/6-em)]](https://www.rsc.org/images/entities/char_2009.gif) :
:![[thin space (1/6-em)]](https://www.rsc.org/images/entities/char_2009.gif) 1 (v/v). All three ligands exhibited a chelation enhancement of the fluorescence emission (CHEF effect) with a very small red-shift in the emission maxima at 406 nm selectively on Hg2+ ions addition. The fluorescence emission enhancement due to the presence of Hg2+ ion, in fact, was much higher in comparison to the other metal ions determined by drawing the contrast bars with the competitive ions in MeCN–H2O (4
1 (v/v). All three ligands exhibited a chelation enhancement of the fluorescence emission (CHEF effect) with a very small red-shift in the emission maxima at 406 nm selectively on Hg2+ ions addition. The fluorescence emission enhancement due to the presence of Hg2+ ion, in fact, was much higher in comparison to the other metal ions determined by drawing the contrast bars with the competitive ions in MeCN–H2O (4![[thin space (1/6-em)]](https://www.rsc.org/images/entities/char_2009.gif) :
:![[thin space (1/6-em)]](https://www.rsc.org/images/entities/char_2009.gif) 1 v/v, 25 °C, pH 7.0). The emission bands were centered at λ = 406 nm, and mercury(II) complexation caused a CHEF effect, namely, an enhancement in the intensity by a factor 1.5, 2.3, and 2.3 for ligands 321–323, respectively. The designed ligands 321–323 exhibited association constant values of 1.3 × 10⁵, 6.6 × 10⁴, and 7.1 × 10⁵ M−1, respectively, and a 1
1 v/v, 25 °C, pH 7.0). The emission bands were centered at λ = 406 nm, and mercury(II) complexation caused a CHEF effect, namely, an enhancement in the intensity by a factor 1.5, 2.3, and 2.3 for ligands 321–323, respectively. The designed ligands 321–323 exhibited association constant values of 1.3 × 10⁵, 6.6 × 10⁴, and 7.1 × 10⁵ M−1, respectively, and a 1![[thin space (1/6-em)]](https://www.rsc.org/images/entities/char_2009.gif) :
:![[thin space (1/6-em)]](https://www.rsc.org/images/entities/char_2009.gif) 1 complex stoichiometry. The designed sensor material was further employed for tracing Hg2+ inside living cells, as assessed by the confocal visualization on Cos-7 cells.
1 complex stoichiometry. The designed sensor material was further employed for tracing Hg2+ inside living cells, as assessed by the confocal visualization on Cos-7 cells.
García-Beltrán et al.445 presented 2-amino-3-hydroxy-2-(hydroxymethyl)propyl 2-(7-hydroxy-2-oxo-2H-chromen-4-yl)acetate 324 (Fig. 284) as a molecular probe for reversible mercuric ion detection in HEPES buffer under physiological conditions. The probe exhibited the absorption signal with the maximum intensity at 330 nm and a shoulder near 375 nm, whereas the emission band was at 460 nm. However, the introduction of Hg2+ into the reaction solution of the probe caused fluorescence quenching at the emission intensity of 460 nm when it was excited at 330 nm, and the quenching behavior was directly proportional to the Hg2+ concentration. The ratiometric fluorescence quenching of the probe emission with a linear relationship between the fluorescence intensity and Hg2+ concentration and the high correlation coefficient (0.9916) suggested the applicability of the proposed probe for selective Hg2+ sensing with a detection limit of 1.1 × 10⁻⁹ M. The stability constant Ka of the 324–Hg2+ interaction was determined using the Benesi–Hildebrand equation, which gave a value of 1.29 × 10⁴ M−1, and the binding stoichiometry was determined from the Job's plot, which give a mole fraction of Hg2+ close to 0.5, indicating the formation of a 1![[thin space (1/6-em)]](https://www.rsc.org/images/entities/char_2009.gif) :
:![[thin space (1/6-em)]](https://www.rsc.org/images/entities/char_2009.gif) 1 complex between 324 and Hg2+. The 1
1 complex between 324 and Hg2+. The 1![[thin space (1/6-em)]](https://www.rsc.org/images/entities/char_2009.gif) :
:![[thin space (1/6-em)]](https://www.rsc.org/images/entities/char_2009.gif) 1 stoichiometry was further confirmed by the appearance of a peak at m/z 524.0482, which was assigned to [28 + Hg2+]+ in the ESI spectrum. The sensor reversibility was determined by the addition of glutathione in the probe solution, which caused an increase in the fluorescence emission intensity, suggesting the detachment of Hg2+ from the 324–Hg2+ complex. The probe showed excellent cell permeability, suggesting it was suitable for intracellular Hg2+ detection through bioimaging.
1 stoichiometry was further confirmed by the appearance of a peak at m/z 524.0482, which was assigned to [28 + Hg2+]+ in the ESI spectrum. The sensor reversibility was determined by the addition of glutathione in the probe solution, which caused an increase in the fluorescence emission intensity, suggesting the detachment of Hg2+ from the 324–Hg2+ complex. The probe showed excellent cell permeability, suggesting it was suitable for intracellular Hg2+ detection through bioimaging.
5.4. Thiourea-based Hg2+ sensor
Vonlanthen et al.446 reported thiourea–naphthalimide conjugates with extended binding domains function 325 (Fig. 285) as a metal-responsive fluorescent chemosensor in aqueous media. The proposed sensor was capable of providing a useful turn-on response to Zn2+, Cd2+, and Hg2+ with at least high-nanomolar sensitivity. The authors succeeded in obtaining the crystal structure in order to gain a deeper understanding of the details of the thiourea coordination environment. Furthermore, the proposed thiourea-based chemosensor could be employed for the fluorescence microscopy imaging of Hg2+ ion concentrations in living mammalian cells.5.5. Azo derivative as a Hg2+ sensor
Tian et al.447 introduced a novel azo derivative sensor 326 (Fig. 286) based on alkynes and utilized it toward the detection of Hg2+ in aqueous solutions and living cells. The new strategy achieved “off to on” switchable fluorescence. The probe permitted the highly selective and sensitive detection of Hg2+. It was determined that the free probe displayed a very weak fluorescence (quantum yield: 0.008) at an emission maxima of 525 nm, while there was a dramatic enhancement in the fluorescence intensity up to a 168-fold increase at 525 nm upon Hg2+ addition with an improved fluorescence quantum yield from 0.008 to 0.0419. The probe–mercury chelating stoichiometry was calculated as 1![[thin space (1/6-em)]](https://www.rsc.org/images/entities/char_2009.gif) :
:![[thin space (1/6-em)]](https://www.rsc.org/images/entities/char_2009.gif) 1 from the Job's plot, and the association constant of 3.96 × 10⁶ M−1 was inferred from the titration curve. The binding mode was further confirmed by the NMR titration experiment. In view of practical application of the sensor, the fluorescence imaging for Hg2+ was carried out utilizing live HT-29 cells through scanning confocal microscopy, which revealed that the proposed sensor was cell-permeable and could respond to Hg2+ within living cells.
1 from the Job's plot, and the association constant of 3.96 × 10⁶ M−1 was inferred from the titration curve. The binding mode was further confirmed by the NMR titration experiment. In view of practical application of the sensor, the fluorescence imaging for Hg2+ was carried out utilizing live HT-29 cells through scanning confocal microscopy, which revealed that the proposed sensor was cell-permeable and could respond to Hg2+ within living cells.
5.6. Benzothiazolium salts as a Hg2+ sensor
Zhao et al.448 introduced tetraphenylethene-functionalized benzothiazolium salts 327 (Fig. 287) with different counteranions and screened the applicability of 327 as a light-up fluorescent sensor for Hg2+ in aqueous solutions with high sensitivity and specificity owing to the elimination of the emission quenching effect of the iodide ion by the formation of HgI2 as well as by the addition of aggregate formation by the complexation of Hg2+ with the S atom of the benzothiazolium unit of 327–I. The probe exhibited an 80-fold enhancement in the emission intensity on 2 mM addition of Hg2+ into the aqueous solution of the probe. The authors further developed a solid film of 327–I that could monitor the level of Hg2+ in an aqueous solution with a detection limit of 1 μm.5.7. Pyrazoline-based Hg2+ sensor
Wang et al.449 presented the preparation of a pyrazoline compound 328 (Fig. 288) for the determination of Hg2+ with selectivity and sensitivity in a EtOH–H2O = 9![[thin space (1/6-em)]](https://www.rsc.org/images/entities/char_2009.gif) :
:![[thin space (1/6-em)]](https://www.rsc.org/images/entities/char_2009.gif) 1 (v/v) solution. The sensor showed a ratiometric fluorescent response with a good tolerance to the competitive ions at 388 nm on Hg2+ binding, manifesting the 1
1 (v/v) solution. The sensor showed a ratiometric fluorescent response with a good tolerance to the competitive ions at 388 nm on Hg2+ binding, manifesting the 1![[thin space (1/6-em)]](https://www.rsc.org/images/entities/char_2009.gif) :
:![[thin space (1/6-em)]](https://www.rsc.org/images/entities/char_2009.gif) 1 stoichiometry as assessed from the Job's curve. The proposed sensor material exhibited very good sensitivity with a fluorometric detection limit of 3.85 × 10⁻¹⁰ M. For practical applicability, ligand 328 was further utilized to trace Hg2+ in live cells in a bioimaging experiment utilizing HeLa cell lines.
1 stoichiometry as assessed from the Job's curve. The proposed sensor material exhibited very good sensitivity with a fluorometric detection limit of 3.85 × 10⁻¹⁰ M. For practical applicability, ligand 328 was further utilized to trace Hg2+ in live cells in a bioimaging experiment utilizing HeLa cell lines.
5.8. Tetraphenylethene-based Hg2+ sensor
Ozturk et al.450 developed a turn-on fluorescent chemosensor based on the change in the polarity of the aggregation-induced emission of tetraphenylethene 329 (Fig. 289) for the detection of Hg2+ in an aqueous medium and in living cells. The sensing mechanism involved the formation of nonpolar fluorescent aggregates of tetraphenylethene molecules by the elimination of polar moieties of ligand with Hg2+ interaction. The non-emissive aqueous solution of 329 became highly emissive with a strong green emission centered at 475 nm up to 410-fold enhanced upon 1 equivalent Hg2+ addition. Increasing the concentration of Hg2+ in the solution of 329 led to an increase in the formation of aggregated species, and this was associated with an increase in fluorescence intensity. The 1![[thin space (1/6-em)]](https://www.rsc.org/images/entities/char_2009.gif) :
:![[thin space (1/6-em)]](https://www.rsc.org/images/entities/char_2009.gif) 1 stoichiometry was assessed by the Job's plot measurement. The feasibility of the probe was further assessed in living cells in a bioimaging experiment, utilizing HeLa cell lines and analyzing through a confocal fluorescence microscope.
1 stoichiometry was assessed by the Job's plot measurement. The feasibility of the probe was further assessed in living cells in a bioimaging experiment, utilizing HeLa cell lines and analyzing through a confocal fluorescence microscope.
5.9. Naphthalene-based Hg2+ sensor
Wang et al.451 described a multifunctional turn-on fluorescent nanosensor 330 (Fig. 290) in a pure aqueous solution by functionalizing highly ordered mesoporous nanoparticles with 3-isocyanatopropyltriethoxysilane and dansylcadaverine, followed by the characterization of the pore structure, textural property, microscopic morphology, molecular composition of the grafted organic fluorophore and colorimetric property for the sensitive and selective detection of Hg2+ in a wide pH span from 4.0 to 6.6. The probe exhibited a strong emission at approximately 512 nm with the excitation wavelength of 330 nm by suspending it in the aqueous solution. Interestingly, there was large fluorescence quenching at 512 nm on the introduction of increasing Hg2+ concentration and this quenching was attributed to photoinduced electron transfer (PET) from the excited dansyl moiety to the proximate mercuric ion. The plot of I0/(I − I0) versus 1/[Hg2+] revealed a linear relationship with R = 0.997 based on the fluorescence titration experiments, suggesting the 1![[thin space (1/6-em)]](https://www.rsc.org/images/entities/char_2009.gif) :
:![[thin space (1/6-em)]](https://www.rsc.org/images/entities/char_2009.gif) 1 binding model between 330 and Hg2+ ions with the association constant value of 1.32 × 10⁵ M−1. Concurrently, the quenched fluorescence of 330 was observed to recover upon the addition of some α-amino acids to the suspension of the 330–Hg2+ system. The α-amino acids might snatch Hg2+ from the 330–Hg2+ due to the larger stability constant of the complex formed by the α-amino acid and Hg2+ compared to that of 330 and Hg2+, thus indicating the potential for a multi-detection approach of the same sensor by utilizing its different optical response toward different analytes.
1 binding model between 330 and Hg2+ ions with the association constant value of 1.32 × 10⁵ M−1. Concurrently, the quenched fluorescence of 330 was observed to recover upon the addition of some α-amino acids to the suspension of the 330–Hg2+ system. The α-amino acids might snatch Hg2+ from the 330–Hg2+ due to the larger stability constant of the complex formed by the α-amino acid and Hg2+ compared to that of 330 and Hg2+, thus indicating the potential for a multi-detection approach of the same sensor by utilizing its different optical response toward different analytes.
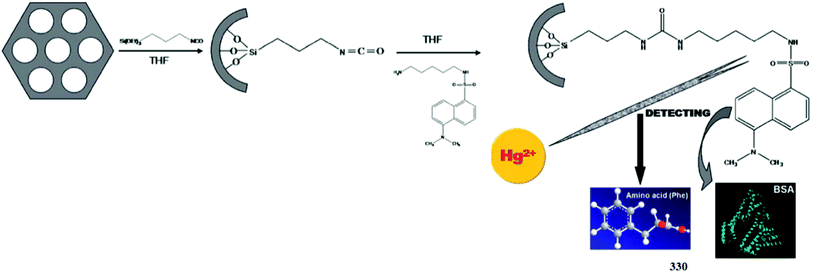 | ||
| Fig. 290 Schematic of the preparation of nanosensor 330 and its applications for a multifunctional fluorescent probe. | ||
In addition to the successful detection of Hg2+ and α-amino acids, the probe could be further applied for the detection of biological macromolecules such as bovine serum albumin (BSA). The probe displayed a gradual increase in the fluorescence intensity with a 12 nm blue-shift in the emission spectrum as well as a colorimetric change in the aqueous suspension from green to blue-green on titration with the BSA. A similar linear relationship with the fluorescence intensity of R = 0.992 and binding constant value of 9.3 × 10⁵ M−1 could suggest the 1![[thin space (1/6-em)]](https://www.rsc.org/images/entities/char_2009.gif) :
:![[thin space (1/6-em)]](https://www.rsc.org/images/entities/char_2009.gif) 1 binding model between 330 and BSA, suggesting the tendency of the current sensor to detect biological molecules under physiological conditions. Furthermore, nanosensor 330 exhibited appreciable cell permeability toward living cells, which could be successfully employed for intracellular mercury detection, as assessed through confocal fluorescence microscopy by the bioimaging experiment on HeLa cells.
1 binding model between 330 and BSA, suggesting the tendency of the current sensor to detect biological molecules under physiological conditions. Furthermore, nanosensor 330 exhibited appreciable cell permeability toward living cells, which could be successfully employed for intracellular mercury detection, as assessed through confocal fluorescence microscopy by the bioimaging experiment on HeLa cells.
5.10. Anthracene-based Hg2+ sensor
Ghosh et al.452 published a simple chemosensor 331 (Fig. 291) with the selective recognition ability toward Hg2+ in mixed aqueous–organic media by showing a significant increase in emission and a bluish color of the solution under exposure to UV light. In the interaction process, sensor 331 gave a 1![[thin space (1/6-em)]](https://www.rsc.org/images/entities/char_2009.gif) :
:![[thin space (1/6-em)]](https://www.rsc.org/images/entities/char_2009.gif) 1 stoichiometry with Hg2+, as confirmed by the Job's plot, and the association constant of the complex was determined to be (1.33 ± 0.31) × 104 M−1. The developed PET (photoinduced electron transfer) system 331 also possessed potential application to inhibit logic gates to report the selective detection of glutathione over cysteine and homocysteine. Furthermore, the potentiality of 331 in biological systems was evaluated for the in vitro detection of Hg2+ ions in human cervical cancer (HeLa) cells. The cytotoxicity of the sensor 331 was assessed for the cell morphology as well as the MTT assay, which showed more than 90% cell viability. Receptor 331 can be frequently applied to trace Hg2+ inside the cells due to its low level toxicity and higher cell permeability toward living cells.
1 stoichiometry with Hg2+, as confirmed by the Job's plot, and the association constant of the complex was determined to be (1.33 ± 0.31) × 104 M−1. The developed PET (photoinduced electron transfer) system 331 also possessed potential application to inhibit logic gates to report the selective detection of glutathione over cysteine and homocysteine. Furthermore, the potentiality of 331 in biological systems was evaluated for the in vitro detection of Hg2+ ions in human cervical cancer (HeLa) cells. The cytotoxicity of the sensor 331 was assessed for the cell morphology as well as the MTT assay, which showed more than 90% cell viability. Receptor 331 can be frequently applied to trace Hg2+ inside the cells due to its low level toxicity and higher cell permeability toward living cells.
5.11. BODIPY-based Hg2+ sensors
Vedamalai et al.453 reported a new boron-dipyrromethene (BODIPY) derivative 332 (Fig. 292) containing two triazole units as a fluorescence sensor that behaved selectively toward Hg2+ in comparison to a number of competing species. The ligand did not exhibit any fluorescence in the range of 400–700 nm, and the addition of a number of ionic species resulted in no enhancement in the fluorescence intensity. Hg2+ was the only ion that caused a colorimetric change in the solution, as well as a momentous increase in the fluorescence emission intensity at 520 nm when it was excited at 492 nm. The fluorescence intensity reached to maximum values on 4 equivalents Hg2+ addition with a 17-fold enhancement in the fluorescence quantum yield from Φ = 0.002 to 0.035. These results indicated that Hg2+ is the only metal ion among the number of tested cations that readily binds to 332, causing significant fluorescence enhancement and permitting the highly selective detection of Hg2+. The binding stoichiometry of the 332–Hg2+ complex was determined by plotting the emission intensity of 332 at 520 nm as a function of the molar fraction of 332 under a constant total concentration. The resulting Job plot showed the maximum emission intensity of the solution at the 0.5 mole fraction values, thus indicating the 1![[thin space (1/6-em)]](https://www.rsc.org/images/entities/char_2009.gif) :
:![[thin space (1/6-em)]](https://www.rsc.org/images/entities/char_2009.gif) 1 ratio for the 332–Hg2+ complex. Further evidence for the 1
1 ratio for the 332–Hg2+ complex. Further evidence for the 1![[thin space (1/6-em)]](https://www.rsc.org/images/entities/char_2009.gif) :
:![[thin space (1/6-em)]](https://www.rsc.org/images/entities/char_2009.gif) 1 binding mode was collected by the ESI-MS spectrum by the emergence of a peak at m/z = 828.1 as well as from the NMR titration analysis by the shifting of the signal upon Hg2+ addition. The apparent dissociation constant was calculated using a nonlinear regression analysis, which gave a value of 62.1 × 5.7 μM. The ligand exhibited the detection limit of 2.8 μm, as determined by the variation of fluorescence intensity as a function of Hg2+ concentration. Furthermore, the ligand was tested for the applicability toward Hg2+ detection in the intracellular environment in a bioimaging experiment employing HeLa cell lines. The developed chemosensor was determined to be an effective method for Hg2+ sensing in living cells.
1 binding mode was collected by the ESI-MS spectrum by the emergence of a peak at m/z = 828.1 as well as from the NMR titration analysis by the shifting of the signal upon Hg2+ addition. The apparent dissociation constant was calculated using a nonlinear regression analysis, which gave a value of 62.1 × 5.7 μM. The ligand exhibited the detection limit of 2.8 μm, as determined by the variation of fluorescence intensity as a function of Hg2+ concentration. Furthermore, the ligand was tested for the applicability toward Hg2+ detection in the intracellular environment in a bioimaging experiment employing HeLa cell lines. The developed chemosensor was determined to be an effective method for Hg2+ sensing in living cells.
Madhu et al.454 designed a multi-signaling Hg2+ sensor based on a benzimidazole-substituted BODIPY framework 333 (Fig. 293), which displayed excellent selectively toward Hg2+ in vitro and in vivo. The ratiometric increase in the absorption and emission spectra of the probe upon the addition of Hg2+ into its reaction solution revealed the chelating viability of the probe with mercury. From the changes in the fluorescence emission spectral intensity, the binding constant for sensing Hg2+ in the mixed solvent was estimated to be 6.18 × 10⁶ M−1 using the Benesi–Hildebrand equation, and detection limit was measured to be 0.77 μM. The electrochemical studies provided evidence that the fluorescence enhancement of the ligand upon Hg2+ binding was due to blocking of the photoinduced electron transfer (PET) from the benzimidazole nitrogen (donor) to the BODIPY unit (acceptor). Furthermore, the electrochemical studies pointed out the involvement of a lone pair of the benzimidazole nitrogen in coordination with Hg2+. Moreover, Job's plot analyses of both the changes in the absorbance and the fluorescence intensity revealed a maximum at ∼0.6, indicative of the formation of a 2![[thin space (1/6-em)]](https://www.rsc.org/images/entities/char_2009.gif) :
:![[thin space (1/6-em)]](https://www.rsc.org/images/entities/char_2009.gif) 1 complex between the ligand and Hg2+. However, on the basis of the NMR titration measurements, IR spectroscopy, and Job's plot analyses, the proposed Hg2+ binding mechanism with that of ligand is shown in Fig. 293. Moreover, a bioimaging experiment carried out through a confocal fluorescence microscope demonstrated that the ligand could permeate through the cellular membrane for both live and fixed cells, which allowed testing for its mercury sensing ability in cellular environments.
1 complex between the ligand and Hg2+. However, on the basis of the NMR titration measurements, IR spectroscopy, and Job's plot analyses, the proposed Hg2+ binding mechanism with that of ligand is shown in Fig. 293. Moreover, a bioimaging experiment carried out through a confocal fluorescence microscope demonstrated that the ligand could permeate through the cellular membrane for both live and fixed cells, which allowed testing for its mercury sensing ability in cellular environments.
Lu et al.455 reported a boron-dipyrromethene (BODIPY) derivative containing a tridentate diaza-oxa ligand 334 (Fig. 294) as a fluorescent turn-on chemosensor for Hg2+ with high detection sensitivity of less than 2 ppb and a rapid response time (≤5 seconds) under physiological conditions. The ligand showed very weak fluorescence with the quantum yield of 0.002 attributed to the photoinduced electron transfer quenching process from the electron donating Hpyramol receptor to the excited BDP fluorophore. However, mercury introduction into the probe solution triggered a 27-fold enhancement in the fluorescence intensity at the maximum emission of 509 nm and this behavior was found to be selective in comparison to the various background species. From the fluorescence titration experiment, the 1![[thin space (1/6-em)]](https://www.rsc.org/images/entities/char_2009.gif) :
:![[thin space (1/6-em)]](https://www.rsc.org/images/entities/char_2009.gif) 2 stoichiometry was estimated with the association constant value of 18.2 ± 0.1 determined by the nonlinear least squares analysis of the fluorescence intensity versus the concentration of Hg2+. The less than 2 ppb detection sensitivity of the probe efficiently coordinates to the U.S. Environmental Protection Agency's limit of Hg2+ for drinking water. Moreover, efficient green fluorescence from the live HeLa cells incubated with the probe and Hg2+ revealed the practical applicability of the ligand for intracellular Hg2+ detection within live cells.
2 stoichiometry was estimated with the association constant value of 18.2 ± 0.1 determined by the nonlinear least squares analysis of the fluorescence intensity versus the concentration of Hg2+. The less than 2 ppb detection sensitivity of the probe efficiently coordinates to the U.S. Environmental Protection Agency's limit of Hg2+ for drinking water. Moreover, efficient green fluorescence from the live HeLa cells incubated with the probe and Hg2+ revealed the practical applicability of the ligand for intracellular Hg2+ detection within live cells.
Zhang et al.456 designed a BODIPY-based probe 335 (Fig. 295) for the investigation of Hg2+ with high sensitivity and selectivity through intramolecular charge transfer (ICT) mechanisms. The gradual decrease in the absorption intensity of ligand at 594 nm and the appearance of a new absorption band at 564 nm indicated the binding of mercury to the thiaza crown ether. In the case of the fluorescence emission spectra, the free probe showed a maximum fluorescence emission at 656 nm upon excitation at 560 nm in a buffer solution, whereas on the introduction of Hg2+ into the probe solution, it exhibited a large emission blue-shift of 39 nm and a gradual increase in the emission intensity of the blue-shifted signal at 617 nm with a constant colorimetric change in the reaction solution color from red to orange under a UV light. The Job's curve indicates the 1![[thin space (1/6-em)]](https://www.rsc.org/images/entities/char_2009.gif) :
:![[thin space (1/6-em)]](https://www.rsc.org/images/entities/char_2009.gif) 1 stoichiometric complexation mode with the detection limit even lower than the upper limit (10 nM) as announced by the United States Environmental Protection Agency (EPA) mandate for Hg2+ in drinking water. Although remarkable fluorescence enhancements were detected upon the addition of Ag+, there was a smaller wavelength shift (3 nm) along with the disturbance of Ag+, which could be eliminated by the ratiometric signals. The ligand had a higher binding affinity for Hg2+ (3.19 × 10⁶ M−1) than that for Ag+ (7.64 × 10⁴ M−1), as obtained by the nonlinear regression analysis, which indicated the capacity of Hg2+ to displace Ag+ to form more stable complexes. On the basis of this observation, the proposed ligand–metal binding mechanism is shown in Fig. 295. Moreover, live cell imaging based on the ligand was investigated using confocal laser scanning microscopy using HeLa cells, which demonstrated that the probe could penetrate the living cell-membrane, thus showing its promising utility for tracing Hg2+ in live cells.
1 stoichiometric complexation mode with the detection limit even lower than the upper limit (10 nM) as announced by the United States Environmental Protection Agency (EPA) mandate for Hg2+ in drinking water. Although remarkable fluorescence enhancements were detected upon the addition of Ag+, there was a smaller wavelength shift (3 nm) along with the disturbance of Ag+, which could be eliminated by the ratiometric signals. The ligand had a higher binding affinity for Hg2+ (3.19 × 10⁶ M−1) than that for Ag+ (7.64 × 10⁴ M−1), as obtained by the nonlinear regression analysis, which indicated the capacity of Hg2+ to displace Ag+ to form more stable complexes. On the basis of this observation, the proposed ligand–metal binding mechanism is shown in Fig. 295. Moreover, live cell imaging based on the ligand was investigated using confocal laser scanning microscopy using HeLa cells, which demonstrated that the probe could penetrate the living cell-membrane, thus showing its promising utility for tracing Hg2+ in live cells.
5.12. Thiosemicarbazone-based Hg2+ sensor
Mahapatra et al.457 reported a carbazole-phenylthiosemicarbazone-based open chemosensor 336 (Fig. 296) for selective Hg2+ detection with an appreciable sensitivity of 2.54 × 10⁻¹⁰ M. The ligand exhibited three absorption bands centered at 324, 365, and 382 nm, which declined dramatically on Hg2+ addition with the evolution of clear isosbestic points at 289 and 398 nm, suggesting the presence of two species in the reaction mixture, which were proposed as free ligands and ligand–Hg2+ complex. There was no obvious response for the competitive ions, suggesting the great chelation preference of the ligand toward Hg2+. Concurrently, the 98% quenching of the fluorescence emission bands of the ligand at 436 nm on 1 equivalent Hg2+ addition was attributed to the structural changes in the ligands on Hg2+ chelation. The ligand exhibited a 1![[thin space (1/6-em)]](https://www.rsc.org/images/entities/char_2009.gif) :
:![[thin space (1/6-em)]](https://www.rsc.org/images/entities/char_2009.gif) 1 complexation stoichiometry with that of Hg2+, as assessed by the Job's curve. The binding constant was calculated to be 3.04 × 10⁴ M−1. Furthermore, the IMP logic gate was also generated by choosing Hg2+ and cysteine as the input and by monitoring the output signal at 436 nm, originating from the emission spectra of the chemosensor in the presence of Hg2+. Moreover, the ligand exhibited momentous cell viability and membrane permeability toward live cells, as assessed on Candida albicans cells in the bioimaging experiment.
1 complexation stoichiometry with that of Hg2+, as assessed by the Job's curve. The binding constant was calculated to be 3.04 × 10⁴ M−1. Furthermore, the IMP logic gate was also generated by choosing Hg2+ and cysteine as the input and by monitoring the output signal at 436 nm, originating from the emission spectra of the chemosensor in the presence of Hg2+. Moreover, the ligand exhibited momentous cell viability and membrane permeability toward live cells, as assessed on Candida albicans cells in the bioimaging experiment.
5.13. Pyrene-based Hg2+ sensor
Wang et al.458 introduced a new pyrene-based probe 337 (Fig. 297) with two triazole units, which exhibited fluorescence quenching in the presence of Hg2+ ions and this response was found to be selective in comparison to the various competitive ions. The binding ratio of the chemosensor–Hg2+ complexes was determined to be 1![[thin space (1/6-em)]](https://www.rsc.org/images/entities/char_2009.gif) :
:![[thin space (1/6-em)]](https://www.rsc.org/images/entities/char_2009.gif) 1 according to the Job's plot experiments and the ESI-MS spectral measurements. The association constants (Ka) of the chemosensor–Hg2+ complexes were determined to be 1.68 × 10³ M−1. During Hg2+ titration with chemosensor 337, there was no change in the absorption spectra with the maximum absorption at 343 nm, which showed the independency of the absorption properties of the chemosensor on Hg2+ introduction into its reaction solution. In contrast, there was a significant quenching of the fluorescence emission band centered at 474 nm during Hg2+ titration and the fluorescence intensity reached the minimum value on 1 equivalent Hg2+ addition. Overall, there was an 18-fold decrease in the relative fluorescence quantum yield of sensor 337 from 0.16 to 0.009. This quenching response of sensor 337 with that of Hg2+ was determined to be selective in comparison to the competing ions. The overlay of fluorescence and bright-field images obtained from the fluorescence microscope showed that the fluorescence signals were localized in the intracellular area, indicating a subcellular distribution of Hg2+ and the good cell-membrane permeability of the chemosensor.
1 according to the Job's plot experiments and the ESI-MS spectral measurements. The association constants (Ka) of the chemosensor–Hg2+ complexes were determined to be 1.68 × 10³ M−1. During Hg2+ titration with chemosensor 337, there was no change in the absorption spectra with the maximum absorption at 343 nm, which showed the independency of the absorption properties of the chemosensor on Hg2+ introduction into its reaction solution. In contrast, there was a significant quenching of the fluorescence emission band centered at 474 nm during Hg2+ titration and the fluorescence intensity reached the minimum value on 1 equivalent Hg2+ addition. Overall, there was an 18-fold decrease in the relative fluorescence quantum yield of sensor 337 from 0.16 to 0.009. This quenching response of sensor 337 with that of Hg2+ was determined to be selective in comparison to the competing ions. The overlay of fluorescence and bright-field images obtained from the fluorescence microscope showed that the fluorescence signals were localized in the intracellular area, indicating a subcellular distribution of Hg2+ and the good cell-membrane permeability of the chemosensor.
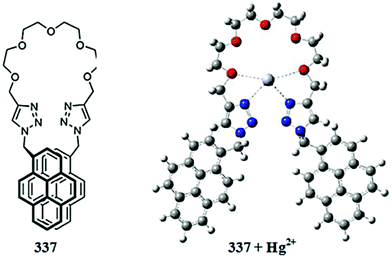 | ||
| Fig. 297 Chemical structure of 337 and the DFT-optimized structure of the ligand upon Hg2+ addition. | ||
5.14. Thiocarbamate-based Hg2+ sensor
Hatai et al.459 designed a bipodal thiocarbamate scaffold attached to histidine moieties 338 (Fig. 298) as a chemosensor for selective Hg2+ detection. The probe alone exhibited an absorption band centered at 373 nm and at 260 nm, while on 1 equivalent Hg2+ addition, the absorption band at 373 nm completely disappeared with the emergence of a new band at 295 nm. The significant changes in the absorption spectrum up to 1 equivalent Hg2+ addition indicate the 1![[thin space (1/6-em)]](https://www.rsc.org/images/entities/char_2009.gif) :
:![[thin space (1/6-em)]](https://www.rsc.org/images/entities/char_2009.gif) 1 stoichiometric ratio of the ligand–Hg2+ complex. Moreover, the probe showed a weak emission band at 590 nm with a very low level quantum yield, Φ = 0.022. However, 4 equivalents introduction of Hg2+ triggered the fluorescence emission with a 17-fold enhancement in the fluorescence intensity and a 19-fold enhancement of quantum yield (Φ = 0.402) along with a 50 nm blue-shift and easily recognizable colorimetric change of the reaction solution from dark orange to greenish-yellow. The fluorescence titration experiment and NMR analysis as well as mass spectrometry data suggest the 1
1 stoichiometric ratio of the ligand–Hg2+ complex. Moreover, the probe showed a weak emission band at 590 nm with a very low level quantum yield, Φ = 0.022. However, 4 equivalents introduction of Hg2+ triggered the fluorescence emission with a 17-fold enhancement in the fluorescence intensity and a 19-fold enhancement of quantum yield (Φ = 0.402) along with a 50 nm blue-shift and easily recognizable colorimetric change of the reaction solution from dark orange to greenish-yellow. The fluorescence titration experiment and NMR analysis as well as mass spectrometry data suggest the 1![[thin space (1/6-em)]](https://www.rsc.org/images/entities/char_2009.gif) :
:![[thin space (1/6-em)]](https://www.rsc.org/images/entities/char_2009.gif) 1 binding mode of the probe with Hg2+. In addition, the colorimetric change in the chemosensor upon Hg2+ binding was utilized to fabricate the paper strips for the detection of Hg2+ in an aqueous solution. Furthermore, the fluorescence imaging experiment using an epifluorescence microscope suggested the applicability of the sensor for the imaging of Hg2+ in adult zebrafish and in human epithelial carcinoma HeLa cells.
1 binding mode of the probe with Hg2+. In addition, the colorimetric change in the chemosensor upon Hg2+ binding was utilized to fabricate the paper strips for the detection of Hg2+ in an aqueous solution. Furthermore, the fluorescence imaging experiment using an epifluorescence microscope suggested the applicability of the sensor for the imaging of Hg2+ in adult zebrafish and in human epithelial carcinoma HeLa cells.
5.15. Naphthalenedimide-based Hg2+ sensor
Li et al.460 designed and reported a new near-IR “turn-on” fluorescent chemosensor 339 (Fig. 299) with high selectivity for Hg2+ ions following the twisted intramolecular charge transfer (TICT) mechanism. The selective fluorescence enhancement effect could be optimized by modulating the solvent systems. The selectivity of 339 to Hg2+ was examined in the presence of various metal ions in the mentioned pH values. The ligand still worked well and exhibited good selectivity over a wide range of competing species. The interaction and binding behavior between 339 and Hg2+ ions were investigated with their 1H NMR and ESI-MS spectra. The stable fluorescence and good selectivity, longer wavelength absorption and emission, decisive cell permeability, and its function in the wide range of pH showed that the proposed probe was favorable for imaging Hg2+ ions in living cells and had in vivo potentiality.5.16. Naphthalimide-based Hg2+ sensors
Chen et al.461 developed a new fluorescent sensor 340 (Fig. 300) based on the naphthalimide chromophore and thioether-rich crown receptor as a dual signaling probe for Hg2+ and Ag+ in an aqueous solution. The ligand showed very low intensity emission signals at 547 nm when it was excited at 445 nm. Upon the introduction of mercury, a drastic change in the fluorescence occurred by a 5-fold enhancement in the intensity of the emission signal with a slight blue-shift from 547 to 532 nm but there was no change in the absorption signal at 440 nm. The ligand solution exhibited a linear increase in the emission intensity at 532 nm with good linearly dependent coefficient values of 0.9962, indicating the potential utility of the ligand for the ratiometric quantification of mercury. The Job's plot showed the maximum fluorescence intensity at 0.5 mole fraction, indicating the 1![[thin space (1/6-em)]](https://www.rsc.org/images/entities/char_2009.gif) :
:![[thin space (1/6-em)]](https://www.rsc.org/images/entities/char_2009.gif) 1 stoichiometry of the ligand–metal complex. Further mechanistic insight was obtained from the NMR titration experiment. The association constant for the ligand with Hg2+ was determined to be 7.4 × 10⁸ M−1 on the basis of 1
1 stoichiometry of the ligand–metal complex. Further mechanistic insight was obtained from the NMR titration experiment. The association constant for the ligand with Hg2+ was determined to be 7.4 × 10⁸ M−1 on the basis of 1![[thin space (1/6-em)]](https://www.rsc.org/images/entities/char_2009.gif) :
:![[thin space (1/6-em)]](https://www.rsc.org/images/entities/char_2009.gif) 1 stoichiometric complex, and the detection limit was calculated to be 50 ppb. During the competitive experiment of the ligand (3 equivalents) in the presence of 1.5 equivalents Hg2+, almost no effect was observed with the various competing species, including Na+, K+, Cs+, Ca2+, Mg2+, Ba2+, Fe2+, Fe3+, Co2+, Ni2+, Zn2+, Cd2+, Cr3+, Cu2+ and Pb2+, but the same concentration of Ag+ caused an obvious quenching of the emission signal for the ligand–Hg2+ complex, resulting in an Off–On–Off type fluorescent response. The Ag+ induced quenching was considered to be due to the intramolecular d–π interaction between Ag+ and the fluorophore. The high intensity green fluorescence appearance from the HeLa cells in the confocal fluorescence microscopy experiment revealed the good cell permeability and tendency of the ligand for detecting intracellular Hg2+ level in living cells.
1 stoichiometric complex, and the detection limit was calculated to be 50 ppb. During the competitive experiment of the ligand (3 equivalents) in the presence of 1.5 equivalents Hg2+, almost no effect was observed with the various competing species, including Na+, K+, Cs+, Ca2+, Mg2+, Ba2+, Fe2+, Fe3+, Co2+, Ni2+, Zn2+, Cd2+, Cr3+, Cu2+ and Pb2+, but the same concentration of Ag+ caused an obvious quenching of the emission signal for the ligand–Hg2+ complex, resulting in an Off–On–Off type fluorescent response. The Ag+ induced quenching was considered to be due to the intramolecular d–π interaction between Ag+ and the fluorophore. The high intensity green fluorescence appearance from the HeLa cells in the confocal fluorescence microscopy experiment revealed the good cell permeability and tendency of the ligand for detecting intracellular Hg2+ level in living cells.
Li et al.462 reported a novel naphthalimide–porphyrin hybrid fluorescence probe 341 (Fig. 301) for the ratiometric detection of Hg2+ in aqueous solutions and living cells. Two fluorophores were involved in the synthesis of the probe, and the fluorescence measurement showed the suitability of the probe for Hg2+ binding when there was a longer distance between the two fluorophores. Upon Hg2+ addition into the ligand solution, there was a ratiometric enhancement in the fluorescence intensity at 525 nm, which indicated naphthalimide emission; moreover, there was also a linear decrease in the emission intensity at 650 nm, which corresponded to the porphyrin emission, illustrating the involvement of both the fluorophores in the complexation with Hg2+ when the ligand solution was excited at 415 nm. The results from the UV-visible absorption spectra were consistent with the fluorescence emission spectra. The sensors were capable of detecting Hg2+ in significant low concentrations with the calculated detection limit values of 2.0 × 10⁻⁸ M determined using (3σ per slope) methods. The probe showed a fast response time and considerable high selectivity toward Hg2+, as assessed by the competitive experiment using various cationic species. The reversible behavior of the sensor toward Hg2+ was determined by the addition of 2 equivalents EDTA solution into the 341–Hg2+ complex solution, which caused a dramatic decrease in the emission intensity at 525 nm and an increase in the emission intensity at 650 nm, suggesting the release of Hg2+ from the ligand–Hg2+ complex by switching it to the original ligand and releasing the Hg2+ involved in the binding toward EDTA. The 1![[thin space (1/6-em)]](https://www.rsc.org/images/entities/char_2009.gif) :
:![[thin space (1/6-em)]](https://www.rsc.org/images/entities/char_2009.gif) 2 ligand–metal stoichiometries were determined by the fluorescence titration experiment and from the NMR titration experiment. The association constant was estimated by the change in the emission intensity at 525 and 650 nm, which was 6.31 × 10⁵ M−1 for the naphthalimide-linked pyridine moiety and 4.26 × 10⁵ M−1 for the porphyrin unit. The preliminary experiment was also conducted by utilizing river and pond water to detect the Hg2+ concentration in the view of practical environmental monitoring. The sensor also exhibited potential biomedical application for sensing Hg2+ in the intracellular environment, as proven by the bioimaging experiment utilizing HeLa cells.
2 ligand–metal stoichiometries were determined by the fluorescence titration experiment and from the NMR titration experiment. The association constant was estimated by the change in the emission intensity at 525 and 650 nm, which was 6.31 × 10⁵ M−1 for the naphthalimide-linked pyridine moiety and 4.26 × 10⁵ M−1 for the porphyrin unit. The preliminary experiment was also conducted by utilizing river and pond water to detect the Hg2+ concentration in the view of practical environmental monitoring. The sensor also exhibited potential biomedical application for sensing Hg2+ in the intracellular environment, as proven by the bioimaging experiment utilizing HeLa cells.
5.17. Amino acid-based Hg2+ sensor
Neupane et al.463 developed an amino acid-based fluorescent sensor 342 (Fig. 302) bearing a triazole group as a Hg2+ sensitive ratiometric sensor in a 100% aqueous solution. The probe exhibited a fluorescence emission spectrum at 530 nm when it was excited at 330 nm. This fluorescence response of the probe was quenched in the presence of Hg2+, whereas there was negligible quenching with the copper ions. The ratiometric fluorescence quenching due to Hg2+ in the 100% aqueous media suggests the applicability of probe as a fluorescence On–Off sensor for Hg2+ in pure aqueous media. Even though the ratiometric changes in the sensor molecule induced by Hg2+ are not great, 342 still showed a selective ratiometric response to Hg2+ in 100% aqueous solutions, whereas most of the ratiometric sensors for Hg2+ require organic solvents for their operation. The sensitivity of 342 for Hg2+ was calculated on the basis of the linear relationships between the maximum emission intensity at 530 and the concentration of Hg2+. The sensor had a detection limit of 96 nM, and the dissociation constant for Hg2+ in an aqueous solution was calculated to be 672 nM. The 1![[thin space (1/6-em)]](https://www.rsc.org/images/entities/char_2009.gif) :
:![[thin space (1/6-em)]](https://www.rsc.org/images/entities/char_2009.gif) 1 binding mode of 342 with Hg2+ was investigated by ESI mass spectrometry, NMR spectroscopy, and UV-vis absorption measurement. To further validate the applicability of sensor 342 to detect intracellular Hg2+, the fluorescent images of HeLa cells incubated with 342 were monitored in a confocal fluorescence microscopy experiment. The light blue color image of the cells indicated that 342 penetrated the HeLa cells in this condition. After the addition of Hg2+ into the ligand-loaded cells, a considerable color change of the cells from deep sky blue to blue color (Fig. 302) occurred, demonstrating that 342 penetrated into the live cells and was thus capable of detecting intracellular Hg2+ by a ratiometric response.
1 binding mode of 342 with Hg2+ was investigated by ESI mass spectrometry, NMR spectroscopy, and UV-vis absorption measurement. To further validate the applicability of sensor 342 to detect intracellular Hg2+, the fluorescent images of HeLa cells incubated with 342 were monitored in a confocal fluorescence microscopy experiment. The light blue color image of the cells indicated that 342 penetrated the HeLa cells in this condition. After the addition of Hg2+ into the ligand-loaded cells, a considerable color change of the cells from deep sky blue to blue color (Fig. 302) occurred, demonstrating that 342 penetrated into the live cells and was thus capable of detecting intracellular Hg2+ by a ratiometric response.
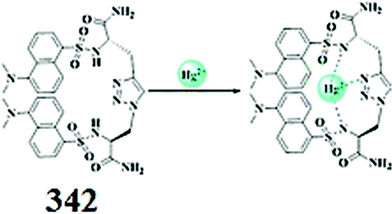 | ||
| Fig. 302 Chemical structure for ligand 342, proposed ligand–Hg2+ chelation mechanism and applications toward live cells. | ||
5.18. Dansyl-based Hg2+ sensors
Lohani et al.464 reported dansyl fluorophore based on a Lys amino acid 343 (Fig. 303) for Hg2+ detection in 100% aqueous media. The probe exhibited very little emission with the maximum intensity at 500 nm when it was excited at 380 nm. Upon the addition of 1 eq. of Hg2+, an approximately 15-fold enhancement of the emission intensity at 500 nm was observed. This outstanding selectivity of the probe toward Hg2+ could be employed as a detector in 100% aqueous media. A Job's plot, which exhibited a maximum intensity at 0.5 mol fractions, indicated that the sensor formed a 1![[thin space (1/6-em)]](https://www.rsc.org/images/entities/char_2009.gif) :
:![[thin space (1/6-em)]](https://www.rsc.org/images/entities/char_2009.gif) 1 complex with Hg2+. Assuming the formation of a 1
1 complex with Hg2+. Assuming the formation of a 1![[thin space (1/6-em)]](https://www.rsc.org/images/entities/char_2009.gif) :
:![[thin space (1/6-em)]](https://www.rsc.org/images/entities/char_2009.gif) 1 complex, the dissociation constant was calculated, based on the titration curve with Hg2+ by a nonlinear least squares fit, to be Kd = 4.28 × 10⁻⁹ M with a good linear relationship having linearly dependent coefficient value of R2 = 0.9621, indicating that 343 had a tight binding affinity to Hg2+ in a 100% aqueous solution. The binding mechanism was further supported by the mass spectrometry analysis and NMR titration experiment. The sensitivity of 343 for Hg2+ was calculated on the bases of the linear relationships between the maximum emission intensity at 503 nm and the concentration of Hg2+. The sensor had a detection limit of 8.7 nM (1.7 ppb), which is quite low for practical applicability in environmental monitoring. Furthermore, significant increases in the fluorescence intensity in HeLa cells upon loading with Hg2+ demonstrated that 343 could be used to image intracellular Hg2+ in living cells.
1 complex, the dissociation constant was calculated, based on the titration curve with Hg2+ by a nonlinear least squares fit, to be Kd = 4.28 × 10⁻⁹ M with a good linear relationship having linearly dependent coefficient value of R2 = 0.9621, indicating that 343 had a tight binding affinity to Hg2+ in a 100% aqueous solution. The binding mechanism was further supported by the mass spectrometry analysis and NMR titration experiment. The sensitivity of 343 for Hg2+ was calculated on the bases of the linear relationships between the maximum emission intensity at 503 nm and the concentration of Hg2+. The sensor had a detection limit of 8.7 nM (1.7 ppb), which is quite low for practical applicability in environmental monitoring. Furthermore, significant increases in the fluorescence intensity in HeLa cells upon loading with Hg2+ demonstrated that 343 could be used to image intracellular Hg2+ in living cells.
Ma et al.465 developed a fluorescent sensor, dansyl-L-aspartic acid 344 (Fig. 304) for specific Hg2+ detection in a neutral aqueous solution as well as in live cells. The ligand showed very weak fluorescence, while the addition of 5 equivalents bovine serum albumin (BSA) into the solution of 344 led to a dramatic change in the fluorescence of up to a 10.7-fold enhancement in the intensity with a 44 nm blue-shift in the spectrum. The 1![[thin space (1/6-em)]](https://www.rsc.org/images/entities/char_2009.gif) :
:![[thin space (1/6-em)]](https://www.rsc.org/images/entities/char_2009.gif) 1 stoichiometry was determined between 344 and BSA using the fluorometric titration with good linearly dependent coefficient value of 0.995, and a binding constant of (6.35 ± 0.03) × 104 M−1. Interestingly, the aqueous solution containing 344–BSA complex showed a further blue-shift of 35 nm with an enhancement in the intensity upon Hg2+ addition. This behavior of the ligand–BSA complex toward Hg2+ could be employed as a tool for Hg2+ detection with a quite low detection limit of 0.5 μM. The Job's plot analysis showed the 1
1 stoichiometry was determined between 344 and BSA using the fluorometric titration with good linearly dependent coefficient value of 0.995, and a binding constant of (6.35 ± 0.03) × 104 M−1. Interestingly, the aqueous solution containing 344–BSA complex showed a further blue-shift of 35 nm with an enhancement in the intensity upon Hg2+ addition. This behavior of the ligand–BSA complex toward Hg2+ could be employed as a tool for Hg2+ detection with a quite low detection limit of 0.5 μM. The Job's plot analysis showed the 1![[thin space (1/6-em)]](https://www.rsc.org/images/entities/char_2009.gif) :
:![[thin space (1/6-em)]](https://www.rsc.org/images/entities/char_2009.gif) 1 stoichiometry of the ligand–BSA complex with that of Hg2+. Further mechanistic insight was obtained through the NMR titration experiment. The proposed sensor was further employed for intracellular Hg2+ detection inside the live cells in a bioimaging experiment, wherein the sensor was proven to exhibit appreciable membrane permeability and viability toward living cells.
1 stoichiometry of the ligand–BSA complex with that of Hg2+. Further mechanistic insight was obtained through the NMR titration experiment. The proposed sensor was further employed for intracellular Hg2+ detection inside the live cells in a bioimaging experiment, wherein the sensor was proven to exhibit appreciable membrane permeability and viability toward living cells.
Chen et al.466 described a novel homoplastic pod and fluorescent sensor 345 (Fig. 305) based on flexible hydrophilic lysine as a tridentate binding toward Hg2+ that finally resulted in a unique selectivity to Hg2+ over other transition metal ions with a hypersensitivity of about 2.0 nM in neutral buffered aqueous solutions. In buffer solutions of 345, the addition of HgCl2 induced a significant change in the fluorescent spectra with a gradual blue-shift (Δλmax = 51 nm, from 540 to 489 nm). Moreover, there was a colorimetric fluorescence change in the reaction solution from yellow to green under illumination with 365 nm light after mercury introduction. The significant blue-shift of the maximum emission was attributed to the deprotonation of the sulfonamide upon the cationic binding. At a low concentration of Hg2+ (0–0.167 μM), a polarity change in the microenvironment around the dansyl moieties probably cause an enhancement of the emission intensity, and the coordination of 345 and Hg2+ produced a blue-shift of 32 nm. Along with the addition of Hg2+ (0.167–4.5 μM), the quenching effect of the heavy metal ion induced the reduction of the emission intensity with another blue-shift (Δλ = 17 nm). Benesi–Hildebrand plots gave binding constants of 2.1 × 10⁶ and 3.0 × 10⁵ L mol−1 for Hg2+ in aqueous solutions (1![[thin space (1/6-em)]](https://www.rsc.org/images/entities/char_2009.gif) :
:![[thin space (1/6-em)]](https://www.rsc.org/images/entities/char_2009.gif) 1). A blue-shift was observed when more Hg2+ was added. These results showed that a more strong force between 345 and Hg2+ existed under low concentrations of Hg2+, and the 38–Hg2+ system gets saturated when the mole ratio of 345 and Hg2+ is 1
1). A blue-shift was observed when more Hg2+ was added. These results showed that a more strong force between 345 and Hg2+ existed under low concentrations of Hg2+, and the 38–Hg2+ system gets saturated when the mole ratio of 345 and Hg2+ is 1![[thin space (1/6-em)]](https://www.rsc.org/images/entities/char_2009.gif) :
:![[thin space (1/6-em)]](https://www.rsc.org/images/entities/char_2009.gif) 1. Along with the addition of concentration, the Hg2+ displays both the coordination and quencher role. In the ESI-MS of 345–Hg2+, a peak at m/z 847.79 corresponding to [345 + HgCl]− and another peak at m/z 882.70 corresponding to [345 + HgCl2]− were clearly observed upon the addition of HgCl2 into the probe solution. These results displayed the 1
1. Along with the addition of concentration, the Hg2+ displays both the coordination and quencher role. In the ESI-MS of 345–Hg2+, a peak at m/z 847.79 corresponding to [345 + HgCl]− and another peak at m/z 882.70 corresponding to [345 + HgCl2]− were clearly observed upon the addition of HgCl2 into the probe solution. These results displayed the 1![[thin space (1/6-em)]](https://www.rsc.org/images/entities/char_2009.gif) :
:![[thin space (1/6-em)]](https://www.rsc.org/images/entities/char_2009.gif) 1 stoichiometric ratio of 345 and Hg2+, which is consistent with the result from the fluorometric titration measurement. Further information on the binding mode was provided by the NMR titration experiment, which also supported the 1
1 stoichiometric ratio of 345 and Hg2+, which is consistent with the result from the fluorometric titration measurement. Further information on the binding mode was provided by the NMR titration experiment, which also supported the 1![[thin space (1/6-em)]](https://www.rsc.org/images/entities/char_2009.gif) :
:![[thin space (1/6-em)]](https://www.rsc.org/images/entities/char_2009.gif) 1 binding mode of 345–Hg2+. Because of its interesting chemical and spectroscopic properties, 345 should be an ideal probe for the monitoring of mercury ions in living cells, and hence this idea was tested for the in vivo detection of Hg2+ in HeLa cells in a bioimaging experiment, and the results indicated that 345 migrated into the cells and it could be applied to monitor intracellular Hg2+ in live cells.
1 binding mode of 345–Hg2+. Because of its interesting chemical and spectroscopic properties, 345 should be an ideal probe for the monitoring of mercury ions in living cells, and hence this idea was tested for the in vivo detection of Hg2+ in HeLa cells in a bioimaging experiment, and the results indicated that 345 migrated into the cells and it could be applied to monitor intracellular Hg2+ in live cells.
5.19. Macrocyclic derivatives as a Hg2+ sensor
Wen et al.467 designed a novel tetraazamacrocycle fluorescent sensor 346 (Fig. 306) for the ratiometric sensing of Hg2+ and bovine serum albumin (BSA) with two different responsive modes in an aqueous solution at physiological pH (50 mM Tris–HCl, pH 7.6). The ligand exhibited a fluorescence emission signal with the maximum intensity at 545 nm and this fluorescence response was quenched by the introduction of Hg2+ with a slight blue-shift in the spectrum from 545 nm to 505 nm. The ratiometric quenching response with the increasing concentration suggested the applicability of the ligand as a ratiometric fluorescence sensor for the detection of Hg2+, whereas there were no quenching phenomena observed for the various competing ions. The decrease in the fluorescent intensity induced by Hg2+ was most likely attributed to the electron transfer from the excited dansyl fluorophore to the complexed Hg2+. A good linear relationship was determined from the fluorescence titration experiment with the linearly dependent coefficient value of R2 = 0.9710, suggesting the satisfactory sensitivity of 346 toward Hg2+. The fluorescent Job's plot indicated the 1![[thin space (1/6-em)]](https://www.rsc.org/images/entities/char_2009.gif) :
:![[thin space (1/6-em)]](https://www.rsc.org/images/entities/char_2009.gif) 1 stoichiometry of the complex with Hg2+ with the association constant (Kass) value of 2.6 × 10⁶ M−1 for 346 with Hg2+, as determined by the nonlinear fitting to the fluorescent titration curve. The ligand behaved reversibly on treating it with EDTA. The blue-shift and fluorescent quenching of 346 induced by Hg2+ were completely recovered upon the addition of 1 equivalent EDTA, thus verifying the reversible nature of the ligand. Taking advantages of the colorimetric behavior of 346 on Hg2+ binding, test strips absorbing sensor 346 were prepared and dipped into Hg2+ aqueous solutions of different concentration to investigate its practical value. Apparent color changes excited by a UV lamp at 365 nm could be observed, suggesting that this method was validated as convenient and sensitive for the fast detection of Hg2+. To further confirm the applicability of 346 in vivo, inverted fluorescence microscopy images were investigated to detect exogenous mercury ions with 346 in living cells. The bioimaging experiment showed that 346 was easily cell-permeable and could be used to monitor the process of visible fluorescence responses to Hg2+ in living cells. Furthermore, the water-soluble sensor 346 employing a dansyl fluorophore exhibited selective quenching and a blue-shift response to at least 0.5 ppb Hg2+ and responded to concentrations above 1 mg mL−1 BSA selectively via noncovalent interactions. The imaging of BSA in the gel using SDS-PAGE stained in the medium containing 346 demonstrated that the binding of 346 and BSA was feasible in the presence of non-protein substances. Moreover, the versatile performance of 346 was applied to albumin concentration determination in blood serum, exploiting the ratiometric fluorescent calibration curve. Finally, the multiple input/output characteristics of 346 toward Hg2+ and BSA were utilized to construct a complex molecular switch consisting of three logic gates, which should be promising in intelligent diagnostics for Hg2+-contaminated serum on the nanometer scale.
1 stoichiometry of the complex with Hg2+ with the association constant (Kass) value of 2.6 × 10⁶ M−1 for 346 with Hg2+, as determined by the nonlinear fitting to the fluorescent titration curve. The ligand behaved reversibly on treating it with EDTA. The blue-shift and fluorescent quenching of 346 induced by Hg2+ were completely recovered upon the addition of 1 equivalent EDTA, thus verifying the reversible nature of the ligand. Taking advantages of the colorimetric behavior of 346 on Hg2+ binding, test strips absorbing sensor 346 were prepared and dipped into Hg2+ aqueous solutions of different concentration to investigate its practical value. Apparent color changes excited by a UV lamp at 365 nm could be observed, suggesting that this method was validated as convenient and sensitive for the fast detection of Hg2+. To further confirm the applicability of 346 in vivo, inverted fluorescence microscopy images were investigated to detect exogenous mercury ions with 346 in living cells. The bioimaging experiment showed that 346 was easily cell-permeable and could be used to monitor the process of visible fluorescence responses to Hg2+ in living cells. Furthermore, the water-soluble sensor 346 employing a dansyl fluorophore exhibited selective quenching and a blue-shift response to at least 0.5 ppb Hg2+ and responded to concentrations above 1 mg mL−1 BSA selectively via noncovalent interactions. The imaging of BSA in the gel using SDS-PAGE stained in the medium containing 346 demonstrated that the binding of 346 and BSA was feasible in the presence of non-protein substances. Moreover, the versatile performance of 346 was applied to albumin concentration determination in blood serum, exploiting the ratiometric fluorescent calibration curve. Finally, the multiple input/output characteristics of 346 toward Hg2+ and BSA were utilized to construct a complex molecular switch consisting of three logic gates, which should be promising in intelligent diagnostics for Hg2+-contaminated serum on the nanometer scale.
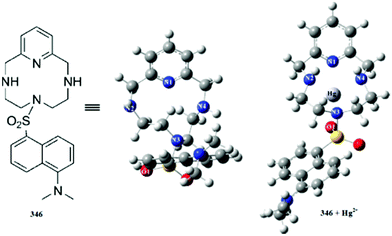 | ||
| Fig. 306 Chemical structure of 346, energy-minimized conformation and optimized ligand–metal complex geometry calculated by the DFT method. | ||
Yoon et al.468 reported a new fluorescent chemosensor 347 (Fig. 307) for selective Hg2+ detection in fresh water and biological systems with precise sensitivity at ppm–ppb levels. The probe exhibited a single visible absorption with the maximum absorption at 485 nm and weak fluorescence at 514 nm. However, Hg2+ addition triggered a 44-fold enhancement in the emission intensity with a slight shift in the excitation and emission maxima. These interesting optical characteristics of the ligand upon mercury addition revealed its applicability as a selective sensor for Hg2+ under physiological conditions. The bioimaging experiment revealed the applicability of probe 347 for the detection of Hg2+ in the intracellular environment and in complex tissues as well as in the determination of metal contamination in edible fish.
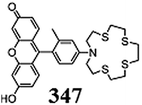 | ||
| Fig. 307 Chemical structure of ligand 347 and its applications to detect Hg2+ in live cells and in edible fish. | ||
5.20. Iridium(III) complex-based Hg2+ sensor
Wu et al.469 reported a neutral iridium(III) complex 348 (Fig. 308) for Hg2+-selective sensor through UV-vis absorption, phosphorescence emission, and electrochemical measurements. Sensor 348 displayed a structured emission band with the maximum wavelength at 563 nm and a shoulder at 603 nm and a fluorescence quantum yield of 0.016 employing quinine sulfate as the standard. Upon the addition of Hg2+ to a solution of sensor 348, the absorption band at 438 nm progressively disappeared, whereas a new band appeared at 398 nm with the solution changing color from yellow to green, indicating that 348 can serve as a sensitive indicator for Hg2+. The stoichiometry of 348 is given by the variation of A438 nm/A398 nm with respect to the number of equivalents of Hg2+ added. Effectively, A438 nm/A398 nm decreases continuously until the addition of 1 equivalent of Hg2+. Further additions of Hg2+ induce only very minor changes in A438 nm/A398 nm, indicating that 348 forms a 1![[thin space (1/6-em)]](https://www.rsc.org/images/entities/char_2009.gif) :
:![[thin space (1/6-em)]](https://www.rsc.org/images/entities/char_2009.gif) 1 complex with Hg2+. The binding constant (K) calculated from absorption titration data was 9.3 × 10⁴ M−1. The fast response time of the developed sensor 348 might be potentially useful for the real-time tracking of Hg2+ in organisms. Moreover, the response of 348 to Hg2+ was further investigated by a photoluminescence technique. Upon the addition of 1 equivalent of Hg2+, the emission band of 348 exhibited a blue-shift of ∼40 nm, corresponding to an evident change in the emission color from yellow to green, which supports the feasibility of 348 as an efficient fluorescent and colorimetric sensor. Furthermore, the electrochemical response of 348 to Hg2+ was studied by cyclic voltammetry. In the absence of Hg2+, 348 showed a quasi-reversible oxidation wave at 0.60 V, which could be assigned to the metal centered IrIII/IrIV and the cyclometalated ligand oxidation processes. A significant modification in the cyclic voltammetry was observed upon the addition of increasing amounts of Hg2+ to a solution of 348. The binding of the sensor toward mercuric ions was further supported by the cyclic voltammetry experiment by the decrease in the intensity of the oxidation wave at 0.60 V and the appearance of a new reversible oxidation wave at 1.03 V on the progressive addition of Hg2+. The sensor 348 showed negligible cytotoxicity with more than 90% cell viability up to 100 μM concentration, as assessed through an MTT assay by selecting KB and HeLa cells. Due to the minimum toxicity of sensor 348 toward live cells, it was further utilized to trace Hg2+ intracellularly in a bioimaging experiment, which demonstrated that 348 is membrane-permeable and can readily reveal the changes in intracellular Hg2+ concentration in a ratiometric way.
1 complex with Hg2+. The binding constant (K) calculated from absorption titration data was 9.3 × 10⁴ M−1. The fast response time of the developed sensor 348 might be potentially useful for the real-time tracking of Hg2+ in organisms. Moreover, the response of 348 to Hg2+ was further investigated by a photoluminescence technique. Upon the addition of 1 equivalent of Hg2+, the emission band of 348 exhibited a blue-shift of ∼40 nm, corresponding to an evident change in the emission color from yellow to green, which supports the feasibility of 348 as an efficient fluorescent and colorimetric sensor. Furthermore, the electrochemical response of 348 to Hg2+ was studied by cyclic voltammetry. In the absence of Hg2+, 348 showed a quasi-reversible oxidation wave at 0.60 V, which could be assigned to the metal centered IrIII/IrIV and the cyclometalated ligand oxidation processes. A significant modification in the cyclic voltammetry was observed upon the addition of increasing amounts of Hg2+ to a solution of 348. The binding of the sensor toward mercuric ions was further supported by the cyclic voltammetry experiment by the decrease in the intensity of the oxidation wave at 0.60 V and the appearance of a new reversible oxidation wave at 1.03 V on the progressive addition of Hg2+. The sensor 348 showed negligible cytotoxicity with more than 90% cell viability up to 100 μM concentration, as assessed through an MTT assay by selecting KB and HeLa cells. Due to the minimum toxicity of sensor 348 toward live cells, it was further utilized to trace Hg2+ intracellularly in a bioimaging experiment, which demonstrated that 348 is membrane-permeable and can readily reveal the changes in intracellular Hg2+ concentration in a ratiometric way.
5.21. Oxadiazole-based Hg2+sensor
Xie et al.470 reported a new visible light excitable Hg2+ sensor 349 (Fig. 309). The ligand showed an intense absorption band with the maximum absorption at 466 nm and a weak band at 331 nm. In the case of fluorescence, the ligand exhibited two emission bands at 342 and 486 nm. However, on Hg2+ addition, there was a linear decrease in the former absorption band with the subsequent appearance of two new absorption bands at 376 and 513 nm. The appearance of clear isosbestic points at 408, 347 and 484 nm reflected the conversion of the single species during the titration process, suggesting the 1![[thin space (1/6-em)]](https://www.rsc.org/images/entities/char_2009.gif) :
:![[thin space (1/6-em)]](https://www.rsc.org/images/entities/char_2009.gif) 1 stoichiometry of the complex. The 1
1 stoichiometry of the complex. The 1![[thin space (1/6-em)]](https://www.rsc.org/images/entities/char_2009.gif) :
:![[thin space (1/6-em)]](https://www.rsc.org/images/entities/char_2009.gif) 1 stoichiometry was further confirmed by the Job's method. From the Hg2+-induced absorption titration experiment, the binding constant was calculated to be 4.95 × 10⁴ M−1 using the Benesi–Hildebrand equation. The distinct Hg2+-induced bathochromic shift in the reaction mixture further introduced a colorimetric change of the solution from yellow to magenta, which was suitable for naked eye detection. Similarly, there was an appearance of an emission signal at 570 nm with a constant increase in the emission intensity on Hg2+ addition up to a ligand–metal ration of 1
1 stoichiometry was further confirmed by the Job's method. From the Hg2+-induced absorption titration experiment, the binding constant was calculated to be 4.95 × 10⁴ M−1 using the Benesi–Hildebrand equation. The distinct Hg2+-induced bathochromic shift in the reaction mixture further introduced a colorimetric change of the solution from yellow to magenta, which was suitable for naked eye detection. Similarly, there was an appearance of an emission signal at 570 nm with a constant increase in the emission intensity on Hg2+ addition up to a ligand–metal ration of 1![[thin space (1/6-em)]](https://www.rsc.org/images/entities/char_2009.gif) :
:![[thin space (1/6-em)]](https://www.rsc.org/images/entities/char_2009.gif) 1. There was a 29-fold enhancement in the emission intensity with the emission maxima of 570 nm on 1 equivalent Hg2+ addition into the ligand solution. The predicted 1
1. There was a 29-fold enhancement in the emission intensity with the emission maxima of 570 nm on 1 equivalent Hg2+ addition into the ligand solution. The predicted 1![[thin space (1/6-em)]](https://www.rsc.org/images/entities/char_2009.gif) :
:![[thin space (1/6-em)]](https://www.rsc.org/images/entities/char_2009.gif) 1 stoichiometry was observed from the fluorescence titration experiment though the Job's plot analysis. The ligand–metal binding behavior was further confirmed by NMR titration experiment, and the results were consistent with those obtained from the Job's method. These characteristics changes in the absorption and emission spectra of the ligand along with the colorimetric change upon Hg2+ addition suggested the suitability of 349 for selective Hg2+ sensor in comparison to a number of competing species. The sensor showed a quite low detection limit of 2.2 × 10⁻⁷ M determined by the 3σ per slope method utilizing the fluorescence titration spectrum. Sensor 349 showed reversible behavior in the presence of thiourea, as determined by the recovery of the original absorption and emission band, which revealed the decomplexation of the ligand–Hg2+ adduct. The bioimaging experiment revealed the successful applicability of sensor 349 for the monitoring and quantification of Hg2+ levels in the biological specimen.
1 stoichiometry was observed from the fluorescence titration experiment though the Job's plot analysis. The ligand–metal binding behavior was further confirmed by NMR titration experiment, and the results were consistent with those obtained from the Job's method. These characteristics changes in the absorption and emission spectra of the ligand along with the colorimetric change upon Hg2+ addition suggested the suitability of 349 for selective Hg2+ sensor in comparison to a number of competing species. The sensor showed a quite low detection limit of 2.2 × 10⁻⁷ M determined by the 3σ per slope method utilizing the fluorescence titration spectrum. Sensor 349 showed reversible behavior in the presence of thiourea, as determined by the recovery of the original absorption and emission band, which revealed the decomplexation of the ligand–Hg2+ adduct. The bioimaging experiment revealed the successful applicability of sensor 349 for the monitoring and quantification of Hg2+ levels in the biological specimen.
6. Conclusion
The design and development of a fluorescent sensor for the recognition of biologically and environmentally important analytes with high selectivity, sensitivity and low detection limit is an attractive and fast-growing field of research in chemistry, biology and environmental science. Although traditional analytical techniques make it possible to detect low limits of analytes in samples, so far, they have found limited applicability for the direct detection of metallic contamination in intracellular media. In this context, bioimaging is an advantageous feature of organic small molecular sensors for intracellular analyte sensation and metal level quantification.Cu2+, Fe2+/Fe3+ and Zn2+ are the abundant elements found in living things and are essential in view of playing crucial roles in many biological functions. Despite their critical functions in various biological processes, both deficient and elevated concentrations of these metal ions induce severe neurological disorders, developmental defects, and malfunctions in normal metabolic processes. In addition to these three essential elements, mercury is widely considered to be one of the most hazardous pollutants and highly dangerous elements due to its recognized accumulative and toxic characters in the environment and ecosystem. Mercury contamination inside the ecosystem and body can take place from various natural and anthropogenic sources, including coal-fired power plants, oceanic and volcanic emissions, gold mining, combustion of waste, solid waste incineration, wood pulping, fossil fuel combustion, and chemical manufacturing. Moreover, mercury–amalgam has been extensively used for dental filling, which is other way for mercury to enter inside the body. Based on environmental and biological concerns, much effort has been devoted to developing methodologies to sense and quantify these elements in aqueous solutions and biological samples.
In this review, we have covered the recent developments in fluorogenic and chromogenic sensors for Cu2+, Fe2+/Fe3+, Zn2+ and Hg2+. Information on the many varieties of molecular scaffold that have been reported in the recent literature as sensors for analytical detection have been collected, including rhodamine, rosamine, fluorescein, ferrocene, thiazole, benzimidazole, benzothiadiazole, triazole, oxadiazole, pyrene, naphthalene, quinoline, quinazolinone, naphthalimide, naphthalenedimide, anthracene, anthraquinone, tetraphenylethylene, hydrazone, porphyrin, macrocylic derivatives, coumarin, terpyridine, calixarene, Schiff bases, pyoverdin, polydiphenylamine, urea/thiourea, azo derivative, benzothiazolium, pyrazoline, tetraphenylethene, BODIPY, thiosemicarbazone, thiocarbamate, thiosemicarbazide, amino acid, dansyl, iridium(III) complex, styrylcyanine, terphenyl, pyridine, caging ligand, phenothiazine, aniline, aminonaphthol, hydrazide, hydrazinecarbothioamide, pyrrole, aldazine, pseudo-crown, squaraine and material-based sensing strategies. The absorption/emission behavior before and after analyte interaction, the mode of complexation and the stoichiometries of the miscellaneous sensing strategies have been discussed in detail. Moreover, the compounds utilized in bioimaging experiments and for molecular logic gates have been highlighted, which might be useful for the future design and development of low energy and membrane-permeable optical sensors for practical applicability.
Acknowledgements
This research was supported by the Basic Science Research Program through the National Research Foundation of Korea (NRF), funded by the Ministry of Education (NRF-2011-0015056).References
- J. Chan, S. C. Dodani and C. J. Chang, Nat. Chem., 2012, 4, 973–984 CrossRef CAS PubMed.
- E. A. Lemke and C. Schultz, Nat. Chem. Biol., 2011, 7, 480–483 CrossRef CAS PubMed.
- T. Ueno and T. Nagano, Nat. Methods, 2011, 8, 642–645 CrossRef CAS PubMed.
- A. P. D. Silva, Nat. Chem., 2012, 4, 440–441 CrossRef PubMed.
- D. J. Arndt-Jovin, M. Robert-Nicoud, S. J. Kaufman and T. M. Jovin, Science, 1985, 230, 247–256 CAS.
- G. Lukinavicius, K. Umezawa, N. Olivier, A. Honigmann, G. Yang, T. Plass, V. Mueller, L. Reymond, I. R. Correa Jr, Z. G. Luo, C. Schultz, E. A. Lemke, P. Heppenstall, C. Eggeling, S. Manley and K. Johnsson, Nat. Chem., 2013, 5, 132–139 CrossRef CAS PubMed.
- K. Lang and J. W. Chin, Nat. Chem., 2013, 5, 81–82 CrossRef CAS PubMed.
- D. W. Domaille, E. L. Que and C. J. Chang, Nat. Chem. Biol., 2008, 4, 168–175 CrossRef CAS PubMed.
- K. J. Waldron, J. C. Rutherford, D. Ford and N. J. Robinson, Nature, 2009, 460, 823–830 CrossRef CAS PubMed.
- H. Wang, D. Wang, Q. Wang, X. Li and C. A. Schalley, Org. Biomol. Chem., 2010, 8, 1017–1026 CAS.
- A. V. Moro, P. C. Ferreira, P. Migowski, F. S. Rodembusch, J. Dupont and D. S. Ludtke, Tetrahedron, 2013, 69, 201–206 CrossRef CAS PubMed.
- F. A. Abebe, C. S. Eribal, G. Ramakrishna and E. Sinn, Tetrahedron Lett., 2011, 52, 5554–5558 CrossRef CAS PubMed.
- S. Goswami, S. Chakraborty, S. Paul, S. Halder and A. C. Maity, Tetrahedron Lett., 2013, 54, 5075–5077 CrossRef CAS PubMed.
- W. Lin, L. Long, L. Yuan, Z. Cao and J. Feng, Anal. Chim. Acta, 2009, 634, 262–266 CrossRef CAS PubMed.
- B. Rathinam, C. C. Chien, B. C. Chen and J. H. Liu, Tetrahedron, 2013, 69, 235–241 CrossRef CAS PubMed.
- Z. Li, L. Zhang, X. Li, Y. Guo, Z. Ni, J. Chen, L. Wei and M. Yu, Dyes Pigm., 2012, 94, 60–65 CrossRef CAS PubMed.
- M. N. Noir and B. Dureault, Sens. Actuators, B, 1995, 29, 386–391 CrossRef.
- G. Aragay, J. Pons and A. Merkoci, Chem. Rev., 2011, 111, 3433–3458 CrossRef CAS PubMed.
- E. M. Nolan and S. J. Lippard, Chem. Rev., 2008, 108, 3443–3480 CrossRef CAS PubMed.
- D. T. Quang and J. S. Kim, Chem. Rev., 2010, 110, 6280–6301 CrossRef CAS PubMed.
- L. E. Santos-Figueroa, M. E. Moragues, E. Climent, A. Agostini, R. Martınez-Manez and F. Sancenon, Chem. Soc. Rev., 2013, 42, 3489–3613 RSC.
- S. K. Sahoo, D. Sharma, R. K. Bera, G. Crisponi and J. F. Callan, Chem. Soc. Rev., 2012, 41, 7195–7227 RSC.
- J. Wu, W. Liu, J. Ge, H. Zhang and P. Wang, Chem. Soc. Rev., 2011, 40, 3483–3495 RSC.
- H. N. Kim, M. H. Lee, H. J. Kim, J. S. Kim and J. Yoon, Chem. Soc. Rev., 2008, 37, 1465–1472 RSC.
- Y. Yang, Q. Zhao, W. Feng and F. Li, Chem. Rev., 2013, 113, 192–270 CrossRef CAS PubMed.
- M. Formica, V. Fusi, L. Giorgi and M. Micheloni, Coord. Chem. Rev., 2012, 256, 170–192 CrossRef CAS PubMed.
- X. Chen, T. Pradhan, F. Wang, J. S. Kim and J. Yoon, Chem. Rev., 2012, 112, 1910–1956 CrossRef CAS PubMed.
- V. Tharmaraj and K. Pitchumani, J. Mater. Chem. B, 2013, 1, 1962–1967 RSC.
- V. Tharmaraj and K. Pitchumani, Anal. Chim. Acta, 2012, 751, 171–175 CrossRef CAS PubMed.
- G. Sivaraman, B. Vidya and D. Chellappa, RSC Adv., 2014, 4, 30828–30831 RSC.
- S. J. Ponniah, S. K. Barik, A. Thakur, R. Ganesamoorthi and S. Ghosh, Organometallics, 2014, 33, 3096–3107 CrossRef.
- G. Sivaraman, V. Sathiyaraja and D. Chellappa, J. Lumin., 2014, 145, 480–485 CrossRef CAS PubMed.
- A. Thakur, D. Mandal, P. Deb, B. Mondal and S. Ghosh, RSC Adv., 2014, 4, 1918–1928 RSC.
- K. Z. Kamali, A. Pandikumar, G. Sivaraman, H. N. Lim, S. P. Wren, T. Sun and N. M. Huang, RSC Adv., 2015, 5, 17809–17816 RSC.
- C. Arivazhagan, R. Borthakur and S. Ghosh, Organometallics, 2015, 34, 1147–1155 CrossRef CAS.
- G. Sivaraman, T. Anand and D. Chellappa, RSC Adv., 2012, 2, 10605–10609 RSC.
- G. Sivaraman and D. Chellappa, J. Mater. Chem. B, 2013, 1, 5768–5772 RSC.
- T. Anand, G. Sivaraman and D. Chellappa, Spectrochim. Acta, Part A, 2014, 123, 18–24 CrossRef CAS PubMed.
- G. Sivaraman, T. Anand and D. Chellappa, RSC Adv., 2013, 3, 17029–17033 RSC.
- G. Sivaraman, T. Anand and D. Chellappa, Anal. Methods, 2014, 6, 2343–2348 RSC.
- T. Anand, G. Sivaraman, A. Mahesh and D. Chellappa, Anal. Chim. Acta, 2015, 853, 596–601 CrossRef CAS PubMed.
- T. Anand, G. Sivaraman, M. Iniya, A. Siva and D. Chellappa, Anal. Chim. Acta, 2015, 876, 1–8 CrossRef CAS PubMed.
- G. Sivaraman, T. Anand and D. Chellappa, ChemPlusChem, 2014, 79, 1761–1766 CAS.
- J. E. T. Andersen, Analyst, 2005, 130, 385–390 RSC.
- P. Giamarchi, J. Y. Cabon and A. L. Bihan, Anal. Chim. Acta, 2010, 664, 114–120 CrossRef PubMed.
- S. Saracoglu, M. Soylak, D. S. Peker, L. Elci, W. N. D. Santos, V. A. Lemos and S. L. Ferreira, Anal. Chim. Acta, 2006, 575, 133–137 CrossRef CAS PubMed.
- G. L. Arnold, S. Weyer and A. D. Anbar, Anal. Chem., 2004, 76, 322–327 CrossRef CAS PubMed.
- K. Pomazal, C. Prohaska, I. Steffan, G. Reich and J. F. K. Huber, Analyst, 1999, 124, 657–663 RSC.
- P. Vanloot, B. Coulomb, C. Brach-Papa, M. Sergent and J. L. Boudenne, Chemosphere, 2007, 69, 1351–1360 CrossRef CAS PubMed.
- C. M. G. Berg, Anal. Chem., 2006, 78, 156–163 CrossRef PubMed.
- A. R. Timerbaev, E. D. Zlotorzynska and A. G. T. M. Hoop, Analyst, 1999, 124, 811–826 RSC.
- T. Shamspur, I. Sheikhshoaie and M. H. Mashhadizadeh, J. Anal. At. Spectrom., 2005, 20, 476–478 RSC.
- K. Attiq-ur-Rehman, M. Yaqoob, A. Waseem and A. Nabi, Anal. Chem., 2009, 89, 1071–1080 Search PubMed.
- S. J. Ussher, A. Milne, W. M. Landing, K. Attiq-ur-Rehman, M. J. Seguret, T. Holland, E. P. Achterberg, A. Nabi and P. J. Worsfold, Anal. Chim. Acta, 2009, 652, 259–265 CrossRef CAS PubMed.
- A. Zhao, C. Zhao, M. Li, J. Ren and X. Qu, Anal. Chim. Acta, 2014, 809, 128–133 CrossRef CAS PubMed.
- A. Ananthanarayanan, X. Wang, P. Routh, B. Sana, S. Lim, D. H. Kim, K. H. Lim, J. Li and P. Chen, Adv. Funct. Mater., 2014, 24, 3021–3026 CrossRef CAS PubMed.
- W. Chudyk, C. Sotolongo and E. Mueller, Environ. Monit. Assess., 2014, 186, 415–420 CrossRef CAS PubMed.
- H. A. McIlwee, C. L. Schauer, V. G. Praig, R. Boukherroub and S. Szunerits, Analyst, 2008, 133, 673–677 RSC.
- V. N. Mehta, S. K. Kailasa and H. F. Wu, New J. Chem., 2014, 38, 1503–1511 RSC.
- Z. Z. Yin, Y. Li, L. P. Jiang, R. K. Rana and J. J. Zhu, Anal. Chim. Acta, 2013, 781, 48–53 CrossRef CAS PubMed.
- M. Xu, S. Wu, F. Zeng and C. Yu, Langmuir, 2010, 26, 4529–4534 CrossRef CAS PubMed.
- F. L. Leite, A. Firmino, C. E. Borato, L. H. C. Mattoso, W. T. L. da Silva and O. N. Oliveira, Synth. Met., 2009, 159, 2333–2337 CrossRef CAS PubMed.
- Z. Ma, K. Y. Wong and F. T. Horrigan, J. Gen. Physiol., 2008, 131, 483–502 CrossRef CAS PubMed.
- S. K. Alpat, S. Alpat, B. Kutlu, O. Ozbayrak and H. B. Buyukısık, Sens. Actuators, B, 2007, 128, 273–278 CrossRef CAS PubMed.
- R. D. Marco and J. Martizano, Talanta, 2008, 75, 1234–1239 CrossRef PubMed.
- G. Zhang, Y. Li, J. Xu, C. Zhang, S. Shuang, C. Dong and M. M. F. Choi, Sens. Actuators, B, 2013, 183, 583–588 CrossRef CAS PubMed.
- L. Tang, J. Guo and N. Wang, Bull. Korean Chem. Soc., 2013, 34, 159–163 CrossRef CAS.
- M. Soylak and O. Ercan, J. Hazard. Mater., 2009, 168, 1527–1531 CrossRef CAS PubMed.
- J. P. Sumner, N. M. Westerberg, A. K. Stoddard, C. A. Fierke and R. Kopelman, Sens. Actuators, B, 2006, 113, 760–767 CrossRef CAS PubMed.
- M. D. Tutulea-Anastasiu, D. Wilson, M. del Valle, C. M. Schreiner and I. Cretescu, Sensors, 2013, 13, 4367–4377 CrossRef CAS PubMed.
- X. Dai, F. Qiu, X. Zhou, Y. Long, W. Li and Y. Tu, Anal. Chim. Acta, 2014, 848, 25–31 CrossRef CAS PubMed.
- A. K. Jain, V. K. Gupta, L. P. Singh and J. R. Raisoni, Talanta, 2005, 66, 1355–1361 CrossRef CAS PubMed.
- Z. Chen and D. Wu, Sens. Actuators, B, 2014, 192, 83–91 CrossRef CAS PubMed.
- B. C. Janegitz, L. H. Marcolino-Junior, S. P. Campana-Filho, R. C. Faria and O. Fatibello-Filho, Sens. Actuators, B, 2009, 142, 260–266 CrossRef CAS PubMed.
- X. D. Xi, T. L. Wang and X. Y. Yuan, Chin. Chem. Lett., 2014, 25, 1403–1406 CrossRef PubMed.
- V. K. Gupta, R. N. Goyal, N. Bachheti, L. P. Singh and S. Agarwal, Talanta, 2005, 68, 193–197 CrossRef CAS PubMed.
- A. Anandhan, H. Rodriguez-Rocha, I. Bohovych, A. M. Griggs, L. Zavala-Flores, E. M. Reyes-Reyes, J. Seravalli, L. A. Stanciu, J. Lee, J. C. Rochet, O. Khalimonchuk and R. Franco, Neurobiol. Dis., 2014 DOI:10.1016/j.nbd.2014.11.018.
- X. Liu, W. Gao, X. Zhou and Y. Ma, J. Mater. Res., 2014, 29, 1401–1407 CrossRef CAS.
- T. Leelasattarathkul, S. Liawruangrath, M. Rayanakorn, B. Liawruangrath, W. Oungpipat and N. Youngvises, Talanta, 2007, 72, 126–131 CrossRef CAS PubMed.
- D. Wu, Z. Chen, G. Huang and X. Liu, Sens. Actuators, A, 2014, 205, 72–78 CrossRef CAS PubMed.
- G. X. Liang, H. Y. Liu, J. R. Zhang and J. J. Zhu, Talanta, 2010, 80, 2172–2176 CrossRef CAS PubMed.
- Y. Jiang, Z. Huang, H. Dai, L. Wang, L. Ying and X. Kou, Asian J. Chem., 2013, 25, 8292–8296 CrossRef CAS.
- B. Muthuraj, R. Deshmukh, V. Trivedi and P. K. Iyer, ACS Appl. Mater. Interfaces, 2014, 6, 6562–6569 CAS.
- M. Royzen, Z. Dai and J. W. Canary, J. Am. Chem. Soc., 2005, 127, 1612–1613 CrossRef CAS PubMed.
- S. Seo, H. Y. Lee, M. Park, J. M. Lim, D. Kang, J. Yoon and J. H. Jung, Eur. J. Inorg. Chem., 2010, 843–847 CrossRef CAS PubMed.
- L. Qu, C. Yin, F. Huo, J. Chao, Y. Zhang and F. Cheng, Sens. Actuators, B, 2014, 191, 158–164 CrossRef CAS PubMed.
- T. Li, Z. Yang, Y. Li, Z. Liu, G. Qi and B. Wang, Dyes Pigm., 2011, 88, 103–108 CrossRef CAS PubMed.
- C. Yu and J. Zhang, Asian J. Org. Chem., 2014, 3, 1312–1316 CrossRef CAS PubMed.
- Z. Liu, C. Zhang, X. Wang, W. He and Z. Guo, Org. Lett., 2012, 14, 4378–4381 CrossRef CAS PubMed.
- Y. H. Lee, N. Park, Y. B. Park, Y. J. Hwang, C. Kang and J. S. Kim, Chem. Commun., 2014, 50, 3197–3200 RSC.
- W. Wang, Q. Wen, Y. Zhang, X. Fei, Y. Li, Q. Yang and X. Xu, Dalton Trans., 2013, 42, 1827–1833 RSC.
- J. Huang, Y. Xu and X. Qian, Org. Biomol. Chem., 2009, 7, 1299–1303 CAS.
- J. Huang, Y. Xu and X. Qian, Dalton Trans., 2009, 1761–1766 RSC.
- T. S. Reddy and A. R. Reddy, Spectrochim. Acta, Part A, 2014, 128, 880–886 CrossRef PubMed.
- H. Lan, B. Liu, G. Lv, Z. Li, X. Yu, K. Liu, X. Cao, H. Yang, S. Yang and T. Yi, Sens. Actuators, B, 2012, 173, 811–816 CrossRef CAS PubMed.
- S. Goswami, D. Sen, N. K. Das and G. Hazra, Tetrahedron Lett., 2010, 51, 5563–5566 CrossRef CAS PubMed.
- S. Goswami, D. Sen and N. K. Das, Org. Lett., 2010, 12, 856–859 CrossRef CAS PubMed.
- J. Dessingiou, J. K. Khedkar and C. P. Rao, J. Chem. Sci., 2014, 126, 1135–1141 CrossRef CAS.
- M. Q. Wang, K. Li, J. T. Hou, M. Y. Wu, Z. Huang and X. Q. Yu, J. Org. Chem., 2012, 77, 8350–8354 CrossRef CAS PubMed.
- N. K. Singhal, B. Ramanujam, V. Mariappanadar and C. P. Rao, Org. Lett., 2006, 8, 3525–3528 CrossRef CAS PubMed.
- S. Goswami, S. Maity, A. K. Das and A. C. Maity, Tetrahedron Lett., 2013, 54, 6631–6634 CrossRef CAS PubMed.
- L. Tang, J. Zhao, M. Cai, P. Zhou, K. Zhong, S. Hou and Y. Bian, Tetrahedron Lett., 2013, 54, 6105–6109 CrossRef CAS PubMed.
- J. Hatai, S. Pal and S. Bandyopadhyay, Tetrahedron Lett., 2012, 53, 4357–4360 CrossRef CAS PubMed.
- G. J. Park, I. H. Hwang, E. J. Song, H. Kim and C. Kim, Tetrahedron, 2014, 70, 2822–2828 CrossRef CAS PubMed.
- F. Li, L. Li, W. Yang, L. S. Zheng, Z. J. Zheng, K. Jiang, Y. Lu and L. W. Xu, Tetrahedron Lett., 2013, 54, 1584–1588 CrossRef CAS PubMed.
- H. G. Lee, K. B. Kim, G. J. Park, Y. J. Na, H. Y. Jo, S. A. Lee and C. Kim, Inorg. Chem. Commun., 2014, 39, 61–65 CrossRef CAS PubMed.
- K. Ghosh and D. Kar, J. Inclusion Phenom. Macrocyclic Chem., 2013, 77, 67–74 CrossRef CAS.
- C. Zhou, N. Xiao and Y. Li, Can. J. Chem., 2014, 92, 1092–1097 CrossRef CAS.
- C. Zhou, Y. Song, N. Xiao, Y. Li and J. Xu, J. Fluoresc., 2014, 24, 1331–1336 CrossRef CAS PubMed.
- L. Tang, P. Zhou, Z. Huang, J. Zhao and M. Cai, Bull. Korean Chem. Soc., 2013, 34, 2905–2908 CrossRef CAS.
- J. Jiang, H. Jiang, X. Tang, L. Yang, W. Dou, W. Liu, R. Fang and W. Liu, Dalton Trans., 2011, 40, 6367–6370 RSC.
- L. Tang, P. Zhou, Q. Zhang, Z. Huang, J. Zhao and M. Cai, Inorg. Chem. Commun., 2013, 36, 100–104 CrossRef CAS PubMed.
- C. Gao, X. Liu, X. Jin, J. Wu, Y. Xie, W. Liu, X. Yao and Y. Tang, Sens. Actuators, B, 2013, 185, 125–131 CrossRef CAS PubMed.
- X. Yang, X. Liu, K. Shen, C. Zhu and Y. Cheng, Org. Lett., 2011, 13, 3510–3513 CrossRef CAS PubMed.
- P. N. Basa and A. G. Sykes, J. Org. Chem., 2012, 77, 8428–8434 CrossRef CAS PubMed.
- P. Singh, L. S. Mittal, S. Kumar, G. Bhargava and S. Kumar, J. Fluoresc., 2014, 24, 909–915 CrossRef CAS PubMed.
- L. Liu, X. Dong, Y. Xiao, W. Lian and Z. Liu, Analyst, 2011, 136, 2139–2145 RSC.
- Y. J. Jang, B. S. Moon, M. S. Park, B. G. Kang, J. Y. Kwon, J. S. J. Hong, Y. J. Yoon, K. D. Lee and J. Yoon, Tetrahedron Lett., 2006, 47, 2707–2710 CrossRef CAS PubMed.
- J. Zhang, J. Luo, X. X. Zhu, M. J. N. Junk and D. Hinderberger, Langmuir, 2010, 26, 2958–2962 CrossRef CAS PubMed.
- E. Hrishikesan, C. Saravanan and P. Kannan, Ind. Eng. Chem. Res., 2011, 50, 8225–8229 CrossRef CAS.
- G. C. Midya, S. Paladhi, S. Bhowmik, S. Saha and J. Dash, Org. Biomol. Chem., 2013, 11, 3057–3063 CAS.
- P. Kaur, D. Sareen and K. Singh, Talanta, 2011, 83, 1695–1700 CrossRef CAS PubMed.
- X. Wu, Z. Guo, Y. Wu, S. Zhu, T. D. James and W. Zhu, ACS Appl. Mater. Interfaces, 2013, 5, 12215–12220 CAS.
- S. Basurto, O. Riant, D. Moreno, J. Rojo and J. Torroba, J. Org. Chem., 2007, 72, 4673–4688 CrossRef CAS PubMed.
- J. Xie, M. Menand, S. Maisonneuve and R. Metivier, J. Org. Chem., 2007, 72, 5980–5985 CrossRef CAS PubMed.
- S. P. Wu, Z. M. Huang, S. R. Liu and P. K. Chung, J. Fluoresc., 2012, 22, 253–259 CrossRef CAS PubMed.
- S. Goswami, S. Chakraborty, S. Paul, S. Halder, S. Panja and S. K. Mukhopadhyay, Org. Biomol. Chem., 2014, 12, 3037–3044 CAS.
- S. Sarkar, S. Roy, A. Sikdar, R. N. Saha and S. S. Panja, Analyst, 2013, 138, 7119–7126 RSC.
- Y. R. Bhorge, H. T. Tsai, K. F. Huang, A. J. Pape, S. N. Janaki and Y. P. Yen, Spectrochim. Acta, Part A, 2014, 130, 7–12 CrossRef CAS PubMed.
- S. S. Bag, R. Kundu and S. Talukdar, Tetrahedron Lett., 2012, 53, 5875–5879 CrossRef CAS PubMed.
- S. P. Wu, T. H. Wang and S. R. Liu, Tetrahedron, 2010, 66, 9655–9658 CrossRef CAS PubMed.
- H. J. Kim, S. Y. Park, S. Yoon and J. S. Kim, Tetrahedron, 2008, 64, 1294–1300 CrossRef CAS PubMed.
- W. C. Lin, C. Y. Wu, Z. H. Liu, C. Y. Lin and Y. P. Yen, Talanta, 2010, 81, 1209–1215 CrossRef CAS PubMed.
- X. Qi, E. J. Jun, L. Xu, S. J. Kim, J. S. J. Hong, Y. J. Yoon and J. Yoon, J. Org. Chem., 2006, 71, 2881–2884 CrossRef CAS PubMed.
- C. Y. Chou, S. R. Liu and S. P. Wu, Analyst, 2013, 138, 3264–3270 RSC.
- J. Wang, Y. Xie, Z. Wang and Q. H. Song, Sens. Actuators, B, 2014, 194, 149–155 CrossRef CAS PubMed.
- H. S. Jung, P. S. Kwon, J. W. Lee, J. I. Kim, C. S. Hong, J. W. Kim, S. Yan, J. Y. Lee, J. H. Lee, T. Joo and J. S. Kim, J. Am. Chem. Soc., 2009, 131, 2008–2012 CrossRef CAS PubMed.
- J. T. Yeh, W. C. Chen, S. R. Liu and S. P. Wu, New J. Chem., 2014, 38, 4434–4439 RSC.
- L. Huang, J. Cheng, K. Xie, P. Xi, F. Hou, Z. Li, G. Xie, Y. Shi, H. Liu, D. Bai and Z. Zeng, Dalton Trans., 2011, 40, 10815–10817 RSC.
- K. C. Ko, J. S. Wu, H. J. Kim, P. S. Kwon, J. W. Kim, R. A. Bartsch, J. Y. Lee and J. S. Kim, Chem. Commun., 2011, 47, 3165–3167 RSC.
- K. L. Ciesienski, L. M. Hyman, S. Derisavifard and K. J. Franz, Inorg. Chem., 2010, 49, 6808–6810 CrossRef CAS PubMed.
- G. He, X. Zhao, X. Zhang, H. Fan, S. Wu, H. Li, C. He and C. Duan, New J. Chem., 2010, 34, 1055–1058 RSC.
- M. H. Kim, H. H. Jang, S. Yi, S. K. Chang and M. S. Han, Chem. Commun., 2009, 4838–4840 RSC.
- O. García-Beltrán, B. K. Cassels, N. Mena, M. T. Nuñez, O. Yañez and J. Caballero, Tetrahedron Lett., 2014, 55, 873–876 CrossRef PubMed.
- K. K. Yu, K. Li, J. T. Hou and X. Q. Yu, Tetrahedron Lett., 2013, 54, 5771–5774 CrossRef CAS PubMed.
- A. Helal, M. H. O. Rashid, C. H. Choi and H. S. Kim, Tetrahedron, 2011, 67, 2794–2802 CrossRef CAS PubMed.
- F. Chen, G. Liu, Y. Shi, P. Xi, J. Cheng, J. Hong, R. Shen, X. Yao, D. Bai and Z. Zeng, Talanta, 2014, 124, 139–145 CrossRef CAS PubMed.
- X. Yang, W. Zeng, L. Wang, X. Lu, Y. Yan, J. Qu and R. Liu, RSC Adv., 2014, 4, 22613–22616 RSC.
- D. Udhayakumari, S. Suganya, S. Velmathi and D. M. Ali, J. Mol. Recognit., 2014, 27, 151–159 CrossRef CAS PubMed.
- K. Mariappan, M. Alaparthi, G. Caple, V. Balasubramanian, M. M. Hoffman, M. Hudspeth and A. G. Sykes, Inorg. Chem., 2014, 53, 2953–2962 CrossRef CAS PubMed.
- U. N. Yadav, P. Pant, S. K. Sahoo and G. S. Shankarling, RSC Adv., 2014, 4, 42647–42653 RSC.
- A. Subhasri, C. Anbuselvan and N. Rajendraprasad, RSC Adv., 2014, 4, 60658–60669 RSC.
- K. B. Kim, H. Kim, E. J. Song, S. Kim, I. Noh and C. Kim, Dalton Trans., 2013, 42, 16569–16577 RSC.
- H. Y. Jo, G. J. Park, K. H. Bok, K. M. Park, P. S. Chang and C. Kim, Inorg. Chem. Commun., 2015, 51, 90–94 CrossRef CAS PubMed.
- M. Ghaedi, A. Shahamiri, B. Mirtamizdoust, S. Hajati and F. Taghizadeh, Spectrochim. Acta, Part A, 2015, 138, 878–884 CrossRef CAS PubMed.
- Y. J. Na, Y. W. Choi, J. Y. Yun, K. M. Park, P. S. Chang and C. Kim, Spectrochim. Acta, Part A, 2015, 136, 1649–1657 CrossRef CAS PubMed.
- J. Huo, K. Liu, X. Zhao, X. Zhang and Y. Wang, Spectrochim. Acta, Part A, 2014, 117, 789–792 CrossRef CAS PubMed.
- L. Yang, W. Zhu, M. Fang, Q. Zhang and C. Li, Spectrochim. Acta, Part A, 2013, 109, 186–192 CrossRef CAS PubMed.
- M. R. Awual, T. Yaita, S. A. El-Safty, H. Shiwaku, S. Suzuki and Y. Okamoto, Chem. Eng. J., 2013, 221, 322–330 CrossRef CAS PubMed.
- H. Y. Jo, G. J. Park, Y. J. Na, Y. W. Choi, G. R. You and C. Kim, Dyes Pigm., 2014, 109, 127–134 CrossRef CAS PubMed.
- N. Aksuner, E. Henden, I. Yilmaz and A. Cukurovali, Dyes Pigm., 2009, 83, 211–217 CrossRef CAS PubMed.
- B. Fang, Y. Liang and F. Chen, Talanta, 2014, 119, 601–605 CrossRef CAS PubMed.
- L. Wenfeng, M. Hengchang, L. Con, M. Yuan, Q. Chunxuan, Z. Zhonwei, Y. Zengming, C. Haiying and L. Ziqiang, RSC Adv., 2015, 5, 6869–6878 RSC.
- A. M. Mahapatra, G. Hazra, N. K. Das and S. Goswami, Sens. Actuators, B, 2011, 156, 456–462 CrossRef CAS PubMed.
- V. Bhalla, R. Tejpal and M. Kumar, Tetrahedron, 2011, 67, 1266–1271 CrossRef CAS PubMed.
- Y. Fu, Q. C. Feng, X. J. Jiang, H. Xu, M. Li and S. Q. Zang, Dalton Trans., 2014, 43, 5815–5822 RSC.
- P. Saluja, N. Kaur, N. Singh and D. O. Jang, Tetrahedron Lett., 2012, 53, 3292–3295 CrossRef CAS PubMed.
- L. J. Tang, M. Cai, Z. Huang, K. Zhong, S. Hou, Y. Bian and R. Nandhakumar, Sens. Actuators, B, 2013, 185, 188–194 CrossRef CAS PubMed.
- L. Tang and M. Cai, Sens. Actuators, B, 2012, 173, 862–867 CrossRef CAS PubMed.
- L. Tang, X. Dai, M. Cai, J. Zhao, P. Zhou and Z. Huang, Spectrochim. Acta, Part A, 2014, 122, 656–660 CrossRef CAS PubMed.
- Y. Liu, Q. Fei, H. Shan, M. Cui, Q. Liu, G. Feng and Y. Huan, Analyst, 2014, 139, 1868–1875 RSC.
- S. R. Liu and S. P. Wu, J. Fluoresc., 2011, 21, 1599–1605 CrossRef CAS PubMed.
- T. Schwarze, A. Kelling, H. Mller, M. Trautmann, T. Klamroth, O. Baumann, P. Strauch and H. J. Holdt, Chem.–Eur. J., 2012, 18, 10506–10510 CrossRef CAS PubMed.
- A. Reynal, J. Etxebarria, N. Nieto, S. Serres, E. Palomares and A. Vidal-Ferran, Eur. J. Inorg. Chem., 2010, 1360–1365 CrossRef CAS PubMed.
- Z. Li, L. Zhang, L. Wang, Y. Guo, L. Cai, M. Yu and L. Wei, Chem. Commun., 2011, 47, 5798–5800 RSC.
- P. Tongkate, D. Phromyothin and J. Sumranjit, Tetrahedron, 2012, 68, 3329–3335 CrossRef CAS PubMed.
- C. Wang, L. J. Lu, W. Ye, O. Zheng, B. Qiu, Z. Lin, L. Guo and G. Chen, Analyst, 2014, 139, 656–659 RSC.
- H. W. Mbatia, H. M. D. Bandara and S. C. Burdette, Chem. Commun., 2012, 48, 5331–5333 RSC.
- P. Pallavicini, L. Pasotti and S. Patroni, Dalton Trans., 2007, 5670–5677 RSC.
- L. Liang, L. Zhao and X. Zeng, J. Fluoresc., 2014, 24, 1671–1677 CrossRef CAS PubMed.
- I. T. Ho, J. H. Chu and W. S. Chung, Eur. J. Org. Chem., 2011, 1472–1481 CrossRef CAS PubMed.
- H. M. Chawla, P. Goel and R. Shukla, Tetrahedron Lett., 2014, 55, 2173–2176 CrossRef CAS PubMed.
- H. J. Kim, S. H. Kim, J. H. Kim, L. N. Anh, J. H. Lee, C. H. Lee and J. S. Kim, Tetrahedron Lett., 2009, 50, 2782–2786 CrossRef CAS PubMed.
- B. Tabakci and A. Yilmaz, J. Mol. Struct., 2014, 1075, 96–102 CrossRef CAS PubMed.
- R. K. Pathak, V. K. Hinge, P. Mondal and C. P. Rao, Dalton Trans., 2012, 41, 10652–10660 RSC.
- R. Joseph, B. Ramanujam, A. Acharya and C. P. Rao, Tetrahedron Lett., 2009, 50, 2735–2739 CrossRef CAS PubMed.
- S. Kacmaz, K. Ertekin, D. Mercan, O. Oter, E. Cetinkaya and E. Celik, Spectrochim. Acta, Part A, 2015, 135, 551–559 CrossRef CAS PubMed.
- D. Udhayakumari, S. Velmathi, Y. M. Sung and S. P. Wu, Sens. Actuators, B, 2014, 198, 285–293 CrossRef CAS PubMed.
- J. S. Wu, P. F. Wang, X. H. Zhang and S. K. Wu, Spectrochim. Acta, Part A, 2006, 65, 749–752 CrossRef PubMed.
- O. Cimen, H. Dincalp and C. Varlıklı, Sens. Actuators, B, 2015, 209, 853–863 CrossRef CAS PubMed.
- X. Wang, J. Zhao, C. Guo, M. Pei and G. Zhang, Sens. Actuators, B, 2014, 193, 157–165 CrossRef CAS PubMed.
- Q. Lin, P. Chen, J. Liu, Y. P. Fu, Y. M. Zhang and T. B. Wei, Dyes Pigm., 2013, 98, 100–105 CrossRef CAS PubMed.
- I. A. Azath and K. Pitchumani, Sens. Actuators, B, 2013, 188, 59–64 CrossRef CAS PubMed.
- D. Maity and T. Govindaraju, Chem.–Eur. J., 2011, 17, 1410–1414 CrossRef CAS PubMed.
- M. Kaur and D. H. Choi, Sens. Actuators, B, 2014, 190, 542–548 CrossRef CAS PubMed.
- N. Narayanaswamy and T. Govindaraju, Sens. Actuators, B, 2012, 161, 304–310 CrossRef CAS PubMed.
- F. Lu, M. Yamamura and T. Nabeshima, Tetrahedron Lett., 2013, 54, 779–782 CrossRef CAS PubMed.
- M. Wang, K. H. Leung, S. Lin, D. S. H. Chan, D. W. J. Kwong, C. H. Leung and D. L. Ma, Sci. Rep., 2014, 4, 6794 CrossRef CAS PubMed.
- S. Goswami and R. Chakrabarty, Tetrahedron Lett., 2009, 50, 5910–5913 CrossRef CAS PubMed.
- W. Wang, A. Fu, J. You, G. Gao, J. Lan and L. Chen, Tetrahedron, 2010, 66, 3695–3701 CrossRef CAS PubMed.
- R. Banerjee, D. S. Pal and D. Dhara, Polymer Int., 2014, 63, 1974–1981 CrossRef CAS PubMed.
- Y. Zhou, F. Wang, Y. Kim, S. J. Kim and J. Yoon, Org. Lett., 2009, 11, 4442–4445 CrossRef CAS PubMed.
- C. Kar, M. D. Adhikari, A. Ramesh and G. Das, Inorg. Chem., 2013, 52, 743–752 CrossRef CAS PubMed.
- D. Guo, Z. Dong, C. Luo, W. Zan, S. Yan and X. Yao, RSC Adv., 2014, 4, 5718–5725 RSC.
- Y. S. Mi, Z. Cao, Y. T. Chen, Q. F. Xie, Y. Y. Xu, Y. F. Luo, J. J. Shi and J. N. Xiang, Analyst, 2013, 138, 5274–5280 RSC.
- X. Ma, Z. Tan, G. Wei, D. Wei and Y. Du, Analyst, 2012, 137, 1436–1439 RSC.
- Y. Liu, Y. Sun, J. Du, X. Lv, Y. Zhao, M. Chen, P. Wang and W. Guo, Org. Biomol. Chem., 2011, 9, 432–437 CAS.
- N. I. Georgiev, M. D. Dimitrova, A. M. Asiri, K. A. Alamry and V. B. Bojinov, Dyes Pigm., 2015, 115, 172–180 CrossRef CAS PubMed.
- M. Wang, D. Zhang, M. Li, M. Fan, Y. Ye and Y. F. Zhao, J. Fluoresc., 2013, 23, 417–423 CrossRef CAS PubMed.
- Y. Wang, H. Q. Wu, J. H. Sun, X. Y. Liu, J. Luo and M. Q. Chen, J. Fluoresc., 2012, 22, 799–805 CrossRef CAS PubMed.
- M. Saleem and K. H. Lee, J. Lumin., 2014, 145, 843–848 CrossRef CAS PubMed.
- L. J. Tang, X. Dai, X. Wen, D. Wu and Q. Zhang, Spectrochim. Acta, Part A, 2015, 139, 329–334 CrossRef CAS PubMed.
- W. Gao, Y. Yang, F. Huo, C. Yin, M. Xu, Y. Zhang, J. Chao, S. Jin and S. Zhang, Sens. Actuators, B, 2014, 193, 294–300 CrossRef CAS PubMed.
- S. Goswami, D. Sen, A. K. Das, N. K. Das, K. Aich, H. K. Fun, C. K. Quah, A. K. Maity and P. Saha, Sens. Actuators, B, 2013, 183, 518–525 CrossRef CAS PubMed.
- H. Y. Lee, K. M. K. Swamy, J. Y. Jung, G. Kim and J. Yoon, Sens. Actuators, B, 2013, 182, 530–537 CrossRef CAS PubMed.
- X. Chen, M. J. Jou, H. Lee, S. Kou, J. Lim, S. W. Nam, S. Park, K. M. Kim and J. Yoon, Sens. Actuators, B, 2009, 137, 597–602 CrossRef CAS PubMed.
- M. Ghiaci, B. Rezaei and M. Arshadi, Sens. Actuators, B, 2009, 139, 494–500 CrossRef CAS PubMed.
- I. Lee, S. Kim, S. Kim, Y. Jang and J. Jang, ACS Appl. Mater. Interfaces, 2014, 6, 17151–17156 CAS.
- B. L. Su, N. Moniotte, N. Nivarlet, L. H. Chen, Z. Y. Fu, J. Desmet and J. Li, J. Colloid Interface Sci., 2011, 358, 136–145 CrossRef CAS PubMed.
- G. Becerra, F. Merchán, R. Blasco and M. I. Igeno, J. Biotechnol., 2014, 190, 2–10 CrossRef CAS PubMed.
- D. Y. Lee, N. Singh and D. O. Jang, Tetrahedron Lett., 2011, 52, 3886–3890 CrossRef CAS PubMed.
- C. Yi, B. Song, W. Tian, X. Cui, Q. Qi, W. Jiang, Z. Qi and Y. Sun, Tetrahedron Lett., 2014, 55, 5119–5123 CrossRef CAS PubMed.
- Y. Beguin, Clin. Chim. Acta, 2003, 329, 9–22 CrossRef CAS.
- Q. Zhao, S. Chen, L. Zhang, H. Huang, Y. Zeng and F. Liu, Anal. Chim. Acta, 2014, 852, 236–243 CrossRef CAS PubMed.
- J. Mazza, R. M. Barr, J. W. D. Mcdonald and L. S. Valberg, Can. Med. Assoc. J., 1978, 119, 884–886 CAS.
- M. Harrington, C. Hotz, C. Zeder, G. O. Polvo, S. Villalpando, M. B. Zimmermann, T. Walczyk, J. A. Rivera and R. F. Hurrell, Eur. J. Clin. Nutr., 2011, 65, 20–25 CrossRef CAS PubMed.
- G. H. Guyatt, A. D. Oxman, M. Ali, A. Willan, W. Mcllroy and C. Patterson, J. Gen. Intern. Med., 1992, 7, 145–153 CrossRef CAS.
- G. H. Guyatt, C. Patterson, M. Ali, J. Singer, M. Levine, I. Turpie and R. Meyer, Am. J. Med., 1990, 88, 205–209 CrossRef CAS.
- S. H. Yoon, D. S. Kim, S. T. Yu, S. R. Shin and D. Y. Choi, Korean J. Pediatr., 2015, 58, 15–19 CrossRef PubMed.
- S. M. Soysa, M. L. Grover and P. J. Mcdonald, Br. Med. J., 1984, 289, 961–962 CrossRef.
- J. E. Siff, S. W. Meldon and A. J. Tomassoni, Ann. Emerg. Med., 1999, 33, 73–76 CrossRef CAS.
- T. Akase, S. Onodera, T. Jobo, R. Matsushita, M. Kaneko and S. Tashiro, Yakugaku Zasshi, 2003, 123, 817–824 CrossRef CAS.
- J. C. Spina, M. A. A. Rivero, C. K. M. Pietrani, L. Savluky and R. D. G. Mónaco, Rev. Argent. Radiol., 2013, 77, 139–146 Search PubMed.
- C. M. Kim, R. Y. Park, M. H. Choi, H. Y. Sun and S. H. Shin, J. Infect. Dis., 2007, 195, 90–98 CrossRef CAS PubMed.
- A. J. Leonard, A. J. Patterson, C. E. Collins and K. A. Chalmers, e-SPEN Journal, 2013, 8, e210–e212 CrossRef PubMed.
- M. A. V. Lopez, A. Carracedo, F. Lendinez, F. J. Muñoz, J. López and A. Muñoz, Haematologica, 2006, 91, 264–265 Search PubMed.
- J. Piedras, E. Alvarez, F. M. Herrera and M. S. Cordova, Rev. Invest. Clin., 1993, 45, 469–472 CAS.
- W. Breuer, A. Ronson, I. N. Slotki, A. Abramov, C. Hershko and Z. L. Cabantchik, Blood, 2000, 95, 2975–2981 CAS.
- M. Olivares, T. Walter, J. D. Cook, E. Hertrampf and F. Pizarro, Am. J. Clin. Nutr., 2000, 72, 1191–1195 CAS.
- M. Muñoz, S. Gómez-Ramírez and A. Campos, EMJ, Hematol., 2014, 1, 123–132 Search PubMed.
- Y. Adachi, N. Sato, Y. Saito, Y. Kimura, Y. Nakata, K. Ito, K. Kamiya, H. Matsuda, T. Tsukamoto and M. Ogawa, Journal of Neuroimaging, 2015, 25, 443–451 CrossRef PubMed.
- M. Zhang, Y. Gao, M. Li, M. Yu, F. Li, L. Li, M. Zhu, J. Zhang, T. Yi and C. Huang, Tetrahedron Lett., 2007, 48, 3709–3712 CrossRef CAS PubMed.
- L. Zhang, J. Wang, J. Fan, K. Guo and X. Peng, Bioorg. Med. Chem. Lett., 2011, 21, 5413–5416 CrossRef CAS PubMed.
- L. Huang, F. Hou, J. Cheng, P. Xi, F. Chen, D. Bai and Z. Zeng, Org. Biomol. Chem., 2012, 10, 9634–9638 CAS.
- X. Bao, J. Shi, X. Nie, B. Zhou, X. Wang, L. Zhang, H. Liao and T. Pang, Bioorg. Med. Chem., 2014, 22, 4826–4835 CrossRef CAS PubMed.
- M. Saleem, R. Abdullah, A. Ali, B. J. Park, E. H. Choi, I. S. Hong and K. H. Lee, Bioorg. Med. Chem., 2014, 22, 2045–2051 CrossRef CAS PubMed.
- P. Xie, F. Guo, R. Xia, Y. Wang, D. Yao, G. Yang and L. Xie, J. Lumin., 2014, 145, 849–854 CrossRef CAS PubMed.
- B. Rathinam, C. C. Chien, B. C. Chen and J. S. Liu, Tetrahedron, 2013, 69, 235–241 CrossRef CAS PubMed.
- K. S. Moon, Y. K. Yang, S. Ji and J. Tae, Tetrahedron Lett., 2010, 51, 3290–3293 CrossRef CAS PubMed.
- A. J. Weerasinghe, F. A. Abebe and E. Sinn, Tetrahedron Lett., 2011, 52, 5648–5651 CrossRef CAS PubMed.
- L. Zhang, J. Fan and X. Peng, Spectrochim. Acta, Part A, 2009, 73, 398–402 CrossRef PubMed.
- M. Xu, S. Wu, F. Zeng and C. Yu, Langmuir, 2010, 26, 4529–4534 CrossRef CAS PubMed.
- J. Nandre, S. Patil, V. Patil, F. Yu, L. Chen, S. Sahoo, T. Prior, C. Redshaw, P. Mahulikar and U. Patil, Biosens. Bioelectron., 2014, 61, 612–617 CrossRef CAS PubMed.
- V. K. Bhardwaj, P. Saluja, G. Hundal, M. S. Hundal, N. Singh and D. O. Jang, Tetrahedron, 2013, 69, 1606–1610 CrossRef CAS PubMed.
- D. Y. Lee, N. Singh and D. O. Jang, Tetrahedron Lett., 2010, 51, 1103–1106 CrossRef CAS PubMed.
- M. Saleem, K. S. Kwon and K. H. Lee, J. Lumin., 2015, 162, 14–24 CrossRef CAS PubMed.
- M. Kumar, R. Kumar, V. Bhalla, P. R. Sharma, T. Kaur and Y. Qurishi, Dalton Trans., 2012, 41, 408–412 RSC.
- P. K. Chung, S. R. Liu, H. F. Wang and S. P. Wu, J. Fluoresc., 2013, 23, 1139–1145 CrossRef CAS PubMed.
- A. Mitra, B. Ramanujam and C. P. Rao, Tetrahedron Lett., 2009, 50, 776–780 CrossRef CAS PubMed.
- S. Ghosh, C. K. Dey and R. Manna, Tetrahedron Lett., 2010, 51, 3177–3180 CrossRef CAS PubMed.
- M. J. C. Marenco, C. Fowley, B. W. Hyland, G. R. C. Hamilton, D. Galindo-Riaño and J. F. Callan, Tetrahedron Lett., 2012, 53, 670–673 CrossRef CAS PubMed.
- M. J. C. Marenco, C. Fowley, B. W. Hyland, D. Galindo-Riaño, S. K. Sahoo and J. F. Callan, J. Fluoresc., 2012, 22, 795–798 CrossRef CAS PubMed.
- N. Singh, N. Kaur, J. Dunn, M. MacKay and J. F. Callan, Tetrahedron Lett., 2009, 50, 953–956 CrossRef CAS PubMed.
- N. Li, Q. Xu, X. Xia, L. Wang, J. Lu and X. Wen, Mater. Chem. Phys., 2009, 114, 339–343 CrossRef CAS PubMed.
- A. Yuan, C. Zheng, Z. Zhang, L. Yang, C. Liu and H. Wang, J. Fluoresc., 2014, 24, 557–561 CrossRef CAS PubMed.
- Z. Li, Y. Zhou, K. Yin, Z. Yu, Y. Li and J. Ren, Dyes Pigm., 2014, 105, 7–11 CrossRef CAS PubMed.
- J. H. Xu, Y. M. Hou, Q. J. Ma, X. F. Wu and X. J. Wei, Spectrochim. Acta, Part A, 2013, 112, 116–124 CrossRef CAS PubMed.
- L. Qiu, C. Zhu, H. Chen, M. Hu, W. He and Z. Guo, Chem. Commun., 2014, 50, 4631–4634 RSC.
- S. Huang, P. Du, C. Min, Y. Liao, H. Sun and Y. Jiang, J. Fluoresc., 2013, 23, 621–627 CrossRef CAS PubMed.
- D. Y. Lee, N. Singh and D. O. Jang, Tetrahedron Lett., 2011, 52, 1368–1371 CrossRef CAS PubMed.
- C. R. Lohani, J. M. Kim and K. H. Lee, Bioorg. Med. Chem. Lett., 2009, 19, 6069–6073 CrossRef CAS PubMed.
- Y. Yan, Z. Che, X. Yu, X. Zhi, J. Wang and H. Xu, Bioorg. Med. Chem., 2013, 21, 508–513 CrossRef CAS PubMed.
- S. Chandra, Deepshikha and A. Sarkar, Spectrochim. Acta, Part A, 2013, 107, 271–279 CrossRef CAS PubMed.
- Y. Chen and J. Jiang, Spectrochim. Acta, Part A, 2013, 116, 418–423 CrossRef CAS PubMed.
- M. Shamsipur, M. Sadeghi, A. Garau and V. Lippolis, Anal. Chim. Acta, 2013, 761, 169–177 CrossRef CAS PubMed.
- Y. Li, Z. Csok, P. Szuroczki, L. Kollar, L. Kiss and S. Kunsagi-Mate, Anal. Chim. Acta, 2013, 799, 51–56 CrossRef CAS PubMed.
- N. C. Lim, S. V. Pavlova and C. Bruckner, Inorg. Chem., 2009, 48, 1173–1182 CrossRef CAS PubMed.
- Z. Q. Liang, C. X. Wang, J. X. Yang, H. W. Gao, Y. P. Tian, X. T. Tao and M. H. Jiang, New J. Chem., 2007, 31, 906–910 RSC.
- J. Zhang, L. Wen, F. Miao, D. Tian, X. Zhu and H. Li, New J. Chem., 2012, 36, 656–661 RSC.
- M. H. Mashhadizadeh, I. S. Shoaei and N. Monadi, Talanta, 2004, 64, 1048–1052 CrossRef CAS PubMed.
- D. Wei, Y. Sun, J. Yin, G. Wei and Y. Du, Sens. Actuators, B, 2011, 160, 1316–1321 CrossRef CAS PubMed.
- P. Pulido-Tofino, J. M. Barrero-Moreno and M. C. Pérez-Conde, Talanta, 2000, 51, 537–545 CrossRef CAS.
- K. Suganandam, P. Santhosh, M. Sankarasubramanian, A. Gopalan, T. Vasudevan and K. P. Lee, Sens. Actuators, B, 2005, 105, 223–231 CrossRef CAS PubMed.
- R. K. Shervedani, A. Hatefi-Mehrjardi and A. Asadi-Farsani, Anal. Chim. Acta, 2007, 601, 164–171 CrossRef CAS PubMed.
- S. K. Tripathy, J. Y. Woo and C. S. Han, Sens. Actuators, B, 2013, 181, 114–118 CrossRef CAS PubMed.
- R. K. Shervedani and Z. Akrami, Biosens. Bioelectron., 2013, 39, 31–36 CrossRef CAS PubMed.
- X. Mu, L. Qi, P. Dong, J. Qiao, J. Hou, Z. Nie and H. Ma, Biosens. Bioelectron., 2013, 49, 249–255 CrossRef CAS PubMed.
- J. Ju and W. Chen, Biosens. Bioelectron., 2014, 58, 219–225 CrossRef CAS PubMed.
- A. Ananthanarayanan, X. Wang, P. Routh, B. Sana, S. Lim, D. H. Kim, K. H. Lim, J. Li and P. Chen, Adv. Funct. Mater., 2014, 24, 3021–3026 CrossRef CAS PubMed.
- H. A. McIlwee, C. L. Schauer, V. G. Praig, R. Boukherroub and S. Szunerits, Analyst, 2008, 133, 673–677 RSC.
- V. N. Mehta, S. K. Kailasa and H. F. Wu, New J. Chem., 2014, 38, 1503–1511 RSC.
- T. Gupta and M. E. Boom, J. Am. Chem. Soc., 2007, 129, 12296–12303 CrossRef CAS PubMed.
- J. Feng, Y. Ju, J. Liu, H. Zhang and X. Chen, Anal. Chim. Acta, 2015, 854, 153–160 CrossRef CAS PubMed.
- A. Hens, A. Maity and K. K. Rajak, Inorg. Chim. Acta, 2014, 423, 408–420 CrossRef CAS PubMed.
- S. Erdemir and S. Malkondu, Sens. Actuators, B, 2013, 188, 1225–1229 CrossRef CAS PubMed.
- H. Xu, R. Miao, Z. Fang and X. Zhong, Anal. Chim. Acta, 2011, 687, 82–88 CrossRef CAS PubMed.
- Q. Zheng, S. Chen, Z. Wang and Y. Cui, Talanta, 2011, 85, 824–828 CrossRef CAS PubMed.
- Y. Xu, L. Xiao, S. Sun, Z. Pei, Y. Pei and Y. Pang, Chem. Commun., 2014, 50, 7514–7516 RSC.
- Y. Qin, J. G. Miranda, C. I. Stoddard, K. M. Dean, D. F. Galati and A. E. Palmer, ACS Chem. Biol., 2013, 8, 2366–2371 CrossRef CAS PubMed.
- T. Hirayama, M. Taki, K. Akaoka and Y. Yamamoto, Bioorg. Med. Chem. Lett., 2012, 22, 7410–7413 CrossRef CAS PubMed.
- K. Tayade, S. K. Sahoo, B. Bondhopadhyay, V. K. Bhardwaj, N. Singh, A. Basu, R. Bendre and A. Kuwar, Biosens. Bioelectron., 2014, 61, 429–433 CrossRef CAS PubMed.
- M. Hosseini, S. D. Abkenar, M. R. Ganjali and F. Faridbod, Mater. Sci. Eng., C, 2011, 31, 428–433 CrossRef CAS PubMed.
- Y. You, S. Lee, T. Kim, K. Ohkubo, W. S. Chae, S. Fukuzumi, G. J. Jhon, W. Nam and S. J. Lippard, J. Am. Chem. Soc., 2011, 133, 18328–18342 CrossRef CAS PubMed.
- K. Hanaoka, Y. Muramatsu, Y. Urano, T. Terai and T. Nagano, Chem.–Eur. J., 2010, 16, 568–572 CrossRef CAS PubMed.
- P. Chabosseau, E. Tuncay, G. Meur, E. A. Bellomo, A. Hessels, S. Hughes, P. R. V. Johnson, M. Bugliani, P. Marchetti, B. Turan, A. R. Lyon, M. Merkx and G. A. Rutter, ACS Chem. Biol., 2014, 9, 2111–2120 CrossRef CAS PubMed.
- P. S. Hariharan and S. P. Anthony, Anal. Chim. Acta, 2014, 848, 74–79 CrossRef CAS PubMed.
- J. Zhang, W. Jiang, Q. Luo, X. Zhang, Q. Guo, M. Liu and X. Zhou, Talanta, 2014, 122, 101–105 CrossRef CAS PubMed.
- M. Kumar, N. Kumar and V. Bhalla, Chem. Commun., 2013, 49, 877–879 RSC.
- Y. Dong, Y. Wu, X. Jiang, X. Huang, Y. Cheng and C. Zhu, Polymer, 2011, 52, 5811–5816 CrossRef CAS PubMed.
- X. Fang, H. Li, G. Zhao, X. Fang, J. Xu and W. Yang, Biosens. Bioelectron., 2013, 42, 308–313 CrossRef CAS PubMed.
- J. Y. Choi, D. Kim and J. Yoon, Dyes Pigm., 2013, 96, 176–179 CrossRef CAS PubMed.
- M. Hosseini, A. Ghafarloo, M. R. Ganjali, F. Faridbod, P. Norouzi and M. S. Niasari, Sens. Actuators, B, 2014, 198, 411–415 CrossRef CAS PubMed.
- J. F. Zhang, S. Bhuniya, Y. H. Lee, C. Bae, J. H. Lee and J. S. Kim, Tetrahedron Lett., 2010, 51, 3719–3723 CrossRef CAS PubMed.
- M. J. Kim, K. Kaur, N. Singh and D. O. Jang, Tetrahedron, 2012, 68, 5429–5433 CrossRef CAS PubMed.
- Y. Zhang, X. Guo, L. Jia, S. Xu, Z. Xu, L. Zheng and X. Qian, Dalton Trans., 2012, 41, 11776–11782 RSC.
- A. E. Lee, M. R. Grace, A. G. Meyer and K. L. Tuck, Tetrahedron Lett., 2010, 51, 1161–1165 CrossRef CAS PubMed.
- L. Y. Niu, H. Li, L. Feng, Y. S. Guan, Y. Z. Chen, C. F. Duan, L. Z. Wu, Y. F. Guan, C. H. Tung and Q. Z. Yang, Anal. Chim. Acta, 2013, 775, 93–99 CrossRef CAS PubMed.
- C. Zhang, Z. Liu, Y. Li, W. He, X. Gao and Z. Guo, Chem. Commun., 2013, 49, 11430–11432 RSC.
- J. T. Fletcher, B. S. Bruck and D. E. Deever, Tetrahedron Lett., 2013, 54, 5366–5369 CrossRef CAS PubMed.
- Z. L. Gong, F. Ge and B. X. Zhao, Sens. Actuators, B, 2011, 159, 148–153 CrossRef CAS PubMed.
- V. Bhalla, Roopa and M. Kumar, Org. Lett., 2012, 14, 2802–2805 CrossRef CAS PubMed.
- X. B. Yang, B. X. Yang, J. F. Ge, Y. J. Xu, Q. F. Xu, J. Liang and J. M. Lu, Org. Lett., 2011, 13, 2710–2713 CrossRef CAS PubMed.
- Y. Zhou, H. N. Kim and J. Yoon, Bioorg. Med. Chem. Lett., 2010, 20, 125–128 CrossRef CAS PubMed.
- P. Thirupathi and K. H. Lee, Bioorg. Med. Chem. Lett., 2013, 23, 6811–6815 CrossRef CAS PubMed.
- S. A. Ingale and F. Seela, J. Org. Chem., 2012, 77, 9352–9356 CrossRef CAS PubMed.
- X. L. Ni, X. Zeng, C. Redshaw and T. Yamato, J. Org. Chem., 2011, 76, 5696–5702 CrossRef CAS PubMed.
- L. Zhang, X. Cui, J. Sun, Y. Wang, W. Li and J. Fang, Bioorg. Med. Chem. Lett., 2013, 23, 3511–3514 CrossRef CAS PubMed.
- A. K. Mahapatra, S. K. Manna, C. D. Mukhopadhyay and D. Mandal, Sens. Actuators, B, 2014, 200, 123–131 CrossRef CAS PubMed.
- R. M. Wang, S. B. Huang, N. Zhao and Z. N. Chen, Inorg. Chem. Commun., 2010, 13, 1432–1434 CrossRef CAS PubMed.
- H. H. Wang, Q. Gan, X. J. Wang, L. Xue, S. H. Liu and H. Jiang, Org. Lett., 2007, 9, 4995–4998 CrossRef CAS PubMed.
- L. Xue, C. Liu and H. Jiang, Chem. Commun., 2009, 1061–1063 RSC.
- X. Zhou, Y. Lu, J. F. Zhu, W. H. Chan, A. W. M. Lee, P. S. Chan, R. N. S. Wong and N. K. Mak, Tetrahedron, 2011, 67, 3412–3419 CrossRef CAS PubMed.
- L. Praveen, C. H. Suresh, M. L. P. Reddy and R. L. Varma, Tetrahedron Lett., 2011, 52, 4730–4733 CrossRef CAS PubMed.
- Z. Li, Y. Xiang and A. Tong, Anal. Chim. Acta, 2008, 619, 75–80 CrossRef CAS PubMed.
- R. Azadbakht, H. Keypour, H. A. Rudbari, A. H. M. Zaheri and S. Menati, J. Lumin., 2012, 132, 1860–1866 CrossRef CAS PubMed.
- E. J. Song, H. Kim, I. H. Hwang, K. B. Kim, A. R. Kim, I. Noh and C. Kim, Sens. Actuators, B, 2014, 195, 36–43 CrossRef CAS PubMed.
- J. H. Hu, J. B. Li, J. Qi and Y. Sun, Sens. Actuators, B, 2015, 208, 581–587 CrossRef CAS PubMed.
- G. J. Park, Y. J. Na, H. Y. Jo, S. A. Lee, A. R. Kim, I. Noh and C. Kim, New J. Chem., 2014, 38, 2587–2594 RSC.
- A. Helal, M. H. O. Rashid, C. H. Choi and H. S. Kim, Tetrahedron, 2012, 68, 647–653 CrossRef CAS PubMed.
- M. Zhang, W. Lu, J. Zhou, G. Du, L. Jiang, J. Ling and Z. Shen, Tetrahedron, 2014, 70, 1011–1015 CrossRef CAS PubMed.
- W. H. Hsieh, C. F. Wan, D. J. Liao and A. T. Wu, Tetrahedron Lett., 2012, 53, 5848–5851 CrossRef CAS PubMed.
- S. Y. Kim and J. I. Hong, Tetrahedron Lett., 2009, 50, 2822–2824 CrossRef CAS PubMed.
- L. Y. Zhao, Q. L. Mi, G. K. Wang, J. H. Chen, J. F. Zhang, Q. H. Zhao and Y. Zhou, Tetrahedron Lett., 2013, 54, 3353–3358 CrossRef CAS PubMed.
- Z. Xu, K. H. Baek, H. N. Kim, J. Cui, X. Qian, D. R. Spring, I. Shin and J. Yoon, J. Am. Chem. Soc., 2010, 132, 601–610 CrossRef CAS PubMed.
- C. Y. Li, X. B. Zhang, Y. Y. Dong, Q. J. Ma, Z. X. Han, Y. Zhao, G. L. Shen and R. Q. Yu, Anal. Chim. Acta, 2008, 616, 214–221 CrossRef CAS PubMed.
- K. Li, X. Wang and A. Tong, Anal. Chim. Acta, 2013, 776, 69–73 CrossRef CAS PubMed.
- G. J. Park, M. M. Lee, G. R. You, Y. W. Choi and C. Kim, Tetrahedron Lett., 2014, 55, 2517–2522 CrossRef CAS PubMed.
- G. J. Park, D. Y. Park, K. M. Park, Y. Kim, S. J. Kim, P. S. Chang and C. Kim, Tetrahedron, 2014, 70, 7429–7438 CrossRef CAS PubMed.
- D. Udhayakumari, S. Saravanamoorthy, M. Ashok and S. Velmathi, Tetrahedron Lett., 2011, 52, 4631–4635 CrossRef CAS PubMed.
- Y. J. Lee, C. Lim, H. Suh, E. J. Song and C. Kim, Sens. Actuators, B, 2014, 201, 535–544 CrossRef CAS PubMed.
- Z. Wu, Y. Zhang, J. S. Ma and G. Yang, Inorg. Chem., 2006, 45, 3140–3142 CrossRef CAS PubMed.
- K. Shen, X. Yang, Y. Cheng and C. Zhu, Tetrahedron, 2012, 68, 5719–5723 CrossRef CAS PubMed.
- A. N. Gusev, V. F. Shul'gin, S. B. Meshkova, S. S. Smola and W. Linert, J. Lumin., 2014, 155, 311–316 CrossRef CAS PubMed.
- W. H. Ding, W. Cao, X. J. Zheng, M. J. Ding, J. P. Qiao and L. P. Jin, Dalton Trans., 2014, 43, 6429–6435 RSC.
- A. Gogoi, S. Samanta and G. Das, Sens. Actuators, B, 2014, 202, 788–794 CrossRef CAS PubMed.
- F. Qian, C. Zhang, Y. Zhang, W. He, X. Gao, P. Hu and Z. Guo, J. Am. Chem. Soc., 2009, 131, 1460–1468 CrossRef CAS PubMed.
- J. T. Hou, B. Y. Liu, K. Li, K. K. Yu, M. B. Wu and X. Q. Yu, Talanta, 2013, 116, 434–440 CrossRef CAS PubMed.
- J. Wang and C. S. Ha, Tetrahedron, 2009, 65, 6959–6964 CrossRef CAS PubMed.
- M. Natali, L. Soldi and S. Giordani, Tetrahedron, 2010, 66, 7612–7617 CrossRef CAS PubMed.
- J. F. Zhu, H. Yuan, W. H. Chan and A. W. M. Lee, Tetrahedron Lett., 2010, 51, 3550–3554 CrossRef CAS PubMed.
- J. F. Zhu, W. H. Chan and A. W. M. Lee, Tetrahedron Lett., 2012, 53, 2001–2004 CrossRef CAS PubMed.
- Z. Guo, G. H. Kim, I. Shin and J. Yoon, Biomaterials, 2012, 33, 7818–7827 CrossRef CAS PubMed.
- J. M. An, M. H. Yan, Z. Y. Yang, T. R. Li and Q. X. Zhou, Dyes Pigm., 2013, 99, 1–5 CrossRef CAS PubMed.
- Y. Huang, Q. Lin, J. Wu and N. Fu, Dyes Pigm., 2013, 99, 699–704 CrossRef CAS PubMed.
- J. F. Zhu, H. Yuan, W. H. Chan and A. W. M. Lee, Org. Biomol. Chem., 2010, 8, 3957–3964 CAS.
- Y. Ma, H. Chen, F. Wang, S. Kambam, Y. Wang, C. Mao and X. Chen, Dyes Pigm., 2014, 102, 301–307 CrossRef CAS PubMed.
- Y. W. Choi, G. J. Park, Y. J. Na, H. Y. Jo, S. A. Lee, G. R. You and C. Kim, Sens. Actuators, B, 2014, 194, 343–352 CrossRef CAS PubMed.
- Z. Ye, G. Wang, J. Chen, X. Fu, W. Zhang and J. Yuan, Biosens. Bioelectron., 2010, 26, 1043–1048 CrossRef CAS PubMed.
- Z. L. Gong, B. X. Zhao, W. Y. Liu and H. S. Lv, J. Photochem. Photobiol., A, 2011, 218, 6–10 CrossRef CAS PubMed.
- P. Mahato, A. Ghosh, S. K. Mishra, A. Shrivastav, S. Mishra and A. Das, Chem. Commun., 2010, 46, 9134–9136 RSC.
- Y. Ding, Y. Xie, X. Li, J. P. Hill, W. Zhang and W. Zhu, Chem. Commun., 2011, 47, 5431–5433 RSC.
- D. Maity and T. Govindaraju, Chem. Commun., 2012, 48, 1039–1041 RSC.
- Z. Xu, X. Liu, J. Pan and D. R. Spring, Chem. Commun., 2012, 48, 4764–4766 RSC.
- V. Bhalla, R. Tejpal and M. Kumar, Dalton Trans., 2012, 41, 10182–10188 RSC.
- D. A. Safin, M. G. Babashkina and Y. Garcia, Dalton Trans., 2013, 42, 1969–1972 RSC.
- Z. Zhang, F. W. Wang, S. Q. Wang, F. Ge, B. X. Zhao and J. Y. Miao, Org. Biomol. Chem., 2012, 10, 8640–8644 CAS.
- H. Nouri, C. Cadiou, L. M. Lawson-Daku, A. Hauser, S. Chevreux, I. Déchamps-Olivier, F. Lachaud, R. Ternane, M. Trabelsi-Ayadi, F. Chuburu and G. Lemercier, Dalton Trans., 2013, 42, 12157–12164 RSC.
- P. Kaleeswaran, I. A. Azath, V. Tharmaraj and K. Pitchumani, ChemPlusChem, 2014, 79, 1361–1366 CrossRef CAS PubMed.
- S. C. Burdette and S. L. Lippard, Inorg. Chem., 2002, 41, 6816–6823 CrossRef CAS PubMed.
- S. Y. Park, J. H. Yoon, C. S. Hong, R. Souane, J. S. Kim, S. E. Matthews and J. Vicens, J. Org. Chem., 2008, 73, 8212–8218 CrossRef CAS PubMed.
- P. Bairi, P. Chakraborty, B. Roy and A. K. Nandi, Sens. Actuators, B, 2014, 193, 349–355 CrossRef CAS PubMed.
- Q. Wei, R. Nagi, K. Sadeghi, S. Feng, E. Yan, S. J. Ki, R. Caire, D. Tseng and A. Ozcan, ACS Nano, 2014, 8, 1121–1129 CrossRef CAS PubMed.
- X. Wang, J. Zhao, C. Guo, M. Pei and G. Zhang, Sens. Actuators, B, 2014, 193, 157–165 CrossRef CAS PubMed.
- S. Lee, B. A. Rao and Y. A. Son, Sens. Actuators, B, 2014, 196, 388–397 CrossRef CAS PubMed.
- A. A. A. Aziz and S. H. Sed, Sens. Actuators, B, 2014, 197, 155–163 CrossRef PubMed.
- W. J. Qu, G. Y. Gao, B. B. Shi, T. B. Wei, Y. M. Zhang, Q. Lin and H. Yao, Sens. Actuators, B, 2014, 204, 368–374 CrossRef CAS PubMed.
- J. Duan, H. Yin, R. Wei and W. Wang, Biosens. Bioelectron., 2014, 57, 139–142 CrossRef CAS PubMed.
- S. Pal, B. Sen, M. Mukherjee, K. Dhara, E. Zangrando, S. K. Mandal, A. R. K. Bukhsh and P. Chattopadhyay, Analyst, 2014, 139, 1628–1631 RSC.
- D. Maity, A. Kumar, R. Gunupuru and P. Paul, Colloids Surf., A, 2014, 455, 122–128 CrossRef CAS PubMed.
- Y. Wei, B. Li, X. Wang and Y. Duan, Analyst, 2014, 139, 1618–1621 RSC.
- H. S. So, B. A. Rao, J. Hwang, K. Yesudas and Y. A. Son, Sens. Actuators, B, 2014, 202, 779–787 CrossRef CAS PubMed.
- G. L. Wang, K. L. Liu, Y. M. Dong, Z. J. Li and C. Zhang, Anal. Chim. Acta, 2014, 827, 34–39 CrossRef CAS PubMed.
- G. V. Guerreiro, A. J. Zaitouna and R. Y. Lai, Anal. Chim. Acta, 2014, 810, 79–85 CrossRef CAS PubMed.
- S. H. Gao, M. S. Xie, H. X. Wang, H. Y. Niu, G. R. Qu and H. M. Guo, Tetrahedron, 2014, 70, 4929–4933 CrossRef CAS PubMed.
- A. Han, X. Liu, G. D. Prestwich and L. Zang, Sens. Actuators, B, 2014, 198, 274–277 CrossRef CAS PubMed.
- L. Shi, Z. Chu, Y. Liu, W. Jin and X. Chen, Biosens. Bioelectron., 2014, 54, 165–170 CrossRef CAS PubMed.
- R. Verma and B. D. Gupta, Food Chem., 2015, 166, 568–575 CrossRef CAS PubMed.
- H. Ozay, R. Kagit, M. Yildirim, S. Yesilot and O. Ozay, J. Fluoresc., 2014, 24, 1593–1601 CrossRef CAS PubMed.
- Y. Hao, Q. Guo, H. Wu, L. Guo, L. H. Zhong, J. Wang, T. Lin, F. F. Fu and G. Chen, Biosens. Bioelectron., 2014, 52, 261–264 CrossRef CAS PubMed.
- H. B. Teh, H. Wu, X. Zuo and S. F. Y. Li, Sens. Actuators, B, 2014, 195, 623–629 CrossRef CAS PubMed.
- H. P. Borase, C. D. Patil, R. B. Salunkhe, R. K. Suryawanshi, B. K. Salunke and S. V. Patil, Bioprocess Biosyst. Eng., 2014, 37, 2223–2233 CrossRef CAS PubMed.
- S. Tang, P. Tong, W. Lu, J. Chen, Z. Yan and L. Zhang, Biosens. Bioelectron., 2014, 59, 1–5 CrossRef CAS PubMed.
- X. Cui, L. Zhu, J. Wu, Y. Hou, P. Wang, Z. Wang and M. Yang, Biosens. Bioelectron., 2015, 63, 506–512 CrossRef CAS PubMed.
- Z. Mohammadpour, A. Safavi and M. Shamsipur, Chem. Eng. J., 2014, 255, 1–7 CrossRef CAS PubMed.
- L. Shen, Y. He, X. Yang and W. Ma, Spectrochim. Acta, Part A, 2015, 135, 172–179 CrossRef CAS PubMed.
- B. Wang, S. Zhuo, L. Chen and Y. Zhang, Spectrochim. Acta, Part A, 2014, 131, 384–387 CrossRef CAS PubMed.
- Z. X. Wang and S. N. Ding, Anal. Chem., 2014, 86, 7436–7445 CrossRef CAS PubMed.
- A. R. Firooz, A. A. Ensafi, K. S. Hoseini and N. Kazemifard, Mater. Sci. Eng., C, 2014, 38, 73–78 CrossRef CAS PubMed.
- P. J. J. Huang and J. Liu, Anal. Chem., 2014, 86, 5999–6005 CrossRef CAS PubMed.
- Y. Zhou, H. Dong, L. Liu, M. Li, K. Xiao and M. Xu, Sens. Actuators, B, 2014, 196, 106–111 CrossRef CAS PubMed.
- J. J. Du, L. Jiang, Q. Shao, X. G. Liu, R. S. Marks, J. Ma and X. D. Chen, Small, 2013, 9, 1467–1481 CrossRef CAS PubMed.
- E. Karakus, M. Ucuncu and M. Emrullahoglu, Chem. Commun., 2014, 50, 1119–1121 RSC.
- K. Bera, A. K. Das, M. Nag and S. Basak, Anal. Chem., 2014, 86, 2740–2746 CrossRef CAS PubMed.
- K. S. Kumar, T. Ramakrishnappa, R. G. Balakrishna and M. Pandurangappa, J. Fluoresc., 2014, 24, 67–74 CrossRef CAS PubMed.
- T. Mistri, R. Alam, M. Dolai, S. K. Mandal, P. Guha, A. R. Khuda-Bukhsh and M. Ali, Eur. J. Inorg. Chem., 2013, 5854–5861 CrossRef CAS PubMed.
- K. Ghosh, T. Sarkar and A. Majumdar, Tetrahedron Lett., 2013, 54, 6464–6468 CrossRef CAS PubMed.
- B. Hu, L. L. Hu, M. L. Chen and J. H. Wang, Biosens. Bioelectron., 2013, 49, 499–505 CrossRef CAS PubMed.
- F. Yan, M. Wang, D. Cao, N. Yang, Y. Fu, L. Chen and L. Chen, Dyes Pigm., 2013, 98, 42–50 CrossRef CAS PubMed.
- H. Y. Lee, K. M. K. Swamy, J. Y. Jung, G. Kim and J. Yoon, Sens. Actuators, B, 2013, 182, 530–537 CrossRef CAS PubMed.
- Y. Zhou, K. Chu, H. Zhen, Y. Fang and C. Yao, Spectrochim. Acta, Part A, 2013, 106, 197–202 CrossRef CAS PubMed.
- M. Saleem, R. Abdullah, A. Ali, B. J. Park, E. H. Choi, I. S. Hong and K. H. Lee, Anal. Methods, 2014, 6, 3588–3597 RSC.
- F. Yan, D. Cao, M. Wang, N. Yang, Q. Yu, L. Dai and L. Chen, J. Fluoresc., 2012, 22, 1249–1256 CrossRef CAS PubMed.
- V. Bhalla, Roopa, M. Kumar, P. R. Sharma and T. Kaur, Inorg. Chem., 2012, 51, 2150–2156 CrossRef CAS PubMed.
- P. Mahato, S. Saha, E. Suresh, R. D. Liddo, P. P. Parnigotto, M. T. Conconi, M. K. Kesharwani, B. Ganguly and A. Das, Inorg. Chem., 2012, 51, 1769–1777 CrossRef CAS PubMed.
- H. H. Wang, L. Xue, C. L. Yu, Y. Y. Qian and H. Jiang, Dyes Pigm., 2011, 91, 350–355 CrossRef CAS PubMed.
- Y. Zhao, B. Zheng, J. Du, D. Xiao and L. Yang, Talanta, 2011, 85, 2194–2201 CrossRef CAS PubMed.
- H. Wang, Y. Li, S. Xu, Y. Li, C. Zhou, X. Fei, L. Sun, C. Zhang, Y. Li, Q. Yang and X. Xu, Org. Biomol. Chem., 2011, 9, 2850–2855 CAS.
- H. N. Kim, S. W. Nam, K. M. K. Swamy, Y. Jin, X. Chen, Y. Kim, S. J. Kim, S. Park and J. Yoon, Analyst, 2011, 136, 1339–1343 RSC.
- H. Yu, Y. Xiao, H. Guo and X. Qian, Chem.–Eur. J., 2011, 17, 3179–3191 CrossRef CAS PubMed.
- J. F. Zhang, C. S. Lim, B. R. Cho and J. S. Kim, Talanta, 2010, 83, 658–662 CrossRef CAS PubMed.
- G. Fang, M. Xu, F. Zeng and S. Wu, Langmuir, 2010, 26, 17764–17771 CrossRef CAS PubMed.
- Y. Zhou, X.-Y. You, Y. Fang, J.-Y. Li, K. Liu and C. Yao, Org. Biomol. Chem., 2010, 8, 4819–4822 CAS.
- L. Jiang, L. Wang, B. Zhang, G. Yin and R. Y. Wang, Eur. J. Inorg. Chem., 2010, 4438–4443 CrossRef CAS PubMed.
- Y. Zhao, Y. Sun, X. Lv, Y. Liu, M. Chen and W. Guo, Org. Biomol. Chem., 2010, 8, 4143–4147 CAS.
- W. Lin, X. Cao, Y. Ding, L. Yuan and Q. Yu, Org. Biomol. Chem., 2010, 8, 3618–3620 CAS.
- W. Huang, P. Zhou, W. Yan, C. He, L. Xiong, F. Li and C. Duan, J. Environ. Monit., 2009, 11, 330–335 RSC.
- X. Chen, S. W. Nam, M. J. Jou, Y. Kim, S. J. Kim, S. Park and J. Yoon, Org. Lett., 2008, 10, 5235–5238 CrossRef CAS PubMed.
- X. Zhang, Y. Xiao and X. Qian, Angew. Chem., Int. Ed., 2008, 47, 8025–8029 CrossRef CAS PubMed.
- H. Yang, Z. Zhou, K. Huang, M. Yu, F. Li, T. Yi and C. Huang, Org. Lett., 2009, 9, 4729–4732 CrossRef PubMed.
- A. Jana, J. S. Kim, H. S. Jung and P. K. Bharadwaj, Chem. Commun., 2009, 4417–4419 RSC.
- S. K. Ko, Y. K. Yang, J. Tae and I. Shin, J. Am. Chem. Soc., 2006, 128, 14150–14155 CrossRef CAS PubMed.
- M. Taki, K. Akaoka, S. Iyoshi and Y. Yamamoto, Inorg. Chem., 2012, 51, 13075–13077 CrossRef CAS PubMed.
- S. Y. Yu and S. P. Wu, Sens. Actuators, B, 2014, 201, 25–30 CrossRef CAS PubMed.
- C. Bazzicalupi, C. Caltagirone, Z. Cao, Q. Chen, C. D. Natale, A. Garau, V. Lippolis, L. Lvova, H. Liu, I. Lundstrçm, M. C. Mostallino, M. Nieddu, R. Paolesse, L. Prodi, M. Sgarzi and N. Zaccheroni, Chem.–Eur. J., 2013, 19, 14639–14653 CrossRef CAS PubMed.
- O. García-Beltrán, N. Mena, T. A. Berríos, E. A. Castro, B. K. Cassels, M. T. Núñez and M. E. Aliaga, Tetrahedron Lett., 2012, 53, 6598–6601 CrossRef PubMed.
- M. Vonlanthen, C. M. Connelly, A. Deiters, A. Linden and N. S. Finney, J. Org. Chem., 2014, 79, 6054–6060 CrossRef CAS PubMed.
- M. Tian, L. Liu, Y. Li, R. Hu, T. Liu, H. Liu, S. Wang and Y. Li, Chem. Commun., 2014, 50, 2055–2057 RSC.
- N. Zhao, J. W. Y. Lam, H. H. Y. Sung, H. M. Su, I. D. Williams, K. S. Wong and B. Z. Tang, Chem.–Eur. J., 2014, 20, 133–138 CrossRef CAS PubMed.
- S. Q. Wang, S. Y. Liu, H. Y. Wang, X. X. Zheng, X. Yuan, Y. Z. Liu, J. Y. Miao and B. X. Zhao, J. Fluoresc., 2014, 24, 657–663 CrossRef CAS PubMed.
- S. Ozturk and S. Atilgan, Tetrahedron Lett., 2014, 55, 70–73 CrossRef CAS PubMed.
- J. Wang, W. Guo, J. H. Bae, S. H. Kim, J. Song and C. S. Ha, J. Mater. Chem., 2012, 22, 24681–24689 RSC.
- K. Ghosh, D. Tarafdar, A. Samadder and A. R. Khuda-Bukhsh, New J. Chem., 2013, 37, 4206–4213 RSC.
- M. Vedamalai and S. P. Wu, Eur. J. Org. Chem., 2012, 1158–1163 CrossRef CAS PubMed.
- S. Madhu, D. K. Sharma, S. K. Basu, S. Jadhav, A. Chowdhury and M. Ravikanth, Inorg. Chem., 2013, 52, 11136–11145 CrossRef CAS PubMed.
- H. Lu, L. Xiong, H. Liu, M. Yu, Z. Shen, F. Li and X. You, Org. Biomol. Chem., 2009, 7, 2554–2558 CAS.
- T. Zhang, G. She, X. Qi and L. Mu, Tetrahedron, 2013, 69, 7102–7106 CrossRef CAS PubMed.
- A. K. Mahapatra, J. Roy, P. Sahoo, S. K. Mukhopadhyay, A. Banik and D. Mandal, Tetrahedron Lett., 2013, 54, 2946–2951 CrossRef CAS PubMed.
- H. F. Wang and S. P. Wu, Tetrahedron, 2013, 69, 1965–1969 CrossRef CAS PubMed.
- J. Hatai, S. Pal, G. P. Jose and S. Bandyopadhyay, Inorg. Chem., 2012, 51, 10129–10135 CrossRef CAS PubMed.
- Q. Li, M. Peng, H. Li, C. Zhong, L. Zhang, X. Cheng, X. Peng, Q. Wang, J. Qin and Z. Li, Org. Lett., 2012, 14, 2094–2097 CrossRef CAS PubMed.
- T. Chen, W. Zhu, Y. Xu, S. Zhang, X. Zhang and X. Qian, Dalton Trans., 2010, 39, 1316–1320 RSC.
- C. Y. Li, X. B. Zhang, L. Qiao, Y. Zhao, C. M. He, S. Y. Huan, L. M. Lu, L. X. Jian, G. L. Shen and R. Q. Yu, Anal. Chem., 2009, 81, 9993–10001 CrossRef CAS PubMed.
- L. N. Neupane, J. M. Kim, C. R. Lohani and K. H. Lee, J. Mater. Chem., 2012, 22, 4003–4008 RSC.
- C. R. Lohani, J. M. Kim and K. H. Lee, Tetrahedron, 2011, 67, 4130–4136 CrossRef CAS PubMed.
- L. J. Ma, Y. Li, L. Li, J. Sun, C. Tian and Y. Wu, Chem. Commun., 2008, 6345–6347 RSC.
- L. Chen, L. Yang, H. Li, Y. Gao, D. Deng, Y. Wu and L. J. Ma, Inorg. Chem., 2011, 50, 10028–10032 CrossRef CAS PubMed.
- J. Wen, Z. Geng, Y. Yin and Z. Wang, Dalton Trans., 2011, 40, 9737–9745 RSC.
- S. Yoon, E. W. Miller, Q. He, P. H. Do and C. J. Chang, Angew. Chem., Int. Ed., 2007, 46, 6658–6661 CrossRef CAS PubMed.
- Y. Wu, H. Jing, Z. Dong, Q. Zhao, H. Wu and F. Li, Inorg. Chem., 2011, 50, 7412–7420 CrossRef CAS PubMed.
- Z. Xie, K. Wang, C. Zhang, Z. Yang, Y. Chen, Z. Guo, G. Y. Lu and W. He, New J. Chem., 2011, 35, 607–613 RSC.
| This journal is © The Royal Society of Chemistry 2015 |


