
 Open Access Article
 This Open Access Article is licensed under a
 Creative Commons Attribution 3.0 Unported Licence
Fabrication of novel mixed matrix polymer electrolyte membranes (PEMs) intended for renewable hydrogen production via electrolysis application†
Relebohile
Mokete
 *a,
František
Mikšík
bc,
Roman
Selyanchyn
b,
Nobuo
Takata
a,
Kyaw
Thu
ab and
Takahiko
Miyazaki
ab
*a,
František
Mikšík
bc,
Roman
Selyanchyn
b,
Nobuo
Takata
a,
Kyaw
Thu
ab and
Takahiko
Miyazaki
ab
aDepartment of Energy and Environmental Engineering, Interdisciplinary Graduate School of Engineering Sciences, Kyushu University, 6-1 Kasuga-koen, Kasuga-shi, Fukuoka 816-8580, Japan. E-mail: relemokete@kyudai.jp
bResearch Center for Next Generation Refrigerant Properties (NEXT-RP), International Institute of Carbon-Neutral Energy Research (I2CNER), Kyushu University, 744 Motooka, Nishi-ku, Fukuoka 819-0395, Japan
cInstitute of Innovation for Future Society, Nagoya University Furu-cho, Chikusa, Nagoya 464-8603, Japan
First published on 18th April 2024
Abstract
Hydrogen gas is among the sustainable energy forms that counteract the energy crisis. Polymer electrolyte membranes (PEMs) derived from biomass fillers and polyvinyl-based matrix blends have been fabricated and applied in H2 generation through electrolysis. Faradaic efficiencies ranging from 82.8 ± 1.9% to 88.9 ± 1.6% were exhibited when voltages of 6.5 V, 8 V and 10 V were applied; thus, proton conduction and hence H2 generation commenced at 2–2.5 V. The apparent morphology of the PEMs that verified the incorporation of pine bark (PB) and Chinese Tallow Seed Capsule (CT) fillers was visible as surface bumps and internal cavities within the PEMs. Although the proton conductivity of Nafion™ 115's (NF-M) was 23.94 mS cm−1, those of the fabricated PEMs (PB-M, CT-M and SSA-M) were 1.33, 0.46 and 0.48 mS cm−1, respectively. The PB-M exhibited good characteristics, including functional groups and water adsorption; thus, H2 production was achieved, but losses such as bubble production affected efficiency. This study presents a cost-effective alternative for H2 production that can be used in diverse applications.
1. Introduction
Recent advances in energy research have focused on renewable energy, along with the reduction of greenhouse gases such as carbon dioxide, which negatively affect the environment.1,2 Included in the promising renewable energy storage and conversion techniques are units called water electrolyzers that use the WE concept.3–6 WE involves green hydrogen production along with oxygen from water upon the supply of electrical energy.3–6 PEMs are often applied in electrolyzers to aid the electrolysis process because they are stable, cheap, duplicatable, and faultless. Nafion™ is a common high-performance PEM that is a perfluorinated sulfonic acid ionomer, and it is characterized by electrochemical and mechanical stability, as well as high proton conductivity, due to the sulfonic acid groups that form hydrophilic channels.7–11 Although the Nafion™ membrane (thickness range: 60–200 μm) is very effective for WE, its limitations include high cost and restricted availability, which may lead to fluorine pollution. Hence, alternative technologies that guarantee cost-effectiveness, broad availability, efficiency, environmental friendliness and sustainability need to be considered as countermeasures for environmental issues.3,12–14 Various materials used as PEMs facilitate proton conductivity and hence H2 production due to the presence of functional groups such as H− bonds, sulfonic, epoxy, hydroxyl, and carboxyl groups.15–19 Widely used hydrophilic materials for PEMs that aid the interaction with water are cellulosic, ionic polymers, PVA, PVP and polyethylene oxide. PVA is commonly used as a film-forming matrix that is biocompatible, non-toxic and inexpensive.20,21 However, the poor proton conductivity in PVA due to the lack of negatively charged functional groups (ions) limits its activity; therefore, this can be overcome by crosslinking PVA with negatively charged ions such as carboxylic (–COOH) and sulfonic groups (–SO3H) bearing materials such as SSA, PAA-PMA, and PSSA-PMA.21–24 In particular, sulfonic acid-containing cross-linkers such as SSA and sulfoacetic acid partake in proton conduction (–SO3–H+) while the GT reagent reacts with the primary functional groups of the cross-linked material (e.g. hydroxyl groups of starch).21,22,25 Some polymer blend studies, including Gadhave et al.,25 blended GT cross-linked PVA with starch and found that the mechanical and thermal properties were enhanced. Dai et al.26 doped carbon dots into the PVP and PES matrix; then, the power density was increased while SiO2 (0.5–10 wt%) loaded as a filler on NMPC/PVA exhibited the highest proton conductivity (5.08 × 10⁻⁴ S cm−1 or 0.508 mS cm−1) at 100 °C.27 The proton conductivity of PVA membranes cross-linked with SSA in the range of 10−3–10−2 S cm−1 (1–10 mS cm−1), while PVA/TiO2 PEMs cross-linked with GT exhibited proton conductivities of 10−3 S cm−1 (1 mS cm−1) and 0.0016 S cm−1 (1.6 mS cm−1) at ambient temperature and 130 °C, respectively.28,29 The limited availability and high cost of common PEMs call for the development of alternative PEMs that can be easily produced, affordable, efficient, mechanically stable, and ionic conductive as well as those that have reduced gas permeability, chemical resistance in strong REDOX conditions, minimized bubbles and holes in the membranes during fabrication.15,30 In addition, hydrophilic materials that exhibit excellent proton conductivity and suitable functional groups are necessary.31Commonly used advanced membranes, referred to as MMMs, are formed by the combination of the matrix (continuous part) and filler (dispersed part), in which the filler enhances the overall properties of the matrix, such as the increased surface area or surface mechanical strength.19 Typical matrix materials include polymers such as PVA, while the subdivisions of fillers are inorganic fillers (e.g., salts, metals, silicates, hydroxides, and oxides) and organic fillers (e.g., natural polymers, and carbon).19 Fillers that cannot improve mechanical strength are referred to as additives, whereas those that improve mechanical strength are known as linkers.19 Nanostructured and mesoporous materials have been utilized to form nanocomposite blends of MMMs, while biomass materials have been used as fillers due to their carbon content that improves the catalytic and electronic properties of the membrane.3 The high presence of cellulose in woody biomass avails the hydroxyl groups that form long polymer chains connected through molecular hydrogen bonds.30 Nanocellulose (nanosized cellulose) is produced through a mechanical approach, such as grinding, and it can be blended with other polymers to form proton-conducting composites.19,30,32 Other properties of biomass are affordability and availability, so Chinese tallow trees (Sapiumsebiferum L.), pine trees (Pinus pinaster) and maple leaves (Acer palmatum Thunb.) are some biomass materials that exist worldwide.33 CT originates from Asia, and its wax-coated seeds are composed of 40% lipids (oil); therefore, their application is in biofuel production, such as oil and biodiesel, soap, or candle production as well as wood-based composites, such as particleboard.34–37 The pine trees are lignocellulosic biomasses whose top brownish-grey cover known as PB has been of scientific interest because it is composed of catechins, taxifolin and phenolic acids (SI).38,39 These constituents promote the application of PB in sustainable engineering, including in the pharmaceutical and nutraceutical industries.38,39 ML is abundant during fall and can be used as feedstock during the preparation of carbonaceous adsorbents, such as biochar.40,41 Nanoparticles also aid the proton conductivity of the PEMs, and alternative composites to the Nafion membrane are silicalite-1/SPEEK and vinyltrimethoxylsilane-modified composites.42 Materials such as silica and zeolite are used as PEM materials. Zeolites are moderate proton conductors with ion exchange capability, while silica, although not a good conductor, exhibits good hydrophilic properties.42–45 In a study by Nur et al.,42 sulfonated polystyrene ZSM-5 exhibited a higher proton conductivity than phenyl sulfonic acid-functionalized zeolite. Pure mesoporous silica is scarce in the energy field, prompting its modification into composites with improved properties.45 Aluminium is commonly used as an additive; for instance, the MCM-41 type silica pore size was reduced from 3–5 nm to 2 nm after alumina coating, resulting in TMPS materials from mesoporous aluminum-doped silica with good adsorption capacity.45,46 Biomass-derived AC is significant in scientific research due to its high porosity, non-toxicity, low cost, good water adsorption ability, and thermal stability.47 Common biomass-derived AC materials that show good water adsorption include camphor leaves, walnut shells, and acorn nutshells.48
PEMs, used as electrolyzer components, promote water electrolysis, with the reported efficiency in the range of 70–80%, while the overall efficiencies of H2 production from solar power sources can be as high as 20%.49–51 Among electrolyzer types, such as PEM, AE, and SOE, PEM is of great research interest due to its reduced environmental impact.52–54 The PEM mainly utilizes a solid polymer electrolyte known as the proton-conducting membrane, which serves as a proton passage between the chambers of the electrodes.53 The electrodes of the PEM electrolyzers are within the anode and cathode chambers. In the anode chamber, electrical energy splits water into electrons and protons. The protons then go through the PEM, while the electrons pass through an electron-conducting path to recombine with the protons in the cathode to produce H2 gas (eqn (1)–(3)).2,55–58
| Anode reaction: H2O → 2H+ + 1/2O2 + 2e− | (1) |
| Cathode reaction: 2H+ + 2e− → H2 | (2) |
| Overall reaction: H2O → H2 + 1/2O2 | (3) |
The electrolysis process is depicted in Fig. 1, and the electrode materials used must be stable, effective, and resistant to corrosion. Therefore, an example of an anode electrode includes titanium felt, while that of the cathode is carbon paper or carbon felt.3 DI water is preferred for initiating the electrolysis process because it lowers the environmental impact, but acidic conditions are sometimes employed to enhance electrolyte conductivity.59
 | ||
| Fig. 1 Schematic diagram of the experimental electrolyzer. | ||
Enthalpy (286 kJ mol−1) and Gibbs free energy (237 kJ mol−1) represent the energy necessary to initiate the endothermic electrolysis reaction, in which water is split into H2 and O2.50,60,61 Therefore, thermodynamic parameters significant in electrochemistry, indicating the energy required for electrolysis, include the change in enthalpy (ΔH°), Gibbs free energy (ΔG°) and entropy (TΔS°), as shown in ESI,† eqn (S1). Other eqn (S2)–(S10) (ESI†) expressing reversible voltage, thermoneutral potential, efficiency and more are expressed in the (ESI†).57,61–66 Faradaic efficiency is a common efficiency used to evaluate the electrolytic process, quantitatively analyzing the number of electrons transported through the external circuit to the surface of the electrode to release either O2 or H2 during the electrochemical reaction.66,67 Water serves as a medium for the proton conductivity of dissolved ions that moves against the potential when an electric potential is applied during electrolysis. However, the movement of protons is rapid depending on the pH medium, as the acidic groups facilitate the progressive transportation of the hydronium ions (H3O+), enabling proton mobility.18,31,68–72 Therefore, the breaking and formation of H2 bonds occur simultaneously because protons form a long migration chain of the H-bonds.18,31,72,73 Protons link to neighboring water molecules, but the rearrangement of hydrogen–oxygen bonds results in proton release.31,74–76
This study aims to fabricate novel PEMs and apply them for H2 production through electrolysis. Additionally, it intends to provide alternative PEMs that are affordable and readily available owing to their constituents. Therefore, the performance of Nafion™ 115 membrane (NF-M), SSA cross-linked PVA–PVP PEMs without fillers (SSA-M) and SSA cross-linked PVA–PVP PEMs blended with various biomass fillers (PB-M and CT-M) was evaluated. The role of each PEM in improving proton conductivity was also investigated. To the best of our knowledge, almost all these materials used as fillers have never been studied for PEM fabrication and H2 production elsewhere, particularly in biomass-related studies. This research can serve as a reference for renewable energy, environmental remediation, biomaterials, electrochemistry, and nanotechnology fields, among others.
2. Experimental
2.1 Materials
The matrix for the original PEM in this study was prepared from PVA and PVP (FUJIFILM, Wako, Japan). A silicon defoamer (Asahi Silicone AF-147, Japan) was used to minimize foaming during the PEM preparation. The filler materials used were categorized into plant-based biomass materials, including CT and PB, as shown in Table 1. For cross-linking, SSA (70% in H2O) was used. An electrolyzer (Narika Co., Ltd, Japan) with dimensions of 100 mm × 90 mm × 220 mm and a mass of 180 g was used for H2 production. It consisted of the anode and cathode chambers with platinum-plated titanium and nickel electrodes (7 cm × 4.6 cm), respectively. The body of the electrolyzer was composed of polycarbonate, while the gas-generating tube was glass, and silicon stoppers were used to seal the outlets. DI water was used as the source medium instead of the acidic medium that has been utilized in many studies.75 The H2 gas production was determined using a gas displacement storage tank built into the electrolyzer by utilizing the concept of water volume displacement. A Nafion™ 115 membrane (Fuel Cell Store, USA, 127 μm) was used as a reference PEM for comparison with the membranes fabricated in this study. A sealed plastic was partially inserted between the electrodes at the membrane placement location to reduce the active operating area to the desired area in this study (Fig. 3(b)). The active operating area of the PEM, compatible with the electrolyzer, was (5.8 cm × 4.6 cm).| Material used | Scientific name | Category | Particle size (μm) |
|---|---|---|---|
| Chinese Tallow tree seed capsules | Triadicasebifera | Biomass | 32 |
| Pine bark | Pinus pinaster | 32 |
2.2 Biomass and filler preparation
The biomass materials, CT and PB (Table 1), were collected from their various trees, dried for 24 hours at 80 °C, crushed into powder using a laboratory blender (Wonder blender DM6, Taiwan) and ball-milled (Nitto Kagaky ANZ-52D, Japan) for 24 hours at 300 rpm. After milling, the fine powder was sieved with a horizontally shaking sieve (SKH-01, AsOne, 32 μm) at 230 rpm and stored in airtight plastic bags until further use.Prior to use, the biomass fillers were ball-milled for 48 hours and sieved using a 20 μm sieve (same procedure as above). Subsequently, a 1 wt% solution of the fillers and DI water was prepared, and the mixture was sonicated for 1 hour. The appropriate filler solution (Table 1) was then added directly to the PVA–PVP solution immediately after sonication. The resulting solution was thoroughly mixed and spread on a Teflon dish (diameter 11 cm and height 2.2 cm) using a simple solution casting method to create the desired membranes.29 The overall filler preparation steps are depicted in Fig. 2.
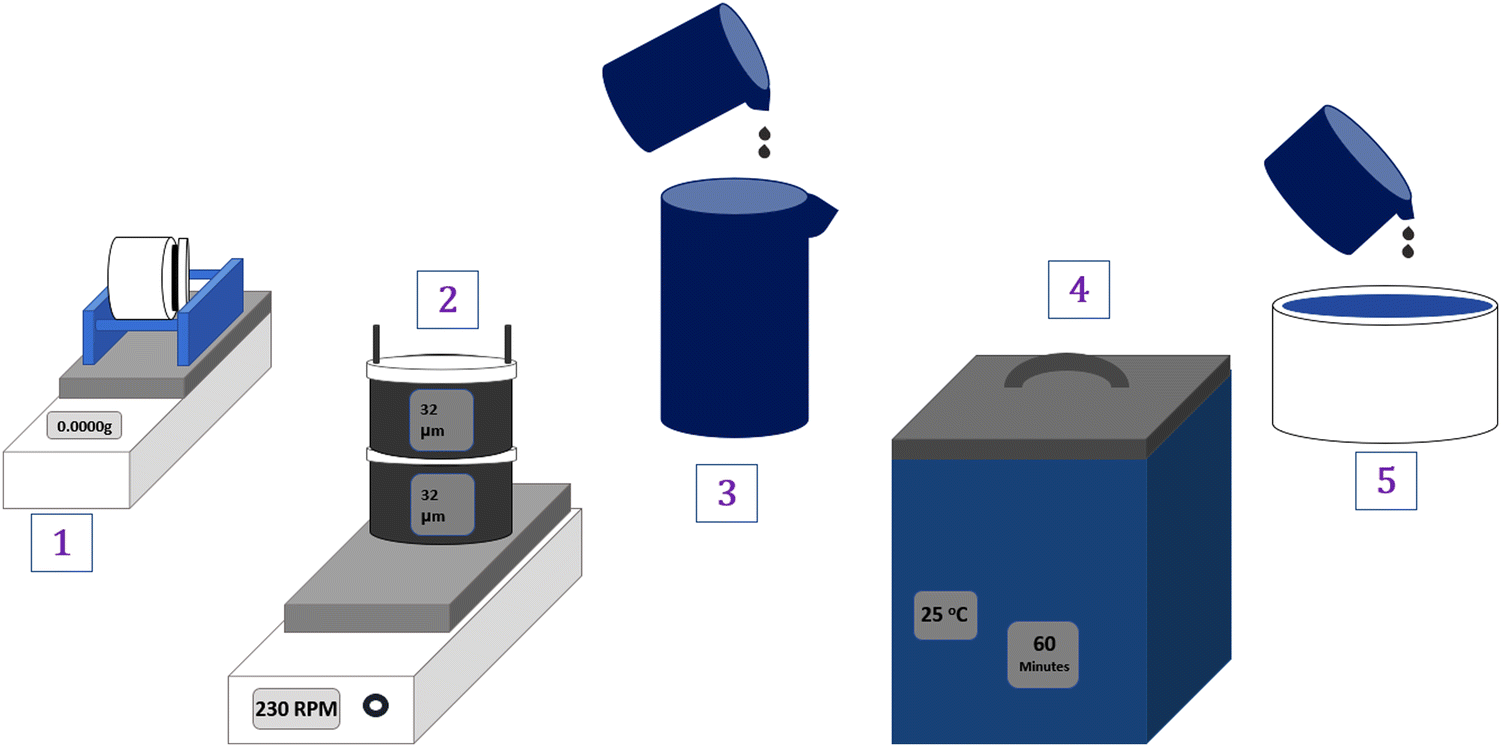 | ||
| Fig. 2 (1) Ball milling (filler + H2O) > (2) Horizontal sieving (filler) > (3) mixing (filler + H2O) > (4) sonication (1 h) > (5) blending with PVA–PVP. | ||
2.3 PEM fabrication
PVA (5 g) and PVP (5 g) were weighed in a 1![[thin space (1/6-em)]](https://www.rsc.org/images/entities/char_2009.gif) :1 ratio, and warm DI water was added to form a 10 wt% solution for all samples. 0.5 mL of the silicon defoamer (ASAHI, Japan) was added to the mixture. The mixture was continuously stirred using a hot plate at 90 °C for 2 hours.29,77 After mixing, sonication was performed for 3 hours; then, SSA (conc. 70 wt% (3.57 g)) was added for cross-linking. Subsequently, the PVA–PVP solution was mixed with 1 wt% of the filler (PB or CT) solution in a Teflon dish to attain a 90 μm thick membrane. Pure SSA cross-linked PVA–PVP membranes without fillers (SSA-M) were also prepared to observe the effect of no filler addition. To ensure complete drying of the membranes, the solutions were mixed, cast, and then put in an oven at 40 °C overnight to dry.77 The dry target weight (wt%) of the specific membranes fabricated is shown in Table 2.
:1 ratio, and warm DI water was added to form a 10 wt% solution for all samples. 0.5 mL of the silicon defoamer (ASAHI, Japan) was added to the mixture. The mixture was continuously stirred using a hot plate at 90 °C for 2 hours.29,77 After mixing, sonication was performed for 3 hours; then, SSA (conc. 70 wt% (3.57 g)) was added for cross-linking. Subsequently, the PVA–PVP solution was mixed with 1 wt% of the filler (PB or CT) solution in a Teflon dish to attain a 90 μm thick membrane. Pure SSA cross-linked PVA–PVP membranes without fillers (SSA-M) were also prepared to observe the effect of no filler addition. To ensure complete drying of the membranes, the solutions were mixed, cast, and then put in an oven at 40 °C overnight to dry.77 The dry target weight (wt%) of the specific membranes fabricated is shown in Table 2.
| PEM batch name | Cross-linker stock solution concentration (wt%) | Filler stock solutions concentration (wt%) | PVA/PVP dry target (wt%) | Cross-linker dry target (wt%) | Filler dry target (wt%) |
|---|---|---|---|---|---|
| PVA/PVP + SSA | 70 | 1 | 80 | 20 | 0 |
| PVA/PVP + SSA + filler (PB or CT) | 70 | 1 | 75 | 20 | 5 |
After 24 hours, cross-linking was performed by placing the membranes in an oven at 120 °C for 3 hours, followed by washing with DI water. The synthesized PEMs had an average thickness of 90 μm. For storage, the membranes were wrapped in an aluminum foil and kept in a dry cupboard. Before use, they were humidified to keep them moist and to make them easy to handle. The fabricated membranes were composed of the PVA–PVP + SSA + filler (PB or CT) combination, and they were compared with the membranes fabricated in the absence of the filler (PVA–PVP + SSA) as well as the Nafion™ 115 membrane. The identification of these membranes was based on the presence and absence of the filler (Table 3).
| Parameter | Specification | PEM label |
|---|---|---|
| Membrane | Matrix (PVA–PVP) + SSA | SSA-M |
| Matrix (PVA–PVP) + SSA + filler (PB) | PB-M | |
| Matrix (PVA–PVP) + SSA + filler (CT) | CT-M | |
| Nafion™ 115 | NF-M | |
| Anode (O2) | Platinum-plated titanium | |
| Cathode (H2) | Nickel |
2.4 Electrochemical experiments
The electrolyzer mentioned in the experiment (Section 2.1) was used for H2 generation through electrolysis (Table 3 and Fig. 3). The membrane was inserted between the anode and cathode chambers; then, each chamber was filled with 100 mL of water.69 Subsequently, the DC power supply was connected to the system; then, voltages of 6.5 V, 8 V and 10 V were applied, while the H2 and O2 produced accordingly in each chamber were collected and measured in the gas collection tubes. The volume of H2 produced for each batch was 4.77 mL. The current, voltage and power results were automatically recorded using a computer with a Python program connected to the power supply.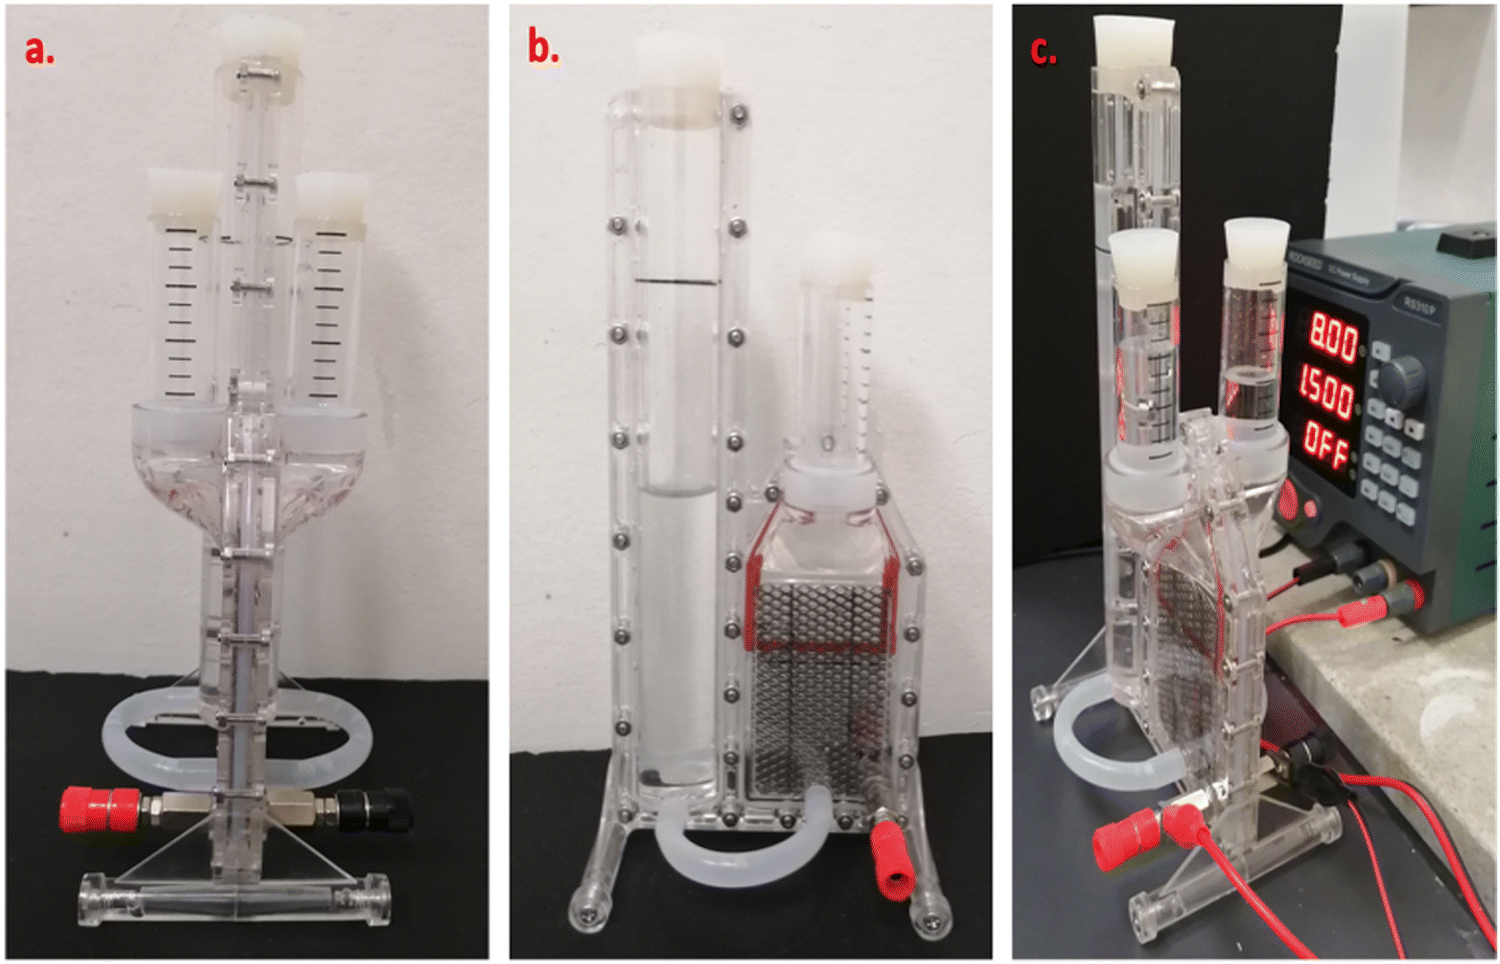 | ||
| Fig. 3 Specific electrolyzer used for the electrochemical experiments ((a) front and (b) side views as well as (c) the electrolyzer connected to the power supply). | ||
Faradaic efficiency was used to quantify the efficiency of the electrolyzers based on the number of electrons transported to the surface of the electrodes to participate in electrochemical reactions, such as H2 or O2 production.67Eqn (4)–(6) was used to calculate faradaic efficiency expressed as the ratio of the experimentally produced hydrogen gas volume (VH2(produced)) in mL to the theoretically calculated hydrogen volume (mL), as represented in eqn (4).67,78 Additionally, Faraday's second law determines the theoretical gas volume (eqn (5)) based on electrolysis time, current density and electrode area (assuming 100% faradaic efficiency). However, the experimental H2 gas volume (VH2(produced) = 4.77 mL) was obtained by measuring the water displacement of the gas during WE. In eqn (5), VH2(theoretical) represents the theoretical H2 gas, I is the applied current (A), and F is Faraday's constant (96 485.3 C mol−1). Additionally, eqn (6) indicates the ideal gas volume expression (VM) expression where R, T and P correspond to the ideal gas constant (0.0821 atm K−1 mol−1), temperature (K), and pressure (atm), respectively.65,66
 | (4) |
 | (5) |
 | (6) |
2.5 Characterization
The FT/IR was employed to analyze the surface functional groups on the powdered fillers (PB and CT) before blending them into the membrane PVA–PVP matrix. The FT/IR instrument used (JASCO FT/IR-4200) operated in the wavenumber range of 400–4000 cm−1 with a resolution of 2 cm−1. Two KBr crystals served as the sample holding matrix. The infrared energy penetrated the sample within the holder to produce the FT/IR spectrum. The spectrum displayed a wavenumber (cm−1) recorded against transmittance.
2.6 Water adsorption isotherms
The TGA analysis was performed to study the water vapor adsorption isotherms of membranes, and it was conducted at 25 °C.9 All the membranes were preheated at 120 °C in a vacuum environment to eliminate impurities that were introduced during the handling of the samples. The system recorded the vapor pressure, cell temperature and mass changes continuously. Therefore, the adsorption isotherms determined the amount of adsorbate adsorbed on the adsorbent versus the relative pressure (P/P0), where P and P0 represent absolute and saturated pressure, respectively.79 The range of the relative pressure (P/P0) at which the adsorption was performed was between 0.1 and 1.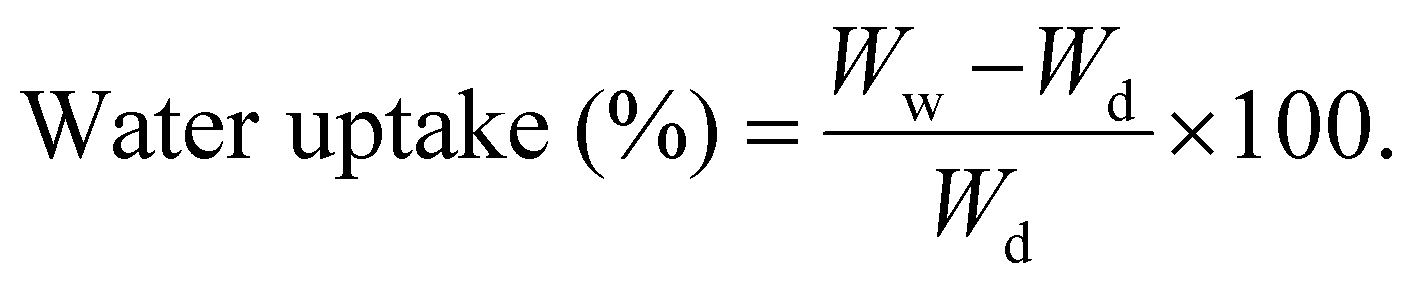 | (7) |
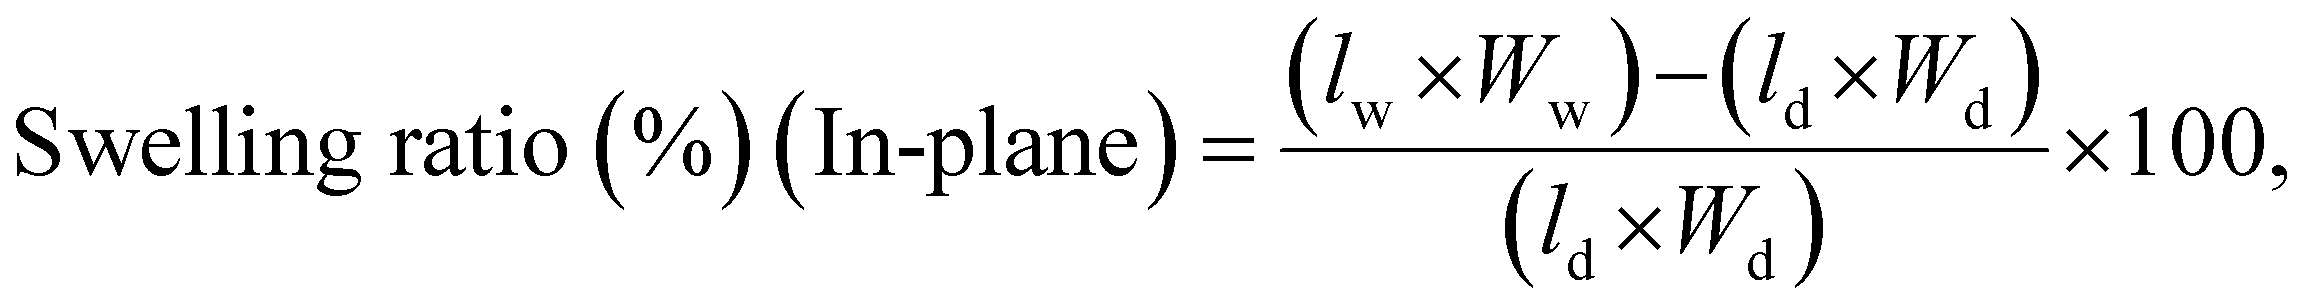
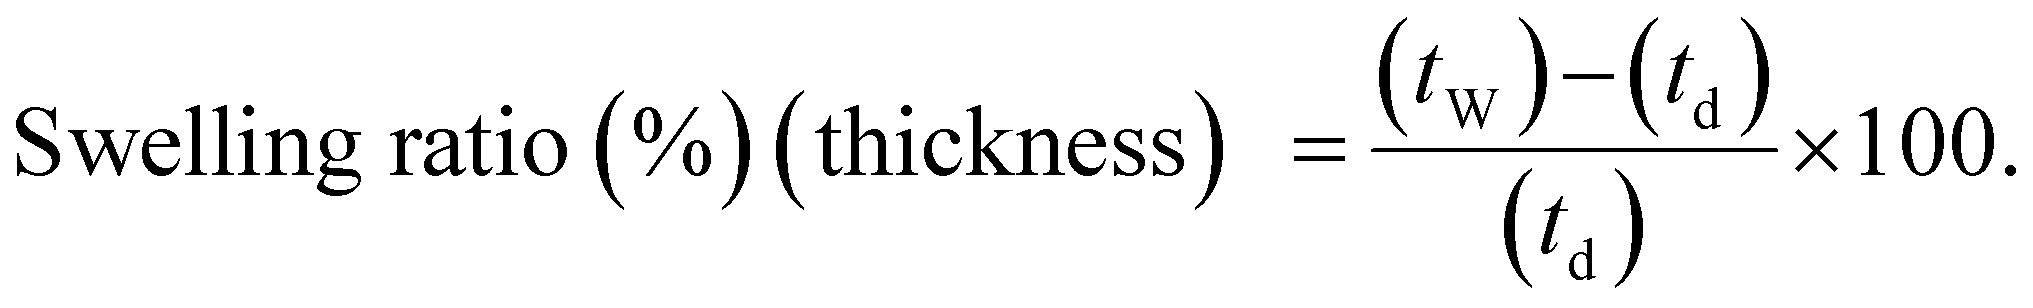
The swelling ratio of the membranes was also determined using eqn (8) and (9), where l, w and t represent the length, width, and thickness of the dry (d) and wet (w) membranes, respectively.77,80
 | (8) |
 | (9) |
2.7 Ion exchange capacity
The PEMs (1 cm × 1 cm) were immersed in 100 ml of 1 M NaCl for 24 hours and then titrated with 0.1 M NaOH. The IEC is calculated using eqn (10), where V, C and Wd represent the volume of NaOH, the concentration of NaOH and dry membrane weight, respectively:69,80,82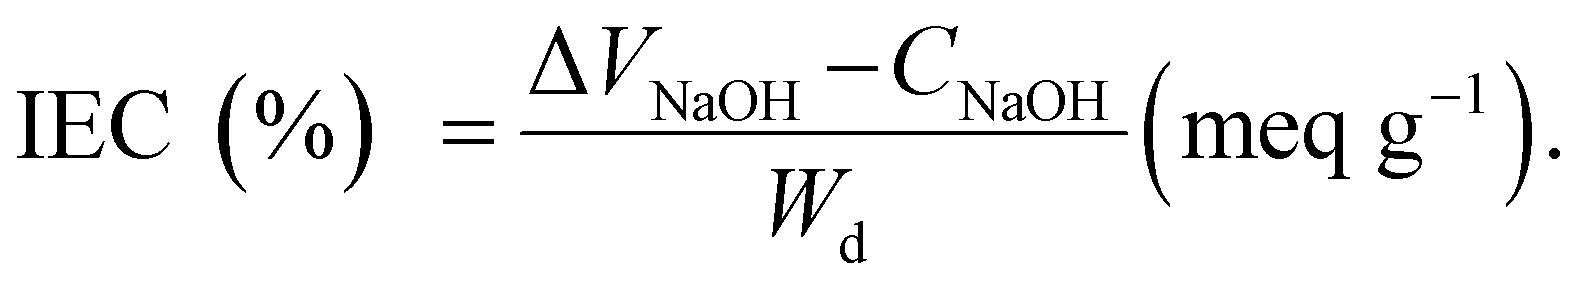 | (10) |
2.8 Proton conductivity
The proton conductivity and resistance of the membrane were determined using impedance spectroscopy. Generally, the conductivity of the membranes was measured at specific humidity and temperature. Eqn (11) shows how the proton conductivity (S cm−1) was calculated with R (Ω), A (cm2) and l (cm) representing the membrane resistance, area, and distance between the electrodes, respectively:75,80 | (11) |
3. Results and discussions
3.1 PEM fabrication
The freshly fabricated PEMs and NF-M are presented in Fig. 4(b)–(d) and (a), respectively. All the fabricated membranes (Fig. 4(b)–(d)) were brown colored after cross-linking with smooth surfaces with a rigid and brittle nature. The observed non-uniformity in some membranes in Fig. 4 was due to the moisture content introduced during the detachment of PEMs from the Teflon dishes because they were humidified to make them soft and flexible. An exception is NF-M, which is mainly transparent, as provided by the manufacturer. The cross-linking mechanisms of PVA, PVP, and SSA are discussed in Section 3.5. | ||
| Fig. 4 NF-M membrane (a) along with fresh PEMs of SSA-M (b), CT-M (c) and PB-M (d). Fabricated PEM parameters: matrix: PVA–PVP (1:1), cross-linker: SSA, cross-linking temperature (°C): 120, cross-linking time (hours): 3, drying temperature (°C): 40, drying time (hours): 24, and fillers: PB and CT. | ||
The color change from transparent to dark brown (Fig. S1a and b, ESI†) upon heating is evident in all synthesized PEMs irrespective of their constituents (Fig. 4(b)–(d)). This change was due to a decrease in the functional groups upon heating (Fig. 6(b)). Non-cross-linked SSA-M (Fig. 6(b)) had more functional groups due to the hydrophilic nature of the PVA–PVP polymer matrix used. However, heating initiated a cross-linking reaction and evaporated moisture, resulting in more rigid, brittle, and water-free PEMs, as observed in the cross-linked membranes, including SSA-M (Fig. 4(b) and 6(b)). Additionally, when SSA is added to the PVA–PVP, the carboxyl groups (–COOH) of SSA interact with the hydroxyl groups (–OH) of PVA–PVP, and heating favors this reaction, leading to a brownish color change as an indicator of successful PVA–PVP–SSA cross-linking (Fig. 13(e)).80,83
3.2 Characterization
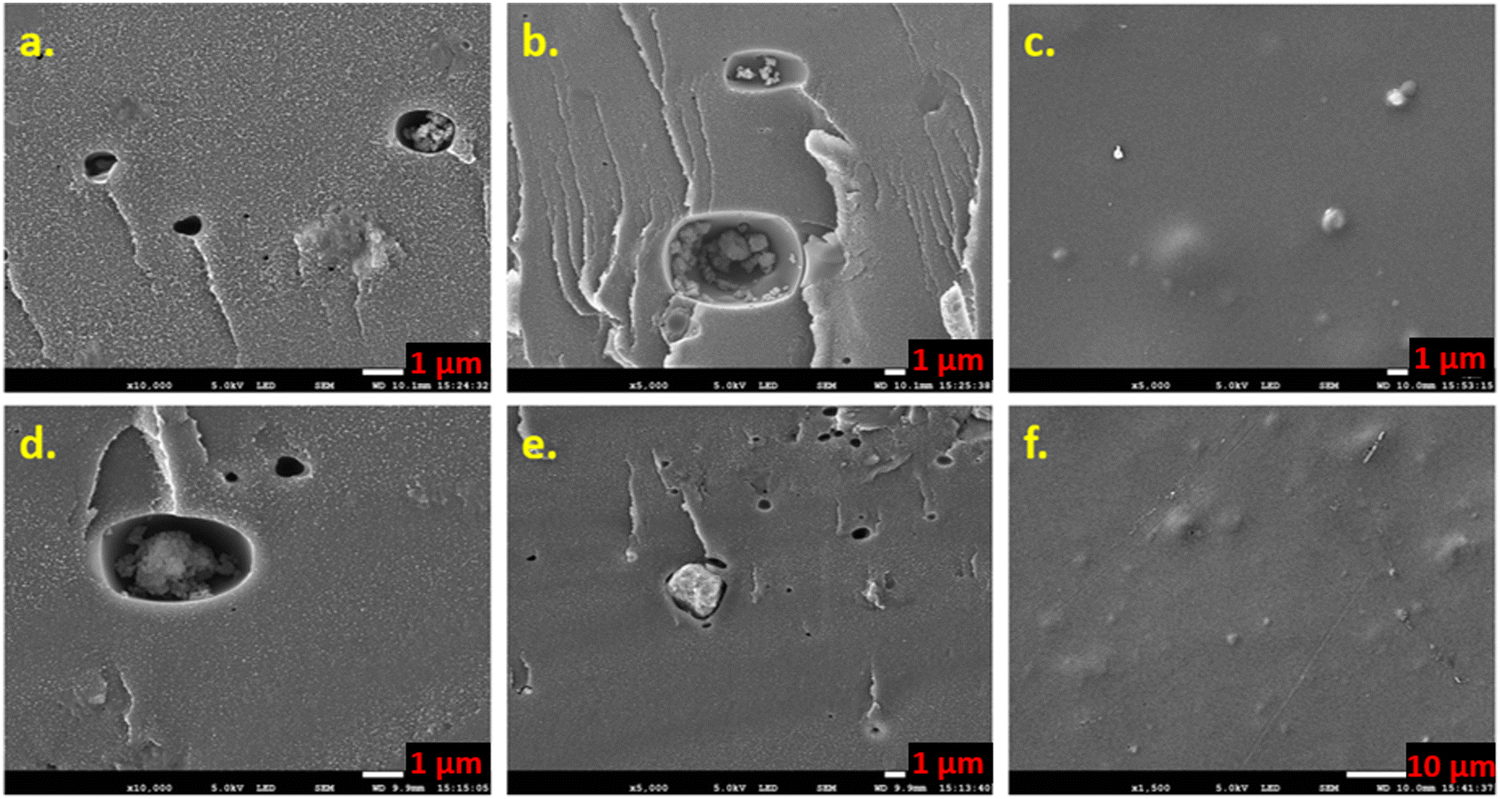 | ||
| Fig. 5 SEM images for the PB-M's cross-section (a) and (b) plus its surface (c) and the CT-M's cross-section (d) and (e) along with the surface (f) at resolutions of 1 μm and 10 μm. | ||
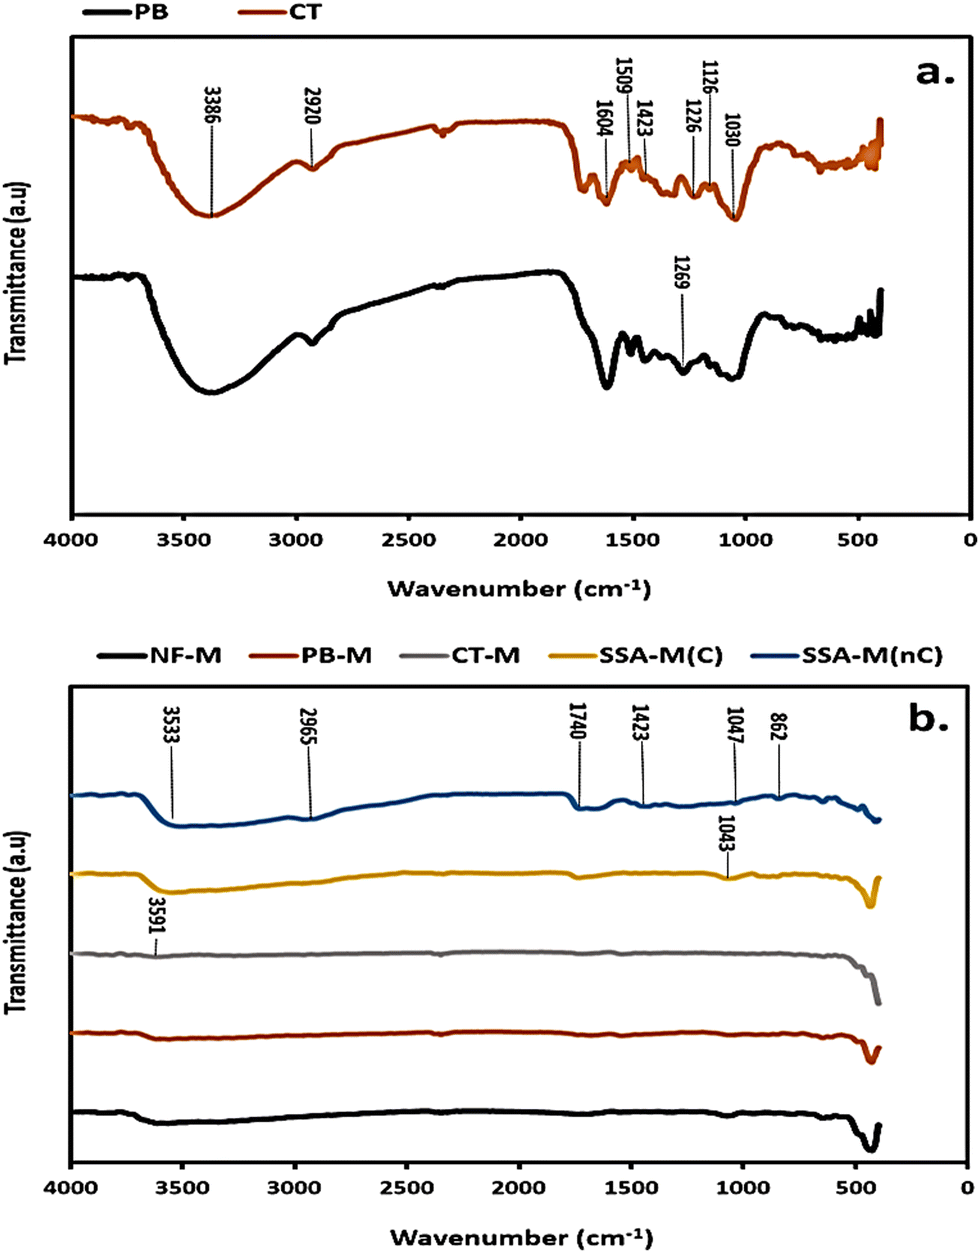 | ||
| Fig. 6 FT/IR spectra for (a) PB and CT powdered fillers and (b) the PEMs of NF-M, PB-M, CT-M, cross-linked PVA–PVP–SSA (SSA-M(C)) and non-cross-linked PVA–PVP–SSA (SSA-M(nC)). Experimental parameters: wave number range (cm−1): 400–4000, resolution (cm−1): 2, and sample holder: KBr crystals. | ||
Common bands in the PB and CT fillers (Fig. 6(a)) that were identified at the wavelengths of 3386, (2920 and 1126), 1604, 1509, 1423, and 1030 cm−1 correspond to O–H, C–H, C![[double bond, length as m-dash]](https://www.rsc.org/images/entities/char_e001.gif) O, CC and C–O stretching vibrations, respectively (Table S1, ESI†). Additionally, the bands in the PB and CT filler spectra (Fig. 6(a)) at wavelengths of 1269 and 1226 cm−1 can be referred to as CO and C–O (Table S1, ESI†), respectively. The observed bands from the FT/IR spectra are attributed to the hemicellulose, cellulose, and lignin contents that comprise hydroxyl (O–H), alkyl (C–H), alkene (CC), and ether (C–O) groups present in the fillers, such as PB.85 The FT/IR spectra for all the PEMs (Fig. 6(b)) compare the NF-M, cross-linked PB-M and CT-M, as well as the SSA-M before cross-linking (SSA-M(nC)) and after cross-linking (SSA-M(C)) at 120 °C for 3 hours. The spectra for all the cross-linked PEMs looked similar except for those of SSA-M(nC) that incurred more intense peaks as opposed to SSA-M(C), as illustrated in Fig. 6(b). The identified peaks of the PEMs include O–H at 3591, 3533, and 1423 cm−1; C–H at 2965 and 862 cm−1; C–O at 1043 and 1047 cm−1 and CO at 1740 cm−1 wavelength (Fig. 6(b)).
O, CC and C–O stretching vibrations, respectively (Table S1, ESI†). Additionally, the bands in the PB and CT filler spectra (Fig. 6(a)) at wavelengths of 1269 and 1226 cm−1 can be referred to as CO and C–O (Table S1, ESI†), respectively. The observed bands from the FT/IR spectra are attributed to the hemicellulose, cellulose, and lignin contents that comprise hydroxyl (O–H), alkyl (C–H), alkene (CC), and ether (C–O) groups present in the fillers, such as PB.85 The FT/IR spectra for all the PEMs (Fig. 6(b)) compare the NF-M, cross-linked PB-M and CT-M, as well as the SSA-M before cross-linking (SSA-M(nC)) and after cross-linking (SSA-M(C)) at 120 °C for 3 hours. The spectra for all the cross-linked PEMs looked similar except for those of SSA-M(nC) that incurred more intense peaks as opposed to SSA-M(C), as illustrated in Fig. 6(b). The identified peaks of the PEMs include O–H at 3591, 3533, and 1423 cm−1; C–H at 2965 and 862 cm−1; C–O at 1043 and 1047 cm−1 and CO at 1740 cm−1 wavelength (Fig. 6(b)).
Therefore, the various functional groups, such as the broad O–H group, indicate a good adsorption capacity, especially in the PB filler (Fig. 6(a)) with larger O–H stretching.86 All the bands identified in fillers are evident in PEMs, including SSA-M(nC); however, upon the application of heat to form SSA-M(C) (Fig. 6(b)), water was eliminated, thus affecting and weakening the hydrogen bonding from the O–H group of PVA–PVP matrix as well as decreasing the hydrophilicity along with forming compact bands.80,85 The –SO3 stretching is usually in the range of 1100–1250 cm−1, but in SSA-M(C) (Fig. 6(b)), it may have overlapped with other groups or became compact upon cross-linking in the rest of the PEMs.80,85 The intensities of the PB filler's peaks are greater than those of the CT filler, so this implies better properties comparatively (Fig. 6(a)). However, because the PVA–PVP–SSA matrix was largely dominant in all the fabricated PEMs, which exhibited cross-linking at 120 °C, the distinctions in their peaks seemed almost similar except for SSA-M(nC) (Fig. 6(b)). Therefore, additional analyses, such as SEM-EDX, water adsorption isotherms, proton conductivity, WU, and SR, supplemented these results.
3.3 Water physisorption isotherms
Adsorption is a process that involves the transfer and accumulation of adsorptive molecules (atoms, molecules, or ions) into the interfacial layer; hence, it can be either physical (physisorption) or chemical (chemisorption).87–89 Therefore, adsorption (physisorption) isotherms were used to determine the amount of the adsorbate (water vapor) that had been adsorbed on the surface of the adsorbent (PEMs) against the relative pressure (P/P0), where P and P0 represent absolute and saturated pressure, respectively.79 According to the IUPAC, there are about 6 general classifications of isotherms, including type I–VI (Table S2, ESI†).79,87 The isotherm types listed in Table S2 (ESI†) are associated with microporous (type I), non-porous or macroporous (types II, III and VI), and mesoporous (types IV and V).89 Typically, the identification of the isotherm type indicates the nature of the adsorption process.89Fig. 7 shows the water vapor adsorption isotherm results for the PEMs of NF-M (Fig. 7(a)), SSA-M (Fig. 7(b)), PB-M (Fig. 7(c)) and CT-M (Fig. 7(d)). Table S2 (ESI†) illustrates a reference for interpreting the results. As shown in Fig. 7, curves for all the PEMs almost resemble each other, with the relative pressure (P/P0) ranging between 0.2 and 1. However, around P/P0 = 1, the adsorption values of NF-M, SSA-M, PB-M and CT-M were 0.1522, 0.5454, 0.5760 and 0.1835 g g−1, respectively. PB-M demonstrated a higher water vapor adsorption capacity compared to all other PEMs due to the materials (filler) used in its fabrication. All the curves in Fig. 7 are identified as type III based on the IUPAC classification (Table S2, ESI†).79,89 Accordingly, the implication is that the interaction between the adsorbate and adsorbent particles was weak, and the adsorbed molecules were clustered around the favorable sites of the surface instead of forming a monolayer (Table S2, ESI†).
 | ||
| Fig. 7 Water vapor adsorption isotherm profiles of the PEMs: (a) NF-M, (b) SSA-M, (c) PB-M and (d) CT-M. Experimental parameters: relative pressure range (P/P0): 0.1–1, water vapor adsorption temperature (°C) = 25, PEMs pre-heating temperature (°C) = 120, pre-heating condition: vacuum, and adsorption range (g g−1): 0.00274–0.545. | ||
These results can be further supported by similar studies that were previously conducted. Furthermore, curves similar to those shown in Fig. 7 were obtained in a PVA/montmorillonite nanocomposite study by Sapalidis et al.,90 and the shape was associated with hydrophilic materials. Generally, increased water adsorption leads to swelling and a subsequent decrease in mechanical strength, but the absence of water minimizes the conductivity of the membrane.81,91 Therefore, water adsorption is necessary to aid the conductivity of the membrane; hence, the performance of the system is influenced by both the conductivity and strength of the membrane.91 Typically, the PVA–PVP matrix and filler blends interpenetrate and elevate the hydrophilic behavior of the matrix, thereby influencing swelling.81 Moreover, the fillers become dispersed within the interpenetrating PVA–PVP matrix, and they can exhibit various adsorption isotherms based on their nature, porosity, composition, and application state.81,91,92
Fig. S3 (ESI†) presents the IEC, mass-change-based WU and thickness-related SR. The difference in the WU and SR between the synthesized PEMs and NF-M is due to the microstructure of the polymers and the less hydrophobic aromatic groups within the backbone of the PEMs polymer than the perfluorinated backbone of NF-M.93 The fluorocarbon membranes, such as NF, have uniform and effective water channels, high thermal and chemical stability, and proton conductivity due to the acidic and sulfonic group-bearing tetrafluoroethylene backbone; therefore, irrespective of their low water uptake, they show excellent electrical properties.8 The PB filler's addition positively improved the membrane's WU, SR, and IEC (Fig. S3, ESI†) in contrast to CT-M. The CT filler (Fig. 6(a)) contained functional groups that possibly facilitated proton conduction, but they decreased within the membrane's matrix (Fig. 6(b)), thus limiting the membrane's internal proton transfer.94 The low WU and SR for CT-M are associated with the presence of less hydrophilic waxy or oily materials that can become the effective transport barrier, whereas the high IEC to SSA-M is related to membrane stability as well as terminal and internal functional group orientation.33–35,93
Rosli et al.27 demonstrated that IEC indicates active sites that are accountable for proton conduction in PEMs. The results verified that SSA-M exhibited good WU due to the sulfonic acid groups in the polymer matrix backbone, making it better than CT-M. However, this may also imply mechanical and chemical instability.94,95 Although IEC can indirectly predict proton conduction because it is associated with ion exchangeable groups, it has limitations because of the differences in surface functional groups and the transport mechanisms involved.94 High IEC does not automatically imply high WU, so selecting PEMs for specific applications should consider various properties, such as terminal functional groups and water transport mechanisms (Fig. 6).9,93 Even though a high IEC may suggest increased conductivity, it also indicates membrane swelling and a subsequent decrease in mechanical stability. Therefore, for optimal performance of the PEM, high chemical and mechanical stability along with low swelling are essential.95 Although high WU is necessary, the membrane must be strong to avoid mechanical failure.95 Therefore, incorporating PB filler resulted in a mechanically stable membrane with good WU, SR and IEC in contrast to the CT filler. Some mechanical properties, gel fraction (GF), and biofilter properties of the PEMs are highlighted in the ESI.†
3.4 Electrochemical experiments
Because the power necessary for electrolysis depends on both current and voltage, the performance of the membranes during H2 production was assessed based on the current produced at a constant voltage.96 Typically, the participation of PEMs in proton conduction leads to electron production and electricity generation.57,96 The results of electrochemical experiments to determine the effectiveness of the membranes during H2 production are presented in Fig. 8.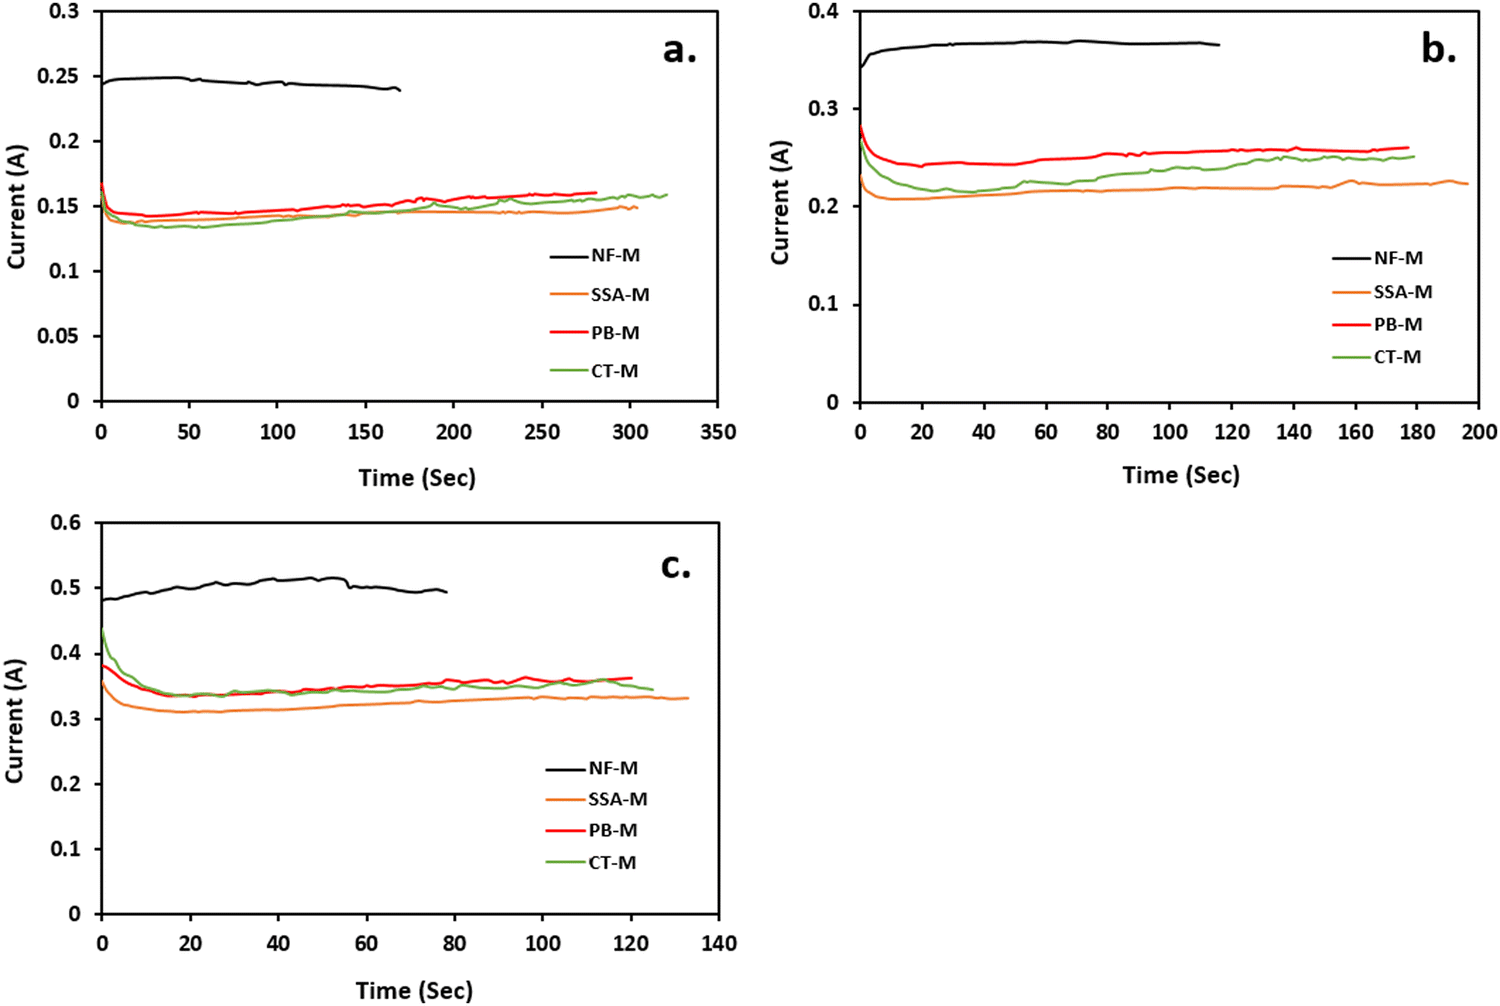 | ||
| Fig. 8 Hydrogen generation from water electrolysis at voltages of (a) 6.5 V, (b) 8 V and (c) 10 V in the presence of PEMs (NF-M, SSA-M, PB-M and CT-M). Experimental parameters: produced H2 volume (mL) = 4.77, and temperature (°C) = 25; reactor: electrolyzer; power source: DC power supply; average reaction time range (seconds): 70–321; reaction medium: DI water (100 mL); pH: 7; voltages (V): 6.5, 8, and 10; average current range (A): 0.2–0.5; and electrolyte: PEMs (NF-M, SSA-M, PB-M and CT-M). | ||
A similar volume of H2 (4.77 mL) was produced by applying three voltages of 6.5 V (Fig. 8(a)), 8 V (Fig. 8(b)) and 10 V (Fig. 8(c)). Voltage versus current graphs were plotted to demonstrate the performance of each PEM. As shown in Fig. 8, NF-M exhibited the highest current, followed by PB-M, CT-M and SSA-M in all the applied voltages. Moreover, NF-M is known for its superior performance in H2 generation, and PB-M and CT-M showed improved performance compared to pure SSA-M without any fillers. These results verify that the inclusion of a filler enhances the H2 production. This observation is further validated by the presence of functional groups, such as the O–H group (Fig. 6), along with the adsorption isotherm results, where PB demonstrated greater water adsorption capacity (Fig. 7).
These results are further supported by faradaic efficiency (ηE) in which H2 production was carried out in replicates and efficiency was calculated using eqn (4)–(6). The average efficiency is depicted in Fig. 9. Therefore, ηE was very high, ranging from 82.8 ± 1.9% to 94.9 ± 1.3% for all the membranes. As expected, the NF-M exhibited the highest ηE values. However, PB-M and CT-M showed some variations in efficiencies compared to SSA-M. At 6.5 V, the efficiency of PB-M (88.9 ± 1.6%) was second to that of NF-M (91.6 ± 0.4%), with SSA-M and CT-M having the respective efficiencies of 83.6 ± 2.3% and 82.8 ± 1.9%, respectively. This result may be due to the reduced losses of PB-M at a lower voltage. At 8 V, the ηE values of SSA-M and CT-M were 85.8 ± 2.5% and 86.2 ± 1.5%, respectively, whereas that of PB-M was slightly lower (84.4 ± 0.4%). The ηE values of SSA-M, PB-M and CT-M at 10 V were 86.2 ± 1.4%, 83.7 ± 2.6% and 85.1 ± 0.6%, respectively, indicating that the presence of the fillers slightly reduced the efficiency. This is due to losses involved, such as bubble production, which increases resistance, therefore limiting production and consequently efficiency.5,74 High voltage (10 V) results in increased current and rapid bubble production, which in turn limits the contact area between water and electrodes along with PEM.5 NF-M's efficiency at 10 V may have increased due to the stability of the membrane and high gas permeability.7,30 The gas bubbles increase from the electrodes to the top of the gas collection tubes during electrolysis, where H2 and O2 are collected in the respective gas tubes of the cathode and anode (Fig. 1 and 3), respectively. A physical proof of the presence of hydrogen and oxygen was confirmed using the glowing splint and a lighted splint method, respectively.97 Additional tests on the chemical purity of the generated gases were omitted due to the common construction of the electrolyzer and electrodes.
 | ||
| Fig. 9 Faradaic efficiency of the PEMs (NF-M, SSA-M, PB-M and CT-M). Experimental parameters: produced H2 volume (mL) = 4.77; reactor: electrolyzer; power source: DC power supply; temperature (°C) = 25; average reaction time range (seconds): 70–321; reaction medium: DI water (100 mL); pH: 7; voltages (V): 6.5, 8, and 10; average current (A): 0.2–0.5; and electrolyte: PEMs (NF-M, SSA-M, PB-M and CT-M). | ||
Because faradaic efficiency is a quantitative analysis associated with the electrons transported via the external circuit during an electrochemical reaction (such as oxygen or hydrogen evolution reactions), it can be affected by various factors, such as a high current. A high current reduces efficiency due to increased gas production, thus implying bubble formation.67 The ionic composition of the solution also affected faradaic efficiency. Another study indicated that the faradaic efficiency for chloride solution was higher due to increased conductivity and the prevention of anode passivation.98,99 In natural systems, inorganic and organic ions may lead to electrode passivation, thereby affecting faradaic efficiency.99 According to van Genuchtena et al.,99 faradaic efficiency is significantly independent of the current density but dependent on the type of anion in the solution and pH because it determines the ion content of the solution.
 | ||
| Fig. 10 Current sweep upon application of various voltages during water electrolysis in the presence of the PEMs (a) NF-M, (b) SSA-M, (c) PB-M and (d) CT-M. Experimental parameters: reactor: electrolyzer, power source: DC power supply, reaction medium: DI water (100 mL), pH: 7, temperature (°C) = 25, voltages (V): 0–10, average current range (A): 0–0.46, and electrolyte: PEMs (NF-M, SSA-M, PB-M and CT-M). | ||
The WE experiment was conducted in the presence of all the membranes, resulting in the initial current generation ranging from 2 to 2.5 V. All the PEMs, including the SSA-M, were active from 2 V, while NF-M became active at 2.5 V (Fig. 10) due to the hydrophilic PVA–PVP polymers used (Fig. 7). Clearly, NF-M released the least current in contrast to the other PEMs due to its lower water adsorption capacity and greater thickness compared to the synthesized PEMs, which may have affected the charge or discharge voltage (Fig. 7(a)).101 Additionally, room temperature may have affected the initial current sweep of the PEMs (NF-M).30 Typically, the operating temperature for PEMs is 60–120 °C, while that of NF-M in H2 production is 80 °C.27 Moreover, the perfluorinated tetrafluoroethylene backbone of Nafion is known for its low water uptake.8
3.5 Proton conductivity
The proton conductivity was measured under conditions close to saturated RH with NF-M outperforming all other PEMs, followed by PB-M, SSA-M and CT-M. The respective maximum proton conductivities of NF-M, PB-M, SSA-M and CT-M were 23.94, 1.33, 0.48 and 0.46 mS cm−1, respectively (Fig. 11(b)). Among the fabricated PEMs, PB-M exhibited higher conductivity than the other membranes. This is consistent with the water adsorption, FT/IR and H2 production results. For comparison, the various PEMs from other studies are shown in Table S3 (ESI†). There are some differences in the values of proton conductivities, and they depend on the materials used to fabricate the PEMs (such as filler incorporation), their quantities and the PEM fabrication conditions. | ||
| Fig. 11 The PEM proton conductivity (a) and the maximum proton conductivity chart of the various PEMs (b). Experimental parameters: PEMs: (NF-M, SSA-M, PB-M and CT-M); relative humidity (%): 20.1–96.1%; pressure (ambient): 1 atm; gas: nitrogen; gas flow rate (cm3 per minute): 300; temperature (°C): 40–50; and proton conductivity range (mS cm−1): 0.00003–23.94. | ||
Typically, proton conduction within a material is based on two mechanisms: Grotthuss and vehicle (vehicular) mechanisms (Fig. 12).102–105 The Grotthuss (proton-hopping) mechanism involves the transfer of protons from one proton-conducting site (hydrolyzed ionic site; SO3−, and H3O+) to another or within adjacent ion clusters (Fig. 12(a)).10,101,102,106 The vehicle mechanism (Fig. 12(b)) is attributed to the transfer of protons through the diffusion of free water molecules that forms H3O+ complexes, thereby diffusing intact.91,104 Additionally, the H+ movement through membrane pores is mainly via vehicular movement, and it is either influenced by the electric field (electroosmotic drag) or occurs within self-associated water (Fig. 12(b)-(i) and (ii)).104 Molecules that participate in proton transfer via the vehicle mechanism include –SO3H/SO3− as well as complexes, such as H3O+ and H5O2+, with a typical representation shown in Fig. 12(b)-(iii).91,102,104,106
 | ||
| Fig. 12 Proton conduction mechanisms (Grotthuss mechanism (a) and vehicle mechanism (b)) within the PEMs during electrolysis. | ||
In this study, the weak interactions between adsorbates and adsorbents (Table S2, ESI† and Fig. 7) suggested that the primary mechanism, followed by the PEMs, was the vehicle mechanism (Fig. 12(b)). For optimal performance, a PEM should possess high ion exchange capacity, good mechanical and chemical stability, increased perm-selectivity, and resistance to organic fouling.107 The presence of diverse functional groups is responsible for proton conductivity (Fig. 6). Again, the hydrophilic properties of the materials facilitate the adsorption of water particles, leading to the membrane's swelling. However, excessive swelling indicates low mechanical strength, which can be addressed using fillers to maintain the stability of PEMs.81,91,107 Nevertheless, the fabricated membranes in this study exhibited effective water adsorption (Fig. 7) due to hydrophilic (–SO3H) and carboxylic groups (–COOH) linking the PVA–PVP molecules (Fig. 6), thus aiding the proton conduction. In addition, the functional groups available in fillers play a significant role in proton conduction depending on its nature and properties.108
These results are associated with other studies on fabricated PEMs (ESI,† Section 5.1).28,94,101,102,109–112 Proton conductivity depends on the PEM type, preparation method, and measurement conditions; however, NF-M showed the best performance in both the current and reference studies. Furthermore, the PVA–PVP-based PEMs fabricated in this study demonstrated significant proton conduction enhancement based on the chemical modifications.112 The chemical structures and formulas of all the used polymers and blends are PVA, PVP, SSA, cross-linked PVA–SSA and PVA–PVP–SSA, as illustrated in Fig. 13, while that of Nafion is shown in Fig. S4 (ESI†).28,113–117 Accordingly, these structures are aligned with the chemical content of the polymers, as shown by the FT/IR results (Fig. 6), and they also indicate modifications resulting from cross-linking. The structures of the phenolic compounds extracted from the PB filler (Section 1) are shown in the ESI† (Fig. S5) along with the intrinsic properties of the CT filler (ESI,† Fig. S6).38 The main content of CT filler is C-lignin, which is a naturally occurring, homogeneous linear biopolymer that is strongly acid-resistant.118 The performance of the PEM is affected by the chemical deterioration caused by the generated ROS, such as radicals.112
 | ||
| Fig. 13 Chemical structures of (a) PVA, (b) PVP, (c) SSA, cross-linked PVA–SSA (d) and PVA–PVP–SSA (e). | ||
Although the hygroscopic fillers improve water retention properties, there is a possibility of low proton conductivity upon the incorporation of hygroscopic fillers due to little compatibility with the matrix that affects the mechanical and physical properties of the PEM.101 However, background water conditions and membrane thickness greatly influence the proton conductivity because the reduced thickness implies high proton conductivity.101,119 Proton conductivity can be improved by mixed polymer matrix blending, nanocomposite preparation, and adjustment of the internal structure of PEMs by incorporating organic and inorganic fillers.98
Generally, the contents of lignin and cellulose materials, for instance, contribute to improved properties of PB-M contrary to CT-M, whose raw filler is not strong like PB.32 In this study, the faradaic efficiency of fabricated PEMs ranged from 82.8 ± 1.9% to 88.9 ± 1.6%, therefore indicating the positive effect of the PEMs. Moreover, PB filler exhibited the best compatibility with the matrix, thus resulting in the highest values for WU, SR, IEC, proton conductivity, GF and H2 generation. The high IEC (4.1 meq g−1) of the PB denoted the ion exchangeable active sites for proton conduction, which enhanced proton transport within the membrane. The IEC of PB was relatively higher compared to that of other studies (Table S3, ESI†), and its WU was around 100%, while the SR of the fabricated PEMs ranged from 22.1 to 34.4%, where PB-M showed the best performance. The generally low SR (less than 50%) indicates that these fabricated PEMs had chemical and mechanical stability, especially the PB-M. Moreover, commercial fillers are usually used for the application of PEMs, but in this study, the PB filler used is cost-effective because it is a biomass-derived product that can be obtained from pine trees that are widespread globally. The economics of the PEMs (ESI,† Table S7) indicated that the fabricated PEMs cost less than the commercial NF-M. Therefore, the fabricated PEMs, especially PB-M, can be used as affordable alternatives to NF-M during electrolysis and other membrane applications. However, future research should explore more alternative fillers along with electrolyzers that can further minimize the cost of electrolysis.
4. Conclusions
Affordable fillers were utilized to fabricate PEMs for H2 production via electrolysis. The filler containing cavities and bumps was apparent on the cross-sectional and surface morphology of PEMs (PB-M and CT-M) from SEM analysis, implying excellent dispersion of the filler within the PEMs. Additionally, the dominance of the O–H group and other functional groups in the fabricated PEMs, particularly in PB-M, verifies that fillers availed these functional groups, hence aiding proton conductivity due to their good water adsorption capacity. Water adsorption was highest in the PB membrane, and the PEMs followed the type III adsorption isotherm, implying weak adsorbate and adsorbent interactions. NF-M exhibited the highest faradaic efficiency when voltages of 6.5 V, 8 V, and 10 V were applied, while the fabricated PEMs exhibited an efficiency ranging from 82.8 ± 1.9% to 88.9 ± 1.6%. Generally, more H2 was produced from NF-M, followed by PB-M, CT-M, and SSA-M, but the efficiency was affected at a higher voltage due to losses, such as bubbles, particularly in the fabricated PEMs. The proton conductivity of the fabricated PEMs ranged from 0.46 to 23.94 mS cm−1. Although the NF-M proton conductivity (23.94 mS cm−1) exceeded that of the fabricated PEMs, the PEMs generally exhibited good conductivity, so they can potentially be used for H2 production. Furthermore, the current was generated within the voltage range of 2–2.5 V, indicating proton conduction commenced at these voltages. Other influencing factors include the compatibility of filler within the polymer matrix backbone (because it facilitates proton transport on the surface and within the PEM), chemical and mechanical stability, operating conditions, such as pH, the ion content of the solution, and generation of reactive oxygen species, such as radicals, which in turn affect the proton conductivity and the faradaic efficiency, thus influencing the performance of PEMs. Excluding commercial NF-M, PB-M showed the best properties, including WU (133%), SR (34.4%), IEC (4.1 meq g−1), GF (81.7%) and proton conductivity (1.33 mS cm−1), so it is highly recommended for H2 production via electrolysis. Moreover, the presence of materials, such as lignin and cellulose, in the PB filler may have led to improved characteristics, such as compatibility, compared to the CT filler, whose shell stems are not as strong as the PB filler. In this study, H2 gas was successfully generated from water as a renewable gas, with potential applications in various fields. This research introduces cost-effective PEMs as an alternative to expensive and scarce commercially available NF membranes. Future research is needed to explore various materials that can be used as fillers for affordable PEMs and their stability during electrolysis.Abbreviations
| PEM | Polymer electrolyte membrane |
| PEMs | Polymer electrolyte membranes |
| SSA | Sulfosuccinic acid |
| PVA | Polyvinyl alcohol |
| PVP | Polyvinyl pyrrolidone |
| PB | Pine bark |
| CTT | Chinese tallow tree |
| CTTs | Chinese tallow trees |
| CT | Chinese tallow tree seed capsules |
| NF | Nafion™ |
| NF-M | Nafion™ 115 membrane |
| SSA-M | Polymer electrolyte membrane (polyvinyl alcohol + polyvinyl pyrrolidone + sulfosuccinic acid membrane) |
| PB-M | Polymer electrolyte membrane (polyvinyl alcohol + polyvinyl pyrrolidone + sulfosuccinic acid + pine bark filler) |
| CT-M | Polymer electrolyte membrane (polyvinyl alcohol + polyvinyl pyrrolidone + sulfosuccinic acid + Chinese tallow seed capsule filler) |
| WE | Water electrolysis |
| PAA-PMA | Poly(acrylic acid-co-maleic acid) |
| PSSA-PMA | Poly(styrene sulfonic acid-co-maleic acid) |
| GT | Glutaraldehyde |
| PES | Polyethersulfone |
| NMPC/PVA | N-Methylene phosphonic chitosan and poly(vinyl alcohol) |
| MMMs | Mixed matrix membranes (MMMs) |
| ML | Maple leaves |
| SPEEK | Sulphonated poly(ether–ether–ketone) |
| ZSM-5 | Zeolite Socony Mobil-5 |
| MCM-41 | Mobil composition of matter-41 |
| TMPS | Trimethoxy(2-Phenylethyl)silane |
| AC | Activated carbon |
| AE | Alkaline electrolyzer |
| SOE | Solid oxide electrolyzers |
| DI | Deionized water |
| RPM | Revolution per minute |
| wt% | Weight percent |
| DC | Direct current |
| SEM-EDX | Scanning electron microscope with energy dispersive X-ray detector |
| FT/IR | Fourier-transform infrared spectroscopy |
| KBr | Potassium bromide |
| TGA | Thermogravimetric |
| WU | Water uptake |
| IEC | Ion exchange capacity |
| SR | Swelling ratio |
| GF | Gel fraction |
| IUPAC | International union of pure and applied chemistry |
| ROS | Reactive oxygen species |
Author contributions
Relebohile Mokete: conceptualization, investigation, methodology, writing – original draft, visualization, formal analysis; František Mikšík: conceptualization, project administration, methodology, validation, writing – review & editing, software; supervision, formal analysis; Roman Selyanchyn: conceptualization, project administration, methodology, validation, writing – review & editing, supervision, formal analysis; Nobuo Takata: resources, methodology; Kyaw Thu: conceptualization, project administration, validation, writing – review & editing, supervision, formal analysis; Takahiko Miyazaki: conceptualization, project administration; resources, validation, writing – review & editing, supervision, formal analysis, funding acquisition.Conflicts of interest
There are no conflicts of interest to declare.Acknowledgements
The authors are indebted to the Thermal Energy Conversion Systems Laboratory (TECSL), Kyushu University in Fukuoka, Japan, for the support and encouragement to ensure the successful completion of this research. The Monbukagakusho (MEXT) is acknowledged for the financial contribution towards this research. A heartfelt gratitude to the main laboratory professor, Dr Takahiko Miyazaki and his team for their unwavering supervision and dedication to provide necessary resources for this research work. A sincere appreciation to the editorial team and referees for their constructive comments that positively contributed to the improvement of this article.References
- C. Lamy, T. Jaubert, S. Baranton and C. Coutanceau, Clean hydrogen generation through the electrocatalytic oxidation of ethanol in a Proton Exchange Membrane Electrolysis Cell (PEMEC): Effect of the nature and structure of the catalytic anode, J. Power Sources, 2014, 245, 927–936 CrossRef CAS.
- M. N. Uddin, V. V. Nageshkar and R. Asmatulu, Improving water-splitting efficiency of water electrolysis process via highly conductive nanomaterials at lower voltages, Energy, Ecol. Environ., 2020, 5(2), 108–117 CrossRef.
- S. S. Sekhon, J. Lee and J. Park, Biomass-derived bifunctional electrocatalysts for oxygen reduction and evolution reaction: A review, J. Energy Chem., 2022, 65, 149–172 CrossRef CAS.
- K. Bareisa, C. Rua, M. Mockl and T. Hamacher, Life cycle assessment of hydrogen from proton exchange membrane water electrolysis in future energy systems, Appl. Energy, 2019, 237, 862–872 CrossRef.
- D. M. F. Santos, C. A. C. Sequeira and J. L. Figueiredo, Hydrogen Production by Water Electrolysis, Quim. Nova, 2013, 36, 1176–1193 CrossRef CAS.
- B. Ghorbani, S. Zendehboudi and M. Moradi, Development of an integrated structure of hydrogen and oxygen liquefaction cycle using wind turbines, Kalina power generation cycle, and electrolyzer, Energy, 2021, 221, 119653 CrossRef CAS.
- J. E. Park, J. Kim, J. Han, K. Kim, S. Park, S. Kim, H. S. Park, Y. Cho, J. Lee and Y. Sung, High-performance proton-exchange membrane water electrolysis using a sulfonated poly(arylene ether sulfone) membrane and ionomer, J. Membr. Sci., 2021, 620, 118871 CrossRef CAS.
- D. J. Kim, M. J. Jo and S. Y. Nam, A review of polymer-nanocomposite electrolyte membranes for fuel cell application, J. Ind. Eng. Chem., 2015, 21, 36–52 CrossRef CAS.
- K. Charradi, Z. Ahmed, R. E. Cid, P. Aranda, E. Ruiz-Hitzky, P. Ocon and R. Chtourou, Amelioration of PEMFC performance at high temperature by incorporation of nanofiller (sepiolite/layered double hydroxide) in Nafion membrane, Int. J. Hydrogen Energy, 2019, 44, 10666–10676 CrossRef CAS.
- V. E. Sizov, V. V. Zefirov, S. S. Abramchuk, A. A. Korlyukov, M. S. Kondratenko, V. G. Vasil’ev and M. O. Gallyamov, Composite Nafion-based membranes with nanosized tungsten oxides prepared in supercritical carbon dioxide, J. Membr. Sci., 2020, 609, 118244 CrossRef CAS.
- W. Y. Hsu and T. D. Gierke, Ion transport and clustering in nafionperfluorinated membranes, J. Membr. Sci., 1983, 13, 307–326 CrossRef CAS.
- J. Han, K. Kim, J. Kim, S. Kim, S. Choi, H. Lee, J. Kim, T. Kim, Y. Sung and J. Lee, Cross-linked highly sulfonated poly(arylene ether sulfone) membranes prepared by in-situ casting and thiol-ene click reaction for fuel cell application, J. Membr. Sci., 2019, 579, 70–78 CrossRef CAS.
- S. Siracusano, V. Baglio, F. Lufrano, P. Staiti and A. S. Aricò, Electrochemical characterization of a PEM water electrolyzer based on a sulfonated polysulfone membrane, J. Membr. Sci., 2013, 448, 209–214 CrossRef CAS.
- E. Troni, A. Donnadio, M. Pica, A. Carbone, I. Gatto and M. Casciola, Crystallite formation effect on the physicochemical properties of SPEEK membranes for fuel cell application, Int. J. Hydrogen Energy, 2018, 10, 5175–5183 CrossRef.
- A. Abdolmaleki, K. Eskandari and M. R. Molavian, Sulfonated or phosphonated membranes? DFT investigation of proton exchange in poly(oxadiazole) membranes, Polymer, 2016, 87, 181–193 CrossRef CAS.
- E. Córdova-Mateo, O. Bertran, C. A. Ferreira and C. Alema, Transport of hydronium ions inside poly(styrene-co-divinyl benzene) cation exchange membranes, J. Membr. Sci., 2013, 428, 393–402 CrossRef.
- R. K. Singh, T. Tsuneda, K. Miyatake and M. Watanabe, Theoretical investigation of local proton conductance in the proton exchange membranes, Chem. Phys. Lett., 2014, 608, 11–16 CrossRef CAS.
- Q. Wang, N. S. Suraweera, D. J. Keffer, S. Deng and J. Mays, Atomistic and Coarse-Grained Molecular Dynamics Simulation of a Cross-Linked Sulfonated Poly(1,3-cyclohexadiene)-Based Proton Exchange Membrane, Macromolecules, 2012, 45, 6669–6685 CrossRef CAS.
- N. Shaari and S. K. Kamarudin, Recent advances in additive-enhanced polymer electrolyte membrane properties in fuel cell applications: An overview, Int. J. Energy Res., 2019, 43, 2756–2794 CrossRef CAS.
- C. Y. Wong, W. Y. Wong, K. S. Loh, W. R. W. Daud, K. L. Lim, M. Khalid and R. Walvekar, Development of Poly(Vinyl Alcohol)-Based Polymers as Proton Exchange Membranes and Challenges in Fuel Cell Application: A Review, Polym. Rev., 2020, 60(1), 171–202 CrossRef CAS.
- J. Salehi Artimani, M. Arjomand, M. Enhessari and M. Javanbakht, Proton Conducting Nanocomposite Membranes Based on Poly Vinyl Alcohol (PVA)/Glutaraldehyde (GA) for Proton Exchange Membrane Fuel Cells, Iran. J. Chem. Chem. Eng., 2021, 40, 69–82 CAS.
- C. Yang, W. Chien and Y. J. Li, Direct methanol fuel cell based on poly(vinyl alcohol)/titanium oxide nanotubes/poly(styrene sulfonic acid) (PVA/nt-TiO2/PSSA) composite polymer membrane, J. Power Sources, 2010, 195, 3407–3415 CrossRef CAS.
- Y. Ye, J. Rick and B. Hwang, Water Soluble Polymers as Proton Exchange Membranes for Fuel Cells, Polymers, 2012, 4, 913–963 CrossRef CAS.
- J. Rhim, H. Hwang, D. Kim, H. Park, C. Lee, Y. Lee and G. Moon, S. Nam. Aging effect of poly(vinyl alcohol) membranes crosslinked with poly(acrylic acid-co-maleic acid), Macromol. Res., 2005, 13, 135–140 CrossRef CAS.
- R. V. Gadhave, P. A. Mahanwar and P. T. Gadekar, Effect of glutaraldehyde on thermal and mechanical properties of starch and polyvinyl alcohol blends, Des. Monomers Polym., 2019, 22, 164–170 CrossRef CAS PubMed.
- Y. Dai, J. Wang, P. Tao and R. He, Various hydrophilic carbon dots doped high temperature proton exchange composite membranes based on polyvinylpyrrolidone and polyethersulfone, J. Colloid Interface Sci., 2019, 553, 503–511 CrossRef CAS.
- N. A. H. Rosli, K. S. Loh, W. Y. Wong, T. K. Lee and A. Ahmad, Hybrid Composite Membrane of Phosphorylated Chitosan/Poly(Vinyl Alcohol)/Silica as a Proton Exchange Membrane, Membranes, 2021, 11, 675 CrossRef CAS PubMed.
- J. Rhim, H. B. Park, C. Lee, J. Jun, D. S. Kim and Y. M. Lee, Crosslinked poly(vinyl alcohol) membranes containing sulfonic acid group: proton and methanol transport through membranes, J. Membr. Sci., 2004, 238, 143–151 CrossRef CAS.
- G. M. Aparicio, R. A. Vargas and P. R. Bueno, Protonic conductivity and thermal properties of cross-linked PVA/TiO2 nanocomposite polymer membranes, J. Non-Cryst. Solids, 2019, 522, 119520 CrossRef CAS.
- O. Selyanchyn, R. Selyanchyn and S. M. Lyth, A Review of Proton Conductivity in Cellulosic Materials, Front. Energy Res., 2020, 8, 596164 CrossRef.
- M. Furtmair, J. Timm and R. Marschall, Sulfonation of porous materials and their proton conductivity, Microporous Mesoporous Mater., 2021, 312, 110745 CrossRef CAS.
- L. J. Gibson, The hierarchical structure and mechanics of plant materials, J. R. Soc., Interface, 2012, 9, 2749–2766 CrossRef CAS PubMed.
- T. L. Eberhardt, X. Li, T. F. Shupe and C. Y. Hse, Chinese tallow tree (Sapiumsebiferum) utilization: Characterization of extractives and cell-wall chemistry, Wood Fiber Sci., 2007, 39, 319–324 CAS.
- M. Barekati-Goudarzi, D. Boldor and D. B. Nde, In situ transesterification of seeds of invasive Chinese tallow trees (Triadicasebifera L.) in a microwave batch system (GREEN3) using hexane as co-solvent: Biodiesel production and process optimization, Bioresour. Technol., 2016, 201, 97–104 CrossRef CAS PubMed.
- D. Boldor, A. Kanitkar, B. G. Terigar, C. Leonardi, M. Lima and G. A. Breitenbeck, Microwave assisted extraction of biodiesel feedstock from the seeds of invasive Chinese tallow tree, Environ. Sci. Technol., 2010, 44, 4019–4025 CrossRef CAS PubMed.
- J. Xu, T. Chikashige, S. Meguro and S. Kawachi, Effective utilization of stillingia or Chinese tallow-tree (Sapiumsebiferum) fruits, Mokuzai Gakkaishi, 1991, 37, 494–498 Search PubMed.
- J. H. Miller. 2003. Nonnative invasive plants of southern forests: A field guide for identification and control. Revised Gen. Tech. Rep. SRS-62. USDA Forest Service, Southern Research Station, Asheville, NC. 93 pp.
- S. Iravani and B. Zolfaghari, Phytochemical analysis of Pinus eldarica bark, Res. Pharm. Sci., 2014, 9, 243–250 CAS.
- V. Augoustides, N. Kasera and P. Kolar, Chemical characterization data of raw Loblolly pine bark nuggets, Chem. Data Collect., 2021, 33, 100727 CrossRef CAS.
- Z. Derakhshan-Nejad and M. C. Jung, Remediation of multi-metal contaminated soil using biochars from rice husk and maple leaves, J. Mater. Cycles Waste Manage., 2019, 21, 457–468 CrossRef CAS.
- J. E. Kim, S. K. Bhatia, H. J. Song, E. Yoo, H. J. Jeon, J. Yoon, Y. Yang, R. Gurav, Y. Yang, H. J. Kim and Y. Choi, Adsorptive removal of tetracycline from aqueous solution by maple leaf-derived biochar, Bioresour. Technol., 2020, 306, 123092 CrossRef CAS PubMed.
- H. Nur, G. L. Kee, H. Hamdan, T. M. I. Mahlia, J. Efendi and H. S. C. Metselaar, Organosulfonic acid functionalized zeolite ZSM-5 as temperature tolerant proton conducting material, Int. J. Hydrogen Energy, 2012, 44, 12513–12521 CrossRef.
- H. Shi, J. Zhang and J. Li, The effect of guest cations on proton conduction of LTA zeolite, RSC Adv., 2021, 11, 5393 RSC.
- M. Nishihara, Y. Terayama, T. Haji, S. M. Lyth, S. Satokawa and H. Matsumoto, Proton-conductive nano zeolite-PVA composite film as a new water-absorbing electrolyte for water electrolysis, eXPRESS Polym. Lett., 2018, 2(3), 256–264 CrossRef.
- F. Mikšik, T. Miyazaki and M. Inada, Detailed investigation on properties of novel commercial mesoporous silica materials, Microporous Mesoporous Mater., 2019, 289, 109644 CrossRef.
- C. Kim, K. Cho, S. K. Kim, E. K. Lee, J.-N. Kim and M. Choi., Alumina-coated ordered mesoporous silica as an efficient and stable water adsorbent for adsorption heat pump, Microporous Mesoporous Mater., 2017, 239, 310–315 CrossRef CAS.
- A. Bazan, P. Nowicki, P. Półrolniczak and R. Pietrzak, Thermal analysis of activated carbon obtained from residue after supercritical extraction of hops, J. Therm. Anal. Calorim., 2016, 125, 1199–1204 CrossRef CAS.
- Chairunnisa, T. Miyazaki, K. Thu, J. Miyawaki, K. Nakabayashi, A. T. Wijayanta and F. Rahmawati., Development of biomass based-activated carbon for adsorption dehumidification, Energy Rep., 2021, 7, 5871–5884 CrossRef.
- D. Lopez-Pascual, I. Valiente-Blanco, O. Manzano-Narro, M. Fernandez-Munoz and E. Diez-Jimenez, Experimental characterization of a geothermal cooling system for enhancement of the efficiency of solar photovoltaic panels, Energy Rep., 2022, 8, 756–763 CrossRef.
- S. Pascuzzi, A. S. Anifantis, I. Blanco and G. S. Mugnozza, Electrolyzer Performance Analysis of an Integrated Hydrogen Power System for Greenhouse Heating. A Case Study, Sustainability, 2016, 8, 629 CrossRef.
- K. Mazloomi, N. B. Sulaiman and H. Moayedi, Electrical Efficiency of Electrolytic Hydrogen Production, Int. J. Electrochem. Sci., 2012, 7, 3314–3326 CrossRef CAS.
- R. Pinsky, P. Sabharwall, J. Hartvigsen and J. O’Brien, Comparative review of hydrogen production technologies for nuclear hybrid energy systems, Prog. Nucl. Energy, 2020, 123, 103317 CrossRef CAS.
- J. D. Holladay, J. Hu, D. L. King and Y. Wang, An overview of hydrogen production technologies, Catal. Today, 2009, 139, 244–260 CrossRef CAS.
- J. M. Norbeck, J. W. Heffel, T. D. Durbin, B. Tabbara, J. M. Bowden and M. C. Montani. Hydrogen Fuel for Surface Transportation, Society of Automotive Engineers Inc., Warrendale, PA, 1996, p. 548 Search PubMed.
- J. Pettersson, B. Ramsey and D. Harrison, A review of the latest developments in electrodes for unitized regenerative polymer electrolyte fuel cells, J. Power Sources, 2006, 157, 28–34 CrossRef CAS.
- S. A. Grigoriev, V. I. Porembsky and V. N. Fateev, Pure hydrogen production by PEM electrolysis for hydrogen energy, Int. J. Hydrogen Energy, 2006, 31, 171–175 CrossRef CAS.
- J. Yu, G. Jung, Y. Su, C. Yeh, M. Kan, C. Lee and C. Lai, Proton exchange membrane water electrolysis system membrane electrode assembly with additive, Int. J. Hydrogen Energy, 2019, 44, 15721–15726 CrossRef CAS.
- T. Ferriday and P. H. Middleton, Experimental analysis of materials in proton exchange membrane electrolysis cells, Int. J. Hydrogen Energy, 2019, 44, 27656–27663 CrossRef CAS.
- S. Ladre, O. E. Kongstein, A. Oedegaard, H. Karoliussen and F. Seland, Materials for proton exchange membrane water electrolyzer bipolar plates, Int. J. Hydrogen Energy, 2017, 42, 2713–2723 CrossRef.
- H. Zhang, G. Lin and J. Chen, Evaluation and calculation on the efficiency of a water electrolysis system for hydrogen production, Int. J. Hydrogen Energy, 2010, 35, 10851–10858 CrossRef CAS.
- G. Chisholm and L. Cronin, Chapter 16 – Hydrogen From Water Electrolysis. Storing Energy (With Special Reference to Renewable Energy Sources), 2016, pp. 315–343 Search PubMed.
- M. Hammoudi, C. Henao, K. Agbossou, Y. Dubé and M. L. Doumbia, New multi-physics approach for modelling and design of alkaline electrolyzers, Int. J. Hydrogen Energy, 2012, 37, 13895–13913 CrossRef CAS.
- H. Ganjehsarabi, Performance assessment of solar-powered high pressure proton exchange membrane electrolyzer: A case study for Erzincan, Int. J. Hydrogen Energy, 2019, 44, 9701–9707 CrossRef CAS.
- H. Görgün, Dynamic modelling of a proton exchange membrane (PEM) electrolyzer, Int. J. Hydrogen Energy, 2006, 31, 29–38 CrossRef.
- F. M. Nafchi, E. Baniasadi, E. Afshari and N. Javani, Performance assessment of a solar hydrogen and electricity production plant using high temperature PEM electrolyzer and energy storage, Int. J. Hydrogen Energy, 2018, 43, 5820–5831 CrossRef.
- I. Papagiannakis, Studying and improving the efficiency of water electrolysis using a proton exchange membrane electrolyser, Strathclyde University, 2005, pp. 57–68 Search PubMed.
- S. S. Kumar and V. Himabindu, Hydrogen production by PEM water electrolysis – A review, Mater. Sci. Energy Technol., 2019, 2, 442–454 Search PubMed.
- S. K. Nataraj, C. Wang, H. Huang, H. Du, L. Chen and K. Chen, Functionalizing Biomaterials to Be an Efficient Proton-Exchange Membrane and Methanol Barrier for DMFCs, ACS Sustainable Chem. Eng., 2015, 3, 302–308 CrossRef CAS.
- D. Imaan, F. Q. Mir and B. Ahmad, In situ preparation of PSSA functionalized ZWP/sulfonated PVDF composite electrolyte as proton exchange membrane for DMFC applications, Int. J. Hydrogen Energy, 2022, 47, 41347–41358 CrossRef CAS.
- E. Cordova-Mateo, O. Bertran, C. A. Ferreira and C. Aleman, Transport of hydronium ions inside poly(styrene-co-divinyl benzene) cation exchange membranes, J. Membr. Sci., 2013, 428, 393–402 CrossRef CAS.
- S. Sengupta and A. V. Lyulin, Molecular Dynamics Simulations of Substrate Hydrophilicity and Confinement Effects in Capped Nafion Films, J. Phys. Chem. B, 2018, 122, 6107–6119 CrossRef CAS PubMed.
- J. Liu, A Study of Polymer Electrolyte Membranes and Associated Interfacial Systems via Molecular Dynamics Simulations, PhD dissertation, University of Tennessee, 2009.
- S. Feng, J. Savage and G. A. Voth, Effects of Polymer Morphology on Proton Solvation and Transport in Proton-Exchange Membranes, J. Phys. Chem. C, 2012, 116, 19104–19116 CrossRef CAS.
- R. Mokete, F. Miksik, N. Takata, K. Thu and T. Miyazaki A Precursor Study for Modification of Hydrogen Production by Electrolysis. International Conference on Applied Energy 2021. Paper ID: 916.
- T. Shimada, S. Kubota, T. Yanase and T. Nagahama, Formation of graphite zigzag edges by cathodic electrochemical etching in acidic solution, Carbon, 2014, 67, 300–303 CrossRef CAS.
- D. Choi and K. Lee, Experimental Study on Water Electrolysis Using Cellulose Nanofluid, Fluids, 2020, 5, 166 CrossRef CAS.
- D. Imaan, F. Q. Mir and B. Ahmad, Fabrication and characterization of poly(vinyl alcohol) – graphene nanoplatelets (GNPs) proton exchange membrane for direct methanol fuel cells, Mater. Today: Proc., 2020, 26, 2901–2906 CAS.
- F. Chakik, M. Kaddami and M. Mikou, Effect of operating parameters on hydrogen production by electrolysis of water, Int. J. Hydrogen Energy, 2017, 42, 25550–25557 CrossRef.
- B. Alagappan, Assessing Different Zeolitic Adsorbents for their Potential Use in Kr and Xe Separation, University of Nevada, Las Vegas, 2013, pp. 19–25 Search PubMed.
- K. F. Tadavani, A. Abdolmaleki, M. R. Molavian and M. Zhiani, A Promising Proton-Exchange Membrane: High Efficiency in Low Humidity, ACS Appl. Energy Mater., 2018, 1, 2464–2473 CrossRef.
- A. H. P. de Oliveira, M. L. F. Nascimento and H. P. de Oliveira, Preparation of KOH-doped PVA/PSSA Solid Polymer Electrolyte for DMFC: The Influence of TiO2 and PVP on Performance of Membranes, Fuel Cells, 2016, 16(2), 151–156 CrossRef CAS.
- R. S. Malik, P. Verma and V. Choudhary, A study of new anhydrous, conducting membranes based on composites of aprotic ionic liquid and cross-linked SPEEK for fuel cell, Electrochim. Acta, 2015, 152, 352–359 CrossRef CAS.
- M. M. Gomaa, C. Hugenschmidt, M. Dickmann, E. E. Abdel-Hady, H. F. M. Mohamed and M. O. Abdel-Hamed, Crosslinked PVA/SSA proton exchange membranes: correlation between physiochemical properties and free volume determined by positron annihilation spectroscopy, Phys. Chem. Chem. Phys., 2018, 20, 28287–28299 RSC.
- Y. Yu, L. Yu, C. Wang and J. P. Chen, An innovative yttrium nanoparticles/PVA modified PSF membrane aiming at decontamination of arsenate, J. Colloid Interface Sci., 2018, 530, 658–666 CrossRef CAS PubMed.
- A. L. Arim, K. Neves., M. J. Quina and L. M. Gando-Ferreir, Experimental and mathematical modelling of Cr(III) sorption in fixed-bed column using modified pine bark, J. Cleaner Prod., 2018, 183, 272–281 CrossRef CAS.
- M. E. Argun, S. Dursun and M. Karata, Removal of Cd(II), Pb(II), Cu(II) and Ni(II) from water using modified pine bark, Desalination, 2009, 249, 519–527 CrossRef CAS.
- K. S. W. Sing, D. H. Everett, R. A. W. Haul, L. Moscou, R. A. Pierotti, J. Rouquerol and T. Siemieniewska, Reporting Physisorption Data for Gas/solid Systems with Special Reference to the Determination of Surface Area and Porosity, Pure Appl. Chem., 1985, 57, 603–619 CrossRef CAS.
- A. Kamari, W. S. Wan Ngah, M. Y. Chong and M. L. Cheah, Sorption of acid dyes onto GLA and H2SO4 cross-linked chitosan beads, Desalination, 2009, 249, 1180–1189 CrossRef CAS.
- M. Thommes, K. Kaneko, A. V. Neimark, J. P. Olivier, F. Rodriguez-Reinoso, J. Rouquerol and K. S. W. Sing, Physisorption of gases, with special reference to the evaluation of surface area and pore size distribution (IUPAC Technical Report), Pure Appl. Chem., 2015, 87, 1051–1069 CrossRef CAS.
- A. A. Sapalidis, F. K. Katsaros and N. K. Kanellopoulos, PVA/Montmorillonite Nanocomposites: Development and Properties in Nanocomposites and Polymers with Analytical Methods, IntechOpen, London, United Kingdom, 2011 [Online]. Available: https://www.intechopen.com/chapters/17185 DOI:10.5772/1548.
- P. Kulasekaran, B. M. Mahimai and P. Deivanayagam, Novel cross-linked poly(vinyl alcohol)-based electrolyte membranes for fuel cell applications, RSC Adv., 2020, 10, 26521–26527 RSC.
- A. L. Arim, M. J. Quina and L. M. Gando-Ferreira, Uptake of trivalent chromium from aqueous solutions by xanthate pine bark: Characterization, batch and column studies, Process Saf. Environ. Prot., 2019, 121, 374–386 CrossRef CAS.
- H. C. Lee, H. S. Hong, Y. Kim, S. H. Choi, M. Z. Hong, H. S. Lee. and K. Kim, Preparation and evaluation of sulfonated-fluorinated poly(arylene ether)s membranes for a proton exchange membrane fuel cell (PEMFC), Electrochim. Acta, 2004, 49, 2315–2323 CrossRef CAS.
- S. Tasarin, C. Panawong, J. Sumranjit and S. Budsombat, Enhancement of proton conductivity of crosslinked poly(vinyl alcohol) through introduction of zeolitic imidazolate framework-8 and imidazole, Int. J. Hydrogen Energy, 2021, 46, 36969–36981 CrossRef CAS.
- R. Soni, S. Miyanishi, H. Kuroki and T. Yamaguchi, Pure Water Solid Alkaline Water Electrolyzer Using Fully Aromatic and High-Molecular-Weight Poly(fluorene-alttetrafluorophenylene)-trimethyl Ammonium Anion Exchange Membranes and Ionomers, ACS Appl. Energy Mater., 2021, 4, 1053–1058 CrossRef CAS.
- S. P. Sethu, S. Gangadharan, S. H. Chan and U. Stimming, Development of a novel cost effective methanol electrolyzer stack with Pt-catalyzed membrane, J. Power Sources, 2014, 254, 161–167 CrossRef CAS.
- J. H. Avison, Physics for CXC, Thomas Nelson and Sons Ltd., United Kingdom, 1999, p. 250 Search PubMed.
- M. Arroyo, V. Perez-Herranz, M. Montanes, J. Garcia-Anton and J. Guinon, Effect of pH and chloride concentration on the removal of hexavalent chromium in a batch electrocoagulation reactor, J. Hazard. Mater., 2009, 169(1–3), 1127–1133 CrossRef CAS PubMed.
- C. M. van Genuchtena, K. N. Dalby, M. Ceccato, S. L. S. Stipp and K. Dideriksen, Factors affecting the faradaic efficiency of Fe(0) electrocoagulation, J. Environ. Chem. Eng., 2017, 5, 4958–4968 CrossRef.
- N. H. Furman, Coulometry-Related Phenomena of Electrolysis and Current-Sweep Polarography, J. Electrochem. Soc., 1954, 101, 19C CrossRef CAS.
- L. Zhu, Y. Li, J. Liu, J. He, L. Wang and J. Lei, Recent developments in high-performance Nafion membranes for hydrogen fuel cells applications, Pet. Sci., 2022, 19, 1371–1381 CrossRef CAS.
- M. F. A. Kamaroddin, N. Sabli, P. M. Nia, T. A. T. Abdullah, L. C. Abdullah, S. Izhar, A. Ripin and A. Ahmad, Phosphoric acid doped composite proton exchange membrane for hydrogen production in medium temperature copper chloride electrolysis, Int. J. Hydrogen Energy, 2020, 45, 22209–22222 CrossRef CAS.
- S. J. Peighambardoust, S. Rowshanzamir and M. Amjadi, Review of the proton exchange membranes for fuel cell applications, Int. J. Hydrogen Energy, 2010, 35, 9349–9384 CrossRef CAS.
- H. Beydaghi, M. Javanbakht and A. Badiei, Cross-linked poly(vinyl alcohol)/sulfonated nanoporous silica hybrid membranes for proton exchange membrane fuel cell, J. Nanostruct. Chem., 2014, 4, 97 CrossRef.
- S. Zhai, W. Dai, J. Lin, S. He, B. Zhang and L. Chen, Enhanced Proton Conductivity in Sulfonated Poly(ether ether ketone) Membranes by Incorporating Sodium Dodecyl Benzene Sulfonate, Polymers, 2019, 11, 203 CrossRef PubMed.
- C. Ni, Y. Wei, Q. Hu, X. Li, B. Liu, Q. Zhao, M. Zhang, Y. Li and W. Hu, Nanocystalline cellulose reinforced sulfonated fluorenyl-containing polyaryletherketones for proton exchange membranes, Solid State Ionics, 2016, 297, 29–35 CrossRef CAS.
- M. Sharma, P. P. Das, T. Sood, A. Chakraborty and M. K. Purkait, Ameliorated polyvinylidene fluoride-based proton exchange membrane impregnated with graphene oxide, and cellulose acetate obtained from sugarcane bagasse for application in microbial fuel cell, J. Environ. Chem. Eng., 2021, 9, 106681 CrossRef CAS.
- M. S. Kang, J. H. Kim, J. Won, S. H. Moon and Y. S. Kang, Highly charged proton exchange membranes prepared by using water soluble polymer blends for fuel cells, J. Membr. Sci., 2005, 247, 127 CrossRef CAS.
- C. Liu, C. Dai, C. Chao and S. Chang, Novel proton exchange membrane based on crosslinked poly(vinyl alcohol) for direct methanol fuel cells, J. Power Sources, 2014, 249, 285–298 CrossRef CAS.
- D. Ebenezer, A. P. Deshpande and P. Haridoss, Cross-linked poly(vinyl alcohol)/sulfosuccinic acid polymer as an electrolyte/electrode material for H2–O2 proton exchange membrane fuel cells, J. Power Sources, 2016, 304, 282–292 CrossRef CAS.
- T. Kamjornsupamitr, T. Sangthumchai, S. Youngme and S. Martwiset, Proton conducting composite membranes from crosslinked poly(vinyl alcohol) and poly(styrenesulfonic acid)-functionalized silica nanoparticles, Int. J. Hydrogen Energy, 2018, 43, 11190–11201 CrossRef CAS.
- M. Vinothkannan, S. Ramakrishnan, A. R. Kim, H. K. Lee and D. J. Yoo, Ceria stabilized by titanium carbide as a sustainable filler in the Nafion matrix improves the mechanical integrity, electrochemical durability, and hydrogen impermeability of proton-exchange membrane fuel cells: effects of the filler content, ACS Appl. Mater. Interfaces, 2020, 12(5), 5704–5716 CrossRef CAS PubMed.
- A. M. Samsudin, M. Bodner and V. Hacker, A Brief Review of Poly(Vinyl Alcohol)-Based Anion Exchange Membranes for Alkaline Fuel Cells, Polymers, 2022, 14, 3565 CrossRef CAS PubMed.
- K. Sreekanth, T. Siddaiah, N. O. Gopal, Y. Madhava Kumar and Ch Ramu, Optical and electrical conductivity studies of VO2+ doped polyvinyl pyrrolidone (PVP) polymer electrolytes, J. Sci.: Adv. Mater. Devices, 2019, 4, 1–236 Search PubMed.
- R. M. L. Helberg, Z. Dai, L. Ansaloni and L. Deng, PVA/PVP blend polymer matrix for hosting carriers in facilitated transport membranes: Synergistic enhancement of CO2 separation performance, Green Energy Environ., 2020, 5, 59–68 CrossRef.
- Y. F. Huang, L. C. Chuang, A. M. Kannan and C. W. Lin, Proton-conducting membranes with high selectivity from cross-linked poly(vinyl alcohol) and poly(vinyl pyrrolidone) for direct methanol fuel cell applications, J. Power Sources, 2009, 186, 22–28 CrossRef CAS.
- R. Gloukhovski, V. Freger and Y. Tsur, Understanding methods of preparation and characterization of pore-filling polymer composites for proton exchange membranes: a beginner's guide, Rev. Chem. Eng., 2018, 34(4), 455–479 CrossRef.
- S. Su, Q. Shen, S. Wang and G. Song, Discovery, disassembly, depolymerization and derivatization of catechyl lignin in Chinese tallow seed coats, Int. J. Biol. Macromol., 2023, 239, 124256 CrossRef CAS PubMed.
- Z. Bai, S. Liu, G. Cheng, G. Wu and Y. Liu, High proton conductivity of MOFs-polymer composite membranes by phosphoric acid impregnation, Microporous Mesoporous Mater., 2020, 292, 109763 CrossRef CAS.
Footnote |
| † Electronic supplementary information (ESI) available. See DOI: https://doi.org/10.1039/d3ya00503h |
| This journal is © The Royal Society of Chemistry 2024 |