
 Open Access Article
 This Open Access Article is licensed under a Creative Commons Attribution-Non Commercial 3.0 Unported Licence
Electrospun polar-nanofiber PVDF separator for lithium–sulfur batteries with enhanced charge storage capacity and cycling durability†
Irshad
Mohammad
a,
Luke D J
Barter
a,
Vlad
Stolojan
 b,
Carol
Crean
a and
Robert C T
Slade
*a
b,
Carol
Crean
a and
Robert C T
Slade
*a
aChemistry, School of Chemistry and Chemical Engineering, University of Surrey, Guilford GU2 7XH, UK. E-mail: r.slade@surrey.ac.uk
bAdvanced Technology Institute, School of Computer Science and Electrical Engineering, University of Surrey, Guilford GU2 7XH, UK
First published on 7th February 2024
Abstract
Lithium–sulfur batteries (LSBs) provide a high theoretical specific energy up to 5 times higher than that of lithium-ion batteries (2600 vs. ∼500 W h kg−1) but their commercialization is restricted by intrinsic problems such as polysulfide shutting and dendrite growth at the Li metal anode during cycling. A polar, non-ionic, free-standing, electrospun, predominantly β-phase, polyvinylidene fluoride (PVDF) nanofiber separator membrane has been designed and realised in order to mitigate the polysufide shuttling effect. The β-PVDF sheet, with its inherent polarity, can chemically immobilize the polysulfides and suppress the formation of dendrites in LSBs. The fibrous separator obtained displays the combined advantages of being ultrathin (35 μm thick) and lightweight (0.85 mg cm−2), with very high porosity (79.5%), high wettability (95%), and high electrolyte affinity. In cells that were chosen deliberately to use a commercial cathode and to differ only in the separator used, the nanofibrous polar PVDF film showed high effective ionic conductivity, when LSB-electrolyte impregnated, at nearly double that of the commercially available polypropylene (PP) separator. After 100 GDC cycles at 0.05C, LSBs with polar PVDF separator and the commerical cathode material showed charge storage capacities of approximately 800 mA h g−1, that being 200 mA h g−1 greater than with otherwise identical cells containing a current commercial polyolefin-based separator.
Introduction
Lithium–sulfur batteries (LSB) are one of the most promising alternatives to lithium-ion batteries for future energy storage systems.1 LSBs have some excellent properties such as a high energy density (2600 W h kg−1), high theoretical specific capacity (1675 mA h g−1), low cost and a kinder environmental impact, which combine to make them very suitable candidates for next generation energy storage applications.2–4 In contrast to the one-electron chemistry in Li-ion batteries (LIBs), LSBs feature a two-electron (per sulfur atom) charge/discharge:| S8 + 16e− + 16Li+ ↔ 8Li2S. |
The electrochemical reduction of S8 is, in fact, a stepwise process, with the formation of different long-chain polysulfide intermediates (Li2Sx, 3 ≤ x ≤8).
| 1st voltage plateau 3S8 + 6Li+ + 6e− ↔ 3Li2S8 |
| sulfur utilisation 3Li2S8 + 2Li+ + 2e− ↔ 4Li2S6 |
| 4Li2S6 + 4Li+ + 4e− ↔ 6Li2S4 |
| 2nd voltage plateau 6Li2S4 + 12Li+ + 12e− ↔ 12Li2S2 |
| polysulfide conversion 12Li2S2 + 24Li+ + 24e− ↔ 24Li2S2 |
In contrast to small sulfur-chain Li2S2 and the final product Li2S, the polysulfide intermediates are highly soluble in the currently available, ether-based, electrolytes for LSB use. The discharge process therefore produces dissolved (in the electrolyte) polysulfide intermediates which can shuttle through the permeable separator into the anode compartment, resulting in an irreversible loss of sulfur, dendrite growth, and poor cycling performance of the battery.5,6 The switch from multiple products in bulk and pore filling electrolyte (1st plateau) to solid phase products (2nd plateau) gives a complex thermodynamic behaviour and a brief voltage dip before the second plateau is sometimes (but not always) seen; the discharge curve reflects kinetic processes and is not determined fully by considerations linked to the equilibrium-assuming, thermodynamic phase rule.
Until now, most studies to obviate the polysulfide shuttling issue have considered variations to cathode, anode and electrolyte. Earlier reports have focused mainly on optimizing the sulfur + carbon (cathode) electrode;7–9 numerous studies have concentrated primarily on the sulfur-based cathodes and have included carbon as a conductive support.10–12 More recently, some traditional carbon materials,13–16 metal organic framework (MOF) based materials,17 transition metal oxides18 and sulfides19 have been tested to improve the performance of the sulfur cathodes. In comparison, only a few studies have considered the anode and engineering of a robust SEI on Li metal to protect the lithium anode from chemical corrosion by polysulfides and to inhibit lithium dendrite growth. Some studies have considered modifying the electrolyte: modifying the electrolyte composition,20 use of ionic liquid electrolytes21,22 and use of solid electrolytes23 to improve the performance of LSBs.
The separator, which is a key component in liquid electrolyte LSB systems, has great impact on the electrochemical performance and safety of Li–S batteries.24 Soluble polysulfides have been thought to inevitably shuttle through the separator towards the lithium anode, resulting in low active-sulfur-utilization (based on initial cathode composition). Standard, non-polar, separators, such as polyolefin films and their composite materials, cannot suppress the shuttle effect, neither physically nor chemically, due to their large pore size and lack of functionalisation and polarity. Separator coating or the addition of an interlayer between the cathode and the separator appear to be effective methods to suppress the diffusion of polysulfides, but the associated complicated procedures and high cost limit their commercial application.25,26 Recently, a cellulose, nanofiber-based, separator for suppressing the shuttle effect has been reported;27 the freestanding nanofibers were fabricated in isopropanol/water suspension through a vacuum filtration progress. The abundant polar, oxygen-containing functional groups are said to chemically repel the polysulfides, resulting in an LSB discharge capacity at the 100th cycle reported to be 1.3 times that with a polypropylene separator. Chen et al. prepared a highly porous polyvinyl alcohol (PVA)/sodium carboxymethyl cellulose (CMC) composite separator via a non-solvent, induced separation method;28 the porous PVA/CMC separator has negatively charged –CO2− functional groups to hinder shuttling through the separator. An LSB using that composite separator demonstrated stable cycling with a low-capacity decay rate of 0.045% per cycle over 500 galvanostatic discharge–charge cycles at a current corresponding to 1C.
In comparison with polyolefin separators, polyvinylidene fluoride (PVDF) and its copolymers show excellent performance for their use as separator membranes in lithium ion batteries due to the high dipole moment of the C–F bond and the associated high dielectric constant of the material.29 This area has been extensively reviewed by He and co-workers.30 Continuous porous membranes and nanofibrous PVDF-containing materials produced by standard syringe techniques (e.g. ref. 31) are non-polar due to neighbouring C–F bond dipole pairs being in opposite directions (as in the α phase of PVDF). These polymers show excellent thermal and mechanical properties, good wettability in organic solvents, and are chemically inert and stable in the cathodic environment. More importantly, their porosity can be easily varied according to requirement.
Among the various forms of PVDF, the β-phase displays the largest membrane polarity due to the parallel alignment of neighbouring atomic-level, bond dipole (C–F bond) pairs along the entire PVDF polymer chain;32 this results in a bulk phase that is itself polar, with directional ordering at the molecular level due to the electric field during electrospinning. The F atoms are the negative end of each atomic-level dipole and are on the exterior of the chain, whereas the carbon atoms that are the positive ends are buried centrally within the chain. Polar PVDFs are therefore candidate non-ionic materials for reduction of polysulfide shuttling by electric field repulsion of long-chain, negatively charged, polysulfide ions by the PVDF chain surface of the nanofibers. Further, ordered polarity (achievable with controlled phase composition) can create a near-uniform lithium diffusion environment/electric field which may also reduce the dendrite formation and corrosion at the anode.33
Many methods have been developed to prepare β-phase PVDF, such as solvent casting, electrospinning, annealing, polymer stretching, and incorporation of filler materials. Electrospinning of PVDF nanofibers has become one of the most promising techniques30,34 and can provide membranes with high porosity, high specific surface area and controllable pore size, and can improve the wettability for electrolytes. In the electrospinning method, a PVDF solution in organic solvent is prepared and loaded into a spinneret with a hollow needle, which is then placed under a high electric field (∼106 V m−1). A charged jet is ejected from the spinneret tip when the electrostatic force overcomes the surface tension of the liquid. This process of polymer stretching under a high electric field causes the formation of highly polar nanofiber films/membranes. The inherent porosity, high dielectric constant, and polar nature of these films gives ideal structures for battery separator materials.
Our previous studies concerned development of polar PVDF separator for supercapacitor use.34 The membrane separators optimised for supercapacitors similarly needed to display very high porosity and electrolyte uptake, and they were consequently optimised to that end. It was the research hypothesis in the current study that such separators would then also act to limit polysulfide shuttling, and this is what is tested and proved here. It is possible that there could be further optimisation, but this should happen when a commercial constraint is imposed (e.g. a specific thickness range is required) and, as such, is outside the scope of this study. Non-polar PVDF-only separators have been investigated by others in the context of LIBs (and in some studies of LSBs), without a significant enhancement of the type reported in this work being reported. In the case of LIBs there is no comparable shuttle effect to be mitigated and it is the polysulfide shuttle effect that has stimulated the research hypothesis (shuttle effect inhibition by porous, polar PVDF separator film) underlying this study.
Electrospun PVDF has been studied for use in lithium-ion batteries e.g. ref. 35,36 but often without any attention to, or control of, the phase structure of the nanofiber membrane. In contrast, this study specifically and disruptively employs membranes in which polar phases have been made to predominate. That design strategy leads to mitigation of the polysulfide shuttling effect and of the associated anode corrosion; such a polar PVDF-nanofiber membrane can therefore be used as a strategic, advanced, separator for LSBs. To obtain a high content of the polar β and γ crystalline phases, a small concentration of an anionic surfactant (sodium dodecyl sulphate, SDS) is incorporated. The crystalline phases in the separators were determined by Raman and FT-IR spectroscopies. The nanofiber films are of low mass, show high mechanical and thermal stability and provide a polarised, free-standing separator that has high porosity, good wettability, and excellent electrolyte affinity.
Additionally, the detailed electrochemistry of LSB devices incorporating highly polarised nanofiber films has been characterised in this study. The polarised PVDF film immersed in electrolyte shows a relatively high effective ionic conductivity at room temperature. Polysulfide diffusion tests in an H-type cell were performed for polarised films and show considerable inhibition of polysulfide crossover. LSBs with a controlled phase composition separator (nanofibrous, polar PVDF) show significantly higher charge storage capacity and better cycling performance relative to otherwise identical cells using a standard poly(propylene) (PP) separator film.
The investigators chose deliberately to maintain constant all cell assembly variables other than the separator used. For that reason, the standard, commercial cathode was chosen and was found to lead to capacity values repeatable within 5% regardless of the commercial batch used. This enabled meaningful and direct identification of the effect of variation of the separator and reliable testing of the research hypothesis. The effects seen cannot be assigned to the chosen electrolyte composition nor to any changed diffusion path within the identical cathodes.
Experimental
Materials
All chemicals were used as received (but with additional drying of electrolyte salts): from Sigma Aldrich – polyvinylidene fluoride (PVDF, 275![[thin space (1/6-em)]](https://www.rsc.org/images/entities/char_2009.gif) 000 g mol−1), N,N-dimethylacetamide (DMAc), sodium dodecyl sulfate (SDS), n-butanol, Li foil (99.9%); from Alfa Aesar – 1,3-dioxlane (DOL, 99.5%), 1,2-dimethoxyethane (DME. 99.5%), LiNO3 (99.9%), lithium bis(trifluoromethane)sulfonimide (LiTFSI 99.95%), Li2S, sublimed sulfur powder; from Pi-Kem – PP (Celgard 2400) separator; from NEI corporation – Nanomyte BE-70E (sublimed sulfur on carbon, sulfur loading 3.26 mg cm−2) electrode sheet. Prior to making the electrolyte solution, LiTFSI was dried for three days at 120 °C using a Schlenk line and LiNO3 was dried for 2 days at 150 °C in a vacuum oven, both under dynamic vacuum.
000 g mol−1), N,N-dimethylacetamide (DMAc), sodium dodecyl sulfate (SDS), n-butanol, Li foil (99.9%); from Alfa Aesar – 1,3-dioxlane (DOL, 99.5%), 1,2-dimethoxyethane (DME. 99.5%), LiNO3 (99.9%), lithium bis(trifluoromethane)sulfonimide (LiTFSI 99.95%), Li2S, sublimed sulfur powder; from Pi-Kem – PP (Celgard 2400) separator; from NEI corporation – Nanomyte BE-70E (sublimed sulfur on carbon, sulfur loading 3.26 mg cm−2) electrode sheet. Prior to making the electrolyte solution, LiTFSI was dried for three days at 120 °C using a Schlenk line and LiNO3 was dried for 2 days at 150 °C in a vacuum oven, both under dynamic vacuum.
Electrospun PVDF nanofiber membrane
Polar PVDF films were prepared as previously published.34 PVDF was dissolved in DMAc solvent, with continuous magnetic stirring at 60 °C for 12 h. The solution was then cooled to room temperature before adding the anionic surfactant, SDS, and stirring for a further 2 h to again obtain a clear solution. The final DMAc solution contained 22% mass PVDF and 1.5% mass SDS. That solution was loaded into a syringe with a needle tip (inner diameter, 0.835 mm) and electrospun onto a drum covered in silicone-release paper and rotating at 1.35 m s−1; the distance between needle tip and collector was 15 cm. The voltage difference and flow rate were 24 kV and 0.8 cm3 h−1 respectively. The relative humidity and temperature of the system were not controlled but averaged 22% and 20 °C. The polarity of the film was evident in its attraction to a variety of items and a tendency towards forming a ball (easily mitigated).The thickness of the dry film was determined to be 35 μm and this value was used in studies of membrane conductivity (the thickness of a wet film under compression in a symmetrical cell cannot be measured). In a similar vein, wetting of the of the separator could alter its dimensions and filament size, but the values quoted refer to in-cell measurement, with separator and other components under compression and wetted and permeated by a fixed volume of electrolyte; the dimensions under those conditions cannot be known.
The fabrication method leads to distinguishing of 2 possible orientations for the separator membrane, namely “drum side” towards (F-side orientation) or away from (H-side orientation) the Li anode in an LSB cell.
Film characterization
For Raman spectroscopy, electrospinning a thin film onto Al foil gave higher intensity signals for determining the crystalline phases in the nanofibrous polymer structure. All measurements were taken with a Horiba Xplora Plus using a 532 nm laser at 10×/0.25 mag/ numerical aperture and 1800 grating from 200 to 3500 cm−1, calibrated using a polystyrene standard. Multiple measurements were collected across the entire sample, to ensure consistency across the whole separator film, and care was taken not to damage or burn the nanofiber structure with the laser. Infrared spectroscopy was performed with a Varian 660 IR instrument in the attenuated total reflection (ATR) mode and in the range 650–4000 cm−1. Dynamic contact angle measurements were conducted using an optical contact angle measuring and contour analysis system (Krüss DCA25B). The morphology of the film was evaluated by scanning electron microscopy (SEM) (Tescan Mira II (FEG/SEM)), with an accelerating voltage of 15 kV.Determination of membrane porosity and wettability
For investigation of porosity and wettability of separators, each was first cut to give 1.6 cm diameter discs which were individually weighed (wdry). To estimate the porosity of the separators, an n-butanol test was carried out; after soaking in n-butanol for 2 h and gently wiping off (with paper tissue) residual liquid at the surface, the weight was measured again (wwet). The porosity P was calculated according to following equation:37,38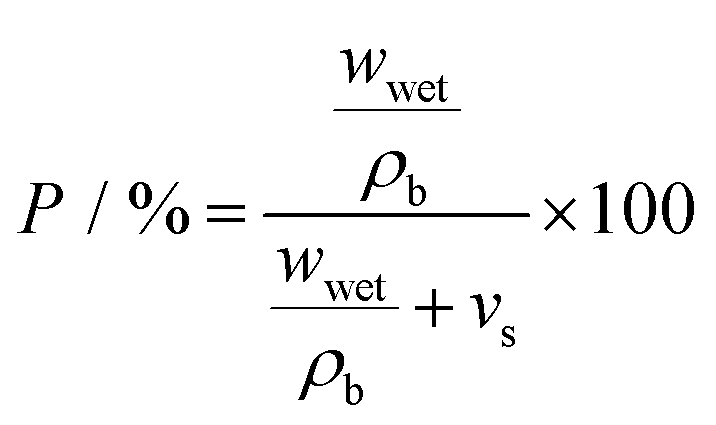 | (1) |
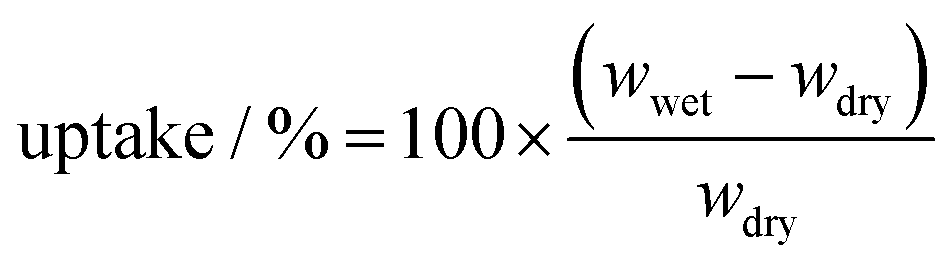
To determine electrolyte uptake, the film was immersed in electrolyte, and was then removed and the surface gently wiped. The film was weighed before and after absorbing the electrolyte. The electrolyte uptake was calculated as:
 | (2) |
Electrodes and electrochemical characterization
The Nanomyte cathode material has a commercially relevant sulfur-loading (3.26 mg cm−2) and consists of active material (S8), conductive carbon black (Super P), and PVDF (binder) with a ratio of 70:20:10 by mass. Li foil was used as the anode and as the reference point in 2-electrode CV studies, and either electrospun polar PVDF membrane or commercial polypropylene (Celgard 2400) served as the separator. LiTFSI (1 mol dm−3 in 1:1 DME and DOL) with the addition of LiNO3 (0.8 mol dm−3) was selected as the electrolyte. Coin cells (CR2032, 304 stainless-steel, wave spring, 2 × 0.5 mm stainless-steel spacer discs) were crimped in an Ar-filled drybox (MBRAUN Unilab) and subsequently rested for ≥3 h before electrochemical cycling. The levels of water and oxygen in the drybox were both <0.1 ppm. The electrolyte-volume to sulfur-mass (E/S) ratio was kept constant at 12 in assembling all cells. As will be seen below, porosity tests showed very high solvent uptake by the polar PVDF separator film and that will also be the case for electrolyte uptake in the relevant LSB cells. Use of lower E/S ratios did not lead reliably to wetting of the electrodes.
The electrochemical galvanostatic charge–discharge (GDC) profiles for 2-electrode cells were determined using Gamry 1010E potentiostats and the voltage range 1.8–2.8 V. Cyclic voltammetry (CV, 2 electrodes) experiments were performed at a scan rate of 0.2 mV s−1 between 1.5 and 3.0 V (versus Li+/Li). For pseudo-capacitance measurements, CV curves were determined at scan rates in the range 0.1 to 0.5 mV s−1.
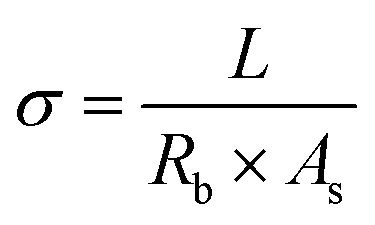
Electrochemical impedance spectroscopy (EIS) measurements were performed in the frequency range of 1 Hz–10 MHz and with a voltage amplitude of 10 mV, using the same Gamry instruments. To calculate effective ionic conductivities for the separators, potentiostatic EIS analysis was carried out on symmetrical cells with two lithium foil electrodes and with either a PVDF or a PP film as separator. Ionic conductivity was calculated using the following formula:
 | (3) |
Results
Physicochemical characterization of polar PVDF film
Electrospinning produces uniform, smooth, nanofibers, with minimal beading. To get a high concentration of β-PVDF, 1.5% SDS surfactant was added to the precursor PVDF solution.34 The PVDF fiber composition was investigated using Raman and Fourier Transform Infra-Red (FT-IR) spectroscopies.α-PVDF is a nonpolar phase, where the antiparallel configuration of the neighbouring CF2 moieties within the macromomolecular chain causes the formation of an atomic level net-zero average dipole moment, whereas the β and γ phases are polar (with permanent, atomic level spatial average dipole moment). Fig. 1(a) shows the Raman spectrum (bottom spectrum) and FTIR spectrum (top spectrum) of the polar PVDF film. Raman spectra have distinct peaks for α + γ, β + γ, and β phase at 802, 845, and 1275 cm−1, respectively. Observation of the peaks for different phases is fully consistent with previous data.39 As shown in Fig. 1(a) (top spectrum), two phase types (non-polar and polar) can be distinguished in FTIR as follows: (i) peaks at 780, 840, 1250 and 1275 cm−1 are characteristic absorption peaks associated with α, β + γ, γ and β respectively; this is in agreement with previous literature reports.40 The characteristic absorption peak, corresponding to β phase, was more intense relative to other phases. The total concentration of β phase was 47%.
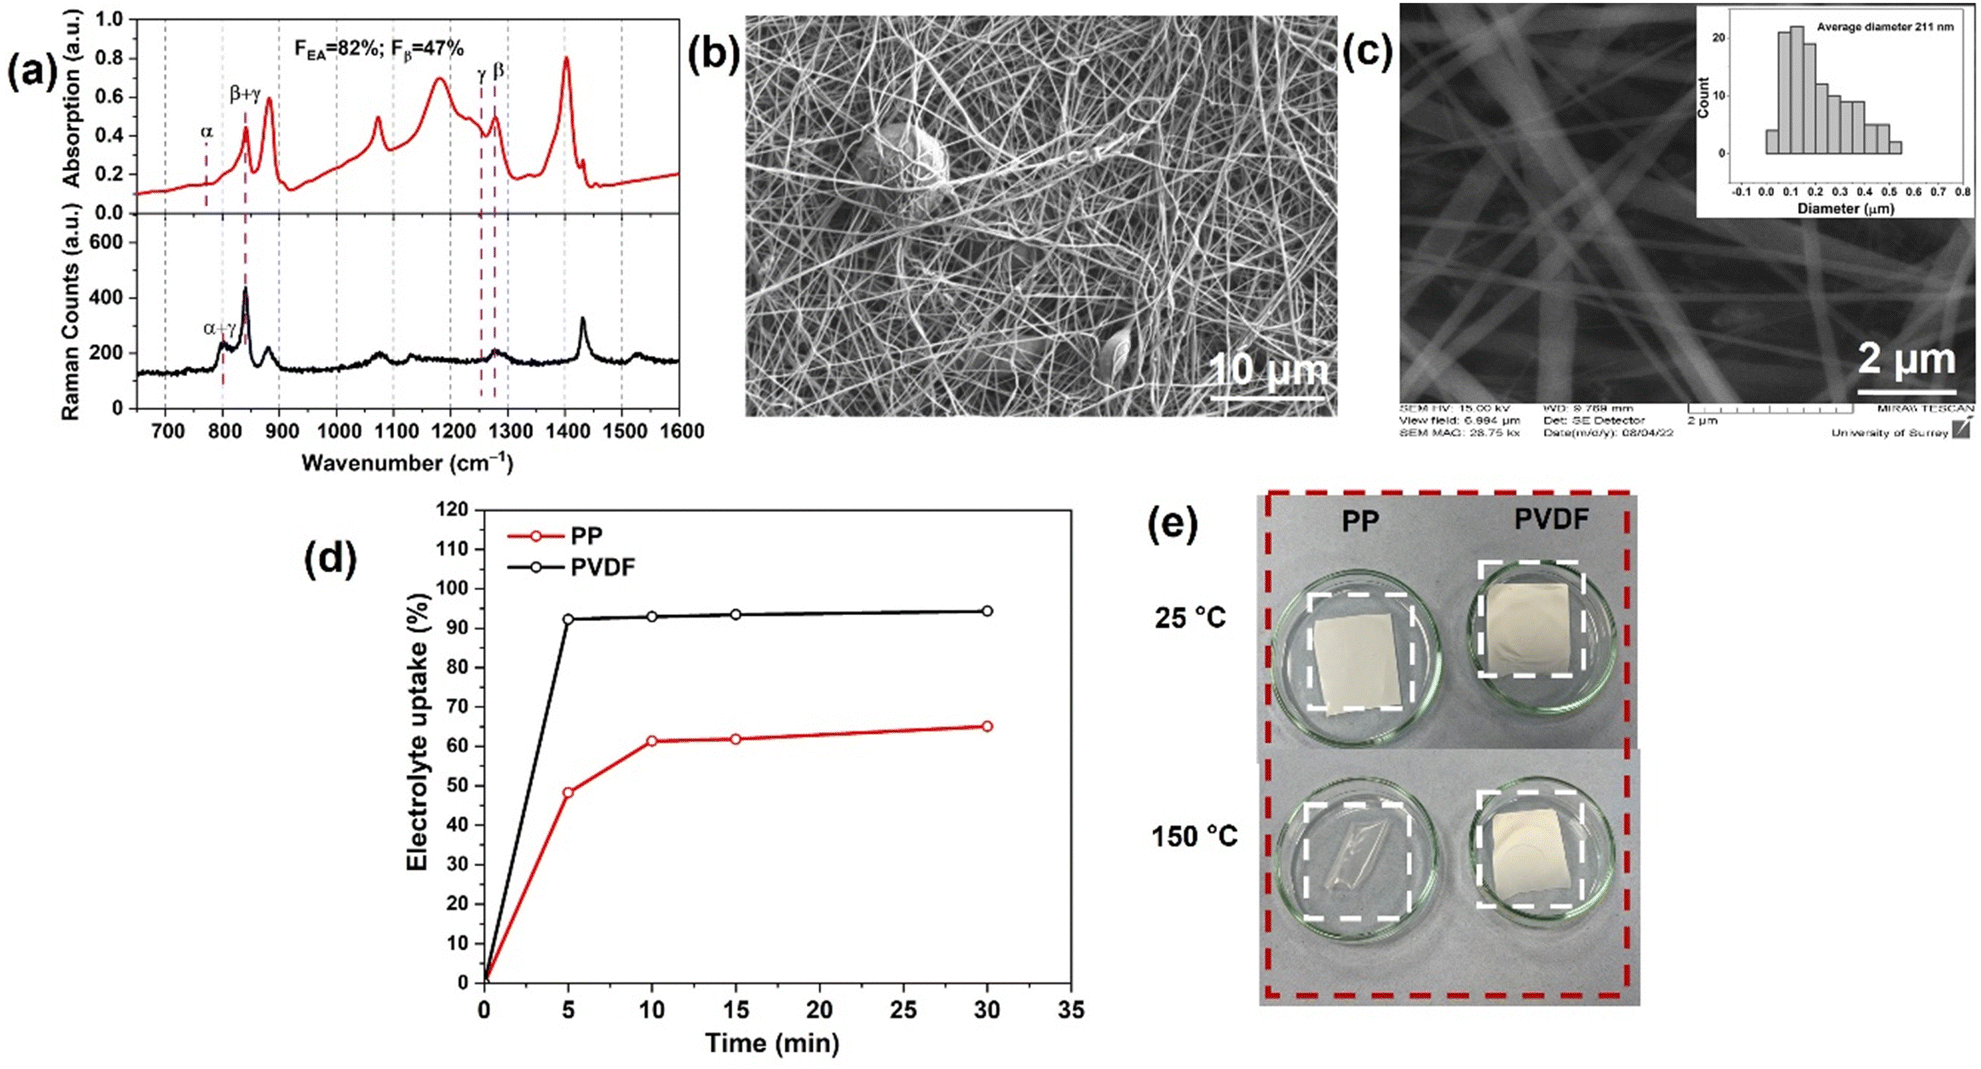 | ||
| Fig. 1 (a) Raman spectra (bottom spectrum) and FTIR spectra (top spectrum) of electrospun PVDF film from 650–1600 cm−1. FEA is the fraction of polar material in the crystalline portion of the PVDF (essentially, beta and gamma phases). The Fβ is the amount of crystalline β-phase in the whole of the sample – as in previous work.32 SEM image of polar PVDF film with (b) higher magnification, and (c) lower magnification along with the fiber diameter histogram (inset) (d) Electrolyte uptake percentage versus time curves of PP separator and PVDF separator. (e) Digital photographs of PP separator (left) and PVDF separator (right) at 25 (top) and after heating for 1 h at 150 °C (bottom). | ||
The phases composition reported is as extracted from the data presented here. FTIR discriminates α, β and γ phases only (and not amorphous PVDF – which requires DSC and/or XRD). The 47% reported here refers to the concentration of β-phase as a percentage of the total crystalline content. In our previous study,34 38% is the β + γ content as a percentage of the total (amorphous + crystalline PVDF); the β-phase was 32% of the total PVDF. The total amount of β-phase as a percentage of the crystalline content in that work was 32/65 × 100% = 49%, which is fully consistent with the content reported in this study.
The polar PVDF fiilm was therefore found to be enriched with both polar phases (β and γ), introducing permanent polarity in the bulk film. SEM analysis of the resulting film morphology is shown in Fig. 1(b) and (c). A small content of beaded structures was present within the nanofibers (Fig. 1(b)); this can happen when the interactions between the polymer chains are too weak to overcome the Rayleigh instability.41 In Fig. 1(c), data in the inset bar chart shows a mean nanofiber diameter of 211 nm. The PVDF-nanofiber separator has an interwoven and interstitial porous structure, which effectively alleviates the self-discharge of the battery and effectively prevents disruption from high discharge rates or vigorous conditions. In addition, the cross-linked nanofiber structure will be advantageous in preventing lithium dendrites from penetrating the separator through long-term cycling.42 Tortuous porosity between the nanofibers can be identified, which can absorb a large amount of included electrolyte, as observed in the porosity tests below. This provides not only an excellent effective ionic conductivity for the separator but also blocking of the diffusion of soluble high order polysulfides, thereby increasing the Li+ transference number.
Porosities were determined by the n-butanol test using eqn (1). The polar PVDF separator has a porosity of 79.5%, close to that previously reported (81%).34 In contrast, the PP (Celgard 2400) separator has a lower porosity, 57%. High porosities again suggest retention of large amounts of electrolyte, providing sufficient ionic conductivity but necessitating the raised E/S value in cells studied. Fig. 1(d) shows the electrolyte uptake percentage for different separators. The PVDF separator shows excellent electrolyte uptake (92%) after 5 min, substantially higher than that for PP separator (48%) (Fig. 1(d)). As time of immersion increases, the electrolyte storage capacity increases slightly for both separators, reaching 95% for PVDF after 30 min and 65% for PP.
To determine the effective ionic conductivity, EIS measurements were performed on separate symmetrical cells with PP and PVDF separators. Fig. S1 (ESI†) shows the Nyquist plots of cells with both separators, a tilted line indicating the ion diffusion process within the separator. The resistance R is defined in calculating Li+ conductivity as the intersection of that line with the Zre-axis. The calculated effective ionic conductivity for PP and PVDF were 6.3 × 10⁻³ and 1.5 × 10⁻² S cm−1, respectively. The wetted PVDF membrane therefore shows significantly higher effective ionic conductivity, 2.4 times higher than that with PP (Celgard 2400) separator. The higher ionic conductivity of the PVDF separator is attributed to its substantial electrolyte uptake capability, well-defined ion diffusion pathways, and improved lithiophilic properties (nanofiber surfaces have negative charge). The wettability of the separator was further investigated by dynamic contact angle measurements for both separator film types; contact angle measurements used LSB electrolyte droplets on the separators. The polar PVDF membrane was immediately wetted when the electrolyte was added as a drop, and fully wetted within 4 s (Fig. S2a, ESI†). The initial contact angle for PP separator was approximately 53°, and decreased to 36° after 25 s (Fig. S2b, ESI†).
The thermal stability of the PVDF separator was determined and compared with that of PP separator, as shown in Fig. 1(e). The PVDF film fully maintains its initial shape even on heating at 150 °C for 1 h (Fig. S4a, ESI†), indicating excellent thermal stability. In contrast, the PP membrane becomes mostly molten at that temperature. The thermal stability of PVDF is related to its crystalline nature. Further, under the most severe conditions (150 °C) the PP separator becomes transparent and shrinks, indicating loss of micropores, whereas transparency of the PVDF separator remains unchanged.
Optical studies of polysulfide permeation through separator membranes
Li2S and S powder were added to 1,2-dimethoxyethane (DME) solvent and the solution was homogenized by vigorous stirring in a closed vessel inside the Ar-filled dry box (MBRAUN Unilab) for 48 h; the concentration of the prepared Li2S6 solution was 5 mmol dm−3.A merit of β-PVDF, for application in a separator in LSBs, is its ability to curb the migration of polysulfide from the sulfur cathode to the Li anode. This is revealed by a visual polysulfide permeation test shown in Fig. 2(a) (overleaf). To explore the effect of PP and polar PVDF separators on polysulfide permeation, a visual experiment was carried out in the dry box with an H-type cell containing the highly colored Li2S6 solution and pure DME (colorless) contacted across the separator. For the PP separator (Fig. 2(a), top), the Li2S6 gradually diffused through the separator, and the crossover became more and more evident as time increased (the colors equalised after ca. 30 min). For the polar PVDF separator, slight crossover of the polysulfide was visible after a small number of hours but the color in the right compartment cleared at longer time (Fig. 2(a), bottom). The initial coloration is due to slight, concentration-difference-driven crossover of the polysulfide chromophore. At longer time that very small amount of polysulfide had sorbed onto the PVDF separator, that being a kinetically slower process that clears the DME solvent.
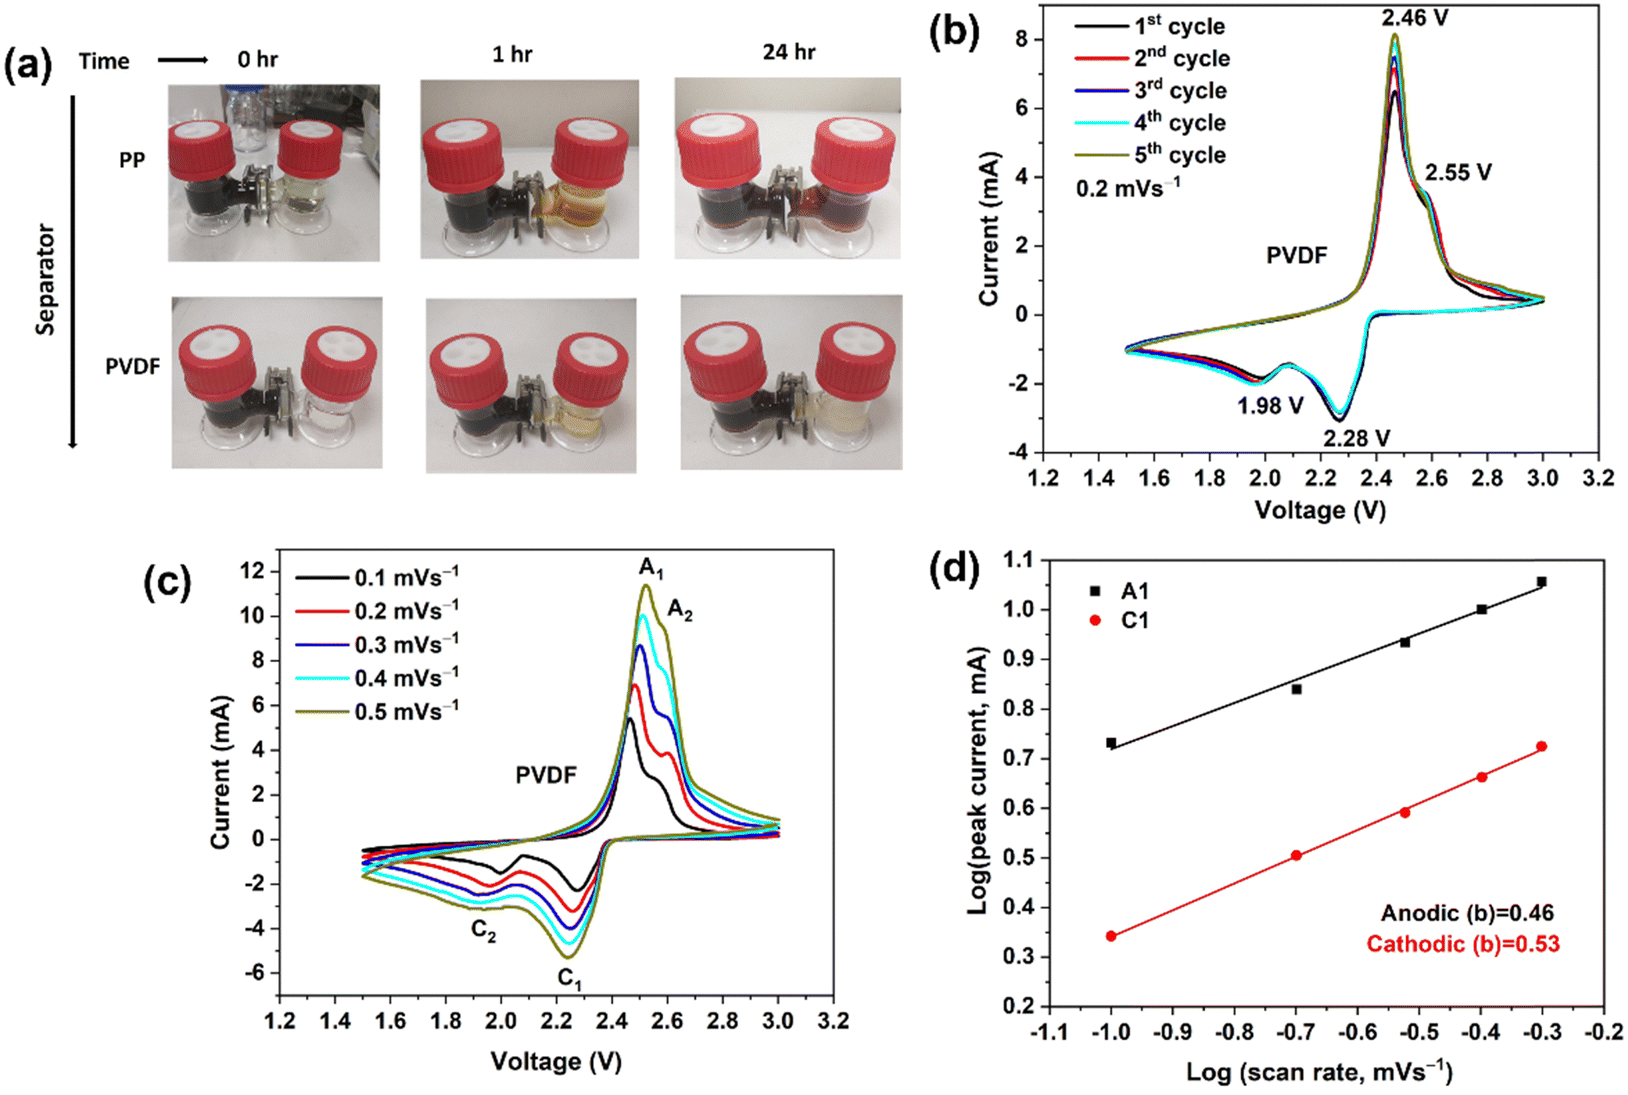 | ||
| Fig. 2 (a) Optical images of the diffusion process of polysulfides through the different separators. (b) CV curves of Li–S batteries (LSBs) using polar PVDF separator, showing the first five cycles at a scan rate of 0.2 mV s−1 over a potential window of 1.5–3.0 V. (c) CV curves recorded at differing scan rates for an LSB with a polar PVDF separator. (d) Linear fits (to eqn (5)) of the peak currents derived from CV curves of LSBs. | ||
Studies using cyclic voltammetry
Initial cyclic voltammetry (CV) experiments were prior to studying the in-cell behaviour of PP and polar PVDF separators.Fig. 2(b) shows the CV curves (2 electrodes) of a LSB cell with PVDF separator during the first five cycles at 0.2 mV s−1 within the voltage window of 1.5–3.0 V (vs. Li/Li+). In the cathodic scan, two redox peaks are observed, at 2.28 and at 1.98 V, which represent the transformation of elemental sulfur to long-chain polysulfides (Li2Sn, 3 < n < 8) and soluble polysulfides to solid lithium sulfide (Li2S) and disulfide (Li2S2), respectively.43 In the anodic scan, two peaks again appeared, at 2.46 and at 2.55 V, corresponding to the reverse reactions. Further, the peaks showed no observable shifts with increasing cycle number, indicating good electrochemical stability.
The electrochemical redox kinetics were also investigated, to distinguish the pseudo-capacitive and diffusion-controlled contributions to the lithium storage capacity. Fig. 2(c) depicts CV traces at scan rates 0.1–0.5 mV s−1 within the voltage window of 1.5–3.0 V (vs. Li/Li+). The following equation shows the relationship between current (i) and scan rates (v).44
| i = avb | (4) |
| logi = blogv + loga | (5) |
In eqn (5), a and b are variable parameters. When the b value is approximately equal to 0.5, the battery charge/discharge process is mainly controlled by diffusion behavior, but when the b value approaches 1, capacitor behavior is then dominant.45b-values were calculated from log(i) versus log(v) plots using eqn (5). Fig. 2(d) shows the b-values were 0.53 and 0.46 at anodic (A1) and cathodic (C1) peaks, respectively. The b values demonstrate that the redox kinetics of the sulfur–carbon composite cathode show diffusion-controlled behaviour, which indicates a battery-like process and not a capacitance-controlled process.
Repeatability studies of LSB cells
In establishing repeatability, three cells were studied for each LSB type (3 cells with polar PVDF separator and 3 cells with PP). The discharge data below refer to a single cell in each case. Voltage plateaus were similar within each type and charge storage capacities were repeatable within a range of ±5%. Within that range, no influence of orientation of the polar PVDF\separator was detected, nor of deliberate use of Nanomyte electrodes from 2 different commercial batches.Fig. 3(a) (overleaf) shows the cycle-dependent capacities of 2 cells with differing PVDF orientations (F-side or H-side) but with very similar capacities (no detected influence of orientation). In all other figures, the PVDF is in the H-side orientation. Fig. 3(b) shows the repeatability of measurements of three cells of that type, presented as mean and standard deviation (3 cell of each type) for each cycle number. Use of the latter presentation routinely could mask any “noise” in capacity variations for individual cells.
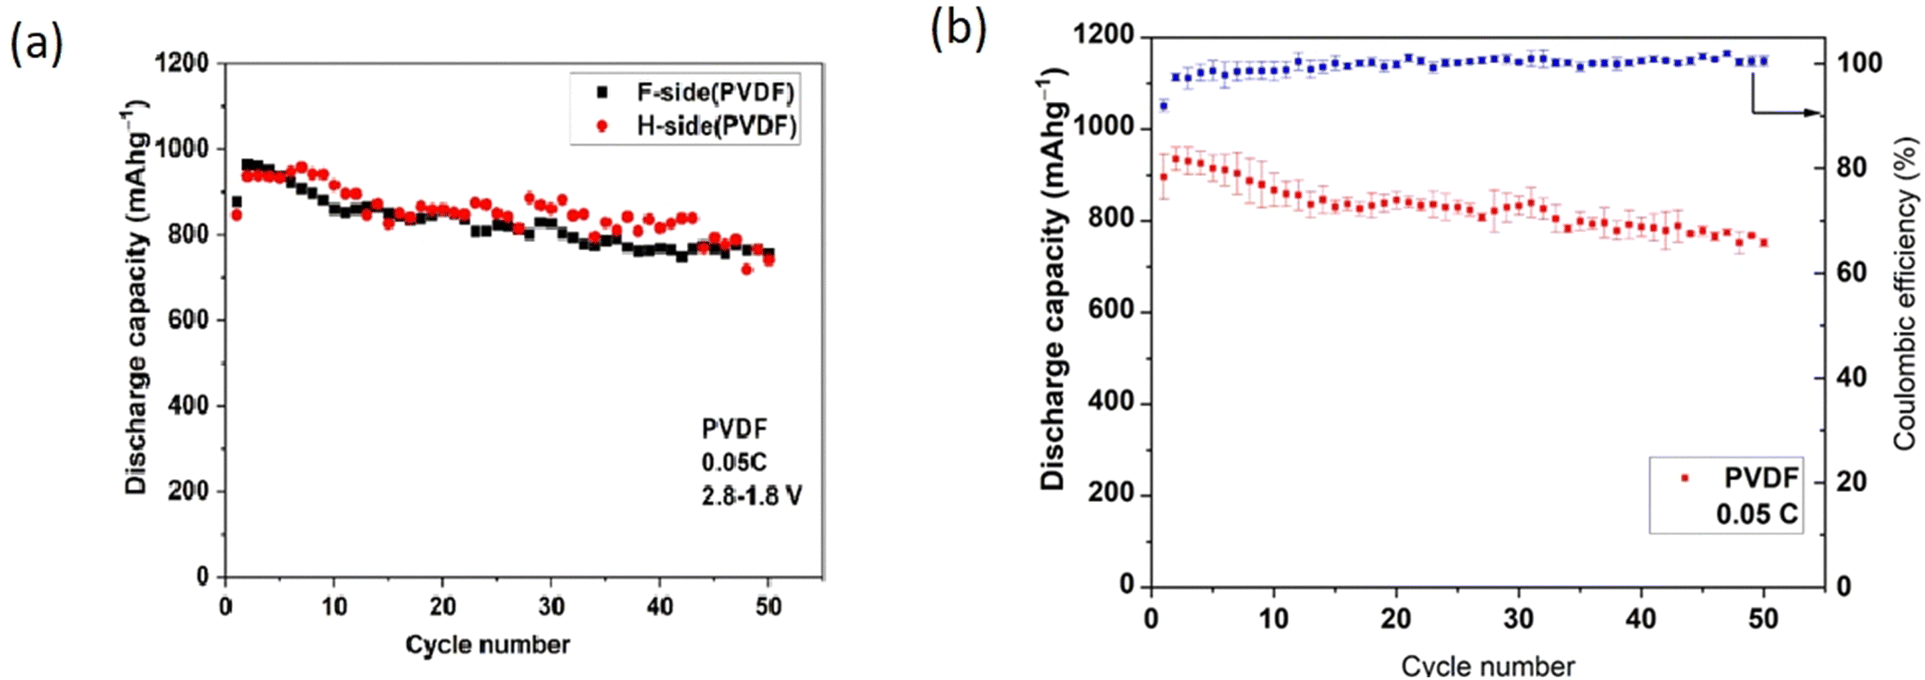 | ||
| Fig. 3 (a) Variation of discharge capacity for 2 cells with polar PVDF separator in differing orientations of the film relative to the anode. (b) Variations (expressed as mean and standard deviation) of discharge capacities for 3 cells of each type and with polar PVDF separator in the H-side configuration. All measurements were made at 0.05C. | ||
Detailed GDC behaviour of LSB cells
Galvanostatic discharge–charge (GDC) tests of the Li–S cells were firstly carried out at 0.05C for three cycles, as shown in Fig. 4(a). To prevent side reactions with LiNO3 (below 1.8 V) in the cell, the cycling potential range was 1.8–2.8 V in all tests. The discharge curves show two plateaus, at ∼2.3 V and ∼2.1 V. The first plateau, at higher voltage (∼2.3 V), represents the reduction of elemental sulfur into high-order soluble polysulfides, and the second plateau, at lower voltage (∼2.1 V), originates in further reduction of low-order polysulfides into insoluble Li2S/Li2S2.45 The cell with polar PVDF separator delivers a high initial discharge capacity of 1048 mA h g−1 at a current corresponding to 0.05C; that capacity is lower than the theoretical specific capacity of S8 (1675 mA h g−1), corresponding to incomplete utilisation of sulfur at the cathode, but this capacity is much higher than the corresponding initial value when PP separator is used (312 mA h g−1) (Fig. 4(b)). In the first charge with polar PVDF as separator, a capacity of 980 mA h g−1 is reached at 0.05C, which corresponds to an initial coulombic efficiency of 93%. We consider that lost (irreversible) capacity is due to some of the generated polysulfide diffusing out from the electrode during discharge and not being able to reform elemental sulfur during charge. Irreversible capacity is accompanied by formation of the solid electrolyte interphase which results from decomposition of solvent and additives.46,47 In contrast to the first cycle, the discharge capacity for 2nd and 3rd cycles was 905 and 912 mA h g−1, respectively. The coulombic efficiency for 2nd and 3rd cycles was found to be 100 and 99%, respectively. The capacity becomes stable after the 10th and following cycles, a capacity of 804 mA h g−1 being obtained for the 50th cycle (Fig. S3, ESI†). It is noteworthy that, after the first cycle, the coulombic efficiency increases to 100% and remains >99% in following cycles (Fig. S3, ESI†). The rapid stabilization of the coulombic efficiency denotes a quick and efficient stabilization of the SEI on the Li anode surface. Compared to cells with PP separator, the batteries with PVDF separator exhibit longer discharge plateaus, especially the ∼2.1 V plateau, which indicates that utilization of active material is enhanced and that shuttling of polysulfides is greatly suppressed, confirming the research hypothesis.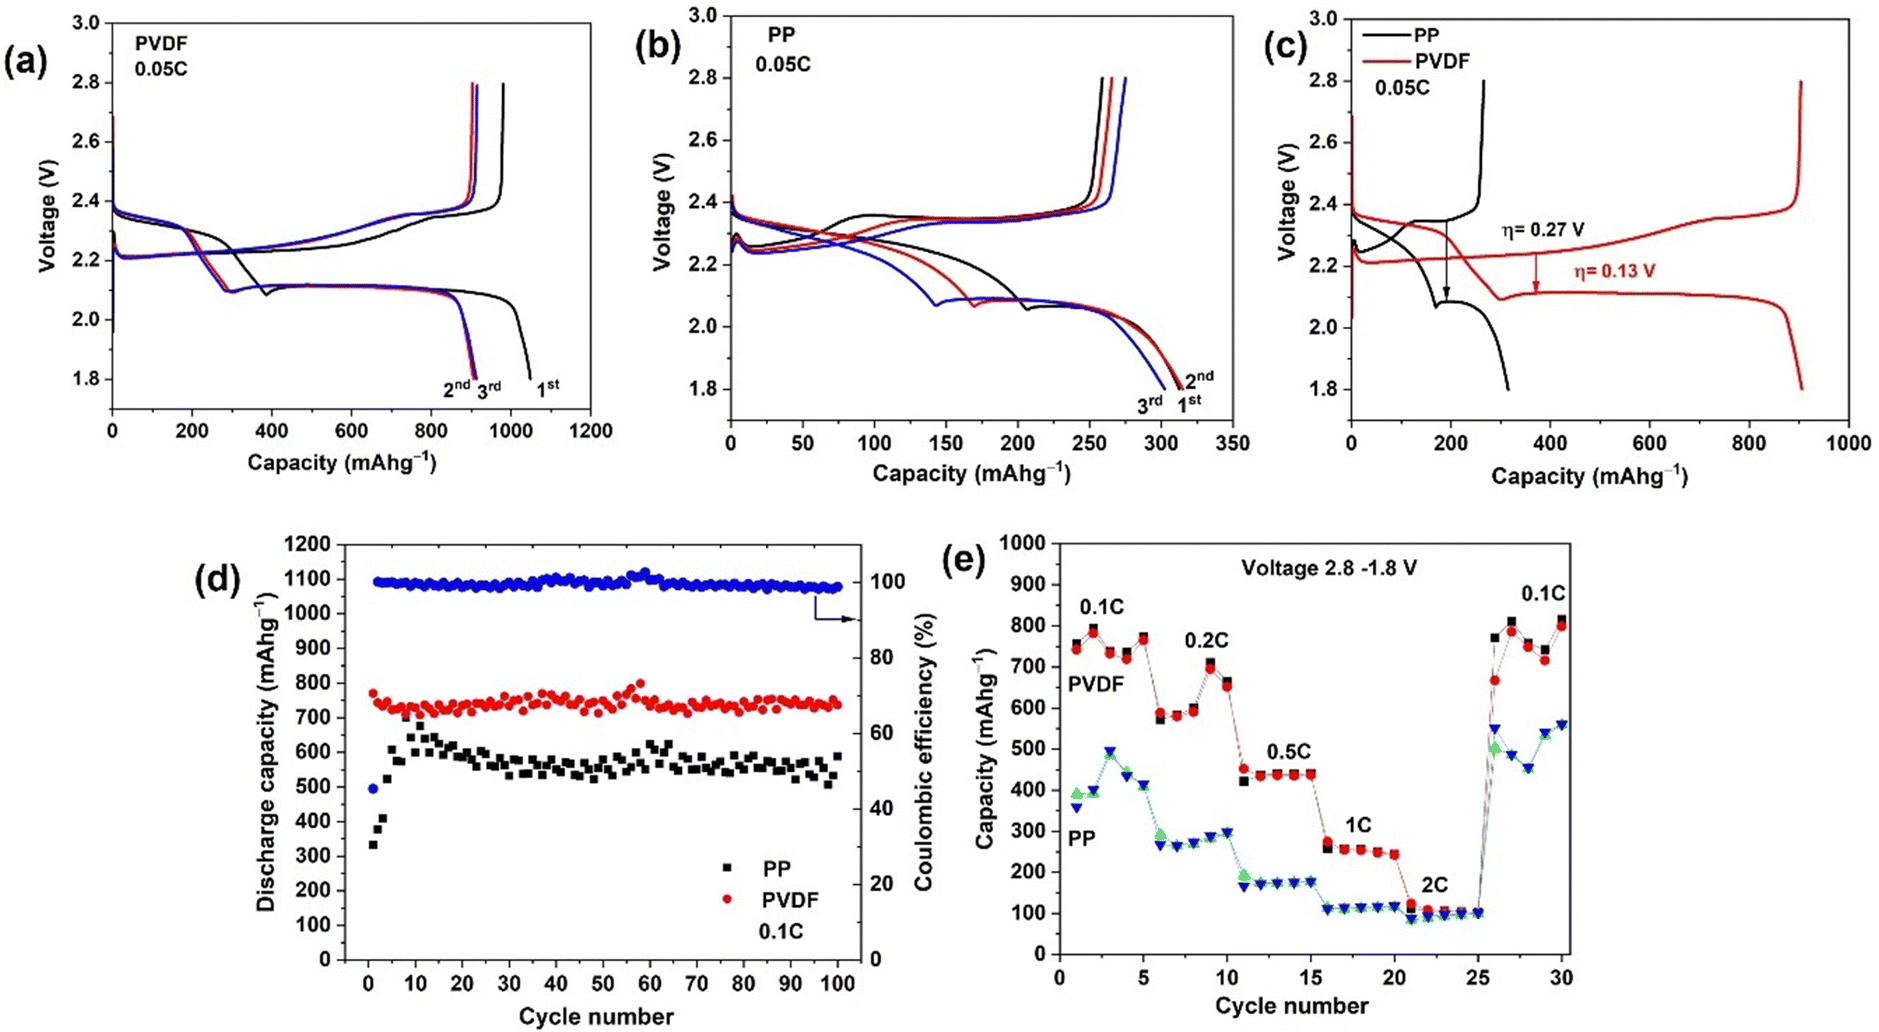 | ||
| Fig. 4 Initial discharge/charge voltage profiles of a Li–S battery at current rates of 0.05C using (a) PVDF and (b) PP separator. Also (c) galvanostatic discharging/charging performance of Li–S batteries with different separators at 0.05C and (d) cycling performance of the Li–S batteries with different separators at 0.1C, (e) rate capability performance of Li–S batteries with different separators at various current rates ranging from 0.1 to 2C, and returning to 0.1C. | ||
The first discharge capacity with the PP separator is 312 mA h g−1, only 18% of the theoretical capacity. In the subsequent cycles, the discharge capacity increases and stabilizes after 25 cycles. This growth of capacity to a stable value corresponds to a conditioning of the Nanomyte cathode in cells with PP separator. For fairness in comparing the performance of the 2 separator types, later comparisons of performance will focus on the stabiilsed capacities after ≥10 cycles (considerably higher for PP than obtained in earlier cycles). A capacity of 600 mA h g−1 is obtained for the 50th cycle, which is still 200 mA h g−1 less than that with the PVDF separator (Fig. S3, ESI†). A low electrochemical activity in the initial cycles is common for LSB cells with PP (Celgard) separators, as observed in previous studies e.g. ref. 48 The initial increase results from the activation of the cathode upon the diffusion of the electrolyte into the cathodes. This behavior could be related to a limited use of active material in the early cycling, at the surface and near the surface region. Upon cycling, the active material's reactivity seems to gradually increase from the surface region to bulk through an activation process. This activation process is not evident with the PVDF separator, possibly due to that material's significantly higher electrolyte uptake and porosity.
The initial galvanostatic charge/discharge curves at 0.05C for cells assembled with PP and PVDF separators are compared in Fig. 4(c). The polarisation voltage difference, η, for the right-hand plateau during the first complete cycle is much smaller for the cell with PVDF (η = 0.13 V) than for that with PP (η = 0.32 V), corresponding to lowered polarisation losses.
The cycling performances of the LSB cells with PP and PVDF separator at a rate of 0.1C are shown in Fig. 3(d). The PVDF separator yields an excellent discharge capacity and much improved cycling performance (742 mA h g−1 after 100 cycles) relative to cells with PP separator (589 mA h g−1 after 100 cycles). The polarised PVDF nanofiber film provides a highly porous structure with abundant mesopores in the separator, resulting in excellent electrochemical performance and less active material loss overall Coulombic efficiency during the first cycle for cells with PVDF was only 45% (Fig. 4(d)) and, as above, the irreversible capacity is likely to be related to the irreversible formation of the SEI from electrolyte decomposition. In the second and subsequent cycles, the coulombic efficiency increases to approximately 100% and that value persists in later cycles. The result shows that the polarised PVDF is a favorable separator, improving cycling performance of LSB systems. The LSB with PP separator also shows a similar pattern of coulombic efficiencies on cycling (Fig. S5, ESI†). However, for the cells with PP the capacity was around 200 mA h g−1 less than that with polar PVDF throughout cycling, due to the latter separator suppressing polysulfide shuttling.
The rate capability of the differing LSB cells was quantified by power cycling. As shown in Fig. 4(e), the PVDF-containing cell delivers a reversible specific capacity of 742, 588, 452, 274, and 124 mA h g−1 at 0.1, 0.2, 0.5, 1 and 2C, respectively. When the charge/discharge rate is returned to 0.1C from higher rates, the cell recovers a specific capacity of 771 mA h g−1, which is slightly higher than that originally characteristic of the 0.1C rate. The cell with PP separator delivered much lower specific capacity (390 mA h g−1) at the initial 0.1C rate but later also recovered to a higher specific capacity (503 mA h g−1) on returning to 0.1C. It should be noted that, for both separators, an increase in capacity at 0.2C was also obtained when switching back from a 2C rate, meaning that an electrochemical activation process is happening at higher C rates. In addition, both separators lead to high, stabilized capacities at high C rates such as 0.2, 0.5, 1 and 2C. A decrease in capacity with increasing C rate is typically observed in power cycling studies (see e.g. ref. 30). That decreasing trend corresponds to kinetically slow processes (such as S deposition in micropores) not having had time to take place at that charge rate (a diffusion limitation). Once cycling is returned to low C rates, such as 0.1C in this study, those processes have time to occur and the capacity is restored.
Impedance behaviour of the LSB cells during cycling
Impedance behaviour of LSBs during cycling was analysed using electrochemical impedance spectroscopy (EIS). Fig. 5 (overleaf) shows the Nyquist plots with corresponding equivalent circuits for lithium–sulfur cells using differing separators and before and after cycling. The fitted component values are given in Tables S1 and S2 (ESI†).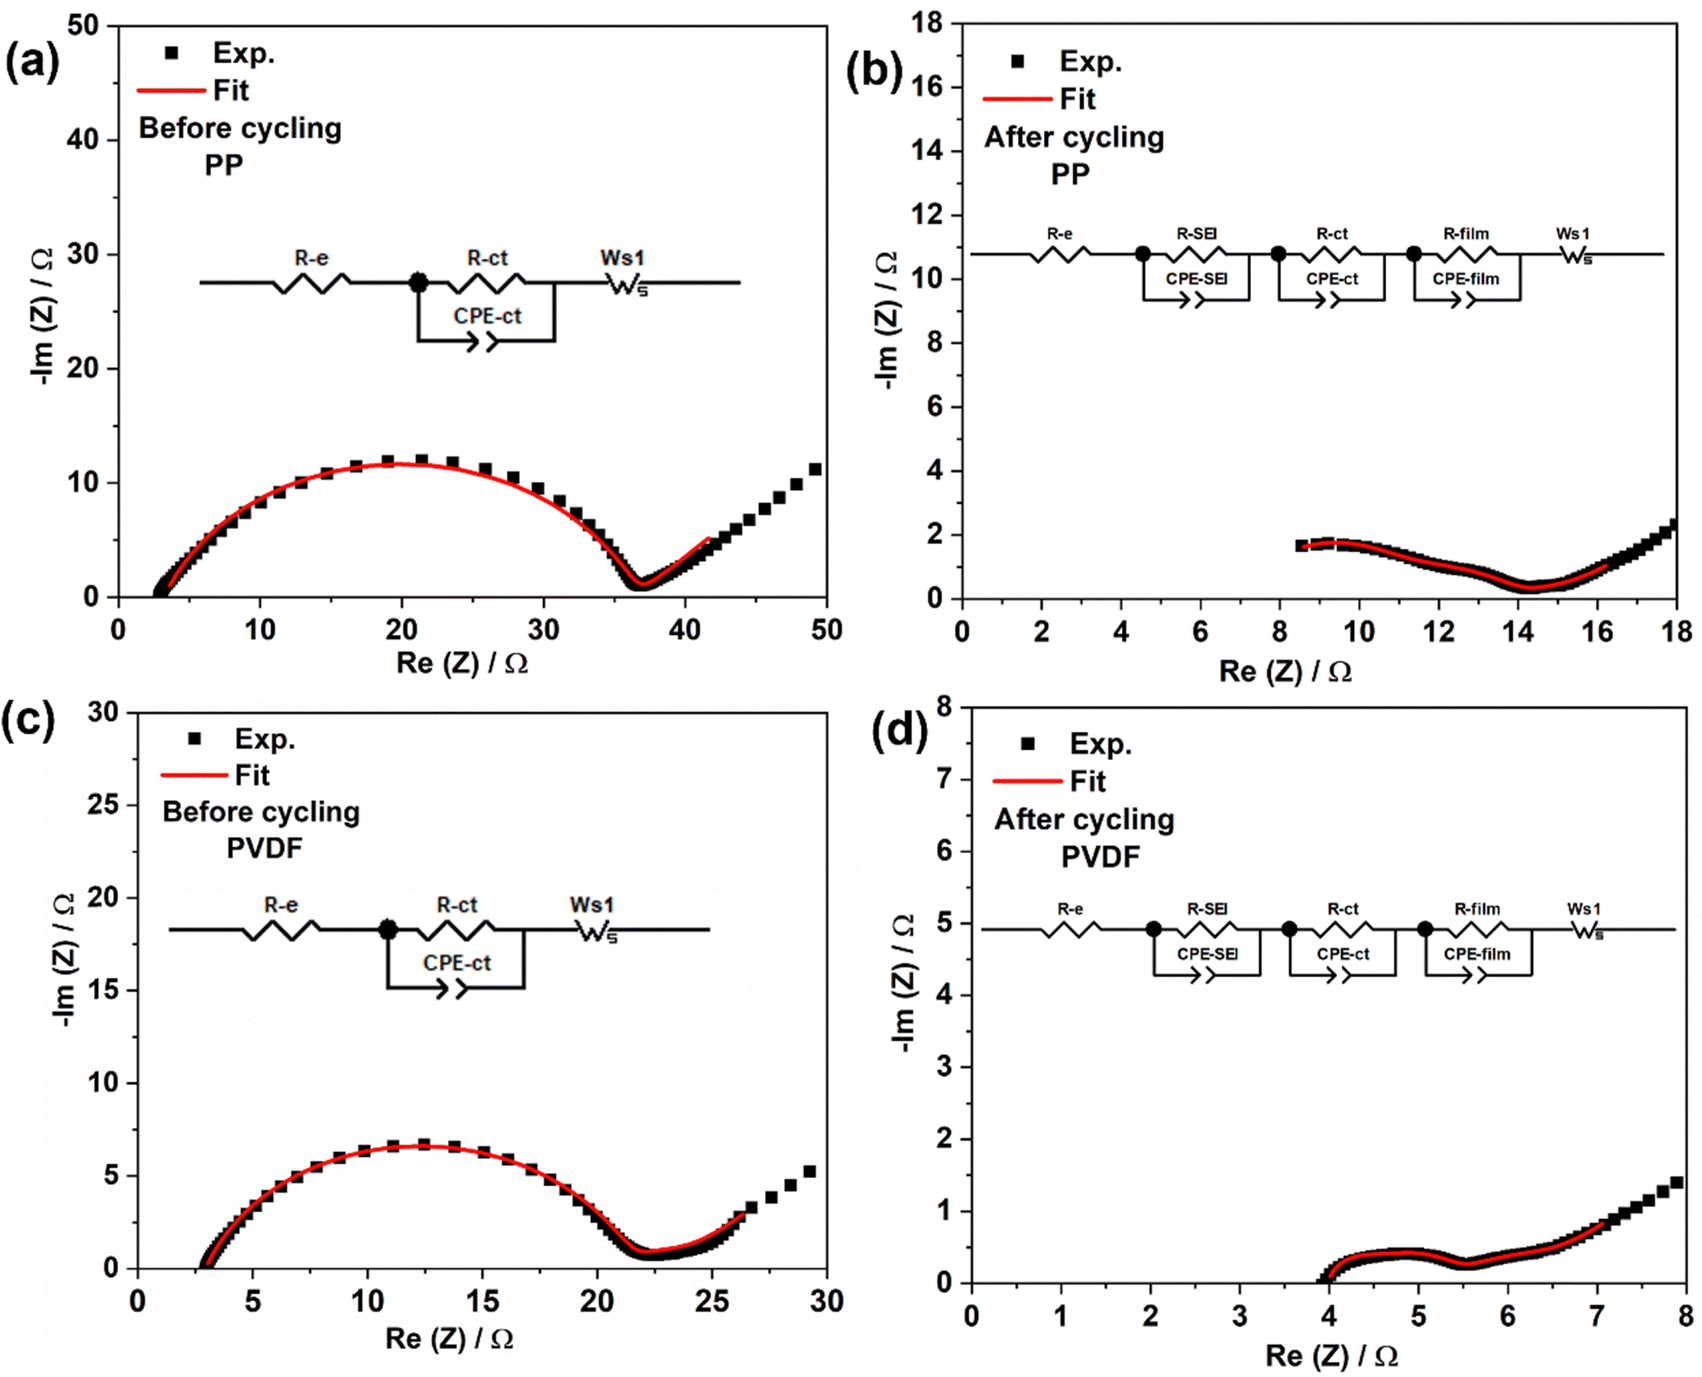 | ||
| Fig. 5 Nyquist plots for LSB cells before and after cycling with (a), (b) PP and (c), (d) PVDF separators. The equivalent circuit parameters: R-e = electrolyte resistance, R-ct = charge-transfer resistance, R-SEI = resistance of solid electrolyte interphase, R-film related to Li2S/Li2S2 film, and Ws. CPE-ct, CPE-sd, CPE-SEI and CPE-film represent constant phase elements associated with R-ct, R-SEI and R-film respectively. | ||
Referring to Fig. 5, R-e is the bulk resistance of the cell, which represents the combined resistances of the electrolyte, separator, and electrodes. R-ct and CPE-ct charge-transfer resistance and related constant phase element, respectively, while Ws1 is the Warburg impedance related to the diffusion of ions in the electrode material.49 Before cycling, the impedance spectra are very clear, both spectra consisting of a single depressed semicircle at high frequencies and a tilted straight line at low frequencies. The semicircle corresponds to charge transfer resistance, while the straight line is related to Warburg impedance.50 By using the equivalent circuit presented in the insets of Fig. 5(a) and (c), the values of R-e, and R-ct can be estimated from data modelling, leading to the component values in Tables S1 and S2 (ESI†). The LSBs with PVDF show slightly less charge transfer resistance when compared to those with PP separator, again indicating that polarised PVDF is wetted well by the electrolyte. After cycling, impedance spectra for both cell types consist of three depressed semicircles which correspond to solid electrolyte interphase (SEI) resistance, charge transfer resistance, and Li2S/Li2S2 film resistance, respectively. The inclined lines at low frequencies are ascribed to the diffusion of ions in the sulfur electrode. By using the equivalent circuits described in Fig. 5(b) and (d), the values for R-e, R-ct, R-SEI and R-film can be estimated from data fitting, as summarized in Tables S1 and S2 (ESI†).
After cycling, a slight increase in R-e for both cell types (Table S1, ESI†) may be due to the inevitable dissolution of active material from the cathode body, which increases the ionic strength of the electrolyte and can lead to the shuttle effect during the discharge process.51 The charge transfer resistance for both separators was then significantly reduced as to before compared to before cycling (Table S1, ESI†). The reduction in the charge-transfer resistance of the sulfur cathode is relevant to the limited presence of lithium sulfide in the carbon's micropores.52,53 Further, the smaller radius of the “semicircle” after cycling indicates that the electrode was fully wetted and that the impedance gradually decreased during the activation of the cell. The total resistance of cells is decreased after cycling, due to the decrease in charge transfer resistance.
Two resistances, from SEI and from Li2S/Li2S2 film, can be identified from EIS spectra. The SEI is usually formed after reaction of solvent molecules during cycling. The Li2S/Li2S2 film forms at the cathode on discharge; the film at the surface of the electrode can become inactive due to delamination of electronic and ionic additives. In addition, an Li2S film can also form on the Li anode from chemical reaction with polysulfides shuttled from the cathode.54 It is worth noting that resistance corresponding to the precipitated film was less in the PVDF case than that with PP, the lower shuttling of higher order polysulfides leading to less formation of solid Li2S film at the anode, thereby resulting in the associated lower resistance. The total resistance for cells with polar PVDF (8.7 ohm) was half of that for those with PP (16.6 ohm), indicating that the PVDF separator, with abundant polarity, facilitates Li+ diffusion. In summary, polarised nanofiber PVDF film can adsorb polysulfides and mitigate polysulfide crossover, promoting cationic conduction, reducing each of (i) formation of insulating film, (ii) active-material loss and (iii) capacity fading.
Further discussion
In their review, He et al.30 include examples of studies utilising electrospun PVDF separators in LIB devices and also of electrospun composites of various type (e.g. 2 or more constituent polymers). It should, however, be noted that the latter option would be a commercially very expensive choice and that LIBs do not suffer from a polysulfide-type shuttling issue.Zhu et al.55 report use of electrospun rGO-PVDF separator in the context of LSBs (rGO = reduced graphene oxide). As above, the composite/multicomponent option would be an expensive target for commercial application. Further, rGO itself is also expensive. The current study has shown the potential of electrospun PVDF-only material for use specifically in LSBs, where cells with nanofiber membranes of this type significantly outperform (in terms of both capacity and polarisation losses) otherwise identical cells containing current commercial (PP) separator.
Conclusions
A highly polarised, electrospun-nanofiber PVDF separator film with controlled phase composition has been developed for Li–S batteries (LSBs). PVDF nanofiber separators provide an electric field that interacts with the electrolyte ions, providing a barrier to the negatively charged polysulfides, restraining the crossover of polysulfides into the anode compartment. With polar separator, the electrochemical performances of LSBs are significantly improved relative to otherwise identical cells using a standard, commercial polyolefin film (Celgard 2400) and the same commercial cathode. The PVDF-containing cells exhibit high coulombic efficiency, with very stable GDC cycling and a high retention of charge storage capacity (95%) over 100 cycles.A visual test demonstrated the polar PVDF film's ability to mitigate polysulfide crossover. The high electrolyte uptake (up to 95%) for PVDF separator shows high mass-transfer of cations into the cathode, which facilitates fast Li+ diffusion within the cathode. In addition, the electrolyte-loaded nanofibrous separator showed excellent effective ionic conductivity at 1.5 × 10⁻² S cm−1, which was much higher than that obtained when using commercial PP separator.
The hypothesis that a polar PVDF film will hinder the polysulfide-shuttling effect has been verified through a variety of physicochemical characterizations and by electrochemical studies of LSB cells. Polar PVDF film separators could have great potential in developing practical LSB technology.
Author contributions
Conceptualisation, V. S., C. C. and R. C. T. S.; methodology, I. M. and L. B.; investigation, I. M. and L. B.; writing – original draft preparation, I. M.; writing – review and editing, V. S., C. C. and R. C. T. S. All authors have read and agreed to the published version of the manuscript.Conflicts of interest
The authors declare that they have no known competing financial interests or personal relationships that could have appeared to influence the work reported in this paper.Acknowledgements
The authors gratefully acknowledge financial support for conducting Li–S battery research under the Lithium–Sulfur Technology Accelerator (LiSTAR) programme funded by The Faraday Institution (grant FIRG014).References
- D. Lin, Y. Liu and Y. Cui, Nat. Nanotechnol., 2017, 12, 194–206 CrossRef CAS PubMed.
- P. G. Bruce, S. A. Freunberger, L. J. Hardwick and J.-M. Tarascon, Nat. Mater., 2011, 11, 19–29 CrossRef PubMed.
- S. S. Zhang, J. Power Sources, 2013, 231, 153–162 CrossRef CAS.
- X. Ji, K. T. Lee and L. F. Nazar, Nat. Mater., 2009, 8, 500–506 CrossRef CAS PubMed.
- A. Manthiram, Y. Fu and Y.-S. Su, Acc. Chem. Res., 2013, 46, 1125–1134 CrossRef CAS PubMed.
- T. Chen, W. Kong, P. Zhao, H. Lin, Y. Hu, R. Chen, W. Yan and Z. Jin, Chem. Mater., 2019, 31, 7565–7573 CrossRef CAS.
- Q. He, X. Xu, Y. Zhao, X. Liu, C. Zhou, D. Ai, L. Xia and L. Mai, Adv. Mater., 2018, 30, e1804089 CrossRef PubMed.
- L. Ma, R. Chen, G. Zhu, Y. Hu, Y. Wang, T. Chen, J. Liu and Z. Jin, ACS Nano, 2017, 11, 7274–7283 CrossRef CAS PubMed.
- Y. Chen, S. Choi, D. Su, X. Gao and G. Wang, Nano Energy, 2018, 47, 331–339 CrossRef CAS.
- J. T. Lee, Y. Zhao, S. Thieme, H. Kim, M. Oschatz, L. Borchardt, A. Magasinski, W. Cho, S. Kaskel and G. Yushin, Adv. Mater., 2013, 6, 4573–4579 CrossRef PubMed.
- S. Li, T. Mou, G. Ren, J. Warzywoda, Z. Wei, B. Wang and Z. Fan, J. Mater. Chem. A, 2017, 5, 1650–1657 RSC.
- X.-Q. Niu, X.-L. Wang, D. Xie, D.-H. Wang, Y.-D. Zhang, Y. Li, T. Yu and J.-P. Tu, ACS Appl. Mater. Interfaces, 2015, 7, 16715–16722 CrossRef CAS PubMed.
- T. Zhang, M. Hong, J. Yang, Z. Xu, J. Wang, Y. Guo and C. Liang, Chem. Sci., 2018, 9, 8829–8835 RSC.
- T. Li, Y. Lv, J. Su, Y. Wang, Q. Yang, Y. Zhang, J. Zhou, L. Xu, D. Sun and Y. Tang, Adv. Sci., 2017, 4, 1700226 CrossRef PubMed.
- X. Liang, Y. Rangom, C. Y. Kwok, Q. Pang and L. F. Nazar, Adv. Mater., 2017, 29, 1603040 CrossRef PubMed.
- F. Wu, E. Zhao, D. Gordon, Y. Xiao, C. Hu and G. Yushin, Adv. Mater., 2016, 28, 6365–6371 CrossRef CAS PubMed.
- J. Zhou, R. Li, X. Fan, Y. Chen, R. Han, W. Li, J. Zheng, B. Wang and X. Li, Energy Environ. Sci., 2014, 7, 2715–2724 RSC.
- X. Wang, T. Gao, X. Fan, F. Han, Y. Wu, Z. Zhang, J. Li and C. Wang, Adv. Funct. Mater., 2016, 26, 7164–7169 CrossRef CAS.
- X. Liu, J.-Q. Huang, Q. Zhang and L. Mai, Adv. Mater., 2017, 29, 1601759 CrossRef PubMed.
- J. Gao, M. A. Lowe, Y. Kiya and H. D. Abruña, J. Phys. Chem. C, 2011, 115, 25132–25137 CrossRef CAS.
- L. X. Yuan, J. K. Feng, X. P. Ai, Y. L. Cao, S. L. Chen and H. X. Yang, Electrochem. Commun., 2006, 8, 610–614 CrossRef CAS.
- J. Wang, S. Y. Chew, Z. W. Zhao, S. Ashraf, D. Wexler, J. Chen, S. H. Ng, S. L. Chou and H. K. Liu, Carbon, 2008, 46, 229–235 CrossRef CAS.
- J. Hassoun and B. Scrosati, Adv. Mater., 2010, 22, 5198–5201 CrossRef CAS PubMed.
- J. Zhu, M. Yanilmaz, K. Fu, C. Chen, Y. Lu, Y. Ge, D. Kim and X. Zhang, J. Membr. Sci., 2016, 504, 89–96 CrossRef CAS.
- H. Yao, K. Yan, W. Li, G. Zheng, D. Kong, Z. W. Seh, V. K. Narasimhan, Z. Liang and Y. Cui, Energy Environ. Sci., 2014, 7, 3381–3390 RSC.
- J. Li, Z. Xiao, A. Chen, W. Zhang, D. Zhu, Y. Jin, Q. Mao, G. Wang, J. He and Y. Xia, Front. Energy Res., 2020, 8, 593640 CrossRef.
- J. Li, L. Dai, Z. Wang, H. Wang, L. Xie, J. Chen, C. Yan, H. Yuan, H. Wang and C. Chen, J. Energy Chem., 2022, 67, 736–744 CrossRef CAS.
- Y. Chen, G. Zhou, W. Zong, Y. Ouyang, K. Chen, Y. Lv, Y.-E. Miao and T. Liu, Compos. Commun., 2021, 25, 100679 CrossRef.
- P. Martins, A. C. Lopes and S. Lanceros-Mendez, Prog. Polym. Sci., 2014, 39, 683–706 CrossRef CAS.
- R. Liu, B. Yuan, S. Zhong, J. Liu, L. Dong, Y. Ji, Y. Dong, C. Yang and W. He, Nano Select, 2021, 2, 2308–2345 CrossRef CAS.
- Q. S. Fu, G. Lin, X. D. Chen, Z. X. Yu, R. S. Yang, M. T. Li, X. G. Zeng and J. Chen, Energy Technol., 2018, 6, 14 Search PubMed.
- X. Xue, S. Wang, W. Guo, Y. Zhang and Z. L. Wang, Nano Lett., 2012, 12, 5048–5054 CrossRef CAS PubMed.
- M. Kundu, C. M. Costa, J. Dias, A. Maceiras, J. L. Vilas and S. Lanceros-Méndez, J. Phys. Chem. C, 2017, 121, 26216–26225 CrossRef CAS.
- W. G. Buxton, S. G. King and V. Stolojan, Energy Environ. Mater., 2023, 6, e12363 CrossRef CAS.
- S. Choi, Y. S. Lee, C. W. Joo, S. G. Lee, J. K. Park and K. Han, Electrochim. Acta, 2004, 50, 339–343 CrossRef CAS.
- K. Hwang, B. Kwon and H. Byun, J. Membr. Sci., 2011, 378, 111–116 CrossRef CAS.
- L. Kong, B. Liu, J. Ding, X. Yan, G. Tian, S. Qi and D. Wu, J. Membr. Sci., 2018, 549, 244–250 CrossRef CAS.
- I. Ismail, N. F. A. Bakar, T. H. Ling, N. Ideris, Z. H. M. Rain and N. Radacsi, Mater. Today: Proc., 2019, 17, 574–583 CAS.
- M. T. Riosbaas, K. J. Loh, G. O’Bryan and B. R. Loyola, Sensors and Smart Structures Technologies for Civil, Mechanical, and Aerospace Systems, 2014, vol. 9061, pp. 235–245 Search PubMed.
- X. Li, Y. Wang, T. He, Q. Hu and Y. Yang, J. Mater. Sci.: Mater. Electron., 2019, 30, 20174–20180 CrossRef CAS.
- U. Stachewicz, J. F. Dijksman, C. Soudani, L. B. Tunnicliffe, J. J. C. Busfield and A. H. Barber, Eur. Polym. J., 2017, 91, 368–375 CrossRef CAS.
- B.-C. Yu, K. Park, J.-H. Jang and J. B. Goodenough, ACS Energy Lett., 2016, 1, 633–637 CrossRef CAS.
- Y. Yang and J. Zhang, Adv. Energy Mater., 2018, 8, 1870111 CrossRef.
- V. Augustyn, J. Come, M. A. Lowe, J. W. Kim, P.-L. Taberna, S. H. Tolbert, H. D. Abruña, P. Simon and B. Dunn, Nat. Mater., 2013, 12, 518–522 CrossRef CAS.
- J. Dong, Y. Jiang, Q. Li, Q. Wei, W. Yang, S. Tan, X. Xu, Q. An and L. Mai, J. Mater. Chem. A, 2017, 5, 10827–10835 RSC.
- Y. He, S. Bai, Z. Chang, Q. Li, Y. Qiao and H. Zhou, J. Mater. Chem. A, 2018, 6, 9032–9040 RSC.
- A. L. Michan, G. Divitini, A. J. Pell, M. Leskes, C. Ducati and C. P. Grey, J. Am. Chem. Soc., 2016, 138, 7918–7931 CrossRef CAS PubMed.
- D. Aurbach, E. Pollak, R. Elazari, G. Salitra, C. S. Kelley and J. Affinito, J. Electrochem. Soc., 2009, 156, A694 CrossRef CAS.
- J. Liao and Z. Ye, Batteries, 2018, 4, 22 CrossRef.
- N. A. Cañas, K. Hirose, B. Pascucci, N. Wagner, K. A. Friedrich and R. Hiesgen, Electrochim. Acta, 2013, 97, 42–51 CrossRef.
- J. Chen, Z. Bian, M. Wu, M. Gao, J. Shi, M. Duan, X. Guo, Y. Liu, J. Zhang and Q. Kong, ChemElectroChem, 2020, 7, 4209–4217 CrossRef CAS.
- J. Li, J. Zhou, T. Wang, X. Chen, Y. Zhang, Q. Wan and J. Zhu, Nanoscale, 2020, 12, 8991–8996 RSC.
- J. Cheng, Z. Wang, H. Song, X. Zhong and J. Wang, Ionics, 2021, 27, 3271–3279 CrossRef CAS.
- Z. Liu, S. Bertolini, P. B. Balbuena and P. P. Mukherjee, ACS Appl. Mater. Interfaces, 2016, 8, 4700–4708 CrossRef CAS PubMed.
- P. Zhu, J. D. Zhu, J. Zang, C. Chen, Y. Lu, M. J. Jaing, C. Y. Yan, M. Dirican, R. K. Selvan and X. W. Zhang, J. Mater. Chem. A, 2017, 5, 15096–15104 RSC.
Footnote |
| † Electronic supplementary information (ESI) available. See DOI: https://doi.org/10.1039/d3ya00392b |
| This journal is © The Royal Society of Chemistry 2024 |