 Open Access Article
A route to selectively increase the microporous structure of zeolite and its optimization in the ethanol to butadiene reaction†
Tian
Ye
a,
Yuhao
Bai
a,
Kewei
Wang
a,
Weijie
Hu
 *b,
Meng
Zhang
 *a and
Li-Ming
Wu
 c
c
aSchool of Chemical Engineering and Technology, Sun Yat-sen University, Zhuhai 519082, Guangdong, PR China. E-mail: zhangm85@mail.sysu.edu.cn
bSchool of Chemistry, Guangdong University of Petrochemical Technology, Maoming 525000, Guangdong, PR China. E-mail: huweijie@gdupt.edu.cn
cCollege of Chemistry, Beijing Normal University, Beijing, 100875, PR China
First published on 19th September 2023
Abstract
Control over the pore structure of zeolite is very important, so researchers are trying to regulate the pore structure of zeolite through various methods to endow it with better performance in industrial applications. Here, a confined etching route that could selectively increase the microporous structure of zeolite is developed using ethanol/amine buffer solution. Ethanol is introduced into an aqueous amine solution, where it could decrease the migration rate and concentration of hydroxyl ions which can etch the framework atoms of zeolite to fabricate various porous structures, consequently developing a confined etching route that could selectively increase the microporous structure of zeolite, unlike conventional approaches that generally increase mesoporous and macroporous architectures. In addition, ethanol enhances the solubility of amine in water, and a buffer solution (ethanol/amine) is formed, which is able to release hydroxyl ions continuously. Based on the above confined etching route, a micropore-increased beta crystal is synthesized and when used as a carrier in ZnLaY/beta catalysts, it achieves excellent ethanol conversion of 96.04% and butadiene selectivity of 64.22% in 20 h time-on-stream in an ethanol to butadiene reaction.
Keywords: Ethanol; Confined etching route; Micropore-increased; Beta zeolite; Ethanol to butadiene.
1 Introduction
Zeolites have crystalline structures, uniform pore channels and high surface areas, and they have been widely used for diverse applications, including catalysis,1–3 separation,4 ionic exchange, etc.5–7 The porous structure of zeolite has a significant influence on product selectivity and catalyst lifetime,8–10 and researchers are trying hard to modulate the pore structure of zeolite.Wang et al. developed a strategy to form uniform mesoporosity in Zr-incorporated beta zeolite using tetraethylammonium hydroxide and surfactants. In this process, OH− etched the zeolite framework and the mesopore size could be tailored by changing the alkyl chain length of the surfactants.11 Mesoporous ZSM-5 zeolite catalysts were prepared by desilication upon heating in aqueous solutions of tetrapropylammonium and tetrabutylammonium hydroxide, and compared with NaOH leaching. Silicon dissolution in organic hydroxides was much slower than in NaOH, making the demetallation process highly controllable. Treatment in organic hydroxides was less selective for silicon extraction, hence a higher amount of aluminum was leached into solution compared to NaOH treatment. The differences in porosity development and chemical composition of the zeolite were attributed to the effect of the cation.12 Using an effective and environmentally friendly method, H2O2 microexplosion under microwave irradiation, MCM-68 zeolite materials with abundant mesopores were successfully prepared. H2O2 molecules diffused into zeolite crystals could release a large amount of gas under microwave irradiation and generate mesopores from inside the crystals to the outside. The mesopore volume of hierarchical MCM-68 zeolites can be up to 0.19 cm3 g−1.13 In 2021, a mixed solution of NaOH and cetyltrimethylammonium bromide was used to construct intracrystalline mesoporosity in beta zeolite. Several factors in the preparation process were investigated, such as treatment time, hydrothermal temperature, alkali concentration, and surfactant concentration. Mesoporous beta zeolite incorporated with Zr was used as the catalyst for ethanol–acetaldehyde conversion. The total conversion increased by 10%, while butadiene selectivity was well maintained.14 With one organic amine, silicoaluminophosphate SAPO-34 zeolites with a certain amount of mesopores could also be prepared. Chen's group synthesized hierarchical SAPO-34 zeolites with mesoporous pores by etching zeolite crystals in organic amine aqueous solution coupled with a recrystallization process under hydrothermal conditions. The mesopore volume increased from 0 to 0.06 cm3 g−1.15 Tian et al. reported a general synthetic approach for aluminophosphate molecular sieves (LTA, AEL, and AFI zeotypes) with intracrystalline mesopores from highly homogeneous and concentrated precursors via oriented attachment and crystallographic fusion processes. These materials showed exceptional properties, including good monodispersity, abundant mesopores, and excellent thermal stability.16 Nickel-layered double hydroxide amalgamated Y-zeolite (NiLDH@YZ) hybrids were synthesized. The micropore volume and mesopore volume of NiLDH@YZ hybrids varied with the mass percent of zeolite, and they presented different catalytic activities in Glaser homocoupling reactions.17 In 2020, our group developed a green route for synthesizing an aluminosilicophosphate SAPO-34 crystal with abundant mesopores; this approach is green and low-cost because NaHCO3 is an inexpensive dietary alkali.18 Later, we also developed a simple in situ based etching method to synthesize aluminosilicophosphate SAPO-34 crystals with micropore, mesopore, and macropore architecture. The volume ratio of macropores, mesopores, and micropores could be appropriately regulated, and the volume percentage of mesopore and macropore could reach 88% in total pore volume.19
Generally, in research into modulating the porous structures of zeolite, mesopores or macropores were without exception introduced into the frameworks. How could only the microporous structure of zeolite be increased selectively? Perhaps mesopores or macropores are not welcome in some cases, because they might reduce the yield of zeolites and increase the selectivity for high olefins as by-products.
With increasing production of bioethanol from the fermentation of carbohydrate-rich biomass, the direct conversion of ethanol to butadiene (ETB) is becoming a promising process to produce butadiene, which is a monomer for the production of styrene–butadiene rubber and polybutadiene.20,21 The mechanism of ETB conversion has not yet been fully elucidated, but there is a consensus that the main reaction pathway consists of five steps: (a) ethanol dehydrogenation; (b) conversion of acetaldehyde to acetaldol via aldol condensation; (c) dehydration of acetaldol to crotonaldehyde; (d) transformation of crotonaldehyde and ethanol into crotyl alcohol via the Meerwein–Ponndorf–Verley (MPV) reaction; and (e) dehydration of crotyl alcohol to form butadiene,20,22 as shown in Scheme S1.† Among these reactions, ethanol dehydrogenation and aldol condensation are crucial. Mixed binary oxide compositions, e.g., SiO2 with MgO, ZrO2, HfO2, Y2O3, or Ta2O5, have been found to be effective for C–C bond formation, and these materials doped with d-metal (Zn, Cu, or Cr) are effective for the EtOH to butadiene reaction.21,23–25 Using Zn(NO3)2 and Y(NO3)3 as metal precursors, beta zeolite was impregnated with the metal nitrate aqueous solutions. ZnO/beta and Y2O3/beta catalysts were produced by calcination at 823 K in static air. ZnO/beta was found to be highly active for EtOH dehydrogenation, but exhibited little activity for the formation of C–C bonds and butadiene. By contrast, Y2O3/beta was highly active for C–C bond formation, but was relatively inactive for the dehydrogenation of EtOH to acetaldehyde. ![[triple bond, length as m-dash]](https://www.rsc.org/images/entities/char_e002.gif) Si–O–Zn–O–Si
Si–O–Zn–O–Si![[triple bond, length as m-dash]](https://www.rsc.org/images/entities/char_e002.gif) and
and ![[triple bond, length as m-dash]](https://www.rsc.org/images/entities/char_e002.gif) Si–O–Y(OH)–O–Si
Si–O–Y(OH)–O–Si![[triple bond, length as m-dash]](https://www.rsc.org/images/entities/char_e002.gif) groups together with the adjacent hydroxyl group constitute the active center.21
groups together with the adjacent hydroxyl group constitute the active center.21
In this contribution, ethanol is introduced into aqueous amine solution; a confined etching buffer solution is formed, which could selectively increase the micropores of zeolites without an increase in mesoporous and macroporous structures. It offers a new approach to control the porous structure of zeolite. ZnLaY/beta catalysts based on the micropore-increased beta crystal show excellent performance in the ethanol to butadiene reaction.
2 Results and discussion
2.1 Morphology analysis, textural and structural properties
Fig. 1 shows the scanning electron microscopy (SEM) images of all the beta zeolites. The Beta0 crystal (Fig. 1a) is the parent zeolite, which has not been etched by the ethanol/amine buffer solution. As for the Beta1 to Beta4 crystals (Fig. 1b–e), they have all been etched by the buffer solution with a gradual increase in treatment time. It is obvious that from Beta0 to Beta4 crystal, the surfaces of the zeolites appear rougher and rougher with the extension of etching time; many crystalline particles and pores could be clearly observed for the Beta2, Beta3 and Beta4 samples. Base treatment makes the surfaces of the crystals rough, which is consistent with many reports in the literature.26–28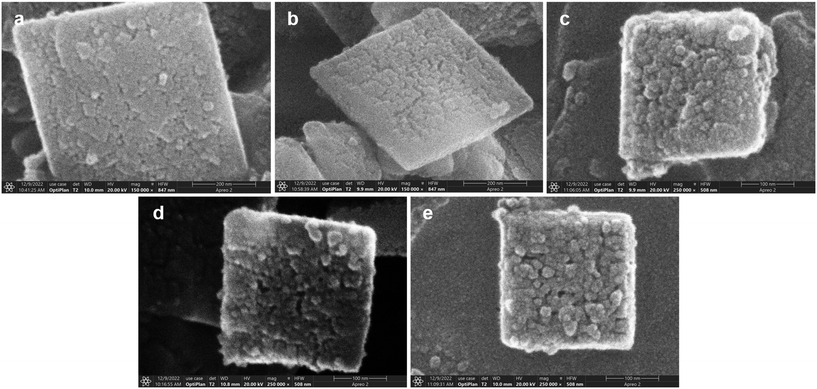 | ||
| Fig. 1 SEM images of all the beta crystals: (a) Beta0, (b) Beta1, (c) Beta2, (d) Beta3 and (e) Beta4. | ||
The transmission electron microscopy (TEM) pictures of all the beta crystals are presented in Fig. 2. It is obvious that base-treated crystals (Beta1 to Beta4) present more pores compared to the parent Beta0 crystal, a result that is consistent with the SEM images. Fig. 2c is the enlarged image of the rectangular region marked in Fig. 2b; the widths of these pores are about 1.9 nm.
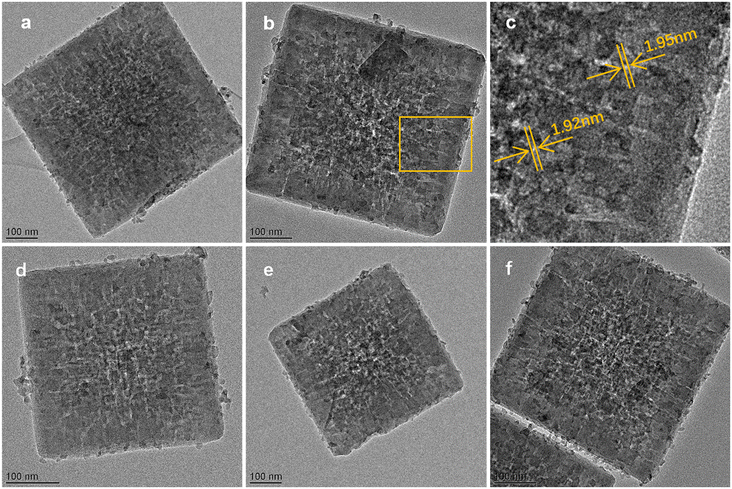 | ||
| Fig. 2 TEM images of all the beta crystals: (a) Beta0; (b) Beta1; (c) enlarged region of Beta1; (d) Beta2; (e) Beta3 and (f) Beta4. | ||
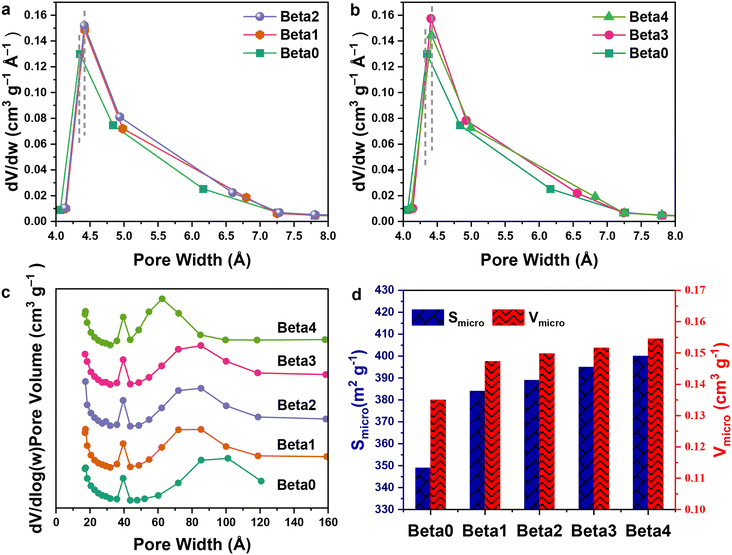
The porosity and surface area of all the beta crystals were investigated by N2 adsorption–desorption measurement (as shown in Fig. 3 and Table 1). For Beta0 zeolite, the majority of the micropore width is in the range 0.43 to 0.62 nm (Fig. 3a and b) and the micropore volume is about 0.135 cm3 g−1 (Fig. 3d). For Beta1 to Beta4 zeolites, the micropore widths and volumes all increase with buffer solution etching, because the hydroxide could dissolve Si sources in the microporous structure. The majority of their micropore widths are in the range 0.45 to 0.65 nm, and their micropore volumes are about 0.148 to 0.155 cm3 g−1. In the mesopore region, the mesopore widths of the crystals decrease gradually from Beta0 (the majority being 10 nm) to Beta4 (the majority being 6 nm; Fig. 3c).
| Sample | S micro (m2 g−1) | S meso (m2 g−1) | V total (cm3 g−1) | V micro (cm3 g−1) | V meso (cm3 g−1) | V micro/Vmeso | Hierarchy factord | Relative crystallinitye |
|---|---|---|---|---|---|---|---|---|
| a S micro (micropore area), Smeso (mesopore area) and Vmicro (micropore volume) were calculated using the t-plot method. b V total (total volume) is the single-point desorption total pore volume of the pores. c V meso (mesopore volume) = Vtotal − Vmic. d Hierarchy factor = (Vmicro/Vtotal) × (Smeso/SBET).31 e The relative crystallinity was calculated from the peak area at 2θ = 22.4° and the relative crystallinity of the parent beta (Beta0) was set to 100%. | ||||||||
| Beta0 | 349 | 91 | 0.2790 | 0.1350 | 0.1440 | 0.9375 | 0.100 | 100.00% |
| Beta1 | 384 | 80 | 0.2694 | 0.1473 | 0.1221 | 1.2064 | 0.094 | 103.77% |
| Beta2 | 389 | 94 | 0.2875 | 0.1498 | 0.1376 | 1.0887 | 0.101 | 105.20% |
| Beta3 | 395 | 82 | 0.2753 | 0.1516 | 0.1237 | 1.2255 | 0.095 | 105.34% |
| Beta4 | 400 | 95 | 0.2895 | 0.1545 | 0.1350 | 1.1444 | 0.102 | 106.29% |
Due to buffer solution etching, the micropore volumes, widths and surface areas increased from Beta0 to Beta4, while the mesopore widths decreased. It is proposed that the particles produced from the etching of micropores transferred to the mesopore region, where they repaired the mesoporous framework. An appropriate base treatment could lead to slight zeolite growth, which has been reported in several studies in the literature.19,29,30
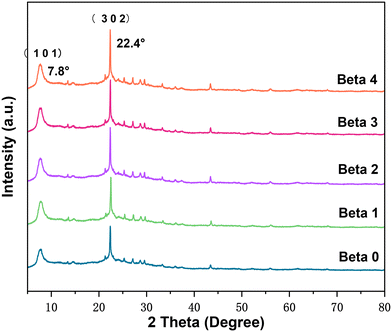
The XRD patterns of all the beta crystals are presented in Fig. 4. All the samples show the typical diffraction peaks of beta zeolite. It is interesting to note that with an extension of buffer solution etching time, the relative crystallinities (RC) of Beta0 to Beta4 gradually increase from 100% to 106.29%.
An appropriate base treatment could result in slight zeolite regrowth.30 The obvious crystallinity increase at 2θ = 22.4° should be attributed to the increase in micropore volume and decrease in mesopore width from Beta0 to Beta4 (Fig. 3 and Table 1), which could affect the intensity of the XRD peaks.32 The XRD patterns of the crystals are consistent with their N2 adsorption–desorption isotherms.
2.2 Proposed reason for the selective increase in micropore volume
The characteristics and formation process of the buffer solution were investigated to provide a reasonable explanation for why the ethanol/amine solution etching leads to a selective increase in micropore volume.With the addition of ethanol, triethylamine which was mostly located at the top of liquid mixture gradually dissolves in the solution; liquid layering finally disappears and an ethanol/amine buffer solution is produced (Fig. 5b). With an increase in the volume percent of ethanol, the pH value and electrical conductivity of the buffer solution gradually decrease (Fig. 5a), which means that the concentration and transport speed of hydroxide correspondingly become lower.33–35 It is inferred that the attraction between ethanol and amine makes the hydrolysis of triethylamine difficult, thus reducing the hydroxide concentration; the attraction between ethanol and hydroxide lowers OH− transport speed and contributes to the low electrical conductivity. The ethanol/amine buffer solution with limited etching capacity could selectively increase the microporous volume.
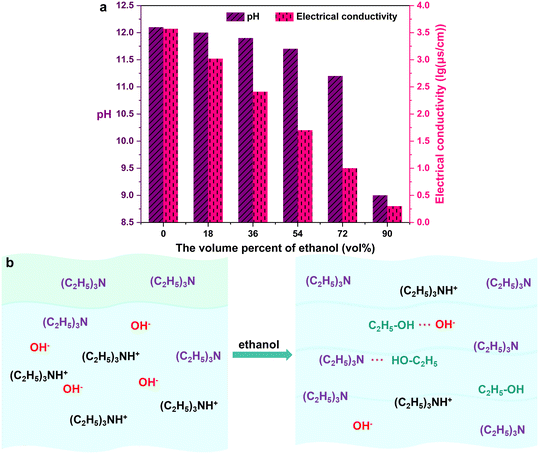 | ||
| Fig. 5 (a) pH and electrical conductivity of ethanol/amine buffer solution with different ethanol volume percent; (b) schematic diagram showing the formation process of ethanol/amine buffer solution. | ||
2.3 Catalytic performances of ZnLaY/beta catalysts
Yttrium nitrate hexahydrate, lanthanum nitrate hexahydrate and zinc silicate hemimorphite as metal precursors, are ground with beta zeolite. The catalysts are produced by calcination of the mixture at 400 °C in air. For concision, the catalysts are named ZnLaY/beta. It is reasonable to estimate that the metals exist as metal oxide species, which is consistent with the literature.21,36 Yet no characteristic peaks of bulk ZnO, La2O3 or Y2O3 are observed (Fig. 4), suggesting that the metal oxide species are dispersed on the beta zeolite or that the crystal sizes of the metal oxide species are lower than the detection limitation of XRD.The oxidation states of Zn, La and Y were determined by X-ray photoelectron spectroscopy (XPS), and the XP spectra are shown in Fig. S1.† For all the ZnLaY/beta catalysts, two peaks corresponding to Zn 2p 1/2 and Zn 2p 3/2 are observed (Fig. S1a†); and all the binding energies of Zn 2p 3/2 (1022.75–1022.97 eV) are higher than those of pure ZnO bulk, which suggests the formation of Zn–O–Si bonds.37 Four peaks are presented in Fig. S1b:† the peaks at about 855 and 852 eV are ascribed to doublet peaks of La 3d 3/2, the peaks at about 839 and 835 eV correspond to doublet peaks of La 3d 5/2.38 Similar to the ZnO species in the catalysts, all the binding energies of La 3d 5/2 doublet peaks (839.00–839.25 eV, 835.51–835.74 eV) are higher than those of the Y2O3 bulk, suggesting the formation of La–O–Si bonds. The bonding energy values of Y 3d 3/2 and Y 3d 5/2 are about 160 and 158 eV, respectively (Fig. S1c†); these higher bonding energy values compared to bulk Y2O3 are due to the formation of Y–O–Si bonds.39,40 The XPS results are consistent with the XRD analysis: there is no bulk ZnO, La2O3 or Y2O3 in any of the catalysts; the metal oxides species are dispersed on beta zeolite forming M–O–Si bonds.
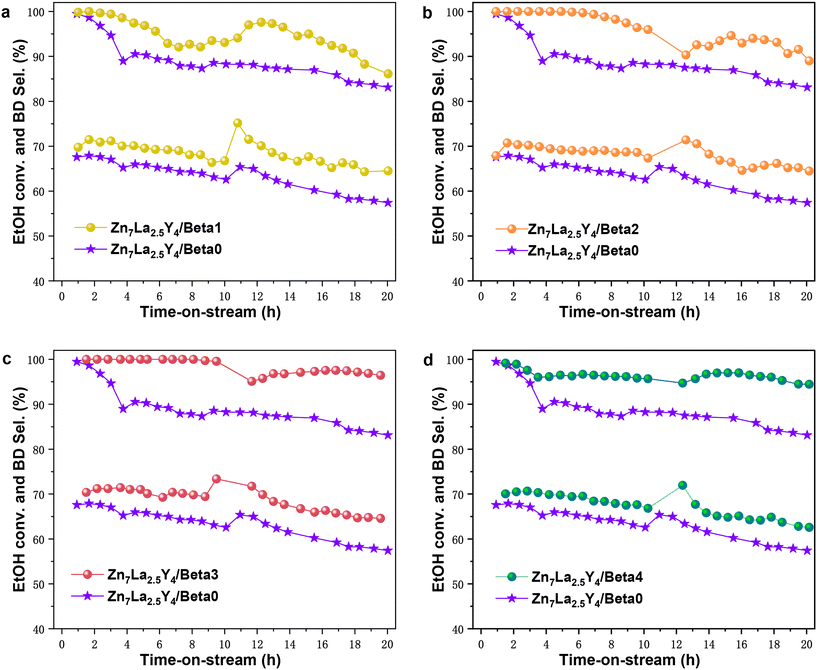
Catalytic tests of the ethanol to butadiene reaction were performed in a fixed-bed microreactor at 623 K over all the samples (Fig. 6). Buffer-solution-treated zeolites were used as carriers in the Zn7La2.5Y4/Beta1, Zn7La2.5Y4/Beta2, Zn7La2.5Y4/Beta3 and Zn7La2.5Y4/Beta4 catalysts, and untreated parent zeolite was used as a carrier in the Zn7La2.5Y4/Beta0 catalyst.
It is apparent that the Zn7La2.5Y4/Beta1, Zn7La2.5Y4/Beta2, Zn7La2.5Y4/Beta3 and Zn7La2.5Y4/Beta4 catalysts all present higher ethanol conversion and butadiene selectivity than the Zn7La2.5Y4/Beta0 catalyst. In particular, Zn7La2.5Y4/Beta3 shows the best catalytic performance of 99.56% ethanol conversion and 69.43% butadiene selectivity at TOS of 10 h; when the reaction time reaches 20 h, its ethanol conversion and butadiene selectivity are still 96.04% and 64.22% respectively. The excellent catalytic performance of Zn7La2.5Y4/Beta3 might be ascribed to two reasons (Fig. 7). First, it has a very large micropore volume (0.1516 cm3 g−1); second, its micropore volume/mesopore volume (1.226) is the highest.
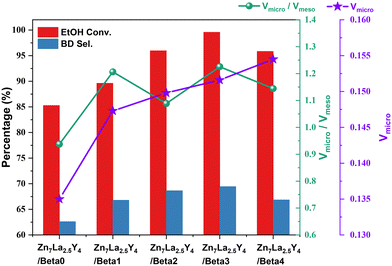 | ||
| Fig. 7 Ethanol conversion (10 h), butadiene selectivity (10 h), micropore volume and micropore volume/mesopore volume of all the catalysts. | ||
A larger micropore volume could decrease diffusion limitation and diffusion path length, which is beneficial for the catalytic performance of catalysts that are a long time on stream.41,42 Micropores could offer a better confinement effect for the formation of butadiene, while mesopores may produce carbon species with a larger space volume than butadiene;2,43 hence, it is reasonable that a high ratio of micropore volume to mesopore volume could improve the performance of catalysts in the ETB reaction. The catalytic performance of the regenerated catalyst was studied. The regenerated Zn7La2.5Y4/Beta3 catalyst after one use presents ethanol conversion of 86.82% and butadiene selectivity of 66.59% after 20 h time-on-stream in the ETB reaction; the butadiene yield had decreased to some extent compared with the corresponding fresh catalyst.
In this ETB reaction, Zn species are highly active for ethanol dehydrogenation and exhibit low activity for butadiene generation; Y species are active for C–C bond formation, but exhibit no activity for ethanol dehydrogenation.21 Y and La have the same electron distributions on the outermost layer and approximately equal atomic radii, so it is speculated that La species will show similar catalytic action to Y species. The great innovation of this work is the development of a route that could selectively increase the microporous structure of zeolite. The improvement in ethanol to butadiene performance is mainly due to control over the pore structure of zeolite, but less attention has been paid to the catalytic mechanism.
3 Conclusions
A route that could selectively increase the micropore volume has been successfully developed in this contribution. Ethanol can increase the solubility of triethylamine in buffer solution. The attractions between species in ethanol/amine solution reduce the hydroxide concentration and transport speed, which leads to limited etching capacity contributing to a selective increase in microporous volume. A Zn7La2.5Y4/Beta3 catalyst presents the best catalytic performance in the ETB reaction, which is ascribed to both the very large micropore volume and the highest value of micropore volume/mesopore volume.4 Experimental section
4.1 Materials
Beta zeolite (pure-silica) was purchased from Zhuoran Ltd, Dalian, China; triethylamine (TEA, 99.5% GR), zinc acetate dihydrate (Zn(Ac)2·2H2O, 99.5% wt), and sodium silicate pentahydrate (Na2SiO3·5H2O, 99.9% wt) were provided by Tianjin Damao Chemical Reagent Factory; yttrium nitrate hexahydrate (Y(NO3)3·6H2O, 99.5% wt), ethanol (≥99.8%, GR) and lanthanum nitrate hexahydrate (La(NO3)3·6H2O, 99.0% wt) were purchased from Aladdin Industrial Corporation; nitrogen (≥99.999% wt) was provided by Zhuhai Huaxin Gas Company. All chemicals were used as received without further purification.4.2 Catalyst preparation
Second, ZnLaY/beta catalyst samples were synthesized by solid-state grinding. In a typical synthesis, 0.13 g of Y(NO3)3·6H2O, 0.07 g of La(NO3)3·6H2O, and 0.1 g of zinc silicate hemimorphite were ground with 1 g of beta zeolite for 0.5 h, The resulting solids were calcined at 400 °C for 6 h. The nominal loadings of ZnO, La2O3, and Y2O3 are 7.0 wt%, 2.5 wt%, 4.0 wt%, respectively. Based on different beta zeolites (Beta0 to Beta4), five catalysts of Zn7La2.5Y4/Beta0, Zn7La2.5Y4/Beta1, Zn7La2.5Y4/Beta2, Zn7La2.5Y4/Beta3, Zn7La2.5Y4/Beta4 were correspondingly obtained.
4.3 Catalyst characterization
The porosity of the samples was measured with a Micromeritics ASAP2460 analyzer (USA) at liquid nitrogen temperature (77 K) after the sample was degassed at 350 °C for 8 h under vacuum. The Brunauer–Emmett–Teller (BET) method was used to calculate the specific surface area. The total pore volume was the single-point adsorption total pore volume. The micropore volume was calculated using the t-plot method. The micropore width distribution was calculated from the Horvath–Kawazoe differential pore volume plot. The mesopore size distribution was calculated with the Barrett–Joyner–Halenda (BJH) model with the adsorption branch of the N2 physisorption isotherms.Transmission electron microscopy (TEM) images were obtained with an FEI Tecnai G2 F30 electron microscope. The acceleration voltage was 300 kV. The scanning electron microscopy (SEM) images were obtained with a Thermo Fisher Apreo2S HiVac (20 kV) to observe the size and morphology of zeolite.
The conductivity was measured with a conductivity meter FE38 (METTLER TOLEDO Instruments Shanghai Co., Ltd.). The pH value was measured with an FE28K pH meter (METTLER TOLEDO Instruments Shanghai Co., Ltd.)
All of the samples were analysed using power X-ray diffraction (XRD) patterns measured with a Rigaku Ultima IV diffractometer (Rigaku Corporation, Japan) using Cu Kα radiation (λ = 0.1542 nm) with a scanning rate of 5° min−1 in the range of 2θ = 5–80°. The relative crystallinity (RC) was calculated from the peak area at 2θ = 22.4°.
X-ray photoelectron spectroscopy (XPS) experiments were carried out using a Thermo Fisher Escalab Xi+ spectrometer equipped with monochromatic Al Kα radiation (1486.6 eV). Binding energies were calibrated according to the Si 2p core level set at 103.5 eV.
The acidity of the samples was measured by ammonium temperature-programmed desorption (NH3-TPD) on a TP-5080 apparatus (XianQuan Company, Tianjin, China). Samples (100 mg) were activated at 500 °C under He flow (30 ml min−1) for 1 hour, then cooled to 50 °C, saturated with an NH3/He mixture (5 vol% NH3) for 30 min, and then purged with He for 45 min at 50 °C to remove the physically adsorbed NH3. The desorption of NH3 was measured from 50 to 800 °C at a heating rate of 10 °C min−1 under He.
The basicity of the samples was measured by carbon dioxide temperature-programmed desorption (CO2-TPD) on a TP-5080 apparatus (XianQuan Company, Tianjin, China). Samples (100 mg) were activated at 500 °C under He flow (30 ml min−1) for 1 hour, then cooled to 50 °C, saturated with a CO2/He mixture (10 vol% CO2) for 30 min, and then purged with He for 45 min at 50 °C to remove the physically adsorbed CO2. The desorption of CO2 was measured from 50 to 800 °C at a heating rate of 10 °C min−1 under He.
4.4 Catalyst evaluation
Catalytic conversion of the ethanol to butadiene (ETB) reaction was performed in a tubular fixed-bed reactor at 350 °C at atmospheric pressure.Typically, 0.3 g of calcined catalyst (40–80 mesh) was pretreated in flowing N2 (40 ml min−1) at 450 °C for 1 h. After the sample had cooled down to the required reaction temperature, ethanol was first vaporized at 180 °C through a preheater and then pumped into the reactor with a weight hourly space velocity (WHSV) of 0.5 h−1. The gaseous products were analyzed using an online gas chromatograph (Shimadzu GC-2014CAFA/APC) equipped with a flame ionization detector (FID) and an HP-PLOT/Q + PT capillary column (30 m × 0.320 mm × 20 μm). The ethanol conversion and butadiene selectivity are defined as follows: ethanol conversion (mol%) = ([ethanol]inlet − [ethanol]outlet)/[ethanol]inlet × 100%; butadiene selectivity (mol%) = 2 × [butadiene]outlet/([ethanol]inlet − [ethanol]outlet) × 100%; butadiene yield (%) = ethanol conversion(%) × butadiene selectivity(%)/100.
Conflicts of interest
The authors declare no competing financial interest.Acknowledgements
The authors thank Guangdong Provincial Science and Technology Innovation Strategy (Maoming2021S0007) for financing this study.References
- K. Raweewan, A. Matthias and F. H. Wolfgang, in Mass Transfer- Advanced Aspects, ed. N. Hironori, IntechOpen, Rijeka, 2011, ch. 29, DOI:10.5772/22962.
- W. Dai, S. Zhang, Z. Yu, T. Yan, G. Wu, N. Guan and L. Li, Zeolite structural confinement effects enhance one-pot catalytic conversion of ethanol to butadiene, ACS Catal., 2017, 7, 3703–3706 CrossRef CAS.
- M. M. Kurmach, O. V. Larina, P. I. Kyriienko, P. S. Yaremov, V. V. Trachevsky, O. V. Shvets and S. O. Soloviev, Hierarchical Zr-MTW zeolites doped with copper as catalysts of ethanol conversion into 1,3-butadiene, ChemistrySelect, 2018, 3, 8539–8546 CrossRef CAS.
- Y. Li and J. Yu, Emerging applications of zeolites in catalysis, separation and host–guest assembly, Nat. Rev. Mater., 2021, 6, 1156–1174 CrossRef CAS.
- A. A. Dabbawala, I. Ismail, B. V. Vaithilingam, K. Polychronopoulou, G. Singaravel, S. Morin, M. Berthod and Y. Al Wahedi, Synthesis of hierarchical porous Zeolite-Y for enhanced CO2 capture, Microporous Mesoporous Mater., 2020, 303, 110261 CrossRef CAS.
- D. Kerstens, B. Smeyers, J. Van Waeyenberg, Q. Zhang, J. Yu and B. F. Sels, State of the art and perspectives of hierarchical zeolites: Practical overview of synthesis methods and use in catalysis, Adv. Mater., 2020, 32, 2004690 CrossRef CAS PubMed.
- Z. L. Hua, J. Zhou and J. L. Shi, Recent advances in hierarchically structured zeolites: Synthesis and material performances, Chem. Commun., 2011, 47, 10536–10547 RSC.
- L.-H. Chen, X.-Y. Li, J. C. Rooke, Y.-H. Zhang, X.-Y. Yang, Y. Tang, F.-S. Xiao and B.-L. Su, Hierarchically structured zeolites: Synthesis, mass transport properties and applications, J. Mater. Chem., 2012, 22, 17381–17403 RSC.
- L.-H. Chen, M.-H. Sun, Z. Wang, W. Yang, Z. Xie and B.-L. Su, Hierarchically structured zeolites: From design to application, Chem. Rev., 2020, 120, 11194–11294 CrossRef CAS.
- J. Li, A. Corma and J. Yu, Synthesis of new zeolite structures, Chem. Soc. Rev., 2015, 44, 7112–7127 RSC.
- X. Dong, W. Wang, G. Yang and L. Wang, Uniform mesoporosity development in incorporated β zeolite: Dual-template strategy, Ind. Eng. Chem. Res., 2022, 61, 4255–4263 CrossRef CAS.
- S. Abelló, A. Bonilla and J. Pérez-Ramírez, Mesoporous ZSM-5 zeolite catalysts prepared by desilication with organic hydroxides and comparison with NaOH leaching, Appl. Catal., A, 2009, 364, 191–198 CrossRef.
- X.-L. Luo, F. Pei, W. Wang, H.-m. Qian, K.-K. Miao, Z. Pan, Y.-S. Chen and G.-D. Feng, Microwave synthesis of hierarchical porous materials with various structures by controllable desilication and recrystallization, Microporous Mesoporous Mater., 2018, 262, 148–153 CrossRef CAS.
- G. Yang, L. Wang and H. Jiang, Preparation of β zeolite with intracrystalline mesoporosity via surfactant-templating strategy and its application in ethanol-acetaldehyde to butadiene, Microporous Mesoporous Mater., 2021, 316, 110949 CrossRef CAS.
- Y. Pan, G. Chen, G. Yang, X. Chen and J. Yu, Efficient post-synthesis of hierarchical SAPO-34 zeolites via organic amine etching under hydrothermal conditions and their enhanced MTO performance, Inorg. Chem. Front., 2019, 6, 1299–1303 RSC.
- S. Tao, X. Li, X. Wang, Y. Wei, Y. Jia, J. Ju, Y. Cheng, H. Wang, S. Gong, X. Yao, H. Gao, C. Zhang, Q. Zang and Z. Tian, Facile synthesis of hierarchical nanosized single-crystal aluminophosphate molecular sieves from highly homogeneous and concentrated precursors, Angew. Chem., Int. Ed., 2020, 59, 3455–3459 CrossRef CAS PubMed.
- M. Mokhtar, G. Alzhrani, E. S. Aazam, T. S. Saleh, S. Al-Faifi, S. Panja and D. Maiti, Synergistic effect of NiLDH@YZ hybrid and mechanochemical agitation on glaser homocoupling reaction, Chem. – Eur. J., 2021, 27, 8875–8885 CrossRef CAS PubMed.
- Y.-R. He, Y.-L. Zhu, Y. Duan, M. Zhang and J. Jiang, Green route to grow hierarchical SAPO-34 crystal with excellent catalytic performance in methanol to olefin reaction, Cryst. Growth Des., 2020, 20, 17–23 CrossRef CAS.
- Y.-L. Zhu, H. Dai, Y. Duan, Q. Chen and M. Zhang, Excellent methanol to olefin performance of SAPO-34 crystal deriving from the mixed micropore, mesopore, and macropore architecture, Cryst. Growth Des., 2020, 20, 2623–2631 CrossRef CAS.
- K. Wang, W. Gao, F. Chen, G. Liu, J. Wu, N. Liu, Y. Kawabata, X. Guo, Y. He, P. Zhang, G. Yang and N. Tsubaki, Hierarchical nano-sized ZnZr-Silicalite-1 multifunctional catalyst for selective conversion of ethanol to butadiene, Appl. Catal., B, 2022, 301, 120822 CrossRef CAS.
- L. Qi, Y. Zhang, M. A. Conrad, C. K. Russell, J. Miller and A. T. Bell, Ethanol conversion to butadiene over isolated zinc and yttrium sites grafted onto dealuminated beta zeolite, J. Am. Chem. Soc., 2020, 142(34), 14674–14687 CrossRef CAS.
- G. Pomalaza, P. Simon, A. Addad, M. Capron and F. Dumeignil, Properties and activity of Zn–Ta-TUD-1 in the Lebedev process, Green Chem., 2020, 22(8), 2558–2574 RSC.
- C. Angelici, B. M. Weckhuysen and P. C. A. Bruijnincx, Chemocatalytic conversion of ethanol into butadiene and other bulk chemicals, ChemSusChem, 2013, 6(9), 1595–1614 CrossRef CAS PubMed.
- E. V. Makshina, M. Dusselier, W. Janssens, J. Degrève, P. A. Jacobs and B. F. Sels, Review of old chemistry and new catalytic advances in the on-purpose synthesis of butadiene, Chem. Soc. Rev., 2014, 43(22), 7917–7953 RSC.
- P. I. Kyriienko, O. V. Larina, S. O. Soloviev, S. M. Orlyk, C. Calers and S. Dzwigaj, Ethanol conversion into 1,3-butadiene by the Lebedev method over MTaSiBEA zeolites (M = Ag, Cu, Zn), ACS Sustainable Chem. Eng., 2017, 5(3), 2075–2083 CrossRef CAS.
- J. C. Groen, S. Abelló, L. A. Villaescusa and J. Pérez-Ramírez, Mesoporous beta zeolite obtained by desilication, Microporous Mesoporous Mater., 2008, 114, 93–102 CrossRef CAS.
- M. Zhang, Y. Qin, H. Jiang and L. Wang, Protective desilication of β zeolite: A mechanism study and its application in ethanol-acetaldehyde to 1,3-butadiene, Microporous Mesoporous Mater., 2021, 326, 111359 CrossRef CAS.
- X. Li, Y. Gong, Q. Lu, M. Lin, J. Liu and Y. Wu, Mo, Cu bimetallic loaded hierarchical pore ZSM-5 catalysts for the hydrothermal aromatization of algal bio-oil model compounds, Ind. Eng. Chem. Res., 2022, 61, 17423–17432 CrossRef CAS.
- K. Zhang, S. Fernandez, J. T. O'Brien, T. Pilyugina, S. Kobaslija and M. L. Ostraat, Organotemplate-free synthesis of hierarchical beta zeolites, Catal. Today, 2018, 316, 26–30 CrossRef CAS.
- J. Liu, S. Li, Z. Zhang, N. Fusi, C. Liu, G. Xiong, G. Vilé and N. He, Structured binder-free Al-β zeolite for acid-catalyzed dehydration, ACS Appl. Nano Mater., 2021, 4, 11997–12005 CrossRef CAS.
- A. Shahid, N. S. Ahmed, T. S. Saleh, S. A. Al-Thabaiti and S. N. Basahe, Solvent-free Biginelli reactions catalyzed by hierarchical zeolite utilizing a ball mill technique: A green sustainable process, Catalysts, 2017, 7, 84 CrossRef.
- A. Sachse, A. Grau-Atienza, E. O. Jardim, N. Linares, M. Thommes and J. García-Martínez, Development of intracrystalline mesoporosity in zeolites through surfactant-templating, Cryst. Growth Des., 2017, 17, 4289–4305 CrossRef CAS.
- J. U. Song, J.-S. Lee and H.-K. Yoon, Application of electrical conductivity method for adsorption of lead ions by rice husk ash, Measurement, 2019, 144, 126–134 CrossRef.
- R. M. Kershi and S. H. Aldirham, Transport and dielectric properties of nanocrystallite cobalt ferrites: Correlation with cations distribution and crystallite size, Mater. Chem. Phys., 2019, 238, 121902 CrossRef CAS.
- L. Zhang, Y. Chao, F. Huang, C. Wang, Y. Yue, S. Liu and J. Duan, Study on the relationship between acid-rain pH value and fog-water conductivity, IOP Conf. Ser.: Earth Environ. Sci., 2019, 358, 022077 CrossRef.
- W. E. Taifan, Y. Li, J. P. Baltrus, L. Zhang, A. I. Frenkel and J. Baltrusaitis, Operando structure determination of Cu and Zn on supported MgO/SiO2 catalysts during ethanol conversion to 1,3-butadiene, ACS Catal., 2019, 9(1), 269–285 CrossRef CAS.
- S. Han, D. Zhao, T. Otroshchenko, H. Lund, U. Bentrup, V. A. Kondratenko, N. Rockstroh, S. Bartling, D. E. Doronkin, J.-D. Grunwaldt, U. Rodemerck, D. Linke, M. Gao, G. Jiang and E. V. Kondratenko, Elucidating the nature of active sites and fundamentals for their creation in Zn-containing ZrO2-based catalysts for nonoxidative propane dehydrogenation, ACS Catal., 2020, 10(15), 8933–8949 CrossRef CAS.
- J. P. H. Li, X. Zhou, Y. Pang, L. Zhu, E. I. Vovk, L. Cong, A. P. Van Bavel, S. Li and Y. Yang, Understanding of binding energy calibration in XPS of lanthanum oxide by in situ treatment, Phys. Chem. Chem. Phys., 2019, 21(40), 22351–22358 RSC.
- T. Yan, L. Yang, W. Dai, C. Wang, G. Wu, N. Guan, M. Hunger and L. Li, On the deactivation mechanism of zeolite catalyst in ethanol to butadiene conversion, J. Catal., 2018, 367, 7–15 CrossRef CAS.
- H. Dai, T. Ye, K. Wang, M. Zhang, L.-M. Wu and G. Ouyang, Enhanced performance and stability of a trimetallic CuZnY/SiBEA catalyst in ethanol to butadiene reaction by introducing copper to optimize acid/base ratio, Catalysts, 2022, 12(10), 1147 CrossRef CAS.
- J. Pérez-Ramírez, C. H. Christensen, K. Egeblad, C. H. Christensen and J. C. Groen, Hierarchical zeolites: Enhanced utilisation of microporous crystals in catalysis by advances in materials design, Chem. Soc. Rev., 2008, 37, 2530–2542 RSC.
- S. Fernandez, M. L. Ostraat and K. Zhang, Toward rational design of hierarchical beta zeolites: An overview and beyond, AIChE J., 2020, 66, e16943 CrossRef CAS.
- C. Li, P. Sun and F. Li, Hierarchical zeolites-confined metal catalysts and their enhanced catalytic performances, Chem. – Asian J., 2021, 16, 2795–2805 CrossRef CAS PubMed.
Footnote |
| † Electronic supplementary information (ESI) available: The scheme of mechanism for the conversion of ethanol to butadiene; the XP spectra of all ZnLaY/beta catalysts. See DOI: https://doi.org/10.1039/d3im00087g |
| This journal is © Institute of Process Engineering of CAS 2024 |

