 Open Access Article
Synthesis and upconversion emission studies of CaYF5:Ho3+/Yb3+ phosphor and its applications in optical thermometry, fingerprint detection, and security ink†
Kumar Shwetabh,
Madan M. Upadhyay and
K. Kumar *
*
Department of Physics, Optical Materials and Bio-imaging Research Laboratory, Indian Institute of Technology (Indian School of Mines), Dhanbad-826004, India. E-mail: kkumar@iitism.ac.in
First published on 22nd March 2023
Abstract
In this work, a CaYF5:Ho3+/Yb3+ upconversion phosphor was synthesized and its structural, morphological, and optical properties were studied. The upconversion emission study was performed at an excitation pump power density of 5 W cm−2 and emissions at 544 nm, 650 nm and 747 nm due to the 5F4(5S2) → 5I8, 5F5 → 5I8 and 5F4(5S2) → 5I7 transitions of the Ho3+ ion, respectively were observed. From temperature-dependent upconversion spectra temperature sensitivity was calculated and sensitivity is found to be 14 × 10−3 K−1 for the synthesized upconversion phosphor. The photothermal conversion efficiency of the prepared sample in ethanol medium was tested. Moreover, the sample was used to develop latent fingerprints on various surfaces and good contrast in recorded images is observed. The invisible ink was prepared using the upconversion phosphor and then written words were recorded in upconversion emission mode.
1. Introduction
Inorganic materials doped with lanthanide ions have found tremendous applications across various fields like temperature sensing, bio-imaging, solar cells and security.1–10 They have some unique features of converting NIR photons to intense visible or UV photons, atomic emissions like narrow line width and long lifetime. They are usually composed of a low phonon host matrix with suitable rare earth ions doped within it. The low phonon host matrix suppresses the non-radiative rates and promotes the photon emission efficiency of the upconversion phosphor. To date various materials have been synthesized to find the most suitable host material. AREF4 is a class of materials that exhibit good emission intensity because these fluoride-based hosts possess very low phonon energy and they give specific lattice sites to dopant ions.11–16 Both the chemical as well as physical properties affect the upconversion efficiency of a material hence engineering these conditions could lead to good results. Variation in experimental conditions could lead to changes in morphology, size, phase, stability, ion distribution, and surface defects. All these parameters can alter the energy transfer pathways which eventually help in the manipulation of upconversion efficiency. Sometimes this manipulation leads to the quenching of upconversion emission intensity. Due to this, it is a very difficult task to select a particular material that can show intense upconversion emission at low dopant ion concentration.Gao et al. have prepared Ho3+–Yb3+ co-doped hexagonal NaYF4 nanoparticles which initially showed intense green emission compared to the red band but doping of Ce3+ leads to intense red emission.11 It was concluded that non-radiative relaxation takes place between the energy states of Ho3+ to Ce3+ and which reduces green emission. Thus by variation in doping, we can alter luminescence according to our requirements. Commonly used upconversion materials are doped with Yb3+ ion since most of the upconversion materials use excitation in NIR spectral region. Yb3+ ion has two suitable energy levels 2F5/2 and 2F7/2 whose energy gap is around 10![[thin space (1/6-em)]](https://www.rsc.org/images/entities/char_2009.gif) 000 cm−1 due to which Yb3+ ion shows absorption around the wavelength of 980 nm when doped into the host material. Although some other rare earth ions have similar energy gaps they are unable to absorb energy efficiently like Yb3+ ions due to a lack of large absorption cross-section around this energy value. The most efficient pair of rare earth ions for converting NIR to visible or UV are Er3+–Yb3+, Ho3+–Yb3+ and Tm3+–Yb3+ because sensitization through the Yb3+ ion enhances upconversion efficiency multiple times. The Ho3+–Yb3+ pair is also used to achieve intense green emission.17,18 Contrary to the Er3+ ion emission the Ho3+ ion gives only one emission in visible region and hence green colour purity of Ho3+ is found better than the Er3+ ion. Another benefit of using Ho3+–Yb3+ pair over Er3+/Yb3+ and Tm3+/Yb3+ pairs is that latter pairs contain thermally coupled levels which limit its applicability when used for optical thermometric application but due to the absence of thermally coupled levels in Ho3+ ions, the doping of Ho3+ ions provide relatively much better sensitivity using non-thermally coupled level method. The energy gap of 200 cm−1 to 2000 cm−1 limits the application of Er3+/Yb3+ and Tm3+/Yb3+ pairs for temperature sensing but the use of Ho3+–Yb3+ pair can overcome this issue. Recently, Du et al. have synthesized Ho3+/Yb3+ doped into BaCaTiO3 ceramics and achieved intense upconversion emissions around 546 nm and 656 nm which they later used to calculate thermal sensitivity.19 Tian et al. have shown that doping of Ho3+/Yb3+ into Y2Ti2O7 nanowires achieves bright upconversion emissions around 545 nm and 656 nm upon excitation with 980 nm radiation.20 These works present Ho3+/Yb3+ pairs as a potential candidate for visible upconversion emission.
000 cm−1 due to which Yb3+ ion shows absorption around the wavelength of 980 nm when doped into the host material. Although some other rare earth ions have similar energy gaps they are unable to absorb energy efficiently like Yb3+ ions due to a lack of large absorption cross-section around this energy value. The most efficient pair of rare earth ions for converting NIR to visible or UV are Er3+–Yb3+, Ho3+–Yb3+ and Tm3+–Yb3+ because sensitization through the Yb3+ ion enhances upconversion efficiency multiple times. The Ho3+–Yb3+ pair is also used to achieve intense green emission.17,18 Contrary to the Er3+ ion emission the Ho3+ ion gives only one emission in visible region and hence green colour purity of Ho3+ is found better than the Er3+ ion. Another benefit of using Ho3+–Yb3+ pair over Er3+/Yb3+ and Tm3+/Yb3+ pairs is that latter pairs contain thermally coupled levels which limit its applicability when used for optical thermometric application but due to the absence of thermally coupled levels in Ho3+ ions, the doping of Ho3+ ions provide relatively much better sensitivity using non-thermally coupled level method. The energy gap of 200 cm−1 to 2000 cm−1 limits the application of Er3+/Yb3+ and Tm3+/Yb3+ pairs for temperature sensing but the use of Ho3+–Yb3+ pair can overcome this issue. Recently, Du et al. have synthesized Ho3+/Yb3+ doped into BaCaTiO3 ceramics and achieved intense upconversion emissions around 546 nm and 656 nm which they later used to calculate thermal sensitivity.19 Tian et al. have shown that doping of Ho3+/Yb3+ into Y2Ti2O7 nanowires achieves bright upconversion emissions around 545 nm and 656 nm upon excitation with 980 nm radiation.20 These works present Ho3+/Yb3+ pairs as a potential candidate for visible upconversion emission.
In this work, authors have synthesized Ho3+/Yb3+ doped CaYF5 upconversion phosphor for the first time. CaYF5 crystal belongs to a class of nonstoichiometric compounds A1−xRxF2+x crystal which is a product of the AF2–RF3 binary system.4 This system produces various nonstoichiometric fluoride phases of the CaF2–YF3 system. These kind of crystals have come into the light for their extraordinary fluorescence properties when doped with rare earth ions. Due to low lattice phonon energy, these materials can show good upconversion luminescence along with high thermal and chemical stability. Recently Grzyb et al. have investigated the luminescence properties of rare-earth-doped BaREF5 nanoparticles.4 Luo et al. have synthesized Bi3+ doped BaYF5:Yb3+/Er3+ upconversion nanoparticles with varying concentrations of Bi3+ ion and achieved enhanced luminescence intensity.21 These reports indicate the potentiality of such materials for upconversion-based applications. However, due to phase-related difficulties, these materials are difficult to synthesize and hence haven't been explored much the spectroscopic properties and there is a need to investigate on luminescence properties of these materials. Also, there is no published report which could show the spectroscopic property of rare earth doped CaYF5 particles. In this work, authors have successfully synthesized Ho3+/Yb3+ co-doped CaYF5 crystals and then investigated its upconversion luminescence properties. Further, the synthesized nanoparticles were demonstrated for fingerprint detection and security ink applications.
2. Experimental section
2.1. Materials
For this work, precursors used are yttrium oxide (Y2O3), ytterbium oxide (Yb2O3), and holmium oxide (Ho2O3) (Sigma-Aldrich, 99.99%). Calcium carbonate (CaCO3), ammonium fluoride (NH4F), oleic acid (C17H33COOH), 1-octadecane (C18H36), and hydrochloric acid (HCl) were purchased from Alpha Aesar. All the chemicals were used as received without further purification.2.2. Synthesis of upconversion phosphor
In this synthesis, the rare earth chlorides RECl3 (RE = Y, Yb, Ho) were used as precursors for the sample. The concentrations of Y3+, Yb3+, and Ho3+ were set to 89.5, 10 and 0.5 mol%, respectively for the optimized sample. For this optimized sample, 451.1 mg of Y2O3, 44 mg of Yb2O3, 2.1 mg of Ho2O3, and 150 mg of CaCO3 were dissolved in hydrochloric acid separately by heating, and after getting a transparent solution the excess of HCl was removed by evaporating. Further, 10 ml of oleic acid and 10 ml of 1-octadecane was mixed into a 100 ml three-neck round bottom flask at 150 °C under a Nitrogen environment. This mixing leads to a transparent solution which was left for cooling to room temperature. The as-prepared rare earth chloride powders were poured into this cooled transparent solution and then stirred for 30 minutes at 60 °C to form the metal-oleate complex. Then, as prepared calcium chloride powder was added to this metal-oleate solution, and this mixture was stirred continuously in a nitrogen environment for 30 minutes. The 186 mg NH4F was dissolved in 5 ml methanol and a solution was obtained. This solution was then mixed with main solution with stirring. Now the temperature of vessel was raised slowly to 300 °C and maintained at this temperature for 60 minutes. After completing the reaction heating was turned off and the solution was cooled down to room temperature. After arriving at room temperature excess ethanol was added to the solution to get precipitate. The precipitate was rinsed several times with ethanol and hexane (volume ratio 1![[thin space (1/6-em)]](https://www.rsc.org/images/entities/char_2009.gif) :
:![[thin space (1/6-em)]](https://www.rsc.org/images/entities/char_2009.gif) 1) and then dried overnight at 60 °C. Finally, the dried powder was crushed and kept for further use.
1) and then dried overnight at 60 °C. Finally, the dried powder was crushed and kept for further use.
2.3. Material characterization
Structural and phase properties of synthesized upconversion phosphor were investigated using Rigaku Smartlab high-resolution X-ray diffractometer (HR-XRD). Analysis of the surface morphology of upconversion phosphor particles was performed on Supra 55 (Carl Zeiss, Germany) Scanning electron microscopy (SEM) and Energy-dispersive X-ray Spectroscopy (EDX). Near infrared-ultraviolet-visible (NIR-UV-Vis) spectroscopy was performed on Agilent Cary 500 attached with integrating sphere. Fourier transform infrared spectroscopy (FTIR) was performed using PerkinElmer Spectrum 2.0 spectroscope which shows the presence of different functional groups in the as-synthesized upconversion phosphor. Upconversion emission spectra were recorded on Avantes ULS2048X58 charge-coupled device (CCD) equipped with a 980 nm diode laser and optical fiber. The temperature-dependent upconversion spectra were recorded using the same diode laser, CCD, and optical fiber integrated with the home made small heater and thermocouple. The temperature of heater was controlled using a potentiometer during the measurement. Photothermal conversion measurement was also made on above system. The thermocouple was inserted into a cuvette and then the temperature change was measured. Decay curves of Ho3+ green emission were measured using 980 nm diode laser, mechanical chopper, monochromator, and a fast silicon photodetector. For recording of decay curves a digital oscilloscope (200 GHz) was used.3. Results and discussions
3.1. X-ray diffraction study
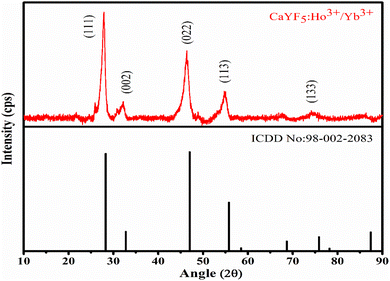
XRD pattern of as-synthesized upconversion phosphor was obtained and analysed. The XRD pattern reveals the cubic phase of the synthesized CaYF5 crystal. Recorded XRD pattern with corresponding reference pattern is shown in Fig. 1. Diffraction peaks are well matched with the reference phase. The diffraction peaks are little shifted toward lower 2θ value which can be attributed to the incorporation of a bigger Yb3+ ion into the CaYF5 lattice.3.2. Scanning electron microscopy study
The surface morphology and size information of the synthesized CaYF5:Ho3+/Yb3+ nanoparticles was obtained using a scanning electron microscope (SEM) image. The as-obtained SEM image in Fig. 2(a) shows the particles looks like spherical shape but agglomerated with other. Inset of the Fig. 2(a) shows size distribution for small spherical shape like particles and mean size is found around 32 nm. However, it is a rough estimate as recorded image has large field of view compared to the size of the particles. Further resolution in SEM image was not possible due to charging the particles. The EDX spectrum in Fig. 2(b) shows the presence of all elements viz. Ca, Y, F, Ho, and Yb in the synthesized sample. However there is a slight difference in the calculated and observed weight% due to presence of oleic acid coating on surface.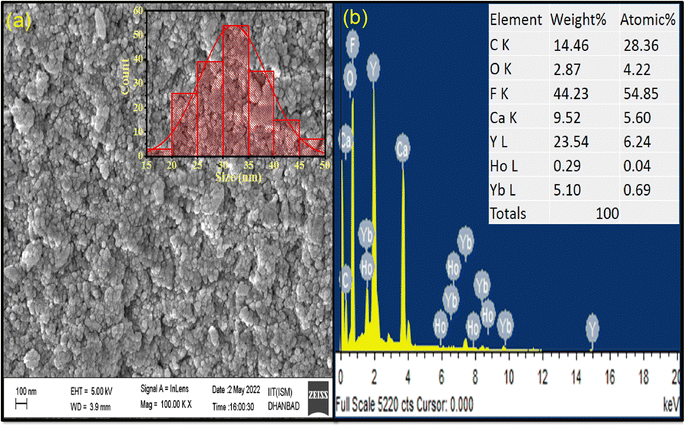 | ||
| Fig. 2 (a) FESEM image (inset: size distribution) and (b) EDX spectrum of as-synthesized CaYF5:Ho3+/Yb3+ upconversion phosphor. | ||
3.3. UV-Vis-NIR spectroscopy
UV-Vis-NIR spectroscopy was performed in diffuse reflectance spectroscopy (DRS) mode in 200 nm to 1200 nm range using a spectrophotometer equipped with UV, visible, and NIR light sources. In DRS mode, the ratio of reflected light to the incident light from the surface of the sample is measured as a function of wavelength. Recorded spectrum (Fig. 3) shows an absorption band around 980 nm which is the prominent absorption band due to Yb3+ ions while the absorption peaks around 642 nm, 534 nm, and 448 nm are due to the Ho3+ ions. The absorption band of Yb3+ ion around 980 nm is due to the transition from 2F7/2 to 2F5/2 level while the absorption peaks of Ho3+ ion around 642 nm, 534 nm, and 448 nm are due to the transition from ground level 5I8 to excited levels 5F5, 5S2 and 3K8, respectively.22 With the help of DRS, the band gap was calculated using the Kubelka–Munk relation which relates the absorption and scattering coefficient with diffuse reflectance, and the Tauc relation which relates the band gap to linear absorption coefficients. According to Kubelka–Munk relation
 | (i) |
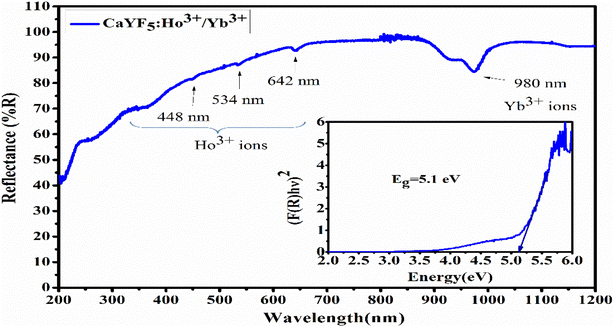 | ||
| Fig. 3 UV-Vis-NIR spectrum of synthesized CaYF5:Ho3+/Yb3+ upconversion phosphor (inset: band gap calculation using Tauc plot). | ||
Here
 | (ii) |
F(R) is called as Kubelka–Munk function and R is the reflectance of the sample compared to the reference.23,24 In our case reference is BaSO4 powder.
Tauc relation is given by
| αhν = C(hν − Eg)n | (iii) |
| [F(R)hν]2 = C(hν − Eg) | (iv) |
3.4. Fourier transformed infrared spectroscopy
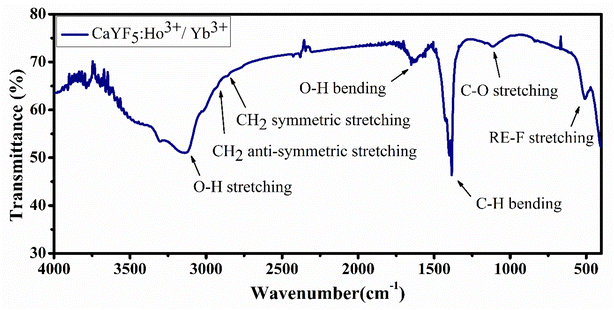
Fourier-transformed infrared spectroscopy (FTIR) was performed within the energy range 400–4000 cm−1 to identify the organic moieties present in the synthesized sample. Presence of oleic acid and some water content is observed in the sample based on the positions of the absorption bands. Each absorption peak is assigned and shown in Fig. 4.3.5. Upconversion spectroscopy studies
Upconversion spectra for prepared CaYF5:Ho3+/Yb3+ upconversion phosphors were recorded using 980 nm diode laser. Sample was optimized for the maximum upconversion emission by varying Ho3+ ion concentration from 0.1 mol% to 1.0 mol% and keeping Yb3+ fixed at 10.0 mol%. After getting maximum emission at particular Ho3+ concentration, this concentration was fixed and then Yb3+ ion concentration was varied from 1.0 mol% to 20 mol%. The variation of upconversion emission against Ho3+ and Yb3+ concentrations is shown in ESI Fig. S1.† The optimum upconversion is observed for Ho3+ and Yb3+ concentrations of 0.5 mol% and 10 mol%, respectively. Further studies are done for this optimized sample only. The emission spectrum of optimized sample is shown in Fig. 5. The most intense emission is observed at 544 nm with weak emissions at 650 nm and 747 nm wavelength. The band assignment for each peak is given in Fig. 5(a).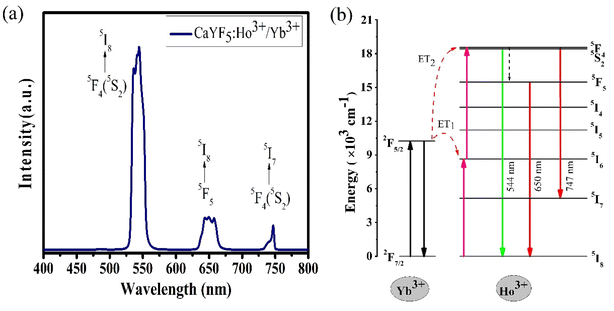 | ||
| Fig. 5 (a) The upconversion emission spectrum for CaYF5:Ho3+/Yb3+ upconversion phosphor and (b) a possible energy level diagram. | ||
The Yb3+ ion absorbs a 980 nm wavelength photon and makes a transition from 2F7/2 to 2F5/2 level. Apart from Yb3+ ion absorption, Ho3+ also absorbs some of the 980 nm photons and makes the transition from ground state 5I8 to excited state 5I6 which is referred to as ground state absorption (GSA). After reaching the 5I6 state absorption of one more photon by the Ho3+ ion leads to excited state absorption (ESA) which makes this activator ion get through the level to 5F4(5S2). Now the absorbed energy by the Yb3+ ion is transferred to the Ho3+ ion by various energy transfer (ET) processes indicated in the energy level diagram. Energy transfer processes are labelled as ET1 and ET2 which refers to the transfer of energy from excited state 2F5/2 of Yb3+ ion to 5I6 and 5F4(5S2) level of Ho3+ ion respectively. After populating the excited states of the Ho3+ ion the Ho3+ ion makes various radiative and non-radiative transitions which leads to various emission peaks observed from the upconversion phosphor. The radiative transition from 5F4(5S2) to 5I8 and 5I7 levels of Ho3+ ion leads to the emission of 544 nm and 747 nm wavelength light respectively. During energy transfer process non-radiative transitions also occur which increase the sample temperature. This temperature rise in ethanol suspension is measured and is discussed in next section.
The variation of emission intensity with increase in excitation power tells us number of photons involved in the upconversion emission process. For this upconversion emission spectra were recorded at various excitation powers. For upconversion emission process the emission intensity varies with pump power according to the relation I ∝ Pn,7,8,27,28 where I is the upconversion emission intensity; P is the pump power and n is the number of photons involved in a particular emission. In Fig. 6(a) emission spectra are plotted for five different pump powers and from this data ln![[thin space (1/6-em)]](https://www.rsc.org/images/entities/char_2009.gif) P vs. ln
P vs. ln![[thin space (1/6-em)]](https://www.rsc.org/images/entities/char_2009.gif) I graph was plotted and shown in Fig. 6(b). From the linear fit the slope ‘n’ was measured for all three emission bands. In each case slope value is in the range of 1.65–1.94 which suggests that all emission bands occur due to the two-photon absorption process.
I graph was plotted and shown in Fig. 6(b). From the linear fit the slope ‘n’ was measured for all three emission bands. In each case slope value is in the range of 1.65–1.94 which suggests that all emission bands occur due to the two-photon absorption process.
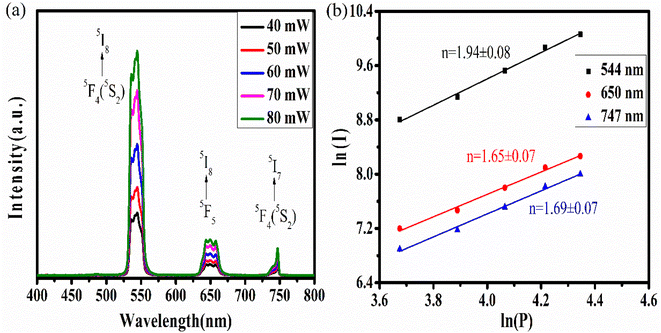 | ||
| Fig. 6 (a) The power-dependent upconversion spectra and (b) the double logarithmic plot for calculation of the number of photons. | ||
Decay time for 5F4(5S2) → 5I8 and 5F5 → 5I8 transitions of Ho3+ ion was measured using 980 nm excitation. The expression that relates the emission intensity and the decay time as26
 | (v) |
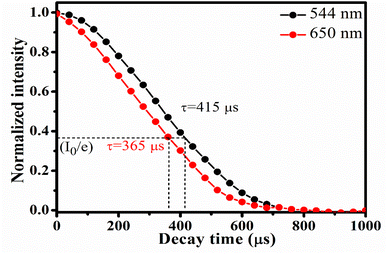 | ||
| Fig. 7 Decay profile for 544 nm and 650 nm emission from CaYF5:Ho3+/Yb3+ upconversion phosphor upon 980 nm irradiation (indicated the 1/e times of initial intensity). | ||
3.6. Photo-thermal conversion efficiency
The use of photothermal reagents in photo-thermal therapy is based on desired NIR absorption and good photothermal conversion efficiency. The photothermal conversion efficiency ‘η’ signifies the amount of heat converted from absorbed radiation. The expression that gives a relation between laser power, absorbance, and heat produced by the sample is given by29
 | (vi) |
 | (vii) |
Now the eqn (vii) can be rewritten as
 | (viii) |
By using eqn (viii), photo-thermal conversion efficiency was calculated and it found to be 57.9%. This value is closer to other such reports.30 The temperature rise with time upon laser irradiation is shown in Fig. 8(a). The parameters associated with the temperature profile were calculated and shown in Table 1. The synthesized CaYF5:Ho3+/Yb3+ upconversion phosphor also shows good stability in ethanol. The emission from the sample was recorded for 12 h and shown in Fig. 8(b). Very small change in emission intensity is observed after 12 h.
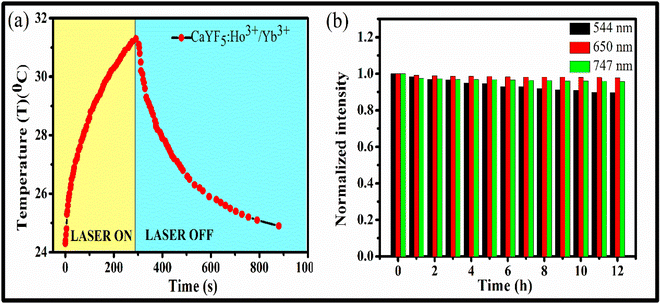 | ||
| Fig. 8 (a) Temperature profile for radiation to heat conversion and (b) stability of upconversion phosphor dispersion upon 980 nm irradiation. | ||
| Sample | Parameter | Unit | Laser ON | Laser OFF | Average |
|---|---|---|---|---|---|
| CaYF5:Ho3+/Yb3+ | Tmax − T∞ | °C | 7 | 140.2 | 129.9 |
| τp | s | 119.7 | |||
| Ethanol | Tmax,0 − T∞,0 | °C | 2.1 | 105.2 | 119.1 |
| τp,0 | s | 133.1 |
3.7. Temperature-dependent upconversion emission study
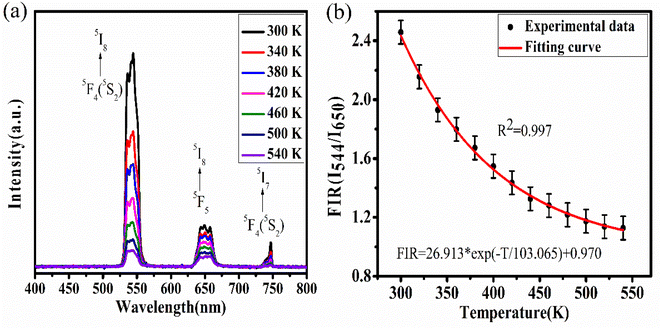
To study the competency of the upconversion phenomenon with temperature for the synthesized CaYF5:Ho3+/Yb3+ upconversion phosphor, temperature-dependent upconversion spectra were recorded. The competency assessment of upconversion emission with temperature is a requirement for upconversion phosphor being used for temperature-related applications like thermometry and photodynamic therapy. The dopant ions have various energy levels, some of which are thermally coupled and some are non-thermally coupled. The ways of populating these energy levels and decay pathways are strongly dependent on the temperature of the environment. For these systems, the variation in population density with temperature for any specific energy level is governed by the Boltzmann relation while the decay rate is governed by the Arrhenius equation. Generally, a decreasing trend of upconversion emission intensity has been observed with an increase in temperature and it is termed thermal quenching. Since all transitions are dependent on temperature but they are not equally dependent on temperature hence the ratio of the intensity of emission for two different wavelengths at each temperature value does not remain constant. This is true for both thermally coupled and non-thermally coupled level systems. One can use this intensity variation phenomenon to measure the sensitivity and hence its compatibility for thermometric applications. In the present case, the system is considered a non-thermally coupled system due to the lack of thermally coupled energy levels in the Ho3+ ion.The temperature of the sample was increased using a small heater. As the voltage in the potentiometer increases the temperature of the heater and upconversion phosphor increases. The variation in emission intensity is shown in Fig. 9(a). The increase in temperature causes a decrease in emission intensity due to an increased rate of multi-phonon relaxation and hence non-radiative transitions and referred to as thermal quenching of upconversion emission.31 This effect is deleterious to upconversion emission but this can also be considered an advantage for some upconversion host materials because of its utility for optical thermometry applications. In some upconversion host lattices, the change in emission intensity is also associated with the change in the intensity ratio of two emissions. This intensity ratio is referred to as fluorescence intensity ratio (FIR) and it is associated with the thermal response of that material. By exploiting this property those rare earth-doped host materials can be utilized as thermal sensors. Here in our case, we investigated the above-discussed property for the synthesized upconversion phosphor. Here we considered the ratio of 544 nm emission wavelength to 650 nm emission wavelength and the change in FIR is shown in Fig. 9(b). Here it can be seen that the data fit the exponential decay type function and the relation between FIR and temperature is shown in the graph.
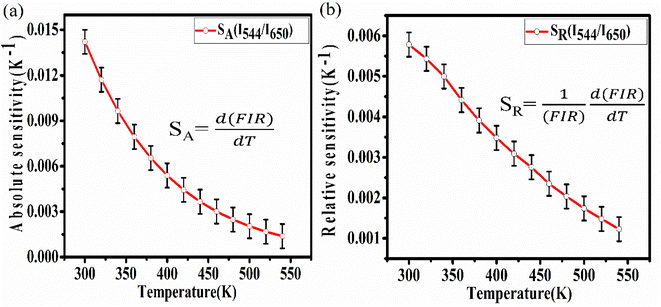
By using this relation, the FIR and temperature were calculated the absolute and relative sensitivity for upconversion phosphor were calculated using following relations:
The expression for absolute sensitivity is
 | (ix) |
And relative sensitivity is,
 | (x) |
By using these relations the calculated values for absolute and relative sensitivities are found to 14.2 × 10⁻³ K−1 and 0.0057 K−1 at 300 K, respectively. The variation in absolute and relative sensitivity is depicted in Fig. 10.
4. Applications
4.1. Fingerprint detection and security ink
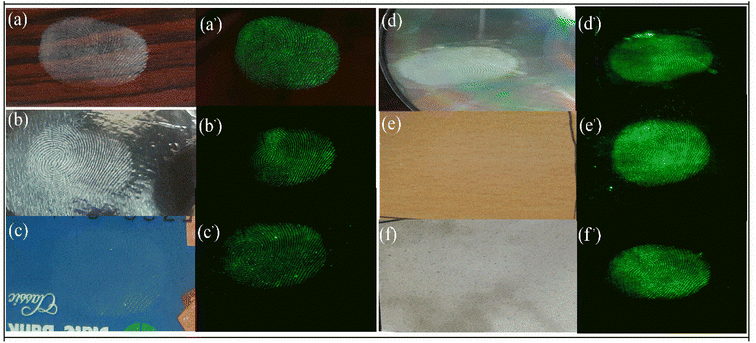
Fingerprint detection is the first and most important evidence which is crucial in any criminal investigation. It is very important to identify the involvement of any person in any crime hence the first step is to collect the fingerprint from the crime scene or objects at the crime scene like a weapon or other materials. The fingerprint can be anywhere like on the floor, books, furniture, glasses, or utensils. These surfaces can be porous, hard, metallic, magnetic, or non-magnetic. The current art of fingerprint detection is based on magnetism using commercially available iron oxide powder which provides good fingerprint detection and resolution but is not suitable for metallic or magnetic surfaces. Some more advanced application is the use of quantum dots and other luminescent material which can be excited using UV light but they also suffer from poor contrast hence the low quality of fingerprint.33,34 Some up-conversion nanoparticles have also been employed to detect fingerprints using a NIR laser source. Here we'll use the synthesized CaYF5:Ho3+/Yb3+ upconversion phosphor for fingerprint detection on various surfaces.Authors have selected glass slide, aluminium foil, debit card, compact disc (CD), ceramic tile, and wooden plate for the study. A volunteer had deposited fingerprints on these surfaces carefully. Then the upconversion phosphor powder was sprinkled on the surface and wiped out softly. Afterward, NIR illumination and scanning was performed using a 980 nm laser diode and a camera was used to record the image. The fingerprint obtained before and after illumination are shown in Fig. 11. In all surfaces finger patterns are clearly readable however, for Aluminium foil and debit card colour intensity is slight lower than the other cases.
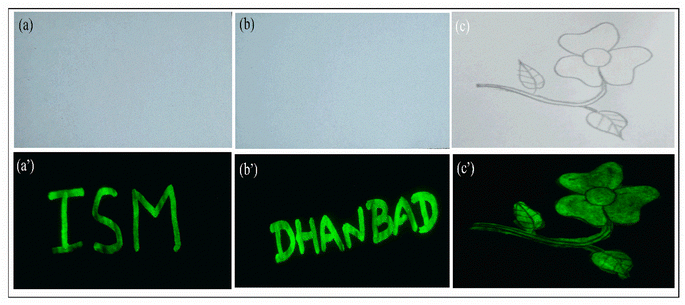
The application of luminescent material as security ink is one of the major approaches that gained rapid attention for anti-counterfeiting agents. Here we demonstrated the application of CaYF5:Ho3+/Yb3+ upconversion phosphor as security ink for anti-counterfeiting application. The invisible ink was prepared by dispersing the 25 mg of synthesized CaYF5:Ho3+/Yb3+ upconversion phosphor into 4 ml of ethanol with a certain amount of polyvinylpyrrolidone (PVP 40) was added as stabilizer. The mixed solution was sonicated in an ultrasonic bath for 30 minutes to get a homogenous dispersion. Then few words like “ISM” and “DHANBAD” were written and a flower pattern was filled with this ink. Hidden words and flower is again clearly visible when a 980 nm laser beam was scanned over the area. Fig. 12 shows recorded words in green colour.
5. Conclusions
In summary, new CaYF5 host was doped with Ho3+/Yb3+ and upconversion emission and other studies were made. Elemental analysis using EDX experiment has confirmed the presence of all constituent elements. Absorption spectroscopies viz. UV-Vis-NIR and FTIR spectroscopy revealed the position of rare earth absorption bands and functional group present in the synthesized upconversion phosphor, respectively. Upconversion emission spectra were recorded and emission was observed at 544 nm, 650 nm, and 747 nm due to various transitions of Ho3+ ion. Pump power-dependent upconversion spectra provided insight into various energy transfer processes taking place while illumination with 980 nm wavelength. Decay time corresponding to 5F4(5S2) and 5F5 levels were 415 μs and 365 μs, respectively. Photo-thermal conversion efficiency of prepared sample was found to 57.9% at 20 mM concentration of CaYF5:Ho3+/Yb3+ upconversion phosphor in ethanol. The high photothermal conversion efficiency is an indication that the synthesized upconversion phosphor can be a good photo-thermal agent in photo-thermal therapy. Temperature-dependent upconversion study suggests its suitability as optical thermometry. Moreover, successful demonstration of synthesized CaYF5:Ho3+/Yb3+ sample is done for latent fingerprint detection and security ink.Conflicts of interest
There are no conflicts to declare.Acknowledgements
Kumar Shwetabh is thankful to IIT (ISM) Dhanbad for providing financial support in terms of a senior research fellowship (SRF). K. Kumar acknowledges DST, New Delhi for financial support (SERB)/EMR/2017/000228.References
- R. Abdul Jalil and Y. Zhang, Biomaterials, 2008, 29, 4122–4128 CrossRef CAS PubMed.
- A. Kavand, C. A. Serra, C. Blanck, M. Lenertz, N. Anton, T. F. Vandamme, Y. Mély, F. Przybilla and D. Chan-Seng, ACS Appl. Nano Mater., 2021, 4, 5319–5329 CrossRef CAS.
- D. Kumar, S. Verma, K. Verma, S. Som, V. Kumar and H. C. Swart, Ceram. Int., 2018, 44, 13649–13653 CrossRef CAS.
- T. Grzyb, S. Balabhadra, D. Przybylska and M. Węcławiak, J. Alloys Compd., 2015, 649, 606–616 CrossRef CAS.
- S. Som, C.-Y. Yang, C.-H. Lu and S. Das, Ceram. Int., 2019, 45, 5703–5709 CrossRef CAS.
- S. K. Singh, K. Kumar and S. B. Rai, Sens. Actuators, A, 2009, 149, 16–20 CrossRef CAS.
- M. M. Upadhyay and K. Kumar, J. Rare Earths, 2022 DOI:10.1016/j.jre.2022.07.005.
- N. Kumar Mishra, M. M. Upadhyay, S. Kumar and K. Kumar, Spectrochim. Acta, Part A, 2022, 282, 121664 CrossRef CAS PubMed.
- K. Shwetabh, S. K. Maurya, A. Banerjee, R. Poddar and K. Kumar, New J. Chem., 2022, 46, 21950–21961 RSC.
- M. I. Sarkar, N. K. Mishra and K. Kumar, Methods Appl. Fluoresc., 2022, 11, 014002 CrossRef PubMed.
- W. Gao, X. Kong, Q. Han, Y. Chen, J. Zhang, X. Zhao, X. Yan, J. Liu, J. Shi and J. Dong, J. Lumin., 2018, 202, 381–387 CrossRef CAS.
- W. Gao, J. Dong, Z. Wang, Z. Zhang and H. Zheng, Mater. Res. Bull., 2017, 91, 77–84 CrossRef CAS.
- W. Gao, H. Zheng, E. He, Y. Lu and F. Gao, J. Lumin., 2014, 152, 44–48 CrossRef CAS.
- B. Zhou, Y. Wang and D. Xia, RSC Adv., 2015, 5, 66807–66814 RSC.
- M. Bouffard, T. Duvaut, J. P. Jouart, N. M. Khaidukov and M. F. Joubert, J. Phys.: Condens. Matter, 1999, 11, 4775 CrossRef CAS.
- J. Shin, J.-H. Kyhm, A.-R. Hong, J. D. Song, K. Lee, H. Ko and H. S. Jang, Chem. Mater., 2018, 30, 8457–8464 CrossRef CAS.
- M. Xing, W. Cao, H. Zhong, Y. Zhang, X. Luo, Y. Fu, W. Feng, T. Pang and X. Yang, J. Alloys Compd., 2011, 509, 5725–5730 CrossRef CAS.
- S. K. Jakka, M. J. Soares, M. P. F. Graça, A. J. Neves, P. C. Nagajyothi and P. K, Opt. Mater., 2022, 129, 112442 CrossRef CAS.
- P. Du, L. Luo and J. S. Yu, J. Alloys Compd., 2015, 632, 73–77 CrossRef CAS.
- Z. Tian, H. Yu, Z. Han, Z. Guan, S. Xu, J. Sun, Y. Cao, Y. Wang, L. Cheng and B. Chen, Ceram. Int., 2022, 48, 27836–27848 CrossRef CAS.
- R. Luo, L. Chen, Q. Li, J. Zhou, L. Mei, Z. Ning, Y. Zhao, M. Liu, X. Lai, J. Bi, W. Yin and D. Gao, Inorg. Chem., 2020, 59, 17906–17915 CrossRef CAS PubMed.
- G. H. Dieke, Spectra and energy levels of rare earth ions in crystals, 1968, p. 1968 Search PubMed.
- R. Gopal, A. Kumar and J. Manam, Mater. Chem. Phys., 2021, 272, 124960 CrossRef CAS.
- M. Patel, A. Chavda, I. Mukhopadhyay, J. Kim and A. Ray, Nanoscale, 2016, 8, 2293–2303 RSC.
- V. H. Mudavakkat, V. V. Atuchin, V. N. Kruchinin, A. Kayani and C. V. Ramana, Opt. Mater., 2012, 34, 893–900 CrossRef CAS.
- S. Sinha, M. Kumar Mahata and K. Kumar, New J. Chem., 2019, 43, 5960–5971 RSC.
- R. Krishnan, S. G. Menon, D. Poelman, R. E. Kroon and H. C. Swart, Dalton Trans., 2021, 50, 229–239 RSC.
- J. F. Suyver, A. Aebischer, S. García-Revilla, P. Gerner and H. U. Güdel, Phys. Rev. B: Condens. Matter Mater. Phys., 2005, 71, 125123 CrossRef.
- S. Balabhadra, M. L. Debasu, C. D. S. Brites, R. A. S. Ferreira and L. D. Carlos, Opt. Mater., 2018, 83, 1–6 CrossRef CAS.
- Y. Dai, D. Yang, D. Yu, C. Cao, Q. Wang, S. Xie, L. Shen, W. Feng and F. Li, ACS Appl. Mater. Interfaces, 2017, 9, 26674–26683 CrossRef CAS PubMed.
- Y. Wang, B. Chen and F. Wang, Nanoscale, 2021, 13, 3454–3462 RSC.
- Z. Li, L. Lin, Z. Feng, L. Huang, Z. Wang and Z. Zheng, J. Lumin., 2021, 232, 117873 CrossRef CAS.
- J. Liu, Z. Shi, Y. Yu, R. Yang and S. Zuo, J. Colloid Interface Sci., 2010, 342, 278–282 CrossRef CAS PubMed.
- A. Xu, G. Wang, Y. Li, H. Dong, S. Yang, P. He and G. Ding, Small, 2020, 16, 2004621 CrossRef CAS PubMed.
Footnote |
| † Electronic supplementary information (ESI) available. See DOI: https://doi.org/10.1039/d3ra00644a |
| This journal is © The Royal Society of Chemistry 2023 |

