 Open Access Article
Magnetically enhancing the Seebeck coefficient in ferrofluids
Thomas J.
Salez
ab,
Mansour
Kouyaté
c,
Cleber
Filomeno
cd,
Marco
Bonetti
a,
Michel
Roger
a,
Gilles
Demouchy
ce,
Emmanuelle
Dubois
 c,
Régine
Perzynski
 c,
Andrejs
Cēbers
 f and
Sawako
Nakamae
 *a
*a
aService de physique de l’état condensé, CEA, CNRS, Université Paris-Saclay, CEA Saclay, 91191 Gif-sur-Yvette Cedex, France. E-mail: sawako.nakamae@cea.fr; Fax: +33 1 6908 8786; Tel: +33 1 6908 7538
bÉcole des Ponts ParisTech, 6 et 8 avenue Blaise Pascal, Champs-sur-Marne, F-77455 Marne-la-Vallée, France
cPhysico-chimie des Electrolytes et Nanosystémes InterfaciauX, Sorbonne Université, CNRS, F-75005 Paris, France
dInst. de Quémica, Complex Fluid Group, Universidade de Brasília, Brasília, Brazil
eDépartement de Physique, Université de Cergy Pontoise, 33 Boulevard du Port, 95011 Cergy-Pontoise Cedex, France
fMMML Lab, Faculty of Physics and Mathematics, University of Latvia, Zellu-8, LV-1002 Riga, Latvia
First published on 6th June 2019
Abstract
The influence of the magnetic field on the Seebeck coefficient (Se) was investigated in dilute magnetic nanofluids (ferrofluids) composed of maghemite magnetic nanoparticles dispersed in dimethyl-sulfoxide (DMSO). A 25% increase in the Se value was found when the external magnetic field was applied perpendicularly to the temperature gradient, reminiscent of an increase in the Soret coefficient (ST, concentration gradient) observed in the same fluids. In-depth analysis of experimental data, however, revealed that different mechanisms are responsible for the observed magneto-thermoelectric and -thermodiffusive phenomena. Possible physical and physico-chemical origins leading to the enhancement of the fluids' Seebeck coefficient are discussed.
1 Introduction
Thermoelectric (TE) materials research has enjoyed a surge of interest, activity and investment in the last 20 years owing largely to the rise in nanotechnology. Such collective efforts have led to remarkable improvements in both the Seebeck coefficient (Se) and the efficiency (figure of merit) of solid-state TE conductors1via nano-structuring. However, the highest performing nano-structured TE materials and devices today are still limited to small sizes and incur substantial production costs, and are yet to take over bulk semiconductor-based TE-modules.2 Furthermore, these materials (bulk or nano-structured) contain raw materials that are rare and/or toxic,3 stymieing their wide commercial deployment even as an energy efficiency tool.Similar research trends are observed in another branch of nano-materials research, namely that of nanofluids.† Indeed the number of research articles per year published on nanofluids and related subjects increased by two orders of magnitude in the last 20 years. Due to their superior thermal and electrical conductivities compared to their base-fluids, nanofluids first attracted attention as effective coolants in the 1990s.4 While much of the nanofluid research today still focuses on enhancing the fluids' thermal conductivity by adjusting various parameters such as nanoparticles' composition,5–7 coating materials and volume fraction, their application potential in other areas of renewable energy is also gaining momentum.8,9 For example, nanofluids have been explored for their optical properties (increased absorption) in solar collectors.10,11 The thermoelectric effects in liquid electrolytes containing charged colloidal particles and macro-molecules were also demonstrated both theoretically12–15 and experimentally,16,17 and the possibility of enhancing the thermoelectric energy conversion efficiency using charge-stabilised magnetic nanofluids (also known as ferrofluids) using thermo-electrochemical cells18,19 was reported very recently.
Thermo-electrochemical cells, or thermocells, produce an electrical current through redox reactions when two electrodes are maintained at different temperatures (thermogalvanic effect). Thermoelectric coefficients (equivalent to the Seebeck coefficient in solids) as high as a few mV K−1 have been reported in liquid-containing thermocells,20 an order of magnitude larger than those of solid-state TE materials. We have recently demonstrated that the cumulative effects of thermo-electrically induced movements and distribution (the Soret effect) of nanoparticles and their electrostatic interactions with the electrodes can modify a thermocell's Seebeck coefficient. The net change in the Se can be either positive18 or negative,19 depending on the intricate balance between the NPs' surface charge, entropy of transfer and respective signs, and the nature of counterions present in the surrounding fluid. While the underlying physical and chemical mechanisms are far from being fully understood, these results paved a new direction in thermoelectric materials research based on nanofluids. In ferrofluids, it is quite well known that the Soret coefficient (ST) and the diffusion coefficient (Dm) of ferrofluids depend on the strength and the direction of applied magnetic fields.21,22 For example, a marked increase in ST is observed when the magnetic field is applied perpendicularly to the temperature gradient, while the opposite is true when applied in the parallel direction.21,23,24 Such magneto-thermodiffusion phenomena can be understood by taking into account the local magnetic field gradient within the fluid,24,25 and the existing theoretical model can reproduce experimental observations, provided that no magneto-convection occurs.24 Here, we examine the coupled Seebeck/Soret effects in ferrofluids under a magnetic field to determine to what extent one can take advantage of the magnetic nature of nanoparticles to control the thermoelectric potential of a thermocell. The value of Se is found to increase by as much as 25% in a dilute ferrofluid when a moderate magnetic field of 150 kA m−1 is applied perpendicularly to the temperature gradient inside a thermocell. To the best of our knowledge, this is the first experimental reporting of the enhancement of Se in ferrofluids by application of an external magnetic field.
In the following sections, we first describe the theoretical models used to analyse the effect of a magnetic field on the Seebeck coefficient in ferrofluids, ensued by the experimental approach used to measure the in-field Seebeck and Soret coefficients. The analysis and discussion of results expose the limit of our current understanding of magneto-thermoelectricity in ferrofluids, while highlighting possible physical origins that have been overlooked thus far and future research perspectives of ferrofluids.
2 Theory under a homogeneous magnetic field
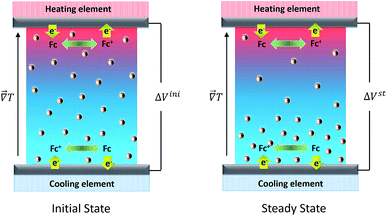
In order to understand how a thermocell converts thermal energy into electricity, it is helpful to recognise two distinct states of operation; namely, the initial and the steady states as depicted in Fig. 1. The former refers to the instance immediately after the application of a temperature gradient across the thermocell. At this stage, various charged species, i.e., nanoparticles, redox couple molecules, ions, have not had enough time to diffuse and thus their concentration is still homogeneous throughout the cell. The latter is reached much later in time, when the thermodiffusion of all species has attained the Soret equilibrium, characterised by the cancelling of all particles' fluxes. The resulting Seebeck coefficient thus evolves over time from its initial value (Seini) to the steady one (Sest). The detailed derivation of the Se dependence on different physical parameters such as the NP concentration and applied magnetic field is found in ref. 25. Here we present the salient features leading to the final expressions of the field dependence of Seini and Sest.2.1 Initial state
The initial state Seebeck coefficient of a thermocell (Fig. 1 left panel) measured between two electrodes is expressed as:18,19 | (1) |
ΔV and ΔT = Th − Tc are the thermoelectric potential and temperature differences between the hot and cold electrodes, and e is the elementary charge. The thermogalvanic term Δsrc originates from the temperature dependent reaction entropy of the (reversible) redox couple at the electrode surfaces, which is expressed by the Nernst equation,
 | (2) |
 is the standard reaction entropy of the redox couple, kB is the Boltzmann constant and a = γ·n is the ‘activity’ defined as the product of the molar concentration n of the reducing (oxidising) species and its activity coefficient γ. The latter depends on the ionic strength of the surrounding solution.26 The superscripts box and bred are defined by the redox chemical equation, such that
| box·Ox + e− + bred·Red = 0 | (3) |
In a closed-circuit operation mode, the magneto hydrodynamic effect is known to influence the electrical current of a electrochemical cell at very high magnetic fields (parallel or perpendicular to the electrode surface).27,28 However, to the best of our knowledge, no significant effect on the open-circuit thermogalvanic potential of a thermocell for a moderate magnetic field (below 800 kA m−1 or 1 T) has been demonstrated.29
The second term in eqn (1) is related to the thermodiffusion in the bulk solution, summed over all charged species. Ŝi is the Eastman entropy of transfer of the ith species (ions or nanoparticles). ξi is the dynamical effective charge defined by:
 | (4) |
 | (5) |
![[H with combining right harpoon above (vector)]](https://www.rsc.org/images/entities/i_char_0048_20d1.gif) .
.
When the interparticle repulsion is strong, as is the case in the ionically stabilized ferrofluids studied here, the ϕ dependence of the above listed parameters can be described well in terms of the isothermal osmotic compressibility χ (ϕeff) within the Carnahan–Starling hard-sphere model:31
 | (6) |
The magnetic field dependence of ŜNP, ξNP and DNP, on the other hand, is much less established. Here we use a mean-field model as commonly done in ferrofluids,32 where we consider that the nanoparticles are submitted to an effective field ![[H with combining right harpoon above (vector)]](https://www.rsc.org/images/entities/i_char_0048_20d1.gif) e:
e:
![[H with combining right harpoon above (vector)]](https://www.rsc.org/images/entities/i_char_0048_20d1.gif) e = e = ![[H with combining right harpoon above (vector)]](https://www.rsc.org/images/entities/i_char_0048_20d1.gif) + λ + λ![[M with combining right harpoon above (vector)]](https://www.rsc.org/images/entities/i_char_004d_20d1.gif) | (7) |
![[H with combining right harpoon above (vector)]](https://www.rsc.org/images/entities/i_char_0048_20d1.gif) is the macroscopic magnetic field,
is the macroscopic magnetic field, ![[M with combining right harpoon above (vector)]](https://www.rsc.org/images/entities/i_char_004d_20d1.gif) is the local magnetisation of the bulk fluid and λ is a dimensionless constant which is null for non-magnetic particles and equals to 0.33 for a uniformly magnetised medium (classical Lorentz result).33 For aqueous ferrofluids, λ = 0.22 has been determined both experimentally34–37 and numerically.38,39 Magnetisation of a ferrofluid composed of n non-interacting NPs with
is the local magnetisation of the bulk fluid and λ is a dimensionless constant which is null for non-magnetic particles and equals to 0.33 for a uniformly magnetised medium (classical Lorentz result).33 For aqueous ferrofluids, λ = 0.22 has been determined both experimentally34–37 and numerically.38,39 Magnetisation of a ferrofluid composed of n non-interacting NPs with ![[m with combining right harpoon above (vector)]](https://www.rsc.org/images/entities/i_char_006d_20d1.gif) individual magnetic moment is given by33
individual magnetic moment is given by33 where
where  the classic Langevin function and x0 = (μ0mH)/(kBT) the Langevin parameter where μ0 is the vacuum permeability and kB is the Boltzmann constant. In the framework of an effective field model, the Langevin parameter of an interacting NP system can be replaced by the effective Langevin parameter xe,
 | (8) |
 | (9) |
One can then obtain the analytical expressions of ŜNP, ξNP and DNP as a function of ϕ, ϕeff and H as follows.25
 | (10) |
 | (11) |
 | (12) |
In limH,ϕ→0, ŜNP, ξNP and DNP become Ŝ0NP, ξ0NP and D0NP, respectively, and  for
for  and
and  reaches 1 for
  takes into account the friction between the nanoparticles and the surrounding liquid. ζ0 = 6πη0RH is the friction at ϕ = 0, with η0 being the viscosity of the solvent and RH the hydrodynamic radius of the nanoparticles. The parameters αλ, βλ, S1 and S2 are defined as:
 | (13) |
 | (14) |
 | (15) |
 | (16) |
All these parameters tend to zero for H = 0, or for kBT ≫ (μ0mHe) (i.e. xe → 0).
Noting that the ionic conductivity of the NPs and the ions is independent of the magnetic field up to the first order, the field dependent variation of Seini, ΔSeini(ϕ, H) = Seini(ϕ, H) − Seini(ϕ, 0), is given in ref. 25 as
 | (17) |
It needs to be mentioned that the term S1 − S2 in eqn (17) is always positive and therefore the sign of Seini under a homogeneous magnetic field is determined solely by the sign of zNP.
2.2 Soret equilibrium
The Soret equilibrium is reached once the thermodiffusive motions of all particles are completed inside the thermocell. At this stage we must distinguish two different types of Seebeck coefficients. The first one, SeEq, is determined from the thermoelectric voltage measured between the hot and cold electrodes (ΔVEq):40 | (18) |
It is summed over all species participating in the redox reaction (charged and neutral) and bj is defined by eqn (3). It should be noted that SeEq only depends (directly) on the redox couple due to the rearrangement of the charged species in the solution which screens the electrodes from the internal electric field of the solution.25,41 The latter, however, can asymmetrically modify the ionic strength near the cold and hot electrodes and thus affect SeEq indirectly through the thermogalvanic term, Δsrc (i.e., eqn (2)).
The second Seebeck coefficient, SeEq*, is due to the internal thermoelectric field created within the bulk solution and away from the electrodes. While this value cannot be directly measured, it can be inferred from the Soret coefficient, ST. At the Soret equilibrium, the distribution gradient of nanoparticles  , ST and SeEq* are related to one another (up to the first-order) as:42–44
 | (19) |
It can be shown from the particle flux equation that25
 | (20) |
3 Experimental
3.1 DMSO-based ferrofluids
The ferrofluid (FF) samples used in this study are composed of maghemite (γ-Fe2O3) nanoparticles dispersed in an acidic solution of DMSO (dimethyl sulfoxide), similar to those used in ref. 19. The nanoparticles were first synthesised in water using the well-known Massart technique,45 then transferred into DMSO.30 The NP mean diameter is 6.7 nm with a log-normal polydispersity of 0.38. These NPs are H+-coated (with perchlorate counter-ions, 24 mM free ClO4−) and thus positively charged. Under such ionic strength conditions, the interparticle interaction balance is repulsive (see ref. 44), and the second coefficient A2 of the virial development of the osmotic pressure becomes positive. Here, A2 = 12 and thus ϕeff = 3ϕ, as attested by the diffusion coefficient measurements as a function of ϕ at H = 0 in Fig. 3(a). These ferrofluids possess high ST values, e.g., 1.1 K−1, at an NP volume fraction (ϕ) of 0.25%. For the Seebeck coefficient measurements, a redox couple composed of ferrocene (Fc) (Aldrich, 98% pure) and ferrocenium (Fc+) (FcBF4 salt from Aldrich, technical grade) was added to the solution at 3 mM each. The NPs' effective dynamic charge ξNPe ≈ 30 was determined by electrophoretic measurements, and is in close agreement with the value of 25 reported in similar DMSO-based ferrofluids.193.2 Thermodiffusion measurements
The Soret and the NP diffusion coefficients were determined using the Forced Rayleigh Scattering (FRS) technique46 with a pump-beam from a high power Hg arc lamp (modulated at 100 Hz). The incident beam travels through a grid and is focused by a camera lens on the ferrofluid sample surface contained in an optical cell with a thickness of α = 100 μm and a height of several mm. This imprints an optical grating image in the thermalized sample with a periodicity of Λ = 90 μm. Owing to the optical absorption by the NPs, a thermal grating with the same spatial modulation is then produced inside the fluid. This, in turn, induces the migration of NPs due to the Soret effect, resulting in a concentration grating of NPs. The migration can either be towards the hot regions or the cold regions, depending on the colloidal characteristics of the system. Here, the NPs migrate towards the cold region. Both the thermal and the concentration gratings are detected by the diffraction of a weakly absorbing test laser beam (He–Ne). The first order diffraction pattern formation of the test beam and its progressive destruction by NP diffusion when the pump beam is shut down are recorded. As the scales of the temporal evolution of temperature and of the NP concentration are different by several orders of magnitude they can be decoupled. This allows the determination of the Soret coefficient ST in the steady-state condition and the mass diffusion coefficient Dm of the NPs.46 These coefficients are measured as a function of NPs' volume fraction ϕ between 0.25 and 4%, while the magnetic field dependence is examined on a sample with ϕ = 3.44% only. A uniform magnetic field up to 160 kA m−1 is provided using an electromagnet with the measurement cell plane lying either parallel or perpendicular to the field direction.34 The colloidal stability of the ferrofluid (with ϕ = 3.44% and without the redox couple) has been verified by in-field optical scattering methods47 up to H = 80 kA m−1 and within the time span of the FRS experiments (of the order of one hour).3.3 Seebeck coefficient and AC conductivity measurements
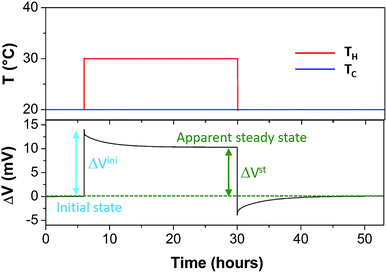
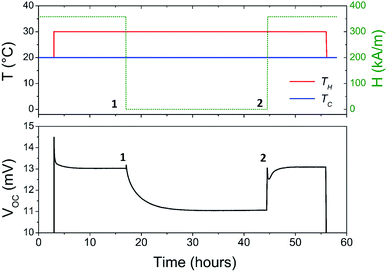
The Seebeck coefficient and the AC ionic conductivity values are studied for two NP concentrations, ϕ = 0.28 and 1%. A home-made cylindrical Teflon cell (as described in previous work18,48) was used for the Seebeck coefficient measurements. The liquid sample is contained in the cell's central cavity of 6 mm in diameter and 6 mm in height (sample volume is 0.17 cm3). The cell is sealed at the top and the bottom by 10 mm diameter platinum electrodes (AlphaAesar, 99.99% pure) squeezed tightly using 10 mm copper pieces. The electrode surface is cleaned with concentrated HCl (Sigma-Aldrich, 37 wt%) and washed by ultrasonication in deionised water. The electrode surface area in contact with the liquid is A ≈ 0.28 cm2. The Seebeck coefficient is determined from the open-circuit voltage ΔV (as shown in Fig. 1) between the top and bottom electrodes measured while the thermocell is heated from the top, which limits the natural convection of the ferrofluid. ΔV is measured using a high impedance electrometer (Keithley 6514) and the Seebeck coefficient is calculated via Se = −ΔV/ΔT. The experiments are carried out between 20 and 50 °C with a ΔT of 10 or 30 K. The temperature inside the cell is stabilised within a few minutes after the gradient has been imposed at which point the initial ΔVini is recorded. The apparent steady state potential ΔVst is reached after several hours (see Fig. 2). Note that we differentiate this apparent steady state Seebeck coefficient Sest from Seeq (corresponding to that of Soret equilibrium state) introduced earlier for reasons that will be made clear in the Results and discussion section below.A horizontal, homogeneous magnetic field, i.e., perpendicular to the thermal gradient, between 0 and 400 kA m−1 is applied to the thermocell using an electromagnet (Bouhnik). The perpendicular field direction is chosen following the Soret coefficient measurements where a marked increase in ST is usually detected under a perpendicular magnetic field24 (see the Results and discussion section for more details). Each temperature step lasts between 8 and 24 hours to fully reach the apparent steady state, depending on the H strength. Both Seini and Sest are measured as a function of the magnetic field applied. The measurements are reproducible over several weeks with a low data dispersion.
The AC ionic conductivity measurements are also performed in the same thermocell using a precision LCR meter (HP 4284A) at 20 kHz, at which the out-of-phase component of the impedance becomes null. The total conductivity of the solution at 25 °C is determined to be σtot = 65 mS m−1 independent of the NP concentration (i.e., the ionic conductivity is dominated by the small counterions whose concentration was kept constant for all ferrofluids examined).
4 Results and discussion
4.1 Thermodiffusion and Soret coefficient
The NPs' diffusion coefficient DNP and the Soret coefficient ST measured as a function of ϕ in the absence of an applied magnetic field are shown in Fig. 3(a) and (b). The diffusion coefficient at the infinite dilution limit D0NP = DNP(ϕ → 0) and the effective volume fraction ϕeff values are determined to be 8.6 × 10⁻¹² ± 0.3 × 10⁻¹² m2 s−1 and 3ϕ. By fitting eqn (20) and (19) to ST(ϕ) ‡ (Fig. 3(b)) with the dynamical effective charge number ξ0NP = 30, the NP's Eastman entropy of transfer at the infinite dilution limit is determined as Ŝ0NP/kT = 1.9 K−1.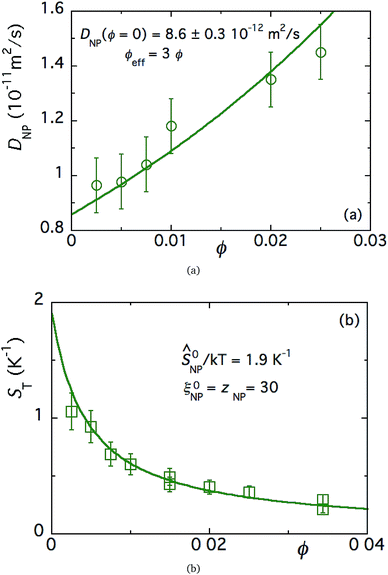 | ||
| Fig. 3 (a) Diffusion coefficient as a function of NP concentration ϕ of FF-DMSO, measured at room temperature in the absence of a redox couple. The solid line is a fit to eqn (12) as a function of ϕ, without a magnetic field. (b) Soret coefficient measured via the FRS technique as a function of NP concentration (ϕ), measured at room temperature in the absence of a redox couple. The solid line is a fit to eqn (19) as a function of ϕ, without a magnetic field. | ||
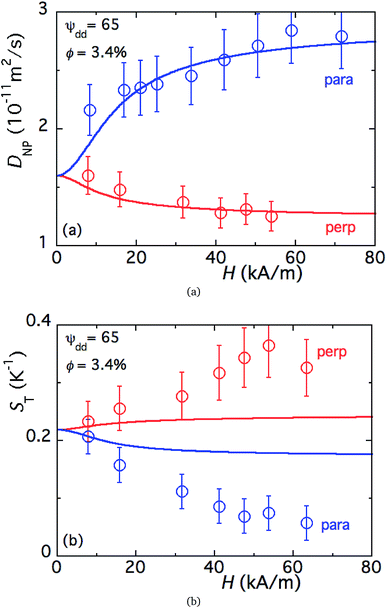 | ||
| Fig. 4 (a) Mass diffusion coefficient of FF-DMSO with an NP concentration of 3.4% as a function of the magnetic field applied perpendicular (blue) and parallel to the temperature gradient. No redox couple added. The solid lines are fits to eqn (12) as a function of the magnetic field. (b) Soret coefficient as a function of the magnetic field applied perpendicular (blue) and parallel (red) to the temperature gradient in FF-DMSO. The NP volume fraction is 3.4% with 29 mM ClO4−, without a redox couple. The solid lines are fits to eqn (19) as a function of the magnetic field. | ||
As expected, ST(H) was found to decrease from its zero-field value (in Fig. 4(b)) when a magnetic field is applied in the direction parallel to the temperature gradient (as much as 70% at 60 kA m−1). Under the perpendicular configuration, on the other hand, ST(H) increases by 60% with respect to the zero-field value at 60 kA m−1. While the anisotropic dependency of the ST response to applied magnetic fields is in agreement with previous reports,24 its magnitude is much larger than the theoretical prediction in both field directions¶ (as depicted by solid lines in Fig. 4(b)). The large changes observed here are due to the combined effect of the uniform magnetic field and the presence of magnetoconvection. Indeed, our experimental condition α/Λ = 1.1 is within the regime where microconvective instability occurs, driven by the internal demagnetising field (due to the local inhomogeneity in the NP concentration distribution).50,51
4.2 Seebeck coefficient
In the absence of magnetic nanoparticles, Seini is found negative as was previously reported by Tsierkezos in a large range of non-aqueous solvents.52 In order to verify possible dependence of our experimental components on applied magnetic fields (the thermometer readings, the electronic circuitry, the redox couple potential, etc.), both Seini and Sest were measured in a reference DMSO solution without magnetic nanoparticles at two different values of H. The results show that up to 360 kA m−1, a homogeneous perpendicular magnetic field has no discernible effect on both Seebeck coefficients (data not shown). Therefore, the subsequent magnetic field induced changes in the Seebeck coefficients (initial- and steady-state) presented in this study can be safely attributed to the presence of magnetic nanoparticles in the ferrofluids.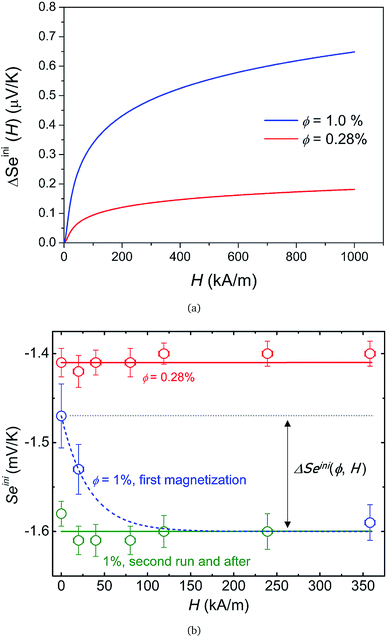 | ||
Fig. 5 (a) Theoretical prediction of initial state Seebeck coefficients as a function of a perpendicularly applied magnetic field Seini(ϕ, H) − Seini(ϕ, 0) for ϕ = 0.28% and ϕ = 1% according to eqn (17) with experimentally determined D0NP, ξ0NP, Ŝ0NP and Ψdd. (b) Experimentally measured Seini(H) for ferrofluids with ϕ = 0.28 and 1%. The error bars correspond to twice the standard error (95% confidence interval). The red and green solid lines are fits to eqn (1) (i.e.eqn (17) + Seini(0)) for ϕ = 0.28% and ϕ = 1% (see Fig. 5(a)). The dashed blue line is a guide to the eye based on an exponential fit, i.e.,  . The field induced change in the initial Seebeck coefficient, ΔSeini(ϕ, H), is indicated with a double-headed arrow. . The field induced change in the initial Seebeck coefficient, ΔSeini(ϕ, H), is indicated with a double-headed arrow. | ||
Much to our surprise, the experimentally measured field dependence of initial Seebeck coefficients (with ΔT = 10 K and the thermocell mean temperature T = 25 °C) shows a very different behavior from the theoretical prediction (see Fig. 5(b)). As can be seen from the graph, Seini (ϕ = 0.28%, H) shows only a minor decrease in its absolute value (red symbols), and thus is consistent with the theoretical expectation.|| The absolute value of Seini (ϕ = 1%, H) during the first magnetisation (blue symbols), on the other hand, increases by roughly 10% at 360 kA m−1. This variation of the order of 150 μV K−1 is three orders of magnitude larger than the theoretical one (0.1 μV K−1) and carries the wrong sign (Fig. 5).
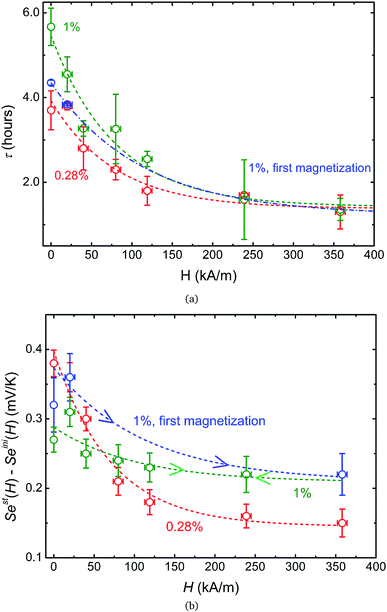
Furthermore, irreversibility is observed in Seini(H) between the first magnetisation and the subsequent measurements (Fig. 5(b), blue and green curves). As can be seen from the graph, once the highest magnetic field was reached for the first time, Seini becomes nearly independent of H strength (compatible with the theoretical model). The observed hysteresis suggests that certain irreversible process(es) has taken place during the first magnetisation of the ferrofluid at ϕ = 1%. As we will see in more detail below, this phenomenon is accompanied by an increase in the characteristic time to reach an apparent steady state, from ∼4.2 hours during the first magnetisation to ∼5.6 hours for all subsequent measurements (see Fig. 7(a)). Such slowing-down of the NP motion can be explained by the formation of particle aggregates under a strong magnetic field.
To verify this hypothesis, we have post-examined the ferrofluid samples after the in-field Seebeck coefficient measurements via magnetisation and diffusion light scattering (DLS, Vasco de Cordouan Technologies) measurements to search for possible aggregations. The superparamagnetic blocking temperature values TB determined from the magnetisation measurements (CRYOGENIC SQUID magnetometer, model S700 was used) are ≈60 K for the ϕ = 0.28% sample and ≈90 K for the ϕ = 1% sample. Knowing that TB increases approximately linearly with the mean NP volume,53 this indicates a ∼50% mean volume increase in the more concentrated sample.** The DLS measurements lead to a similar conclusion, with an ∼80% increase in the NPs' hydrodynamic diameter, i.e., an ∼600% increase in the hydrodynamic volume. These two independent measurements confirm that an irreversible nanoparticle aggregation had taken place in the ϕ = 1% sample during the first magnetisation of the Seebeck coefficient measurements. The absence of aggregation in the ϕ = 0.28% sample can be explained by a greater interparticle distance between NPs. As stated earlier, however, such an aggregation phenomenon was not observed during the in-field FRS measurements performed up to 80 kA m−1 even though a higher NP concentration (ϕ = 3.44%) was used. The two most significant differences between the two experiments are (i) the absence (presence) of redox couple agents and (ii) the total time duration for which the ferrofluid sample is exposed to the external magnetic field, i.e., one (several) hour in the thermodiffusion (thermoelectric) measurements, respectively. Thus, it is likely that the modification of inter-particle electrostatic force due to the presence of redox couple molecules and the longer experimental time-scale both contribute to the formation of NP aggregates.
It should also be noted that |Seini| increases by approximately 10% after the formation of particle aggregates (Fig. 5(b), green curve). These aggregates appear to be stable, i.e., the in-field Seebeck measurements are reproducible after the first magnetisation. The physical and/or chemical origins behind this phenomenon are far from trivial. However, within the framework of existing theories, possible explanations include an increase in the Eastman entropy of transfer of the dispersed objects and the simultaneous reduction of n (NP number) at a constant ϕ, both due to the aggregation. The latter can also indirectly influence the thermogalvanic term in eqn (1)via reshaping the ionic environment surrounding the redox couple molecules leading to modifications in the standard reaction entropies of redox reactions at the electrodes.54
In a zero-field, the apparent steady state is reached in τ less than 6 hours for all samples. However, the characteristic times τEq to reach the Soret equilibrium can be estimated via τEq = l2/(π2DNP2) (where l = 6 mm is the diffusion length, i.e., the distance between the two electrodes, and D ≈ 1.2 × 10⁻¹¹ m2 s−1 at ϕ = 1%, see Fig. 3(a)). This gives τEq ≈ 84 and ≈100 hours for ϕ = 1 and 0.28%, respectively, more than one order of magnitude larger than the experimentally determined τ values. Such a large discrepancy suggests that the observed apparent steady state is established due to a physical phenomenon different from the Soret equilibrium. A similar observation has already been made recently in aqueous ferrofluids.18 It was suggested that the apparent steady state stems from a temperature dependent NP adsorption and/or ordering phenomenon occurring at the electrode–fluid interfaces, which stabilizes much quicker than the Soret equilibrium. The NP adsorption has indeed been observed on mercury,55 gold56 and platinum57 electrodes in aqueous ferrofluids, and the ordering phenomenon has been reported on SiO2 surfaces.58 The electrostatic interactions (between the surface, the particles and the counter-ions) and inter-particle magnetic interactions (at high MNP concentrations) as well as the surface geometry (undulations and channels59) are known to contribute to such phenomena, creating a surface-stabilized layer of NPs with much higher concentration of NPs than that of the bulk ferrofluid. Increased concentration of charged NPs can then modify the local ionic strength at the electrode–fluid interface, and therefore the redox reaction entropy term in both Seini and Sest (eqn (1) and (18)).
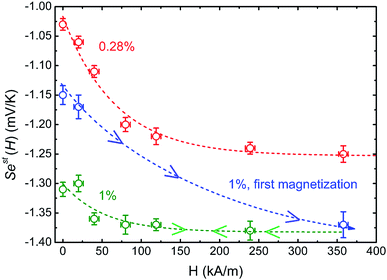
Under an applied magnetic field, marked reductions in both τ(H) and Sest(H) − Seini(H), by a factor of 2 to 4, are observed between 0 and 360 kA m−1 (as presented in Fig. 7(a) and (b), respectively) as if the presence of the magnetic field attenuates the NP adsorption and/or layering on the electrode surface. Insight into the NP adsorption/layering phenomenon can be gained from the Molecular Dynamics simulation by Jordanovic and Klapp60 where they have shown that the application of a magnetic field in the direction parallel to the ferrofluid–substrate interface can destroy NP layers. When a sufficiently high magnetic field is applied, the magnetic nanoparticles tend to align themselves along the external field (chain formation) due to their superparamagnetic nature. This leads to repulsive dipolar interactions between neighboring chains in the direction perpendicular to the electrode surface†† and thus limits the number of adsorbed NPs. Although the numerical simulations cited60 were performed for ferrofluids with high NP concentration values (ϕ = 20% and higher) and with a non-conducting substrate, the surface-initiated layering of dipolar particles and their field dependence are considered to be generic features of confined dipolar liquids. Consequently, the NP distribution near the electrode surface at the apparent steady state under a magnetic field remains closer to that of the initial state than that of the zero-field. Consequently, the redox reaction entropy contribution to the Seebeck coefficient also remains similar between the two states as depicted in Fig. 7(b). The effect of the magnetic field on the Seebeck voltage and its time evolution are clearly visible in Fig. 8. When the magnetic field of 350 kA m−1 is turned off after the thermocell has reached its apparent steady state (point 1, dotted green curve), the Seebeck voltage decreases as more NPs adsorb with a characteristic time τ ∼ 4 hours. The latter corresponds to the time constant recorded at 0 kA m−1. When H = 360 kA m−1 is applied again, the Seebeck voltage increases back quickly, presumably due to the quick ejection of NPs.
5 Conclusion
The Seebeck coefficient of DMSO-based dilute ferrofluids was examined under the influence of an external magnetic field. The magnetic field was applied perpendicularly to the temperature gradient, the configuration under which a marked increase in Soret coefficients was observed. The Seebeck coefficient was found to increase by as much as 25% with a moderate magnetic field strength of 100 kA m−1; however, the subsequent analysis showed that the observed phenomena cannot be explained by the existing theoretical model which takes into account the local magnetic field gradient induced by the magneto-thermodiffusion of nanoparticles. Plausible physical and physico-chemical origins leading to the enhancements of the fluids' Seebeck coefficient include the temperature and magnetic field-dependent auto-organisation of NPs at the electrode surface and its ramification on the thermogalvanic potential of redox couples.To the best of our knowledge, this work presents the first evidence of thermopower enhancement induced by the application of a magnetic field. Only a moderate magnetic field strength of about 100 kA m−1 (less than 0.2 T) is needed to increase the Seebeck coefficient, easily attainable with a strong permanent magnet. The enhancement effect is more pronounced at lower nanoparticle concentration (0.28%), while at a higher concentration (1%) the use of a high magnetic field led to an irreversible aggregation of nanoparticles. Thus, dilute ferrofluids made with more conducting electrolytes such as ionic liquids should be considered for the next step toward the application of ferrofluids in magneto-thermoelectric technology.
Conflicts of interest
There are no conflicts to declare.Acknowledgements
This work received financial support from ANR TEFLIC (Grant No. ANR-12-PRGE-0011-01), LABEX-PALM (Grant No. ANR-10-LABX-0039-PALM), Program CAPES-COFECUB no. 714/11 (France-Brazil) and the European Union's Horizon 2020 research and innovation programme under grant agreement no. 731976 (MAGENTA).References
- M. H. Elsheikh, D. A. Shnawah, M. F. M. Sabri, S. B. M. Said, M. H. Hassan, M. B. A. Bashir and M. Mohamad, Renewable Sustainable Energy Rev., 2014, 30, 337–355 CrossRef
.
- M. W. Gaultois, T. D. Sparks, C. K. H. Borg, R. Seshadri, W. D. Bonificio and D. R. Clarke, Chem. Mater., 2013, 25, 2911–2920 CrossRef CAS
.
- E. Vanecht, K. Binnemans, S. Patskovsky, M. Meunier, J. W. Seo, L. Stappers and J. Fransaer, Phys. Chem. Chem. Phys., 2012, 14, 5662–5671 RSC
.
- S. Choi, ASME Fluids Eng. Div., 1995, 231, 99 CAS
.
- J. Eastman, S. R. Phillpot, S. U. S. Choi and P. Keblinski, Annu. Rev. Mater. Res., 2004, 34, 219–246 CrossRef CAS
.
- T. Ambreen and M.-H. Kim, Renewable Sustainable Energy Rev., 2018, 91, 564–583 CrossRef CAS
.
- M. J. Assael, K. D. Antoniadis, W. A. Wakeham and X. Zhang, Int. J. Heat Mass Transfer, 2019, 138, 597–607 CrossRef CAS
.
- D. Kumar, D. Valan and A. Amirtham, Renewable Sustainable Energy Rev., 2016, 60, 21–40 CrossRef
.
- C.-C. Lai, W.-C. Chang, W.-L. Hu, Z. M. Wang, M.-C. Lu and Y.-L. Chueh, Nanoscale, 2014, 6, 4555 RSC
.
- O. Mahian, A. Kianifar, S. A. Kalogirou, I. Pop and S. Wongwises, Int. J. Heat Mass Transfer, 2013, 57, 582 CrossRef CAS
.
- A. Kasaeian, A. T. Eshghi and M. Sameti, Renewable Sustainable Energy Rev., 2015, 43, 584–598 CrossRef CAS
.
- A. Würger, Rep. Prog. Phys., 2010, 73, 126601 CrossRef
.
- I. P. J. Burelbach, D. Frenkel and E. Elser, Eur. Phys. J. E, 2018, 41, 7 CrossRef PubMed
.
- S. Di Lecce and F. Bresme, J. Phys. Chem. B, 2018, 122, 1662–1668 CrossRef CAS PubMed
.
- R. F. Stout and A. S. Khair, Phys. Rev. E, 2017, 96, 022604 CrossRef PubMed
.
- S. Duhr and D. Braun, Proc. Natl. Acad. Sci., 2006, 103, 19678–19682 CrossRef CAS PubMed
.
- S. A. Putnam and D. G. Cahill, Langmuir, 2005, 21, 5317–5323 CrossRef CAS PubMed
.
- T. J. Salez, B. T. Huang, M. Rietjens, M. Bonetti, C. Wiertel-Gasquet, M. Roger, C. L. Filomeno, E. Dubois, R. Perzynski and S. Nakamae, Phys. Chem. Chem. Phys., 2017, 19, 9409–9416 RSC
.
- B. T. Huang, M. Roger, M. Bonetti, T. J. Salez, C. Wiertel-Gasquet, E. Dubois, R. Cabreira Gomes, G. Demouchy, G. Mériguet, V. Peyre, M. Kouyaté, C. L. Filomeno, J. Depeyrot, F. A. Tourinho, R. Perzynski and S. Nakamae, J. Chem. Phys., 2015, 143, 054902 CrossRef CAS PubMed
.
- M. F. Dupont, D. R. MacFarlane and J. M. Pringle, Chem. Commun., 2017, 53, 6288–6302 RSC
.
- E. Blums, J. Magn. Magn. Mater., 2005, 289, 246–249 CrossRef CAS
.
- E. Blums, S. Odenbach, A. Mezulis and M. Maiorov, Phys. Fluids, 1998, 10, 2155–2163 CrossRef CAS
.
- T. Voelker and S. Odenbach, Phys. Fluids, 2005, 17, 037104 CrossRef
.
- M. Kouyaté, C. L. Filomeno, G. Demouchy, G. Mériguet, S. Nakamae, V. Peyre, M. Roger, A. Cébers, J. Depeyrot, E. Dubois and R. Perzynski, Phys. Chem. Chem. Phys., 2019, 21, 1895–1903 RSC
.
- T. J. Salez, M. Roger, R. Perzynski, A. Cebers and S. Nakamae, Entropy, 2018, 20, 405 CrossRef
.
- W. Nernst, Z. Phys. Chem., 1889, 4, 129–181 Search PubMed
.
- A. Bund, S. Koehler, H. Kuehnlein and W. Plieth, Electrochim. Acta, 2003, 49, 147–152 CrossRef CAS
.
- S. R. Ragsdale, K. M. Grant and H. S. White, J. Am. Chem. Soc., 1998, 120, 13461–13468 CrossRef CAS
.
- D. T. Kountouras, C. A. Vogiatzis, A. Tsouknidas and S. Skolianos, Corros. Eng., Sci. Technol., 2014, 49, 603–607 CrossRef CAS
.
- C. L. Filomeno, M. Kouyaté, V. Peyre, G. Demouchy, A. F. C. Campos, R. Perzynski, F. A. Tourinho and E. Dubois, J. Phys. Chem. C, 2017, 121, 5539–5550 CrossRef CAS
.
- N. F. Carnahan and K. E. Starling, J. Chem. Phys., 1969, 51, 635–636 CrossRef CAS
.
-
E. Blums, A. Cebers and M. M. Maiorov, Magnetic Fluids, Walter de Gruyter, 1997 Search PubMed
.
-
C. Kittel, Physique de l’état solide - 8eme édition, Dunod, 2007 Search PubMed
.
- J. C. Bacri, A. Cebers, A. Bourdon, G. Demouchy, B. M. Heegaard and R. Perzynski, Phys. Rev. Lett., 1995, 74, 5032–5035 CrossRef CAS PubMed
.
- F. Gazeau, E. Dubois, J.-C. Bacri, F. Boué, A. Cebers and R. Perzynski, Phys. Rev. E, 2002, 65, 031403 CrossRef CAS PubMed
.
- G. Mériguet, F. Cousin, E. Dubois, F. Boué, A. Cebers, B. Farago and R. Perzynski, J. Phys. Chem. B, 2006, 110, 4378–4386 CrossRef PubMed
.
- E. Wandersman, E. Dubois, F. Cousin, V. Dupuis, G. Mériguet, R. Perzynski and A. Cebers, Europhys. Lett., 2009, 86, 10005 CrossRef
.
- G. Mériguet, M. Jardat and P. Turq, J. Chem. Phys., 2005, 123, 144915 CrossRef PubMed
.
- G. Mériguet, E. Dubois, M. Jardat, A. Bourdon, G. Demouchy, V. Dupuis, B. Farago, R. Perzynski and P. Turq, J. Phys.: Condens. Matter, 2006, 18, S2685 CrossRef
.
- V. Zinovyeva, S. Nakamae, M. Bonetti and M. Roger, ChemElectroChem, 2014, 1, 426–430 CrossRef
.
- J. N. Agar and J. C. R. Turner, Proc. R. Soc. London, Ser. A, 1960, 255, 307–330 CrossRef
.
- A. Würger, Phys. Rev. Lett., 2008, 101, 108302 CrossRef PubMed
.
-
A. Majee, PhD thesis, Université Bordeaux I, 2012
.
- R. Cabreira Gomes, A. Ferreira da Silva, M. Kouyaté, G. Demouchy, R. Aquino, E. Dubois, S. Nakamae, J. Depeyrot, M. Roger and R. Perzynski, Phys. Chem. Chem. Phys., 2018, 20, 16402 RSC
.
- R. Massart, IEEE Trans. Magn., 1981, 17, 1247–1248 CrossRef
.
- G. Demouchy, A. Mezulis, A. Bee, D. Talbot, J. C. Bacri and A. Bourdon, J. Phys. D: Appl. Phys., 2004, 37, 1417 CrossRef CAS
.
- J. C. Bacri, R. Perzynski, D. Salin, V. Cabuil and R. Massart, J. Magn. Magn. Mater., 1990, 85, 27–32 CrossRef CAS
.
- M. Bonetti, S. Nakamae, B. T. Huang, T. J. Salez, C. Wiertel-Gasquet and M. Roger, J. Chem. Phys., 2015, 142, 244708 CrossRef PubMed
.
- M. Kouyaté, C. Filomeno, G. Demouchy, G. Mériguet, S. Nakamae, V. Peyre, M. Roger, A. Cebers, J. Depeyrot, E. Dubois and R. Perzynski, Phys. Chem. Chem. Phys., 2019, 21, 1895–1903 RSC
.
- D. Zablotsky, A. Mezulis and E. Blums, C. R. Mec., 2013, 341, 449–454 CrossRef
.
-
D. Zablotsky, PhD thesis, University of Latvia - Riga, 2012
.
- N. Tsierkezos, J. Solution Chem., 2007, 36, 289–302 CrossRef CAS
.
- D. F. J. L. Doemann and E. Tronc, Adv. Chem. Phys., 1997, XCVIII, 283–494 Search PubMed
.
- B. Huang, S. Muy, S. Feng, Y. Katayama, Y.-C. Lu, G. Cheng and Y. Shao-Horn, Phys. Chem. Chem. Phys., 2018, 20, 15680–15686 RSC
.
- E. Dubois and J. Chevalet, Langmuir, 2003, 19, 10892–10900 CrossRef CAS
.
- I. T. Lucas, E. Dubois, J. Chevalet and S. Durand-Vidal, Phys. Chem. Chem. Phys., 2008, 10, 3263–3273 RSC
.
-
T. J. Salez, PhD thesis, Université de recherche Paris Sciences et Lettres, École Normale Supérieure, 2018
.
- A. Vorobiev, J. Major, H. Dosch, G. Gordeev and D. Orlova, Phys. Rev. Lett., 2004, 93, 267203 CrossRef CAS PubMed
.
- C. Y. Matuo, A. Bourdon, A. Bee and A. M. F. Neto, Phys. Rev. E, 1997, 56, R1310–R1313 CrossRef CAS
.
- J. Jordanovic and S. H. L. Klapp, Phys. Rev. Lett., 2008, 101, 038302 CrossRef PubMed
.
Footnotes |
| † Nanofluids are defined here loosely as stable suspensions of nanoparticles (NPs) in liquid media. |
‡ Here,  is positive. It is a decreasing function of ϕ as χ(ϕeff) decreases with ϕ because the interparticle interaction is repulsive (A2 > 0). See ref. 44 and 49. is positive. It is a decreasing function of ϕ as χ(ϕeff) decreases with ϕ because the interparticle interaction is repulsive (A2 > 0). See ref. 44 and 49. |
| § For fitting methods, see Bacri et al.34–36 |
| ¶ Note that a quantitative agreement was found between the theoretical prediction of ST(H) and the experimental findings from ref. 24. |
| || These measurements have been performed several times with increasing and decreasing H and the results are reproducible. |
| ** The dipole–dipole interaction energies are negligible at such low concentrations. |
| †† The magnetic interaction is attractive for particles aligned one-behind-another; however, it is repulsive in the direction perpendicular to H, expanding the NP distribution near the electrodes. |
| This journal is © The Royal Society of Chemistry 2019 |

